Experimental Study of Artificial Ground Freezing by Natural Cold Gas Injection

Abstract
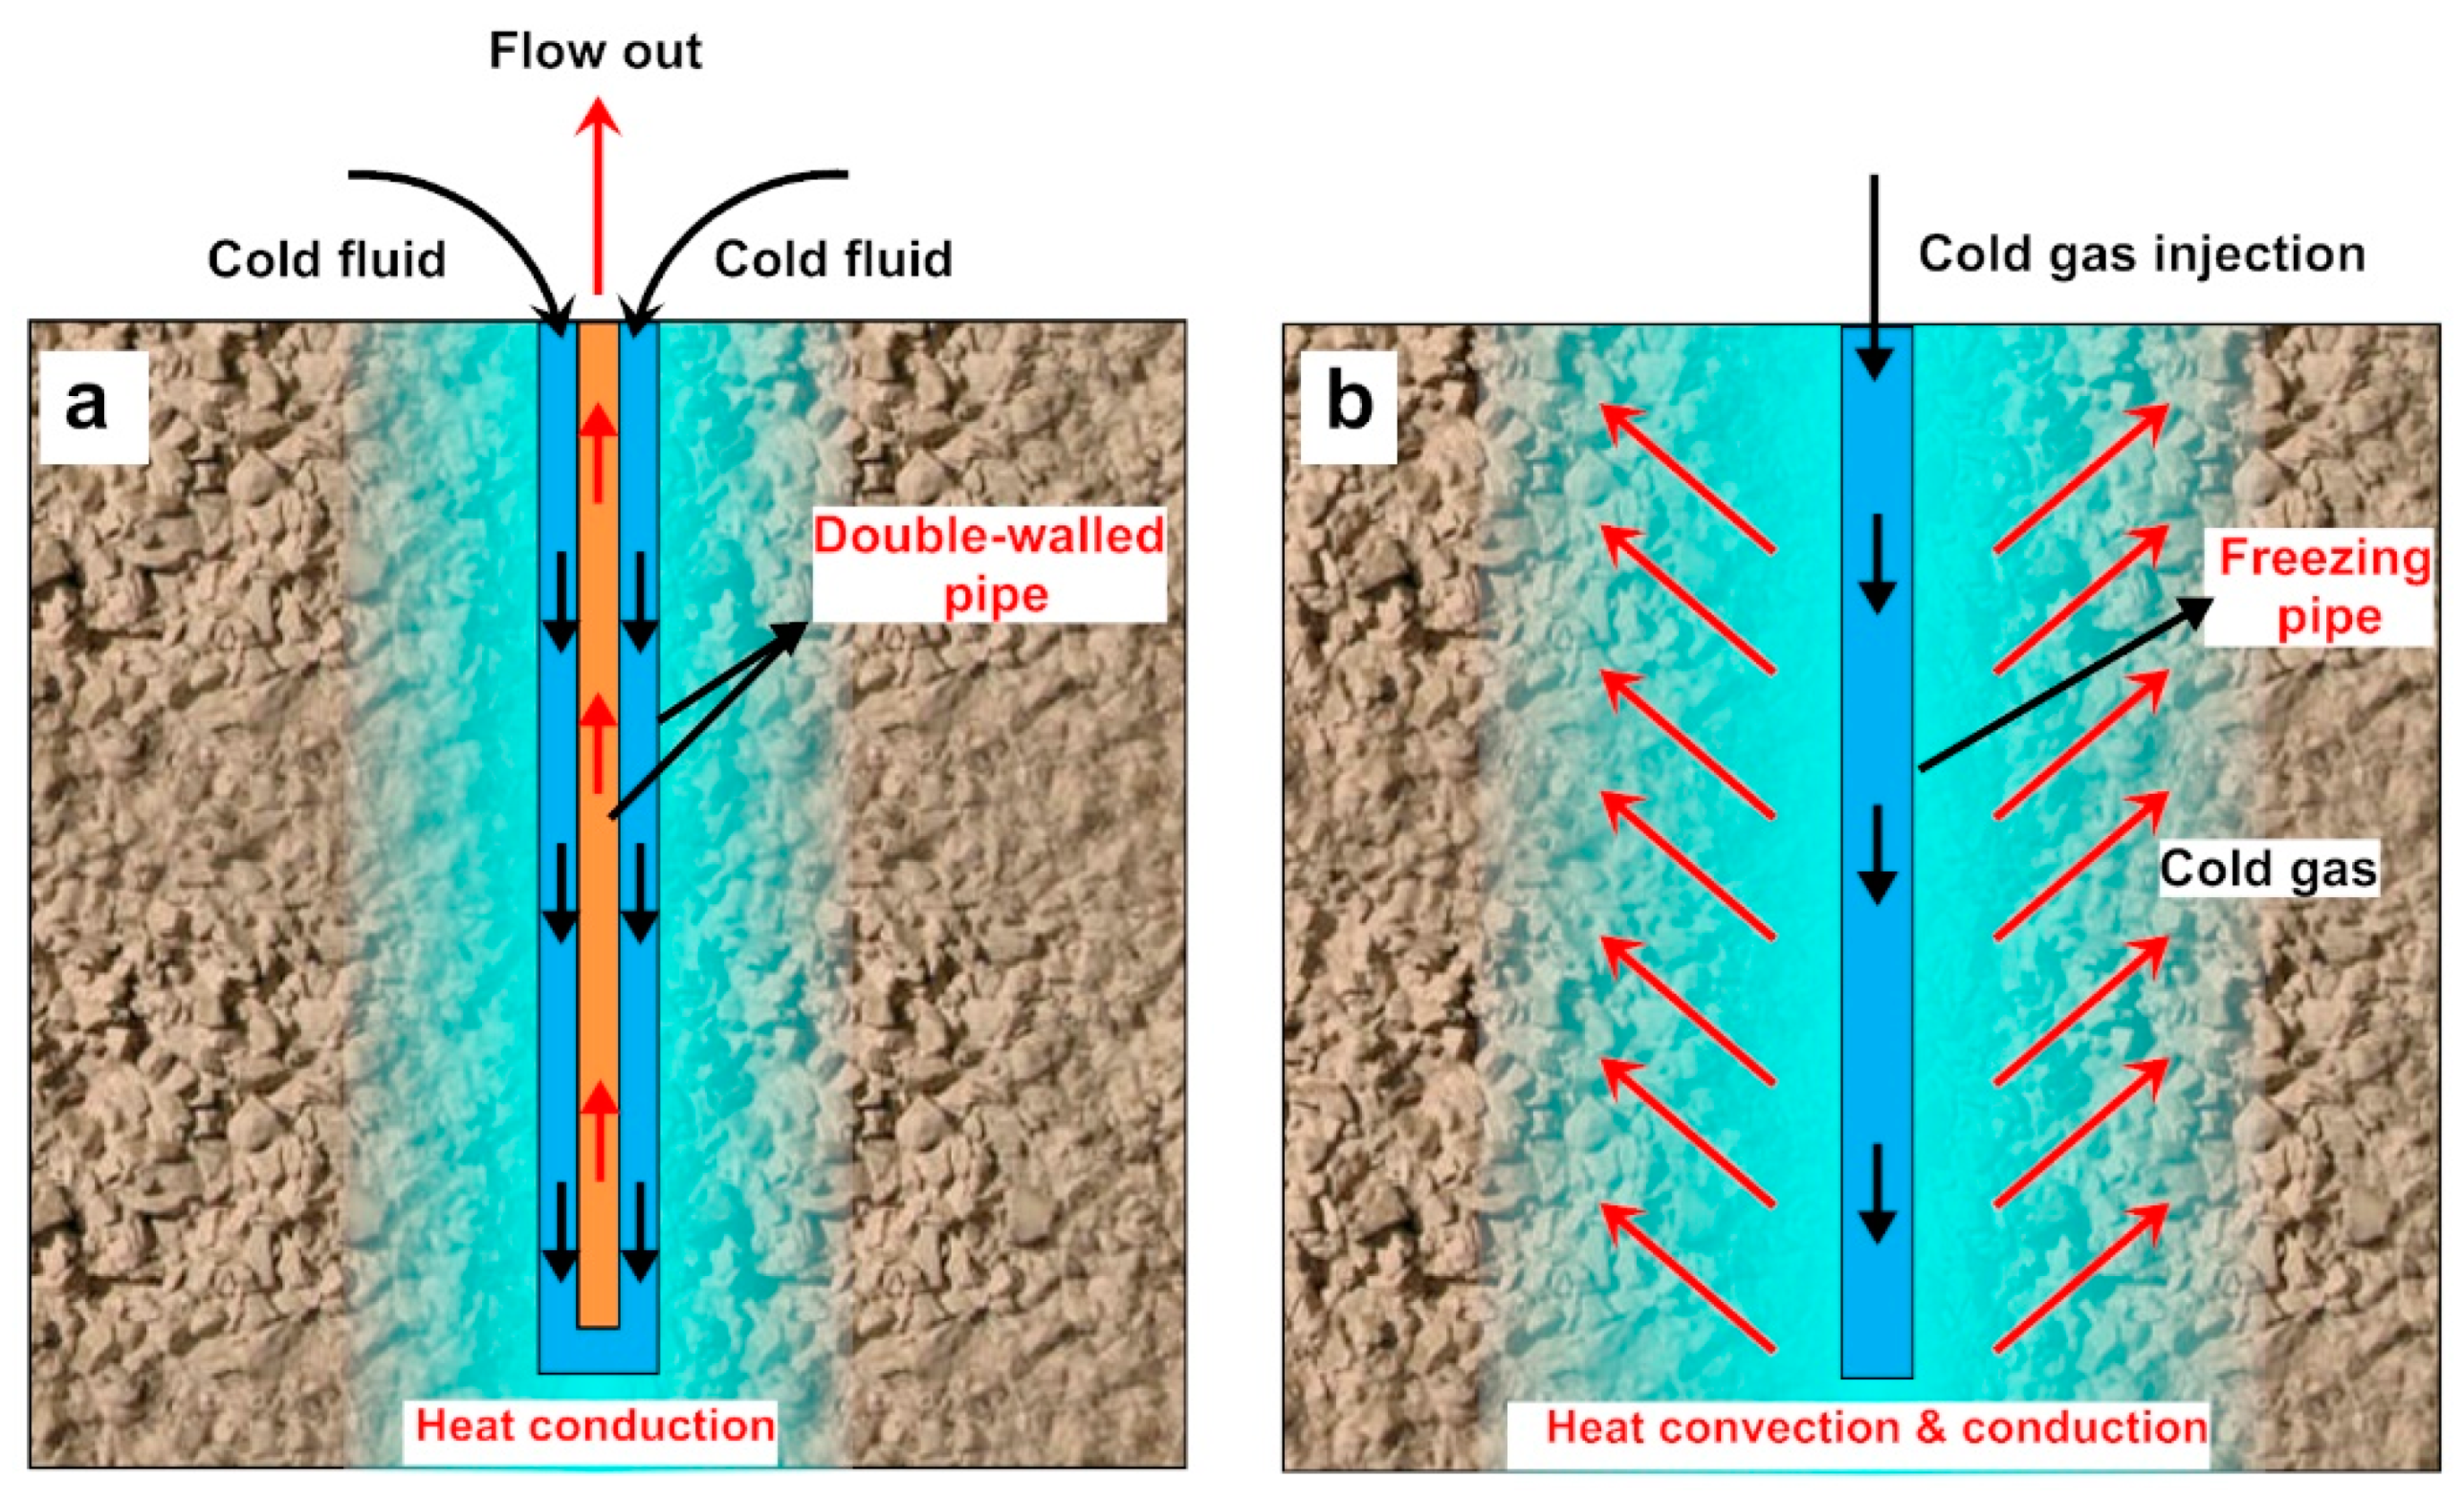
:1. Introduction
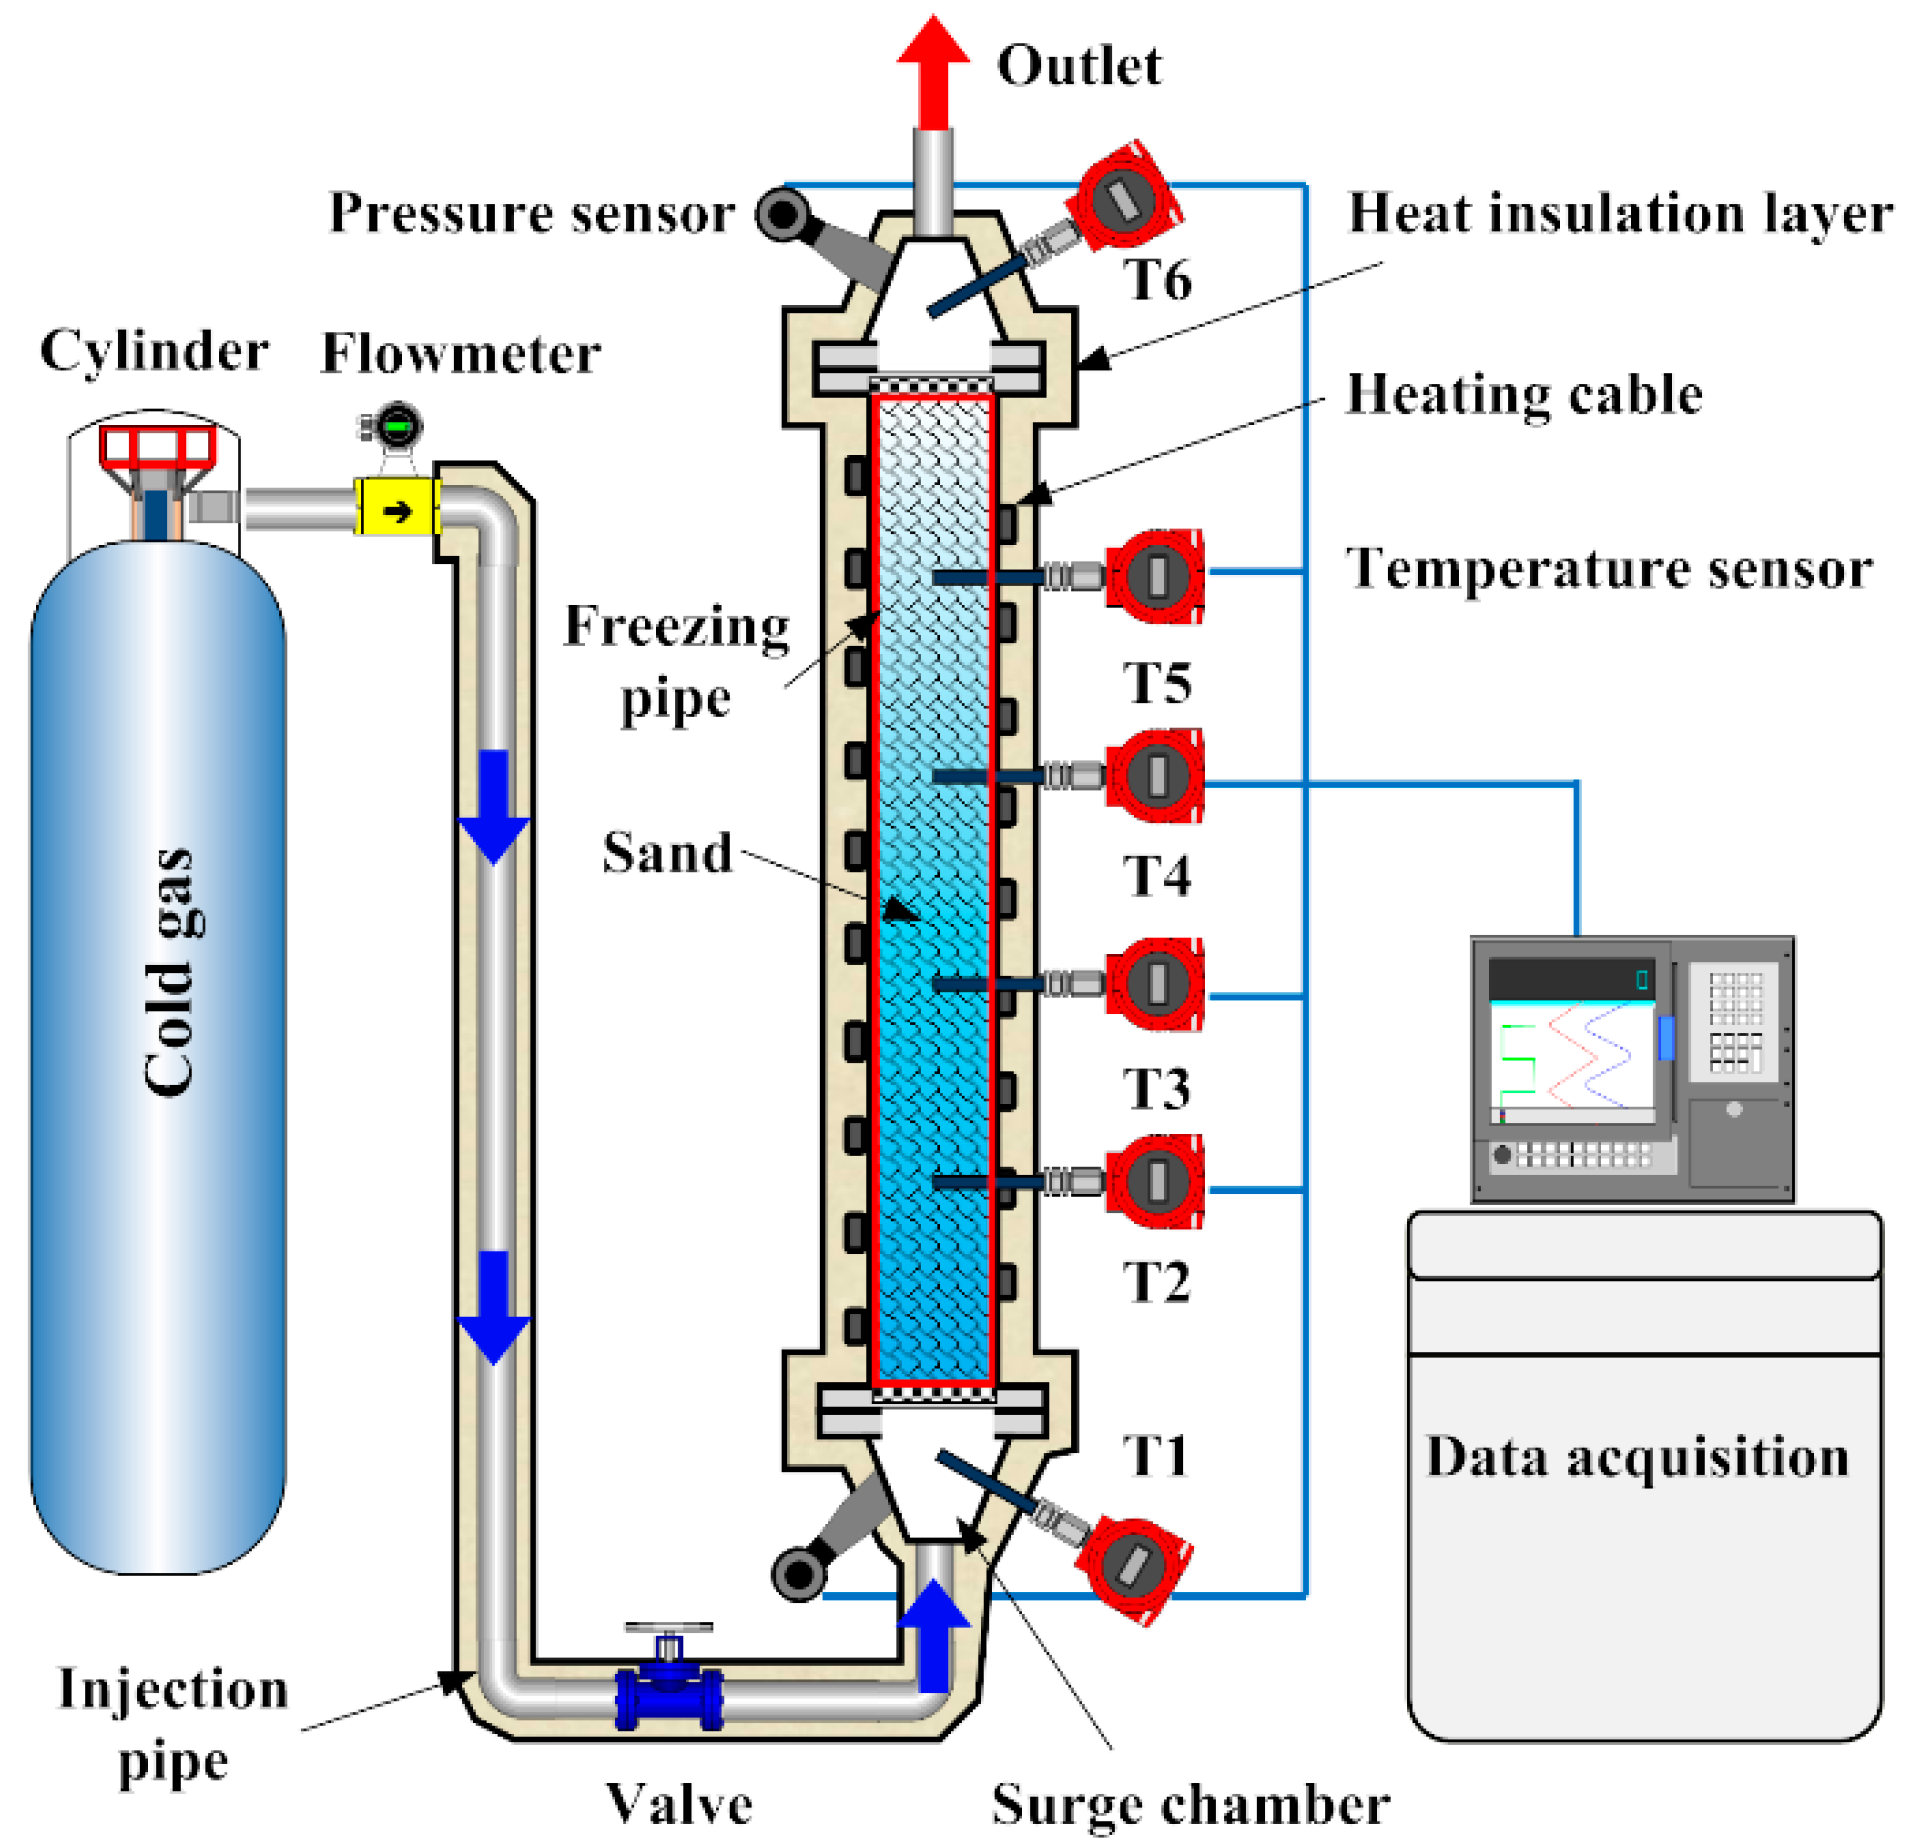
2. Experiment and Method
2.1. Experiment Setup
2.2. Freezing Experiment
3. Results
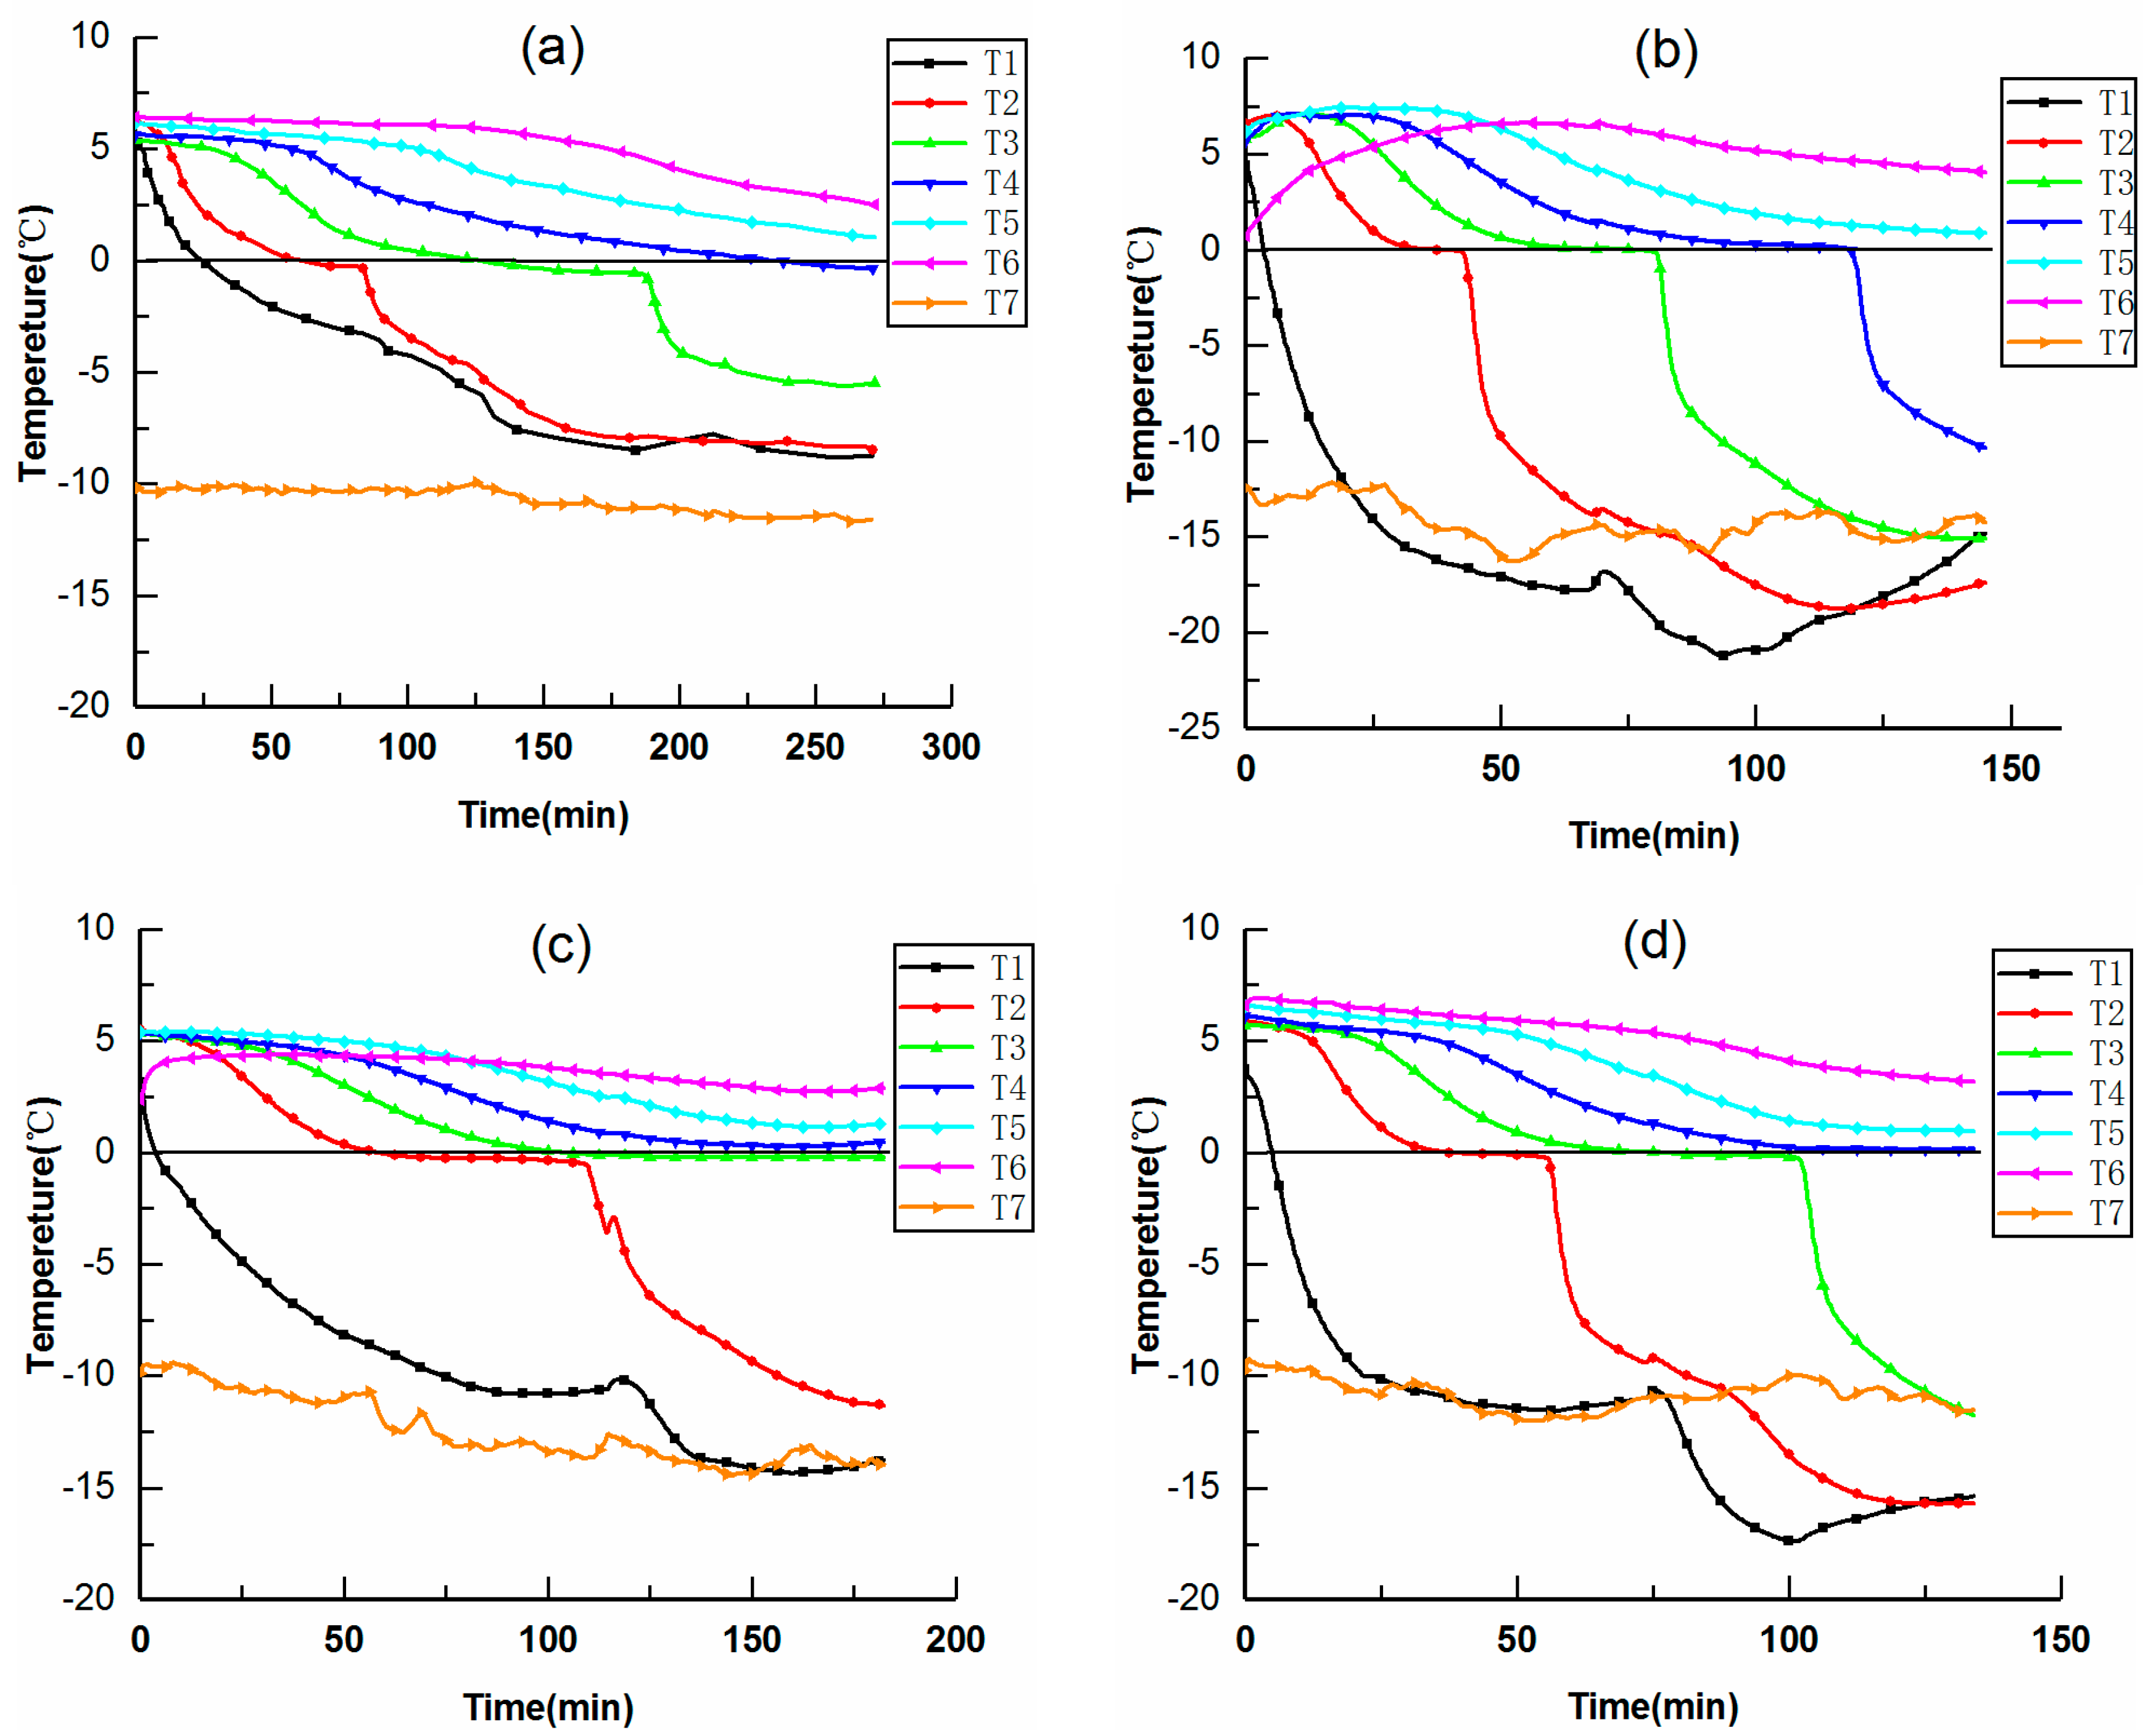
3.1. Thermal Characteristic
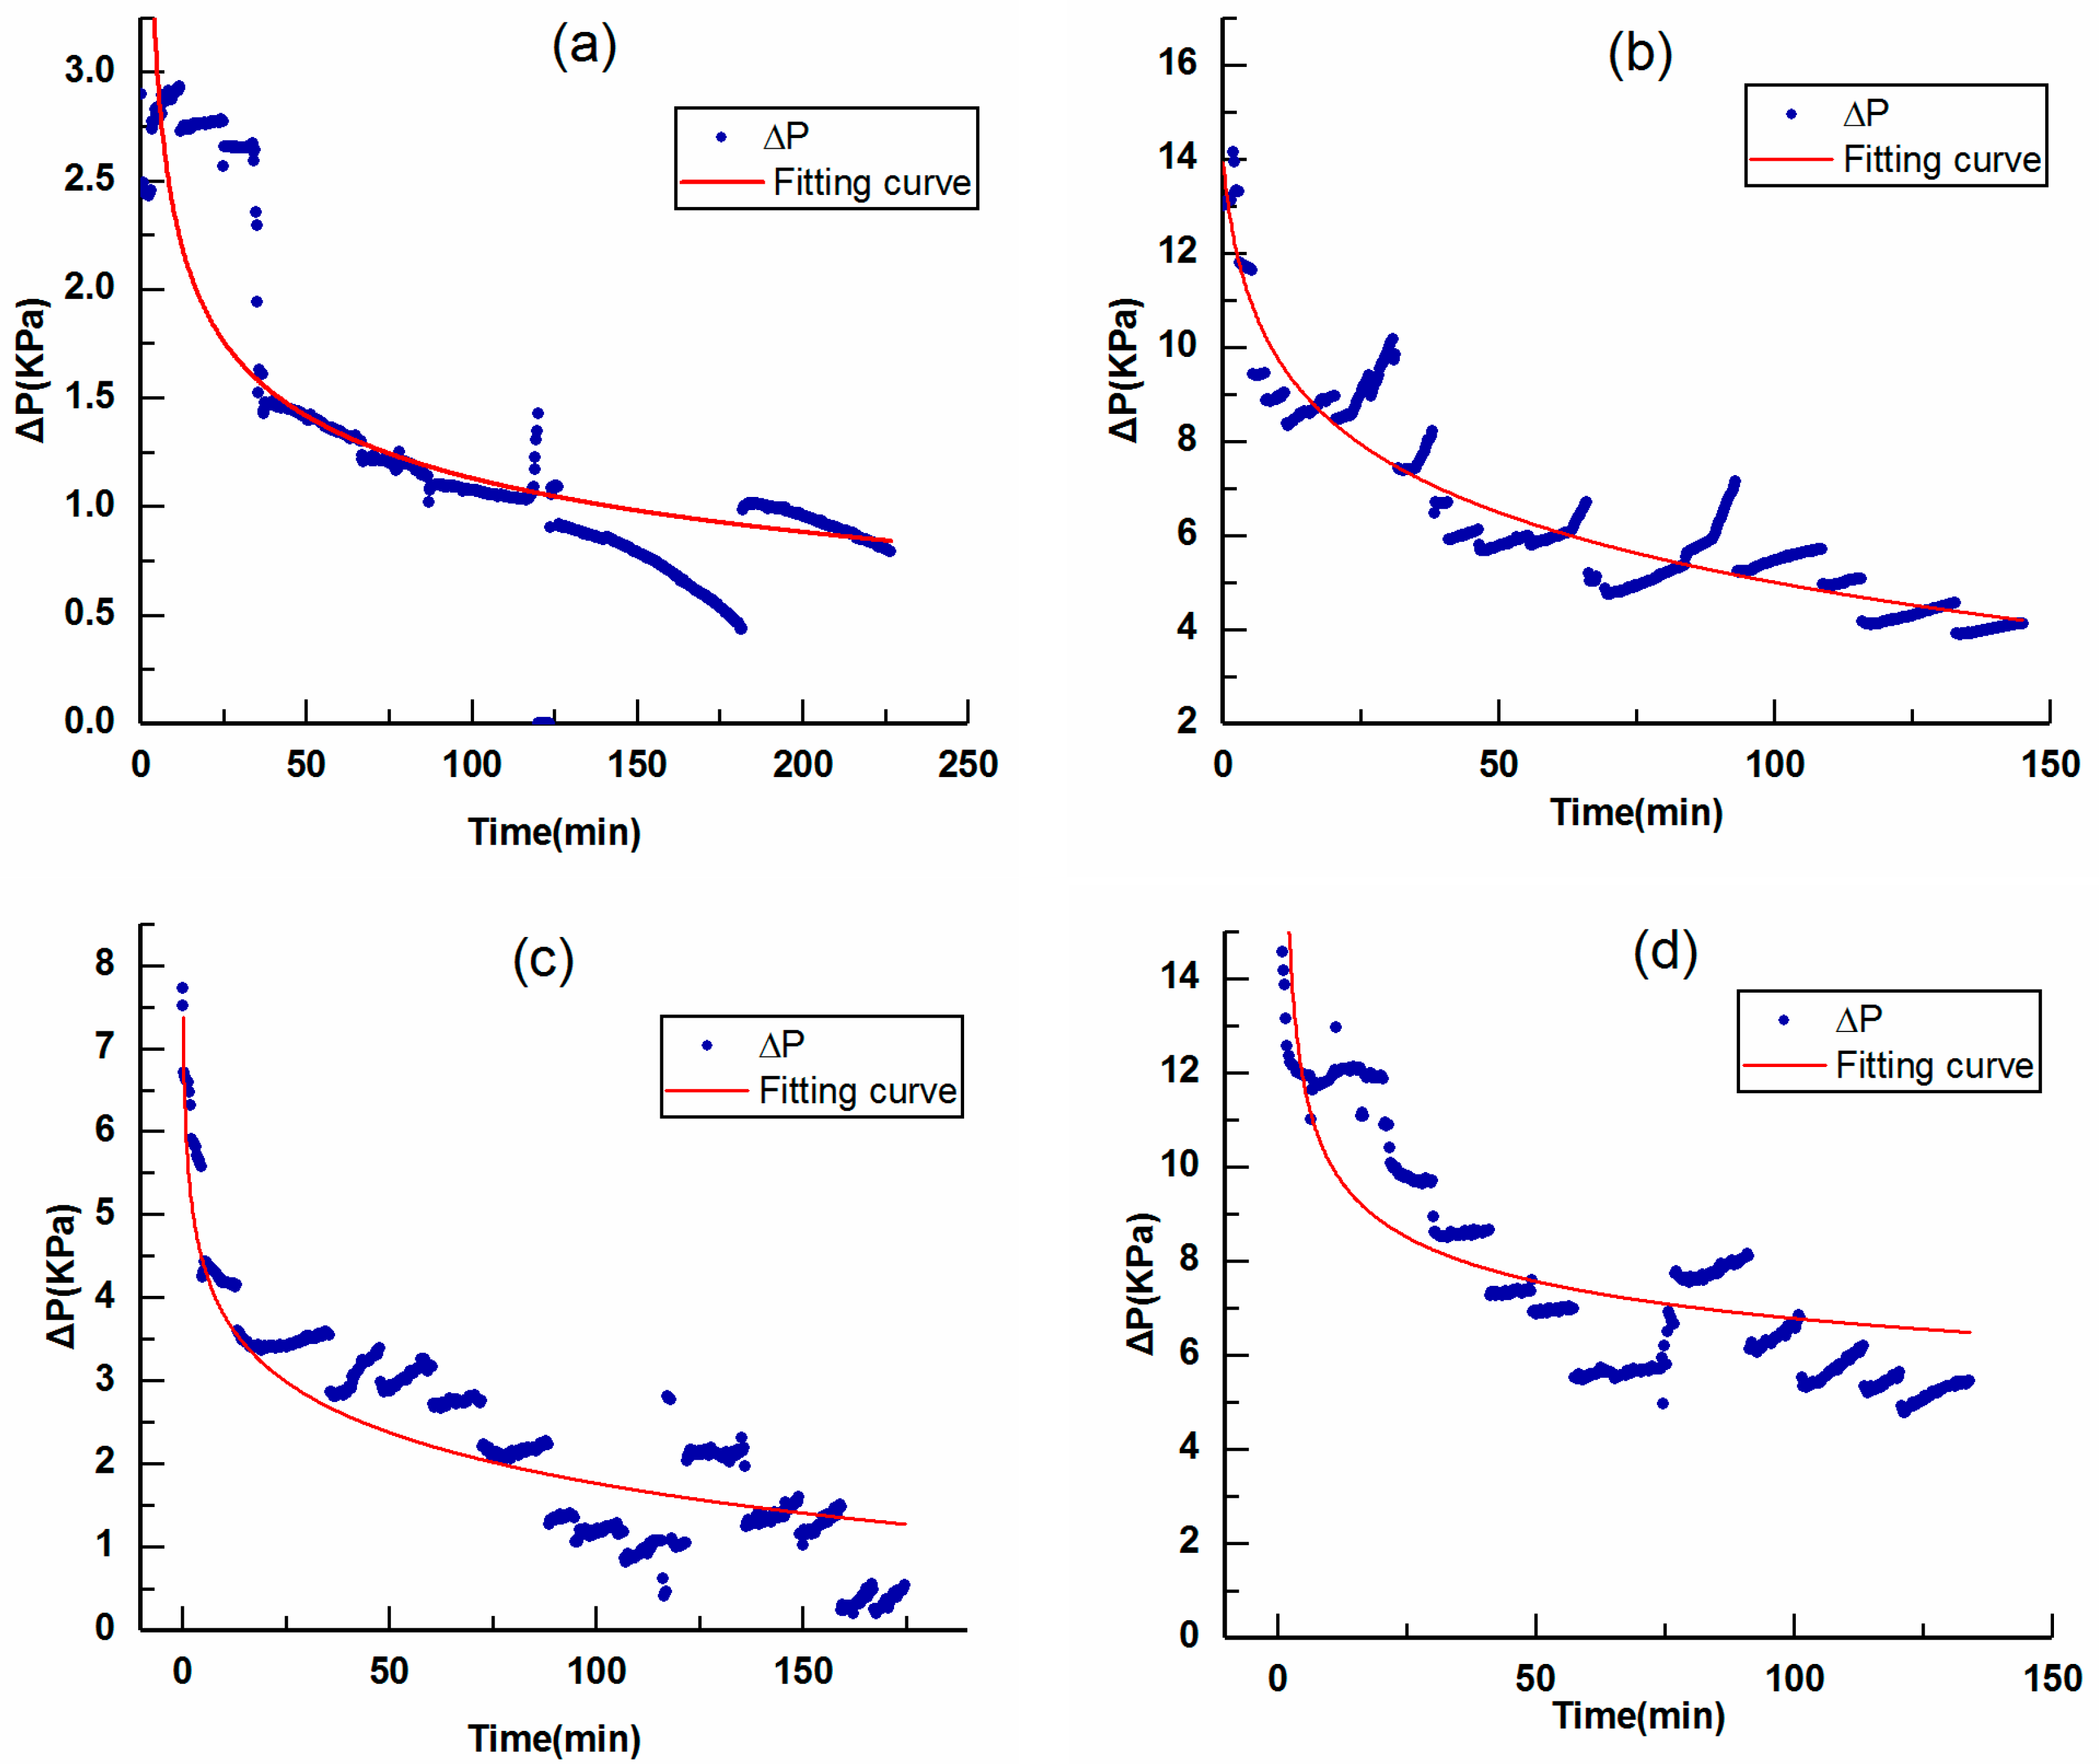
3.2. Flow Field Characteristics
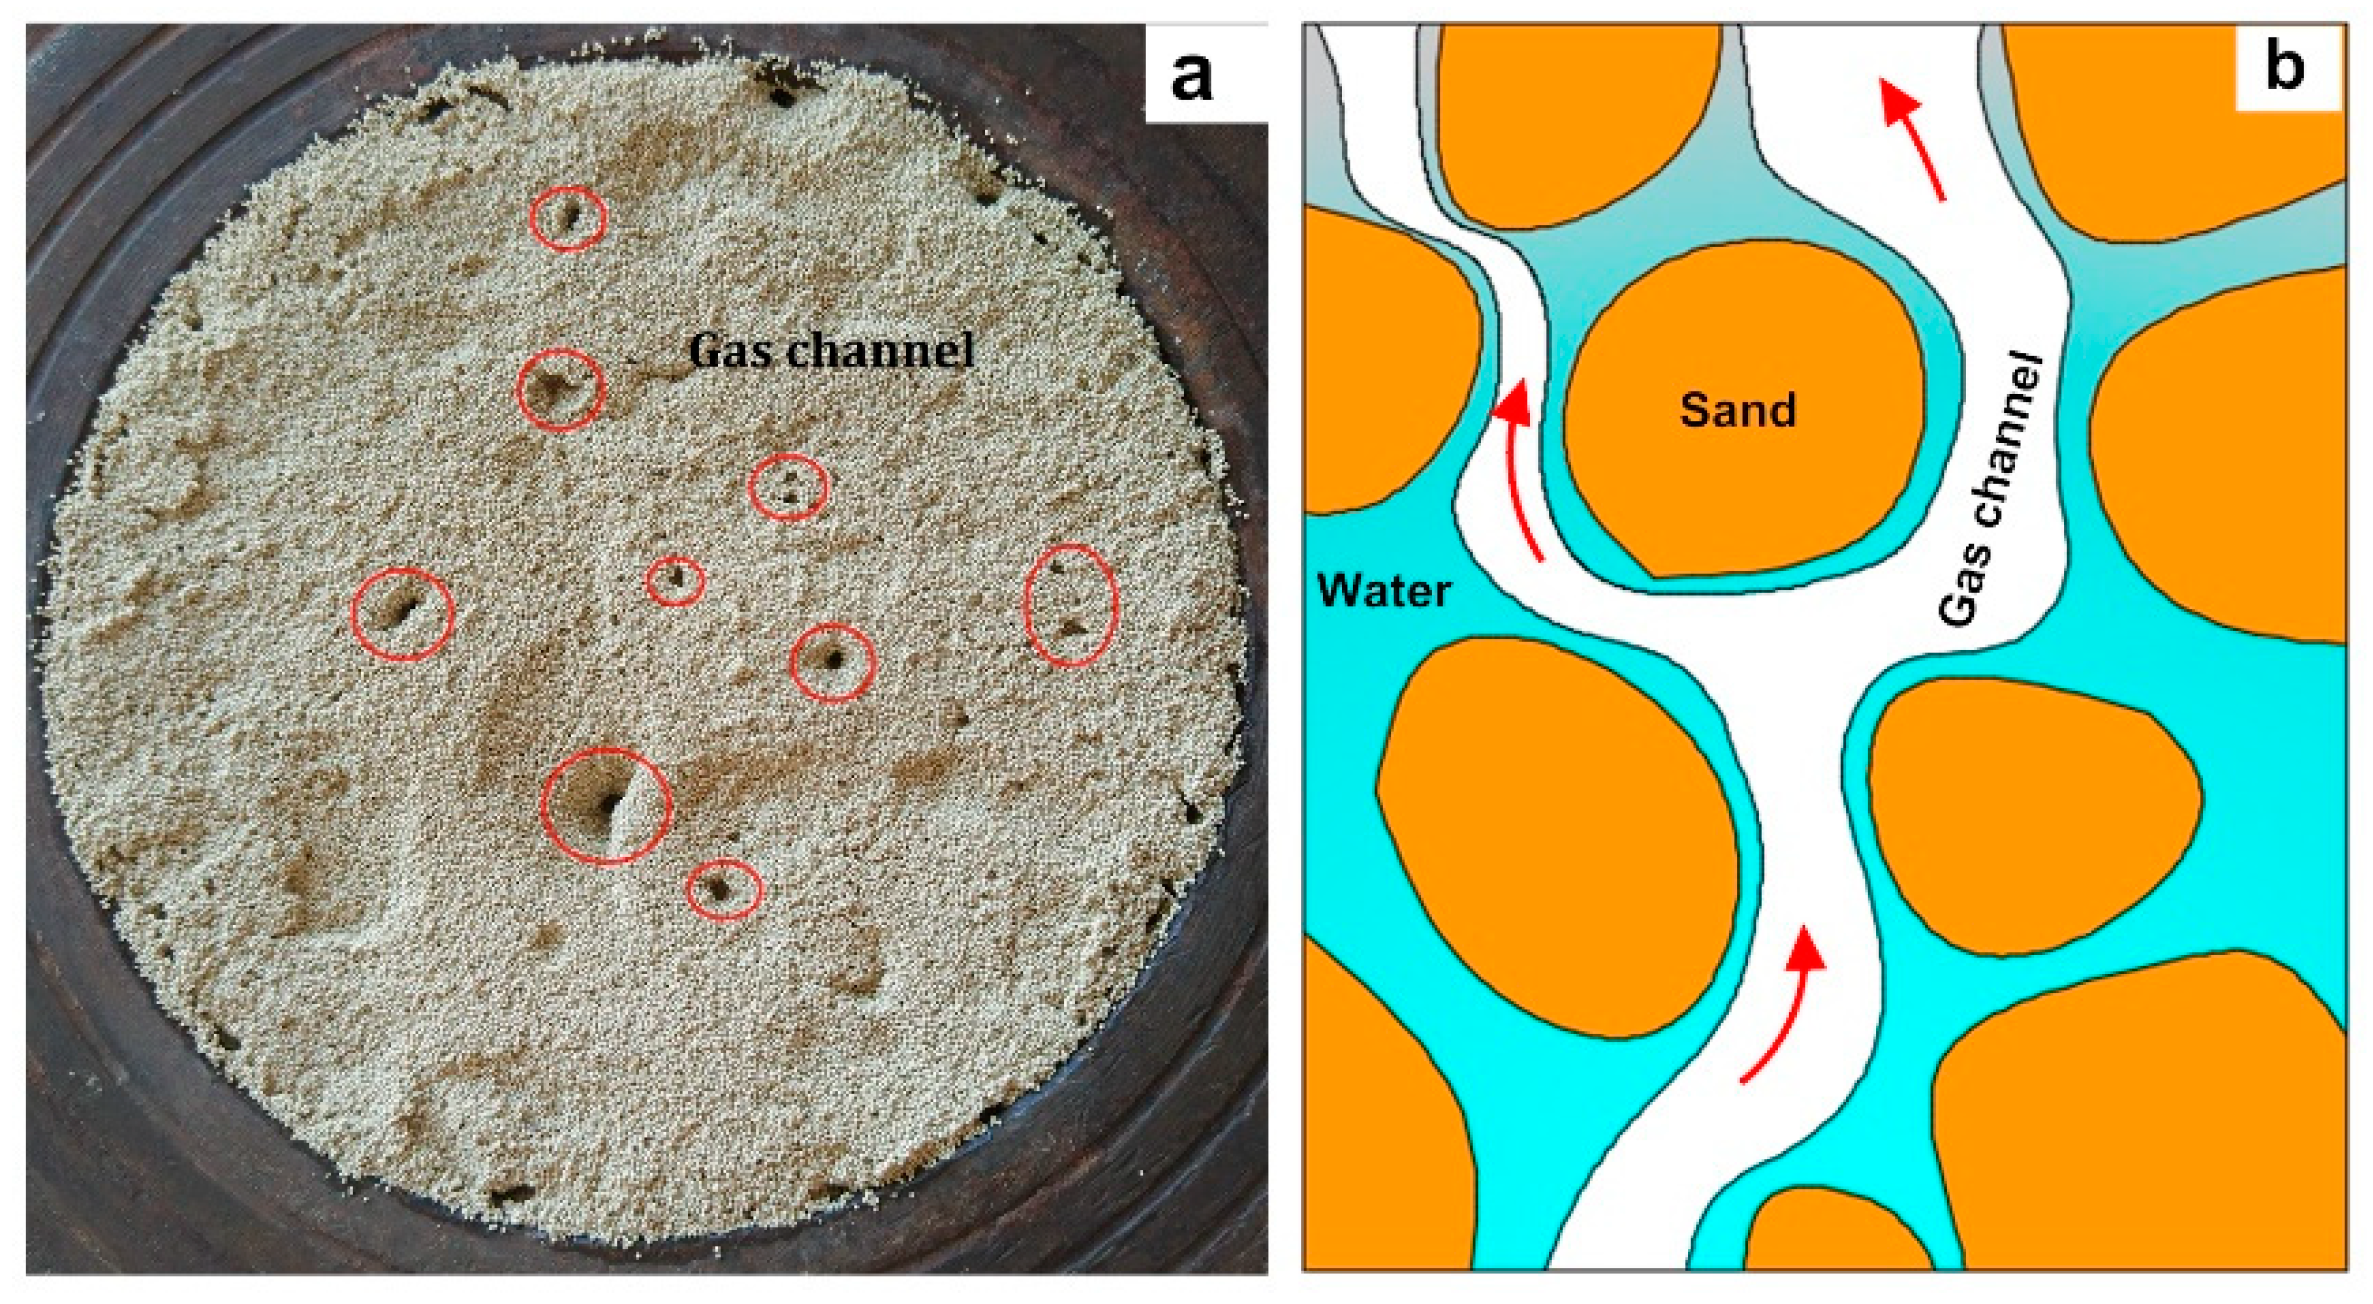
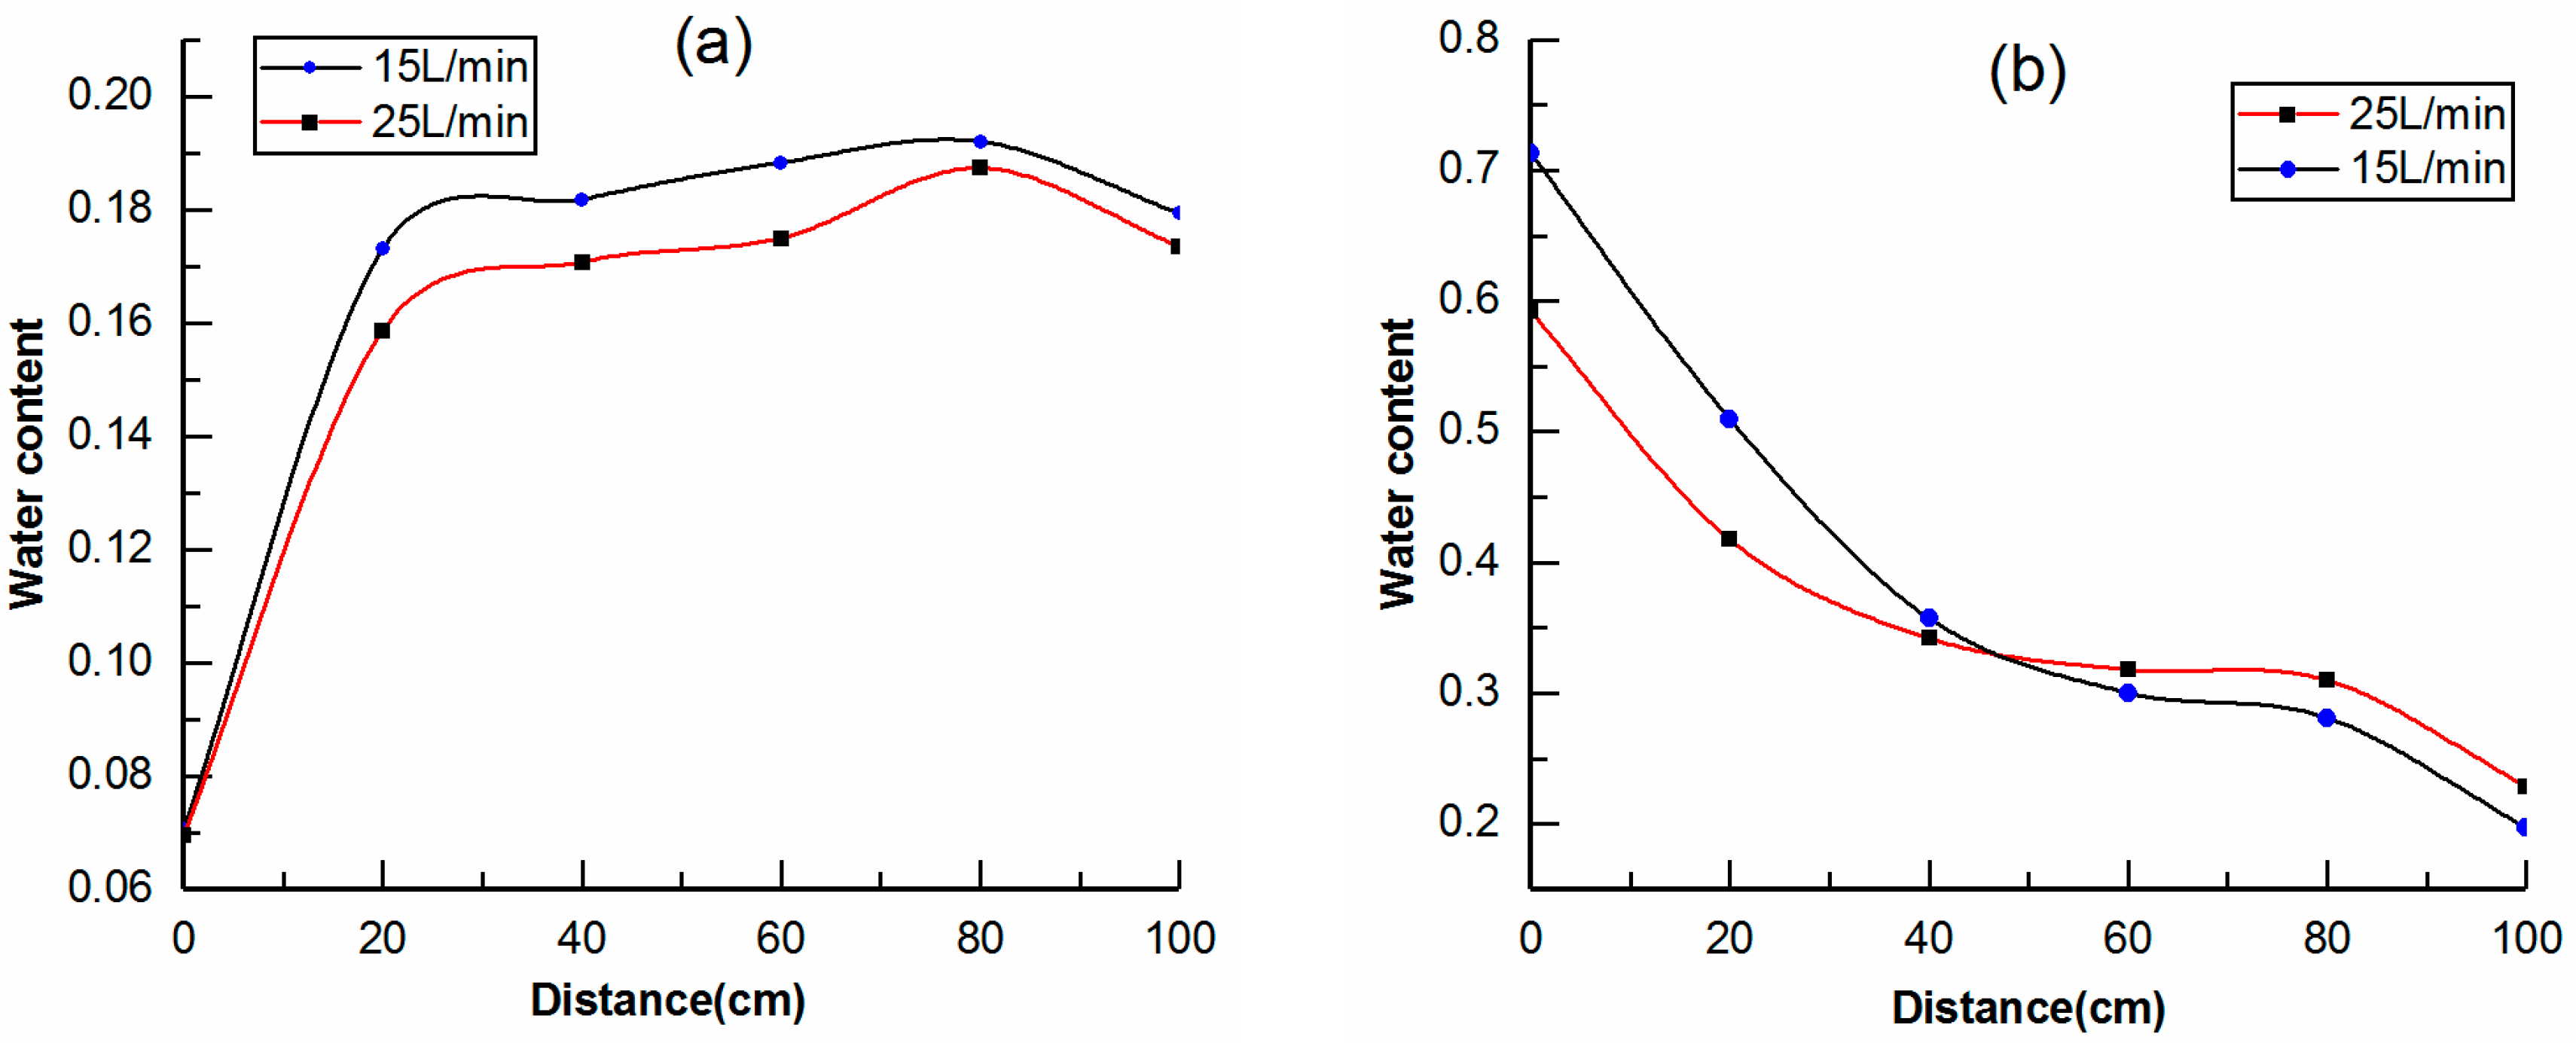
3.3. Water Migration during Cold Gas Injection
4. Discussion
4.1. Solid-Fluid Thermal Coupling Characteristics
4.2. Analysis of Feasibility
5. Conclusions
- A new method of natural cold gas injection was proposed to construct an artificial ground freezing structure, which uses the manner of heat convection to enhance the freezing rate. According to the experiments, the freezing rates could reach 0.18–0.61 cm/min.
- According to the characteristics of the temperature curves, the freezing process was divided into the initial cooling stage, phase transition stage, and subcooled stage. The duration of the initial cooling stage and phase transition stage will directly affect the freezing rate. Increasing the initial water content had less effect on the initial cooling stage, and the time required for the phase transition would increase in nearly the same proportion. Increasing the cold gas flow rate could not only increase the cooling rate in the initial cooling stage but also shorten the phase transition time, thereby increasing the freezing rate.
- The law of water migration during cold gas injection was obtained. Driven by gas flooding, attraction of the frozen front, sand adsorption and gravity, and water in the pores would redistribute. When the water content was low, except for the significant reduction at the inlet, the other parts decreased slightly—roughly in the range of 0.16–0.2. When the water content was high, the moisture content near the inlet was greatly increased, reaching between 0.6 and 0.75, and the further it was from the inlet, the lower the water content.
- The feasibility of the method was analyzed. The method proposed in this study has a high freezing rate and can be well applied in homogeneous soils. However, considering the low heat capacity of gas, the frozen range of a single well should be designed reasonably in the actual construction process; a range of approximately 3 m may be appropriate.
Author Contributions
Funding
Acknowledgments
Conflicts of Interest
References
- Russo, G.; Corbo, A.; Cavuoto, F.; Autuori, S. Artificial Ground Freezing to excavate a tunnel in sandy soil. Measurements and back analysis. Tunn. Undergr. Space Technol. 2015, 50, 226–238. [Google Scholar] [CrossRef]
- Pimentel, E.; Papakonstantinou, S.; Anagnostou, G. Numerical interpretation of temperature distributions from three ground freezing applications in urban tunnelling. Tunn. Undergr. Space Technol. Inc. Trenchless Technol. Res. 2012, 28, 57–69. [Google Scholar] [CrossRef]
- Andersland, O.B.; Ladanyi, B. Frozen Ground Engineering; American Society of Civil Engineers: Hunter Mill, VA, USA, 2004. [Google Scholar]
- Mauro, A.; Normino, G.; Cavuoto, F.; Marotta, P.; Massarotti, N. Modeling Artificial Ground Freezing for Construction of Two Tunnels of a Metro Station in Napoli (Italy). Energies 2020, 13, 1272. [Google Scholar] [CrossRef] [Green Version]
- Ries, A. Historical and technical development of the freezing process in shaft sinking. Gluckauf 1982, 118, e8. [Google Scholar]
- Hu, J.; Liu, Y.; Li, Y.; Yao, K. Artificial Ground Freezing In Tunnelling Through Aquifer Soil Layers: A Case Study in Nanjing Metro Line 2. KSCE J. Civ. Eng. 2018, 22, 4136–4142. [Google Scholar] [CrossRef]
- Hu, X.; Fang, T.; Chen, J.; Ren, H.; Guo, W. A large-scale physical model test on frozen status in freeze-sealing pipe roof method for tunnel construction. Tunn. Undergr. Space Technol. 2018, 72, 55–63. [Google Scholar] [CrossRef]
- Lackner, R.; Pichler, C.; Kloiber, A. Artificial Ground Freezing of Fully Saturated Soil: Viscoelastic Behavior. J. Eng. Mech. 2008, 134, 1–11. [Google Scholar] [CrossRef] [Green Version]
- Zhou, J.; Tang, Y. Artificial ground freezing of fully saturated mucky clay: Thawing problem by centrifuge modeling. Cold Reg. Sci. Technol. 2015, 117, 1–11. [Google Scholar] [CrossRef]
- Vitel, M.; Rouabhi, A.; Tijani, M.; Guérin, F. Modeling heat transfer between a freeze pipe and the surrounding ground during artificial ground freezing activities. Comput. Geotech. 2015, 63, 99–111. [Google Scholar] [CrossRef]
- Song, W.; Zhang, Y.; Li, B.; Fan, X. A lattice Boltzmann model for heat and mass transfer phenomena with phase transformations in unsaturated soil during freezing process. Int. J. Heat Mass Transf. 2016, 94, 29–38. [Google Scholar] [CrossRef]
- Zhao, D.J.; Liu, Y.M.; Sun, Y.H.; Zhao, Y.; Bai, F.T. Experiments and simulations of underground artificial freezing with the use of natural cold resources in cold regions. Build. Environ. 2015, 87, 224–233. [Google Scholar] [CrossRef]
- Marwan, A.; Zhou, M.M.; Zaki Abdelrehim, M.; Meschke, G. Optimization of artificial ground freezing in tunneling in the presence of seepage flow. Comput. Geotech. 2016, 75, 112–125. [Google Scholar] [CrossRef]
- Huang, S.; Guo, Y.; Liu, Y.; Ke, L.; Liu, G.; Chen, C. Study on the influence of water flow on temperature around freeze pipes and its distribution optimization during artificial ground freezing. Appl. Therm. Eng. 2018, 135, 435–445. [Google Scholar] [CrossRef]
- Mahmoud, A.; Alzoubi, A.M.; Hassani, F.P.; Sasmito, A.P. Heat transfer analysis in artificial ground freezing under high seepage: Validation and heatlines visualization. Int. J. Therm. Sci. 2019, 139, 232–245. [Google Scholar]
- Alzoubi, M.A.; Aurelien, N.R.; Sasmito, A.P. Conjugate heat transfer in artificial ground freezing using enthalpy-porosity method: Experiments and model validation. Int. J. Heat Mass Transf. 2018, 126, 740–752. [Google Scholar] [CrossRef]
- Mahmoud, A.; Alzoubi, A.P.; Sasmito, A.M.; Madiseh, A.; Hassani, F.P. Intermittent Freezing Concept for Energy Saving in Artificial Ground Freezing Systems. Energy Procedia 2017, 142, 3920–3925. [Google Scholar]
- Hu, R.; Liu, Q.; Xing, Y. Case Study of Heat Transfer during Artificial Ground Freezing with Groundwater Flow. Water 2018, 10, 1322. [Google Scholar] [CrossRef] [Green Version]
- Popov, Y.A.; Sadlei, B.V.; Dzyubenko, L.F. Hydraulic excavation in the wintertime in Siberia. Hydrotech. Constr. 1985, 19, 573–576. [Google Scholar] [CrossRef]
- Iwata, S. Driving force for water migration in frozen clayey soil. Soil Sci. Plant Nutr. 1980, 26, 215–227. [Google Scholar] [CrossRef] [Green Version]
- Ming, F.; Li, D.Q. A model of migration potential for moisture migration during soil freezing. Cold Reg. Sci. Technol. 2016, 124, 87–94. [Google Scholar] [CrossRef]
- Ma, W.; Zhang, L.; Yang, C. Discussion of the applicability of the generalized Clausius–Clapeyron equation and the frozen fringe process. Earth Sci. Rev. 2015, 142, 47–59. [Google Scholar] [CrossRef]
- Hoekstra, P. Moisture movement in soils under temperature gradients with the cold-side temperature below freezing. Water Resour. Res. 2010, 2, 241–250. [Google Scholar] [CrossRef]
- Song, X.; Zhao, Y.; Wang, H.; Qin, C. Predictive models and airflow distribution associated with the zone of influence (ZOI) during air sparging remediation. Sci. Total Environ. 2015, 537, 1–8. [Google Scholar] [CrossRef] [PubMed]
- Veillon, C.; Park, J.Y. Correct procedures for calibration and use of rotameter-type gas flow measuring devices. Anal. Chem. 1970, 42, 684–685. [Google Scholar] [CrossRef]
- Go, G.H.; Lee, J.; Shin, H.S.; Ryu, B.H.; Jin, H.W.; Kin, D.W. Evaluation of one-dimensional freezing behavior for ice-rich sandy soil. Int. J. Heat Mass Transf. 2019, 130, 960–967. [Google Scholar] [CrossRef]
- Fourie, W.J.; Barnes, D.L.; Shur, Y. The formation of ice from the infiltration of water into a frozen coarse grained soil. Cold Reg. Sci. Technol. 2007, 48, 1–128. [Google Scholar] [CrossRef]
- Dror, I.; Berkowitz, B.; Gorelick, S.M. Effects of air injection on flow through porous media: Observations and analyses of laboratory-scale processes. Water Resour. Res. 2004, 40, W09203. [Google Scholar] [CrossRef] [Green Version]
- Sun, Y.; Liu, Z.; Li, Q.; Guo, W. Controlling groundwater infiltration by gas flooding for oil shale in situ pyrolysis exploitation. J. Pet. Sci. Eng. 2019, 179, 444–454. [Google Scholar] [CrossRef]
- Safety Executive. Safety of New Austrian Tunnelling Method (NATM) Tunnels: A Review of Sprayed Concrete Lined Tunnels with Particular Reference to London Clay; Transport Research Laboratory: Crowthorne, UK, 1996. [Google Scholar]
- Yoshimura, H.; Yuki, T.; Yamada, Y.; Kokubun, N. Analysis and monitoring of the Miyana railway tunnel constructed using the New Austrian tunnelling method. Int. J. Rock Mech. Min. Geomech. Abstr. 1986, 23, 67–75. [Google Scholar] [CrossRef]
- Johnson, P.C.; Johnson, R.L.; Neaville, C.; Hansen, E.E.; Stearns, S.M.; Dortch, I.J. An assessment of conventional in situ air sparging pilot tests. Ground Water 2010, 35, 765–774. [Google Scholar] [CrossRef]


| Sand Type | Mesh Size | Packed Porosity | Density (Kg/m3) | Thermal Conductivity (W/(m·K)) | Specific Heat Capacity (KJ/(Kg·°C)) |
|---|---|---|---|---|---|
| Ceramsite sand | 40–70 | 0.39 | 1100 | 1.15 | 0.961 |
| Experiment Number | Initial Water Content | Gas Flow Rate (L/min) |
|---|---|---|
| 1 | 0.2 | 15 ± 0.2 |
| 2 | 0.2 | 25 ± 0.2 |
| 3 | 0.4 | 15 ± 0.2 |
| 4 | 0.4 | 25 ± 0.2 |
| Experiment Number | Freezing Rate of T1–T2 (cm/min) | Freezing Rate of T2–T3 (cm/min) | Freezing Rate of T3–T4 (cm/min) |
|---|---|---|---|
| 1 | 0.46 | 0.33 | 0.18 |
| 2 | 0.60 | 0.52 | 0.47 |
| 3 | 0.37 | 0.44 | — |
| 4 | 0.61 | 0.52 | — |
© 2020 by the authors. Licensee MDPI, Basel, Switzerland. This article is an open access article distributed under the terms and conditions of the Creative Commons Attribution (CC BY) license (http://creativecommons.org/licenses/by/4.0/).
Share and Cite
Liu, Z.; Sun, Y.; Wang, B.; Li, Q. Experimental Study of Artificial Ground Freezing by Natural Cold Gas Injection. Appl. Sci. 2020, 10, 6055. https://doi.org/10.3390/app10176055
Liu Z, Sun Y, Wang B, Li Q. Experimental Study of Artificial Ground Freezing by Natural Cold Gas Injection. Applied Sciences. 2020; 10(17):6055. https://doi.org/10.3390/app10176055
Chicago/Turabian StyleLiu, Zhao, Youhong Sun, Bingge Wang, and Qiang Li. 2020. "Experimental Study of Artificial Ground Freezing by Natural Cold Gas Injection" Applied Sciences 10, no. 17: 6055. https://doi.org/10.3390/app10176055