Article

Blast Vibration Control in A Hydropower Station for the Safety of Adjacent Structure

1
State Key Laboratory of Hydraulics and Mountain River Engineering, Sichuan University, Chengdu 610065, China
2
College of Water Resource and Hydropower, Sichuan University, Chengdu 610065, China
3
China Gezhouba Group Explosive Co., Ltd., Chongqing 401121, China
4
Work Safety Key Lab on Prevention and Control of Gas and Roof Disasters for Southern Goal Mines, Hunan University of Science and Technology, Xiangtan 411201, China
5
Institute of Disaster Management and Reconstruction, Sichuan University and The Hong Kong Plotechnic University, Chengdu 610065, China
*
Author to whom correspondence should be addressed.
Appl. Sci. 2020, 10(18), 6195; https://doi.org/10.3390/app10186195
Submission received: 14 July 2020 / Revised: 31 August 2020 / Accepted: 1 September 2020 / Published: 6 September 2020
(This article belongs to the Section Civil Engineering)

Abstract

:
The transverse cofferdam in Xiangjiaba hydropower station was a water retaining concrete structure with a length of 126 m, a width of 12 m, and a height of 25.2 m, consisting of masonry, plain concrete structure (PC), and roller compacted concrete (RCC), which had to be demolished by blasting after the dam was built. There were many precise instruments nearby the cofferdam which had strict restrictions on blasting vibration. Therefore, the cofferdam was divided into six blasting regions, including land blasting and underwater blasting. Blasting parameters and blasting network structure were accurately designed and continuously optimized through blast-induced vibration test results. At nine measurement points in different locations, 57 blast vibration data were recorded. Consequently, 1386 holes with an explosive weight of 9641.3 kg were detonated in land blasting. The highest levels of vibration were recorded as 8.74 cm/s in the desilting tunnel on the right of the cofferdam. The explosives up to 11887.7 kg were detonated in an underwater blasting. According to the analysis of the law of vibration attenuation, the blast vibration value was reduced to 7.65 cm/s. The results showed that the research on the attenuation law of blasting vibration can effectively increase the charge weight per delay and control the blast-induced vibration. Consequently, the peak particle velocity (PPV) of underwater blasting could be predicted by analyzing the PPV of land blasting in same structure, which provided the basis for the design of underwater blasting parameters. A reliable method for cofferdam demolition in hydropower station was proposed, which provided a reference for similar projects.

1. Introduction

Blasting is an efficient method for rock excavation [1]. Therefore, it is widely used in various projects, including tunnels, mines, and hydropower stations. However, the adverse impacts of blasting also affect engineering safety, such as blast-induced vibration and blasting flyrock. It is thus crucial to accurately design blasting parameters in the same situation, considering blasting disasters are directly associated with blasting design.
Many scholars have investigated the influence factors of blast-induced vibration in different projects with experimental tests and numerical simulation software. For example, Kari et al. [2] revealed that peak particle velocity (PPV) and frequency are important factors for the safety of adjacent structures through the examples of blasting near Olympic Stadium in Helsinki, Finland. Jiang et al. [3] calculated the attenuation coefficient of blast-induced vibration on open pit slopes affected by underground mining with a dynamic finite element method. Lu et al. [4] found blast-induced vibration decreased sharply with the number of blast-generated free surfaces in a pumped storage power station. Qiu et al. [5] indicated that short-delay blasting was more advantageous to control blast-induced vibration by comparing the experimental tests of short-delay with simultaneous blasting in underground mines. Tripathy et al. [6] ensured the safety of engineered structures against blast-induced vibration by monitoring blast-induced vibration during excavation. Agrawal et al. [7] modified the predictive equation of PPV (peak particle velocity) during multi-hole blasting through scaled distance regression analysis of blast-induced vibration in an open-pit mine. Blair [8,9] verified the significance of free surface and charge weight per delay to blast-induced vibration. Xia et al. [10] indicated the safety of a water pipeline under blast-induced vibration during an adjacent subway excavation combining 3D numerical calculation and field blast-induced vibration monitoring tests.
Some attempts have been made to control blast-induced vibration. Uysal et al. [11] reported that barrier holes could reduce blast-induced vibration by more than 18% after analyzing 121 blast-induced vibration data. Zeng et al. [12] established the relationship between PPV and explosives charge weight per delay in nuclear power station, and found the explosives charge weight per delay was 26.3 kg in the blasting excavation. Roy et al. [13] controlled blast-induced vibration within the acceptable limits by changing blast parameters, maximum explosives charge weight per delay, and initiation networks. Kim et al. [14] presented an abrasive water jet cutting method that can reduce the blast-induced ground vibration more effectively than the drilling-blasting method in tunnel excavation. Ongen et al. [15] evaluated the accuracy of four estimation models by cross-validation with measured values and put forward that the USBM (US Bureau of Mines) and Ambraseys-Hendron prediction models were closer to real blast-induced vibration. Navarro et al. [16] proposed the new blast-induced vibration control approaches, which determined optimal blasting parameters through a new theoretical formula to effectively control blast-induced vibration in the admissible adopted standard.
Indeed, such improvements in blast-induced vibration contributed to ensuring the safety of blasting engineering in tunnels, mines, slopes, etc. However, the investigation of blast-induced vibration in hydropower stations was rather limited. As there are many sophisticated devices and important structures in hydropower stations, it is necessary to control blast-induced vibration. In this paper, the transverse cofferdam in Xiangjiaba hydropower station was taken as an example and field tests, field measurement, and theoretical analysis were combined to systematically investigate the relationship between PPV, explosives charge weight per delay, and blasting parameters. A reliable method for cofferdam demolition in hydropower stations was proposed, which provided a reference for similar projects.

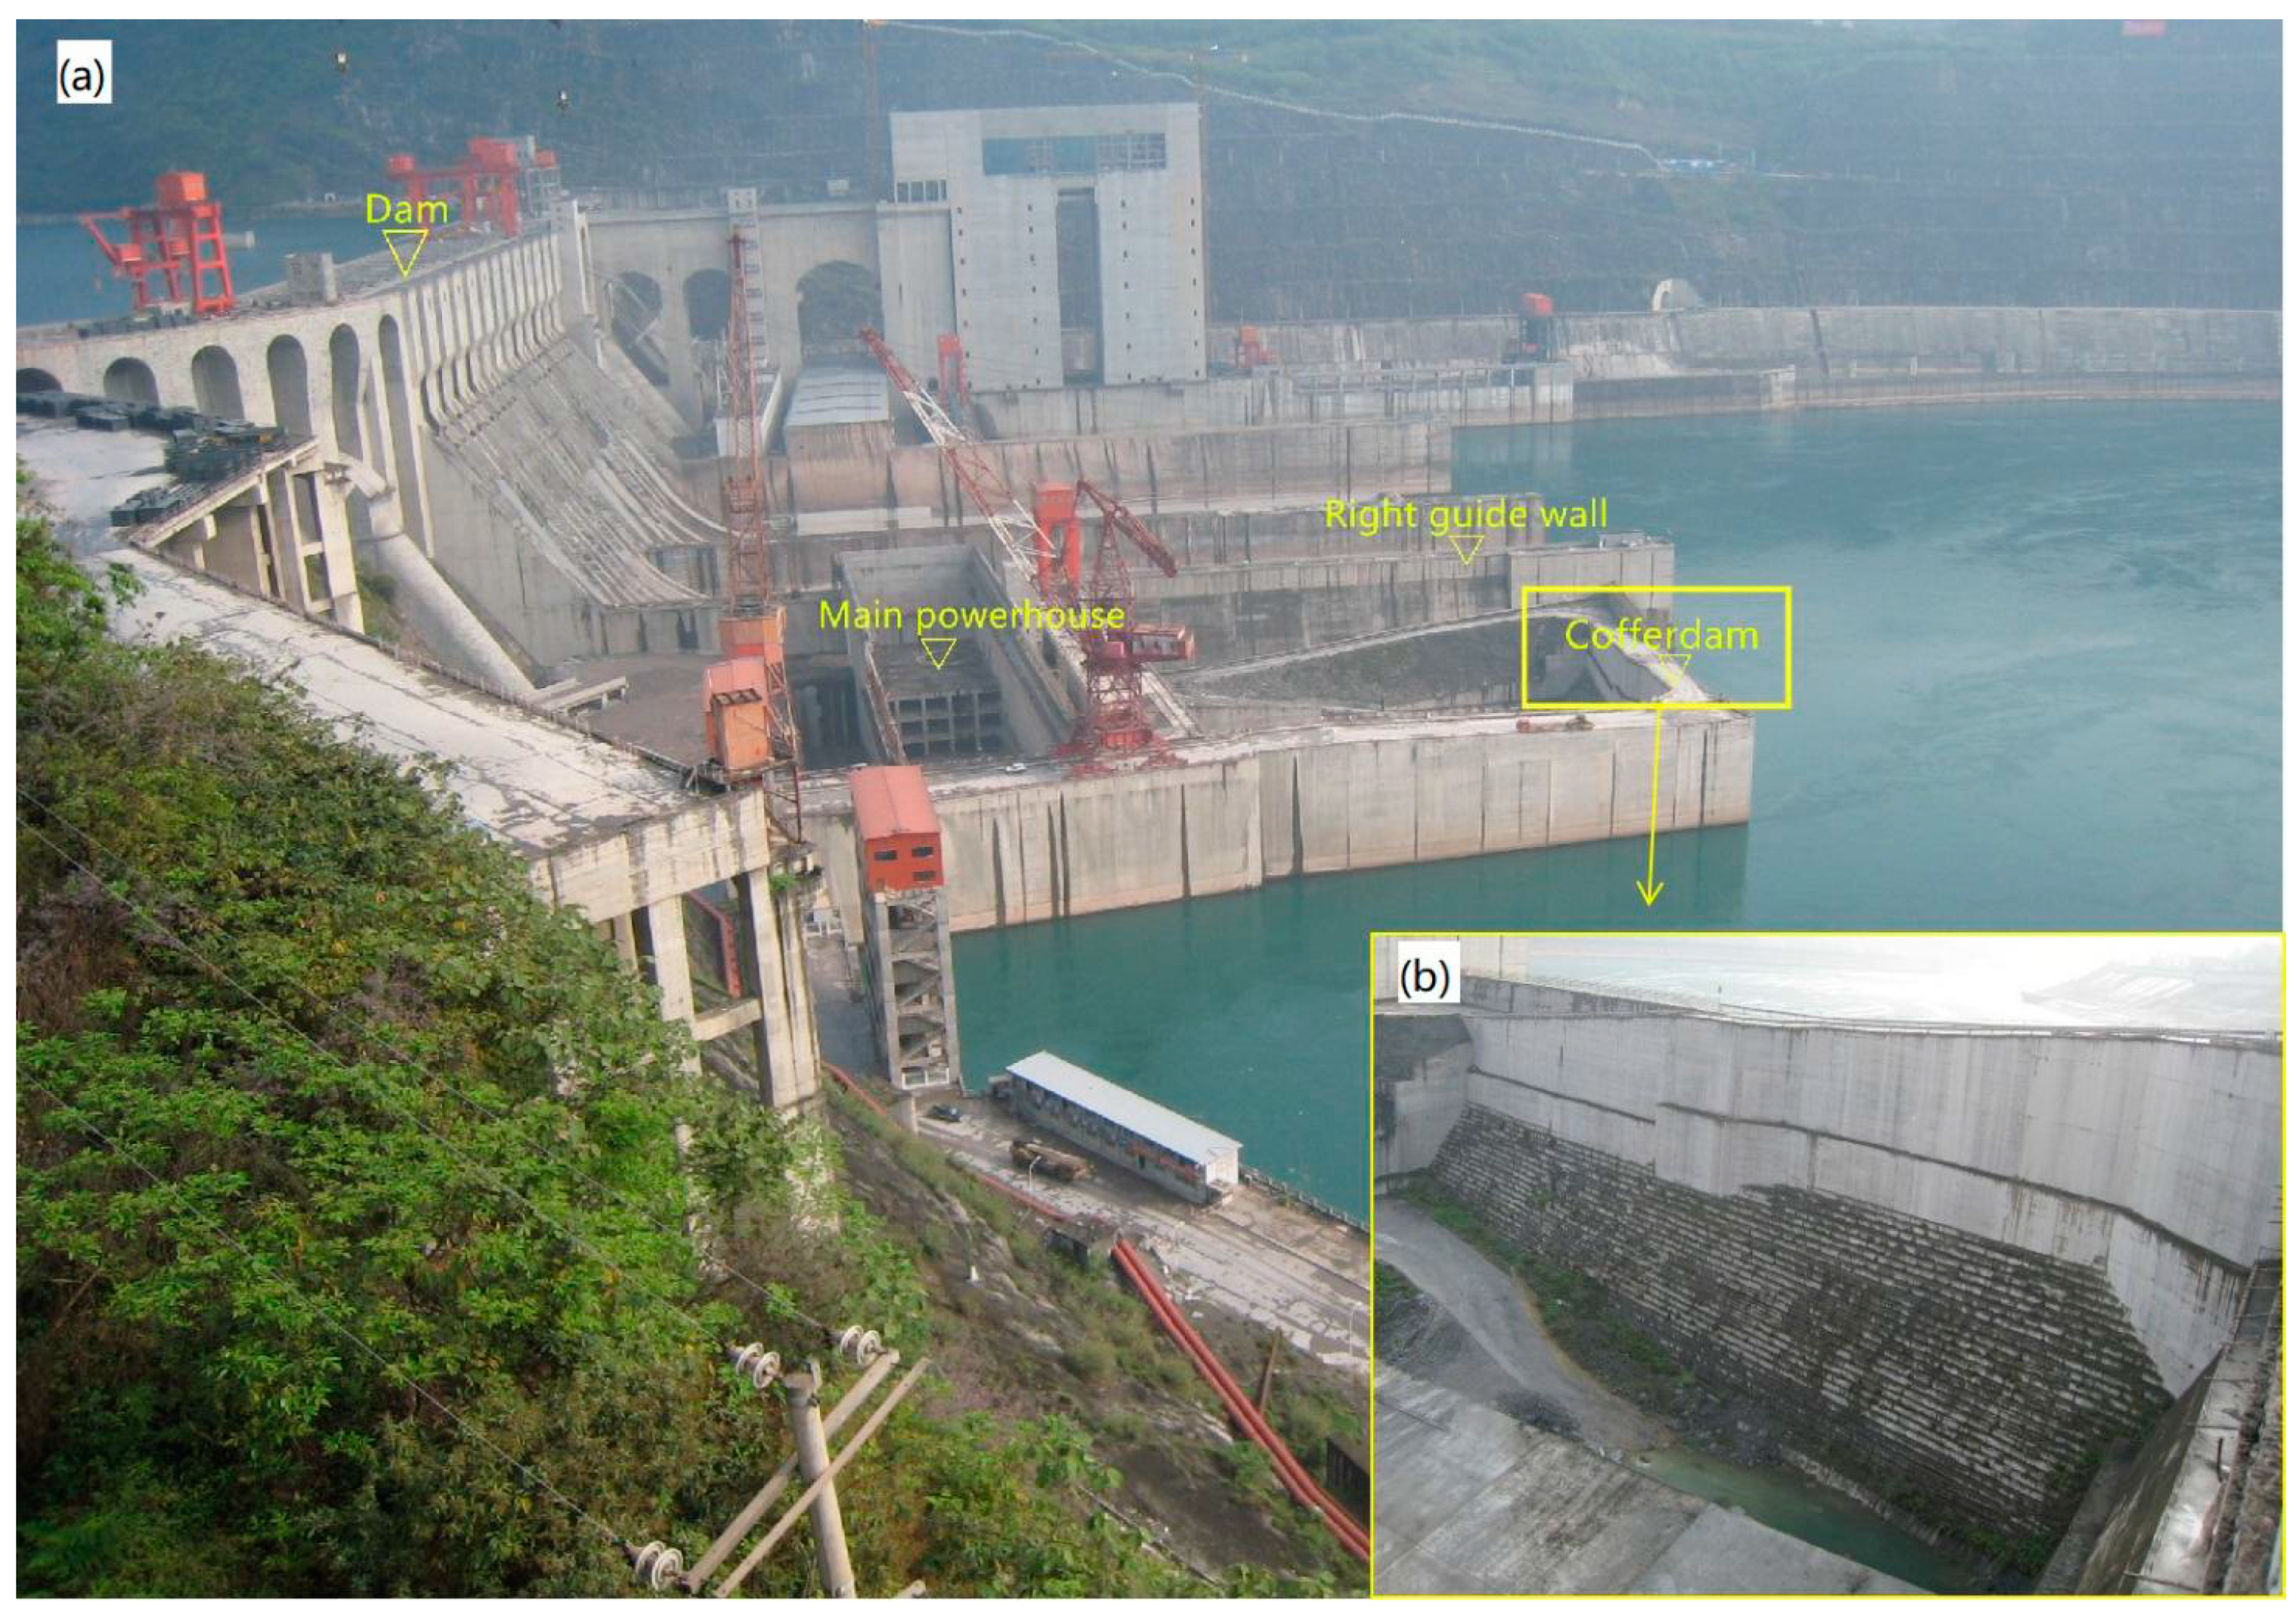
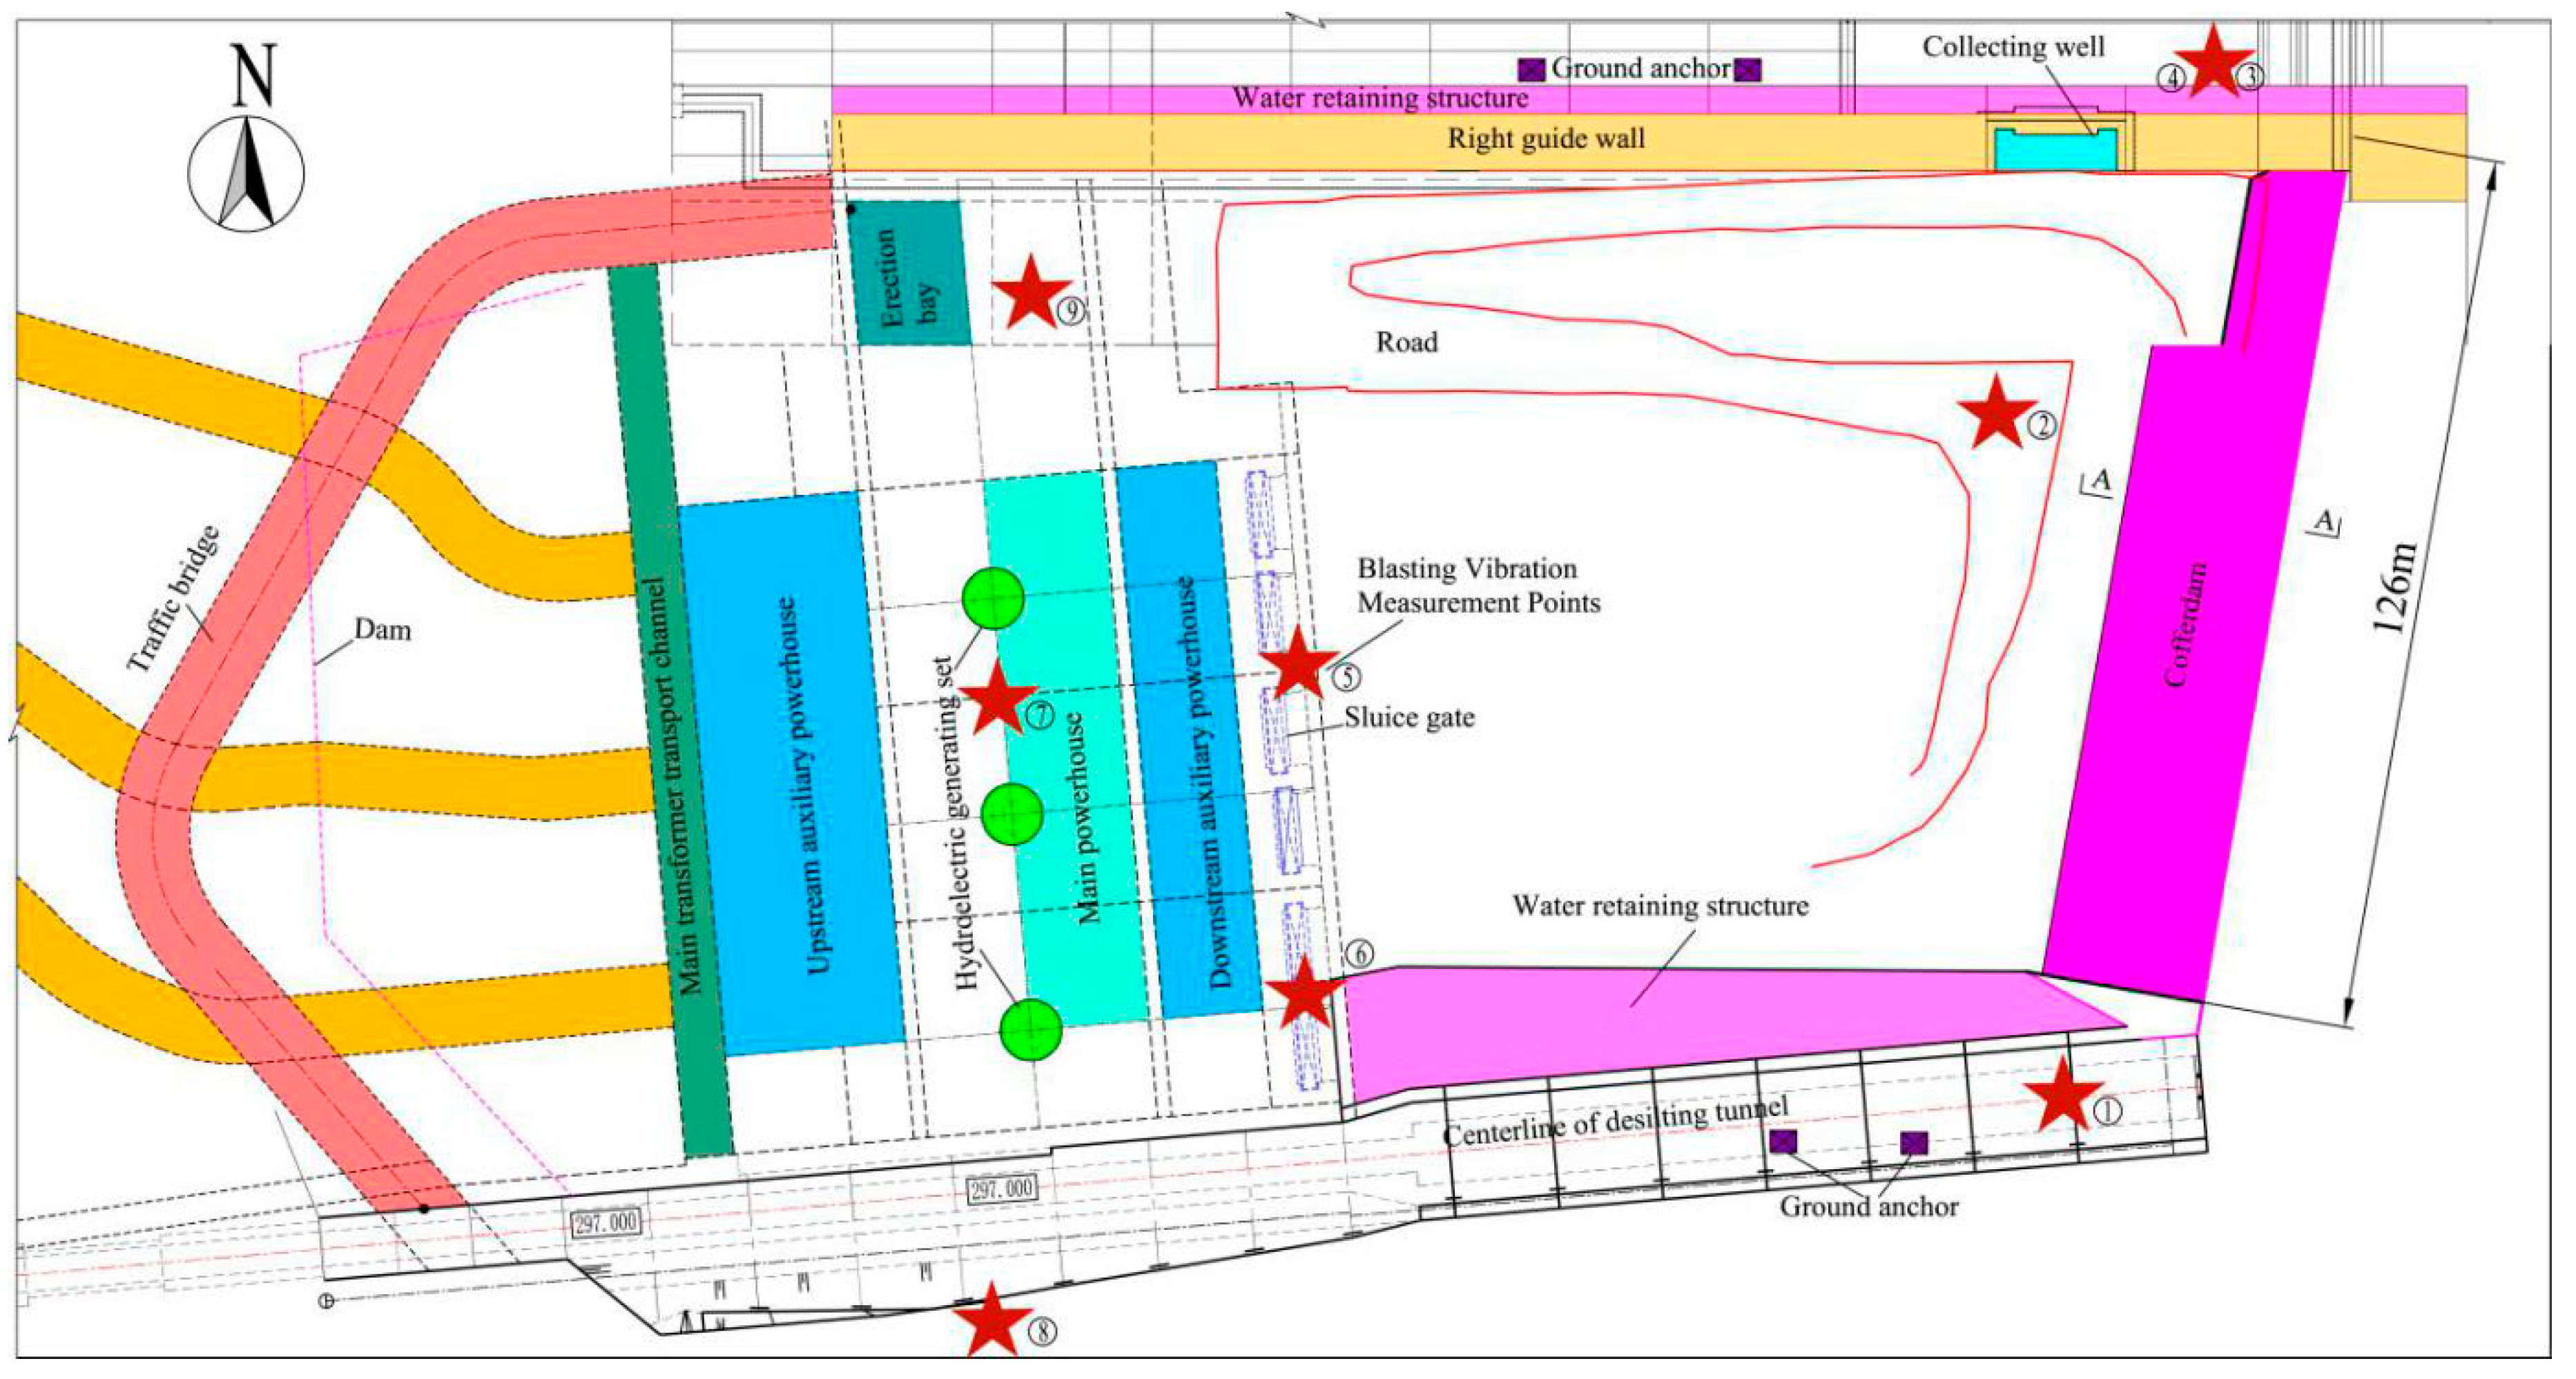
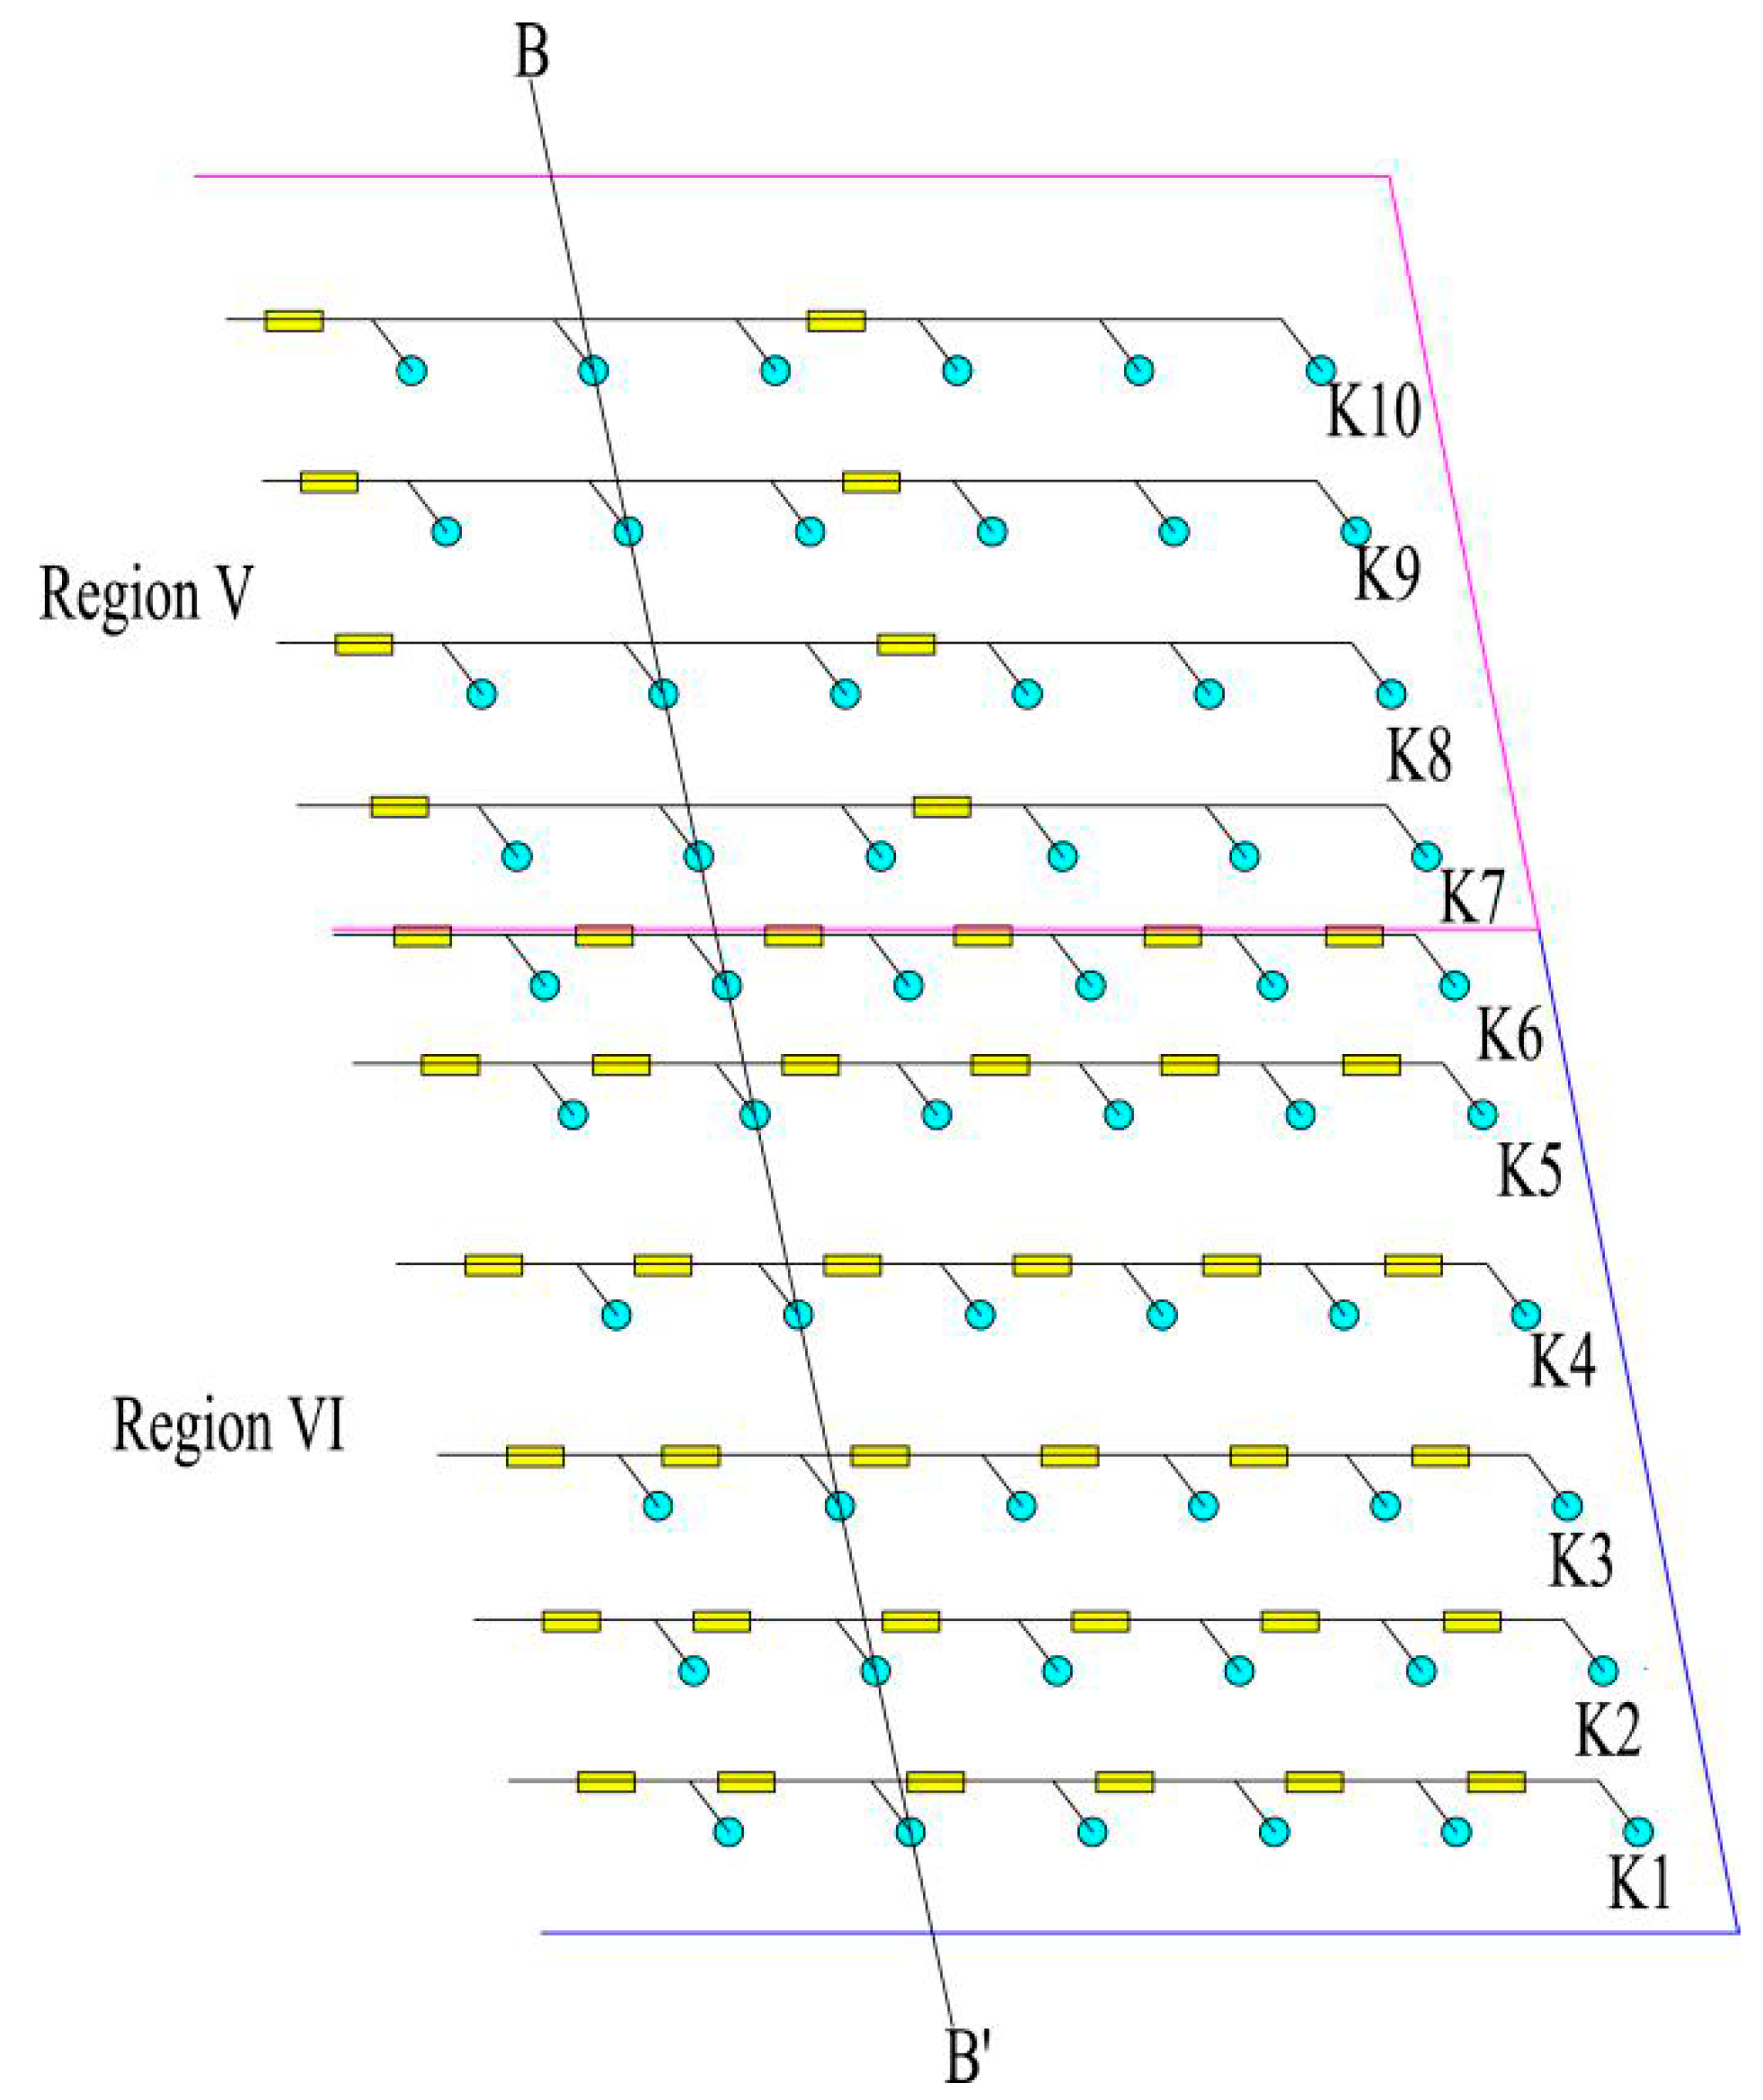
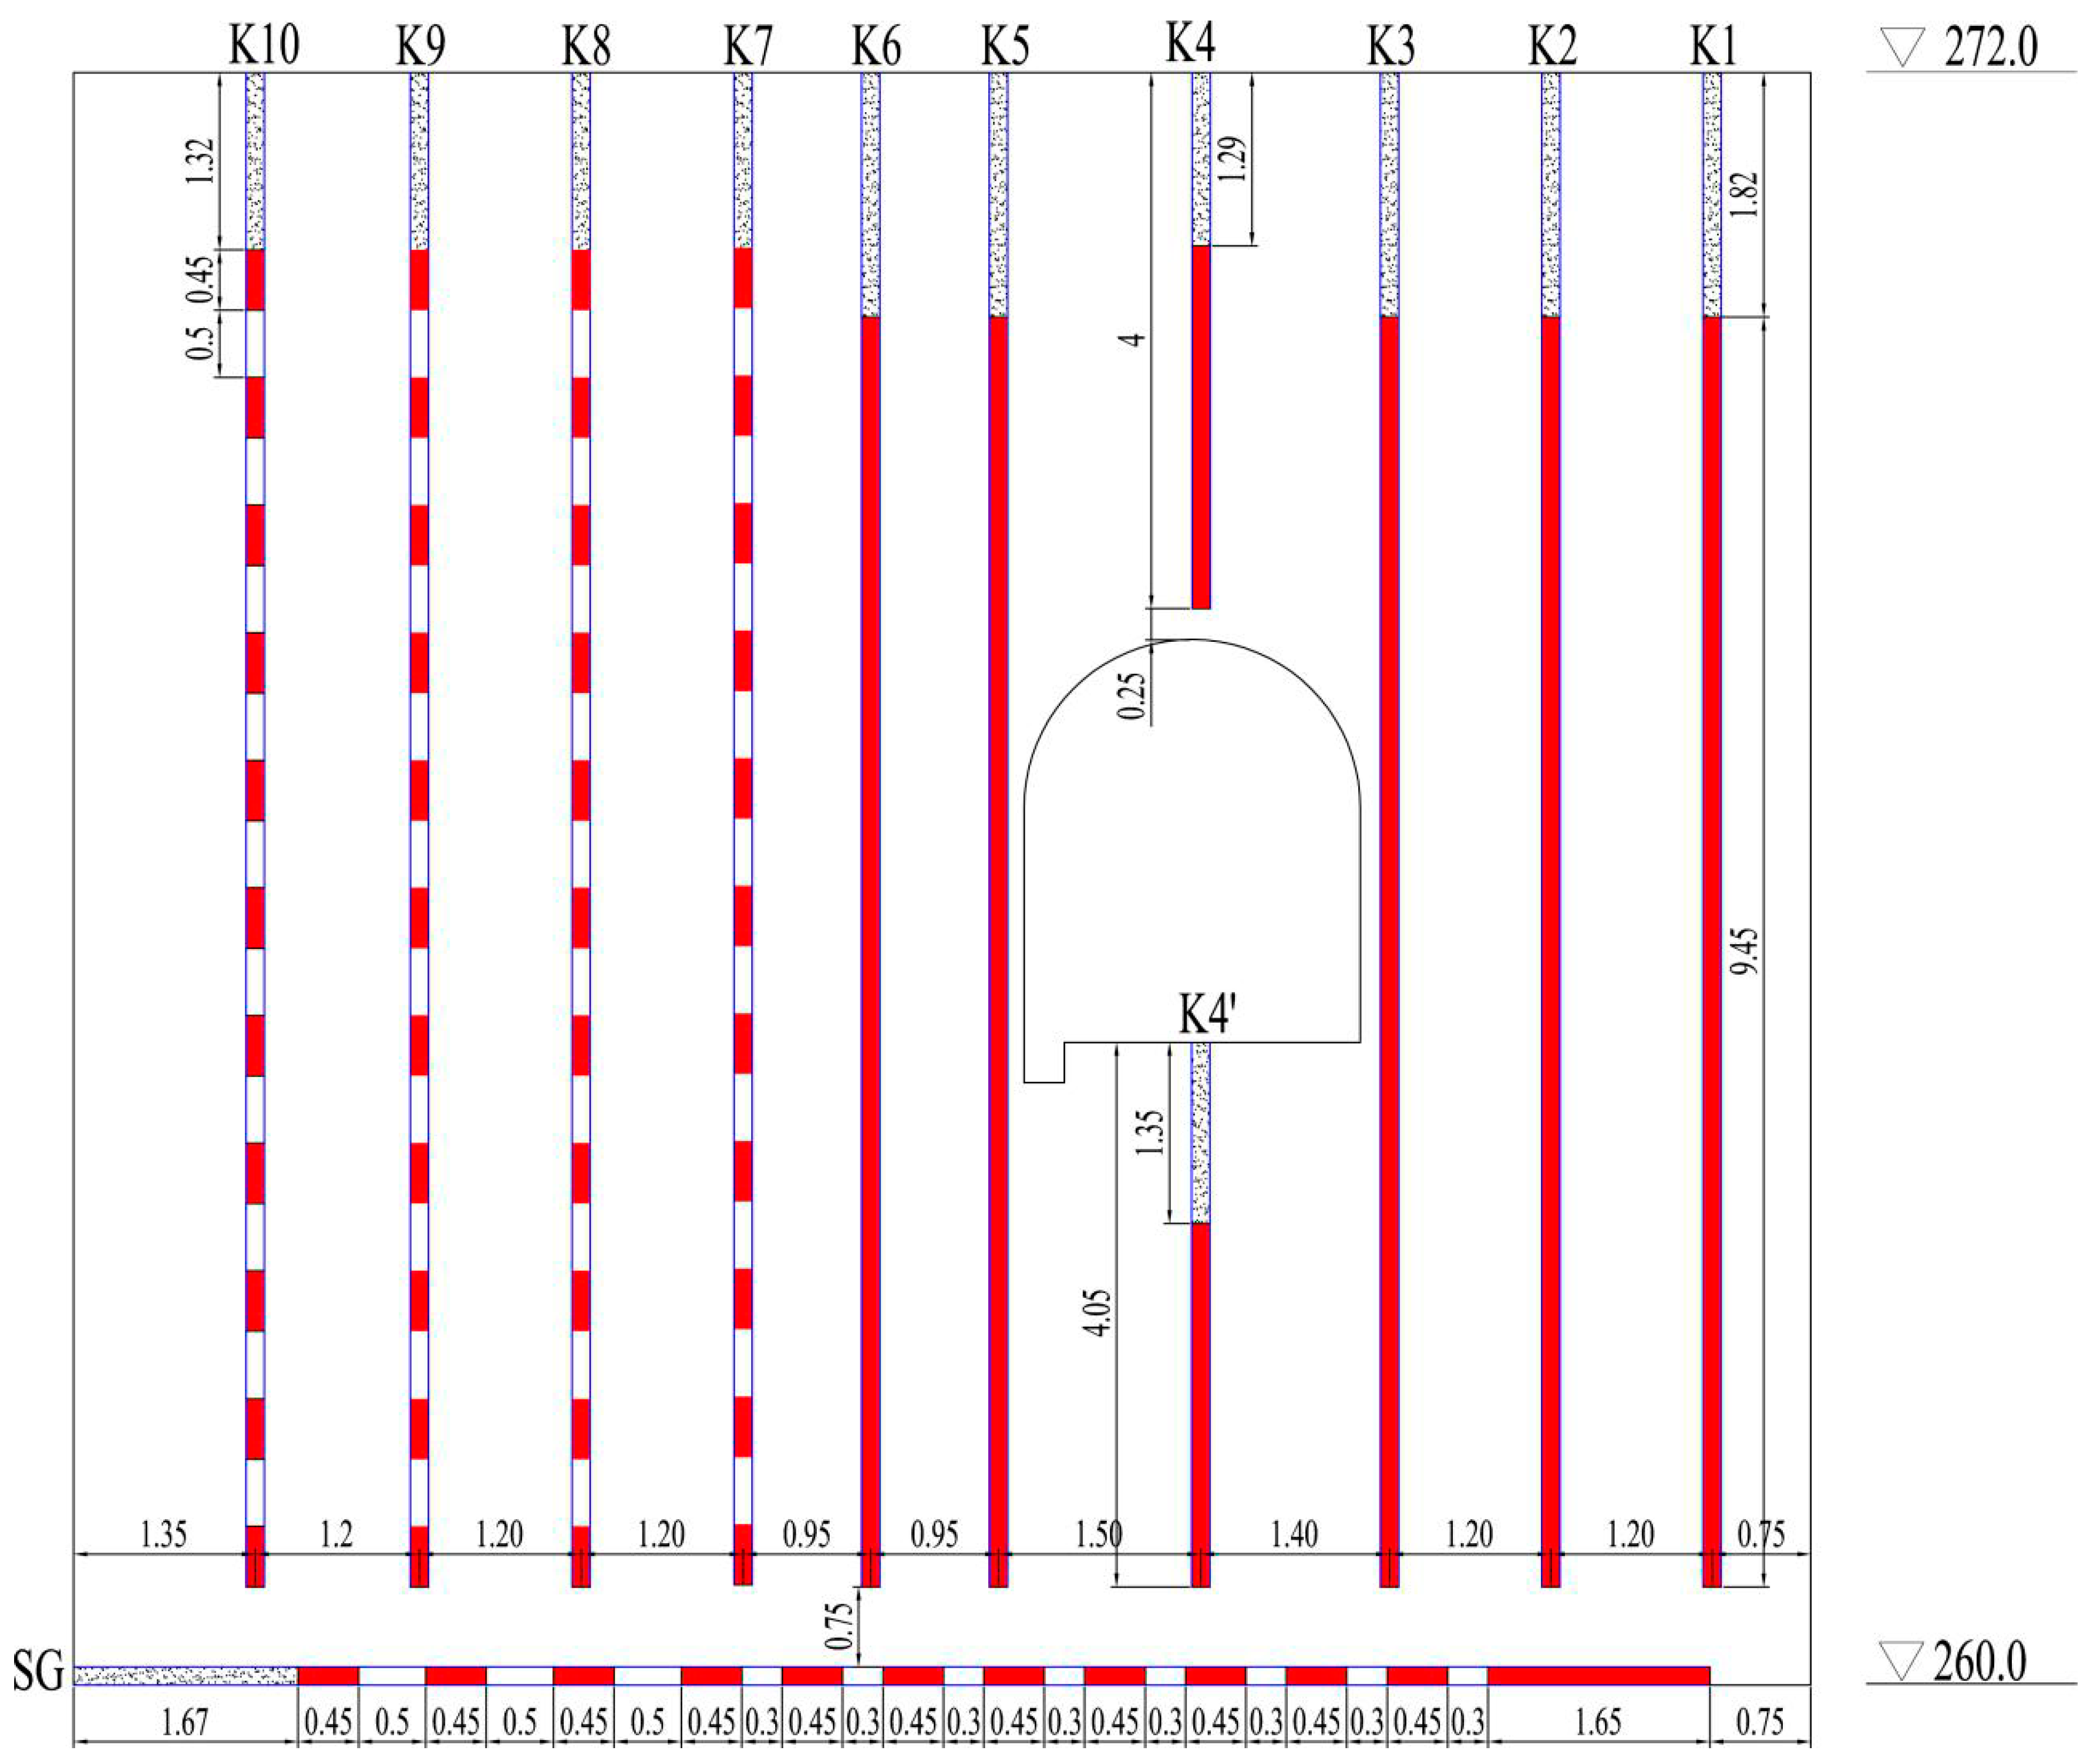
2. Engineering Background

Xiangjiaba hydropower station is the last stage of the Jinsha River cascade hydropower stations with 7.75 million KW installed capacity, located at Yunnan province. The transverse cofferdam of Xiangjiaba hydropower station was one of the three main water-retaining structures for the construction of the cofferdam in the foundation pit of the power station behind the right bank dam, which was built at the end of tailrace canal, as shown in Figure 1. The transverse cofferdams were closed to the curtain grouting, water retaining gate, and powerhouse in the upstream direction. The right guide wall of the stilling basin was on the left, and the desilting tunnel of the underground power station was on the right (Figure 2). All of these adjacent structures were extremely sophisticated, so they had strict requirements for blast-induced vibration.
The transverse cofferdam consisted of four parts: retaining wall, safeguard structure, road widening section, and impervious cofferdam, respectively (Figure 3). The retaining wall was masonry characterized by steps with a slope of 1:0.75 and about 6069 m3, the safeguard structure was a plain concrete (PC) structure of about 753 m3, the road widening was a PC structure of about 19,623 m3, and the impervious cofferdam was a roller compacted concrete (RCC) structure of about 11,278 m3. The axis length, height, and width of the cofferdam were 126 m, 25.2 m, and 12 m, respectively.

3. Blast Design and Monitoring of Vibration
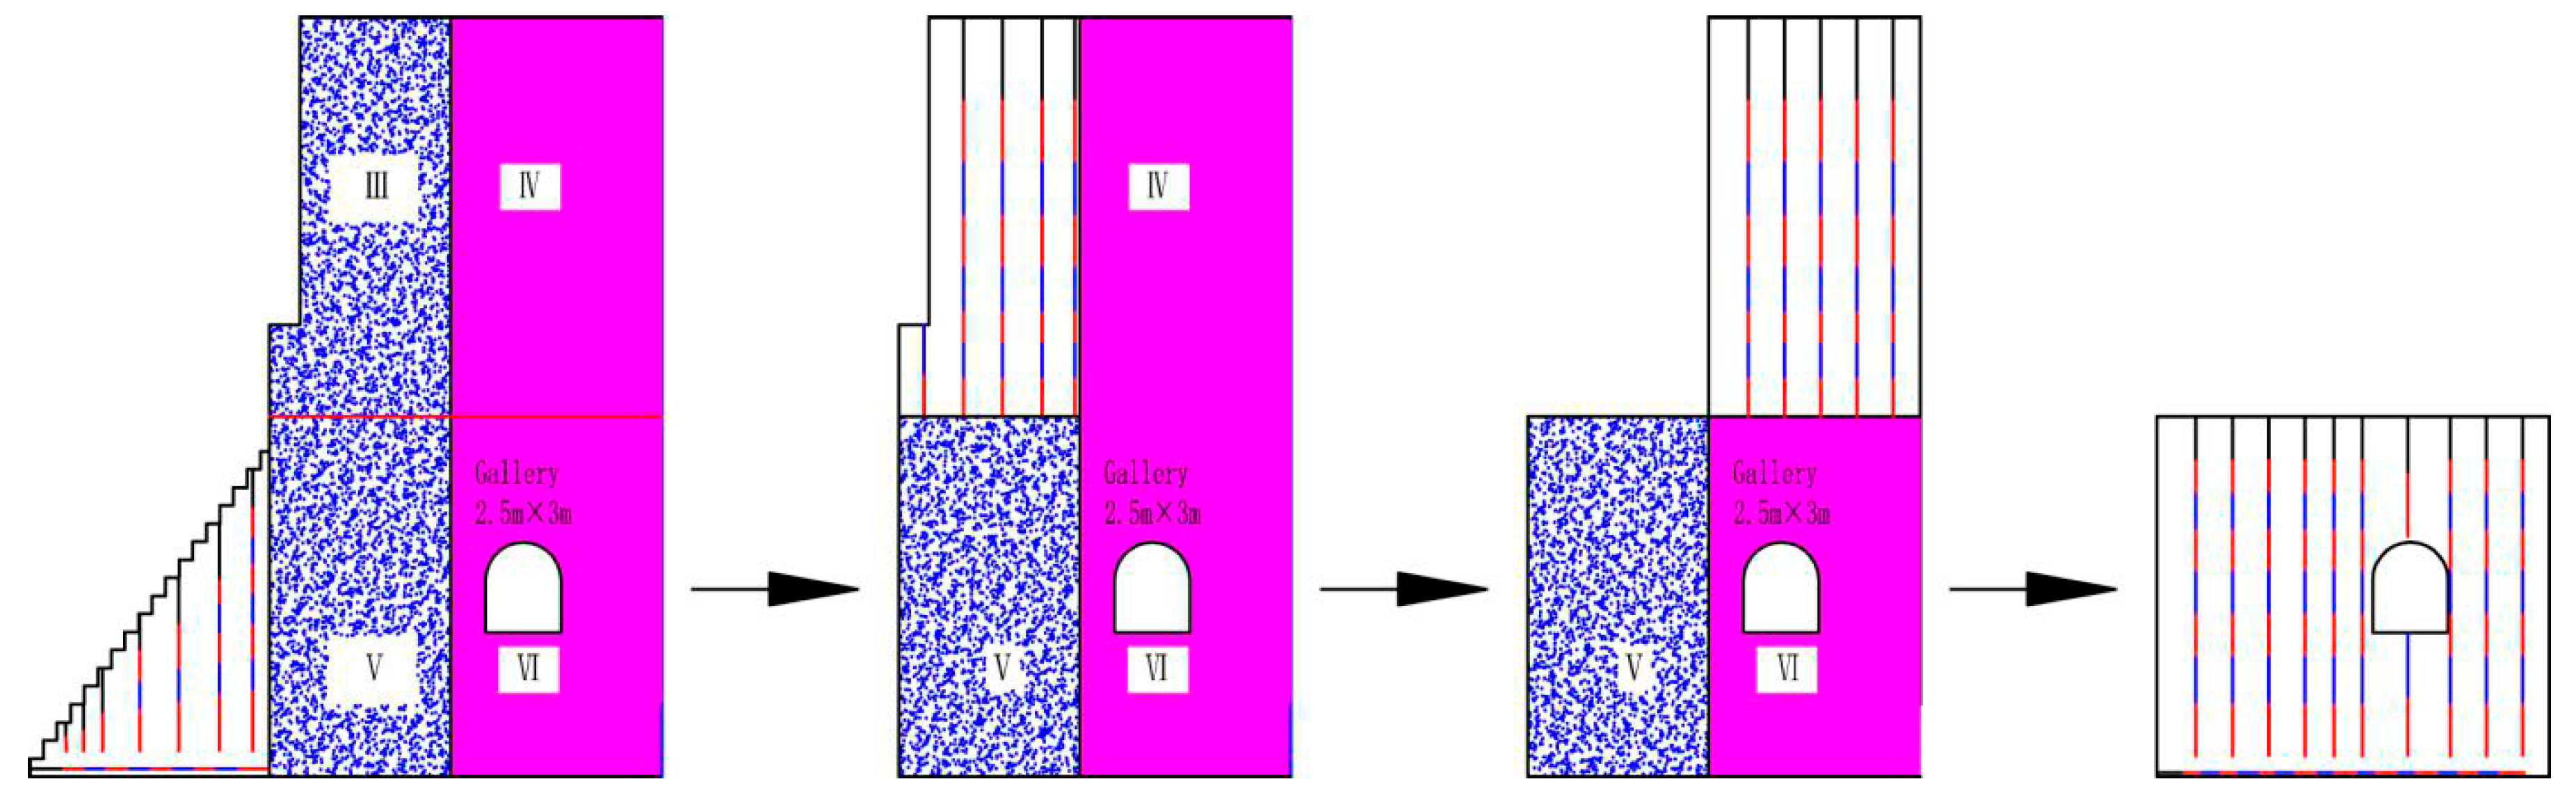
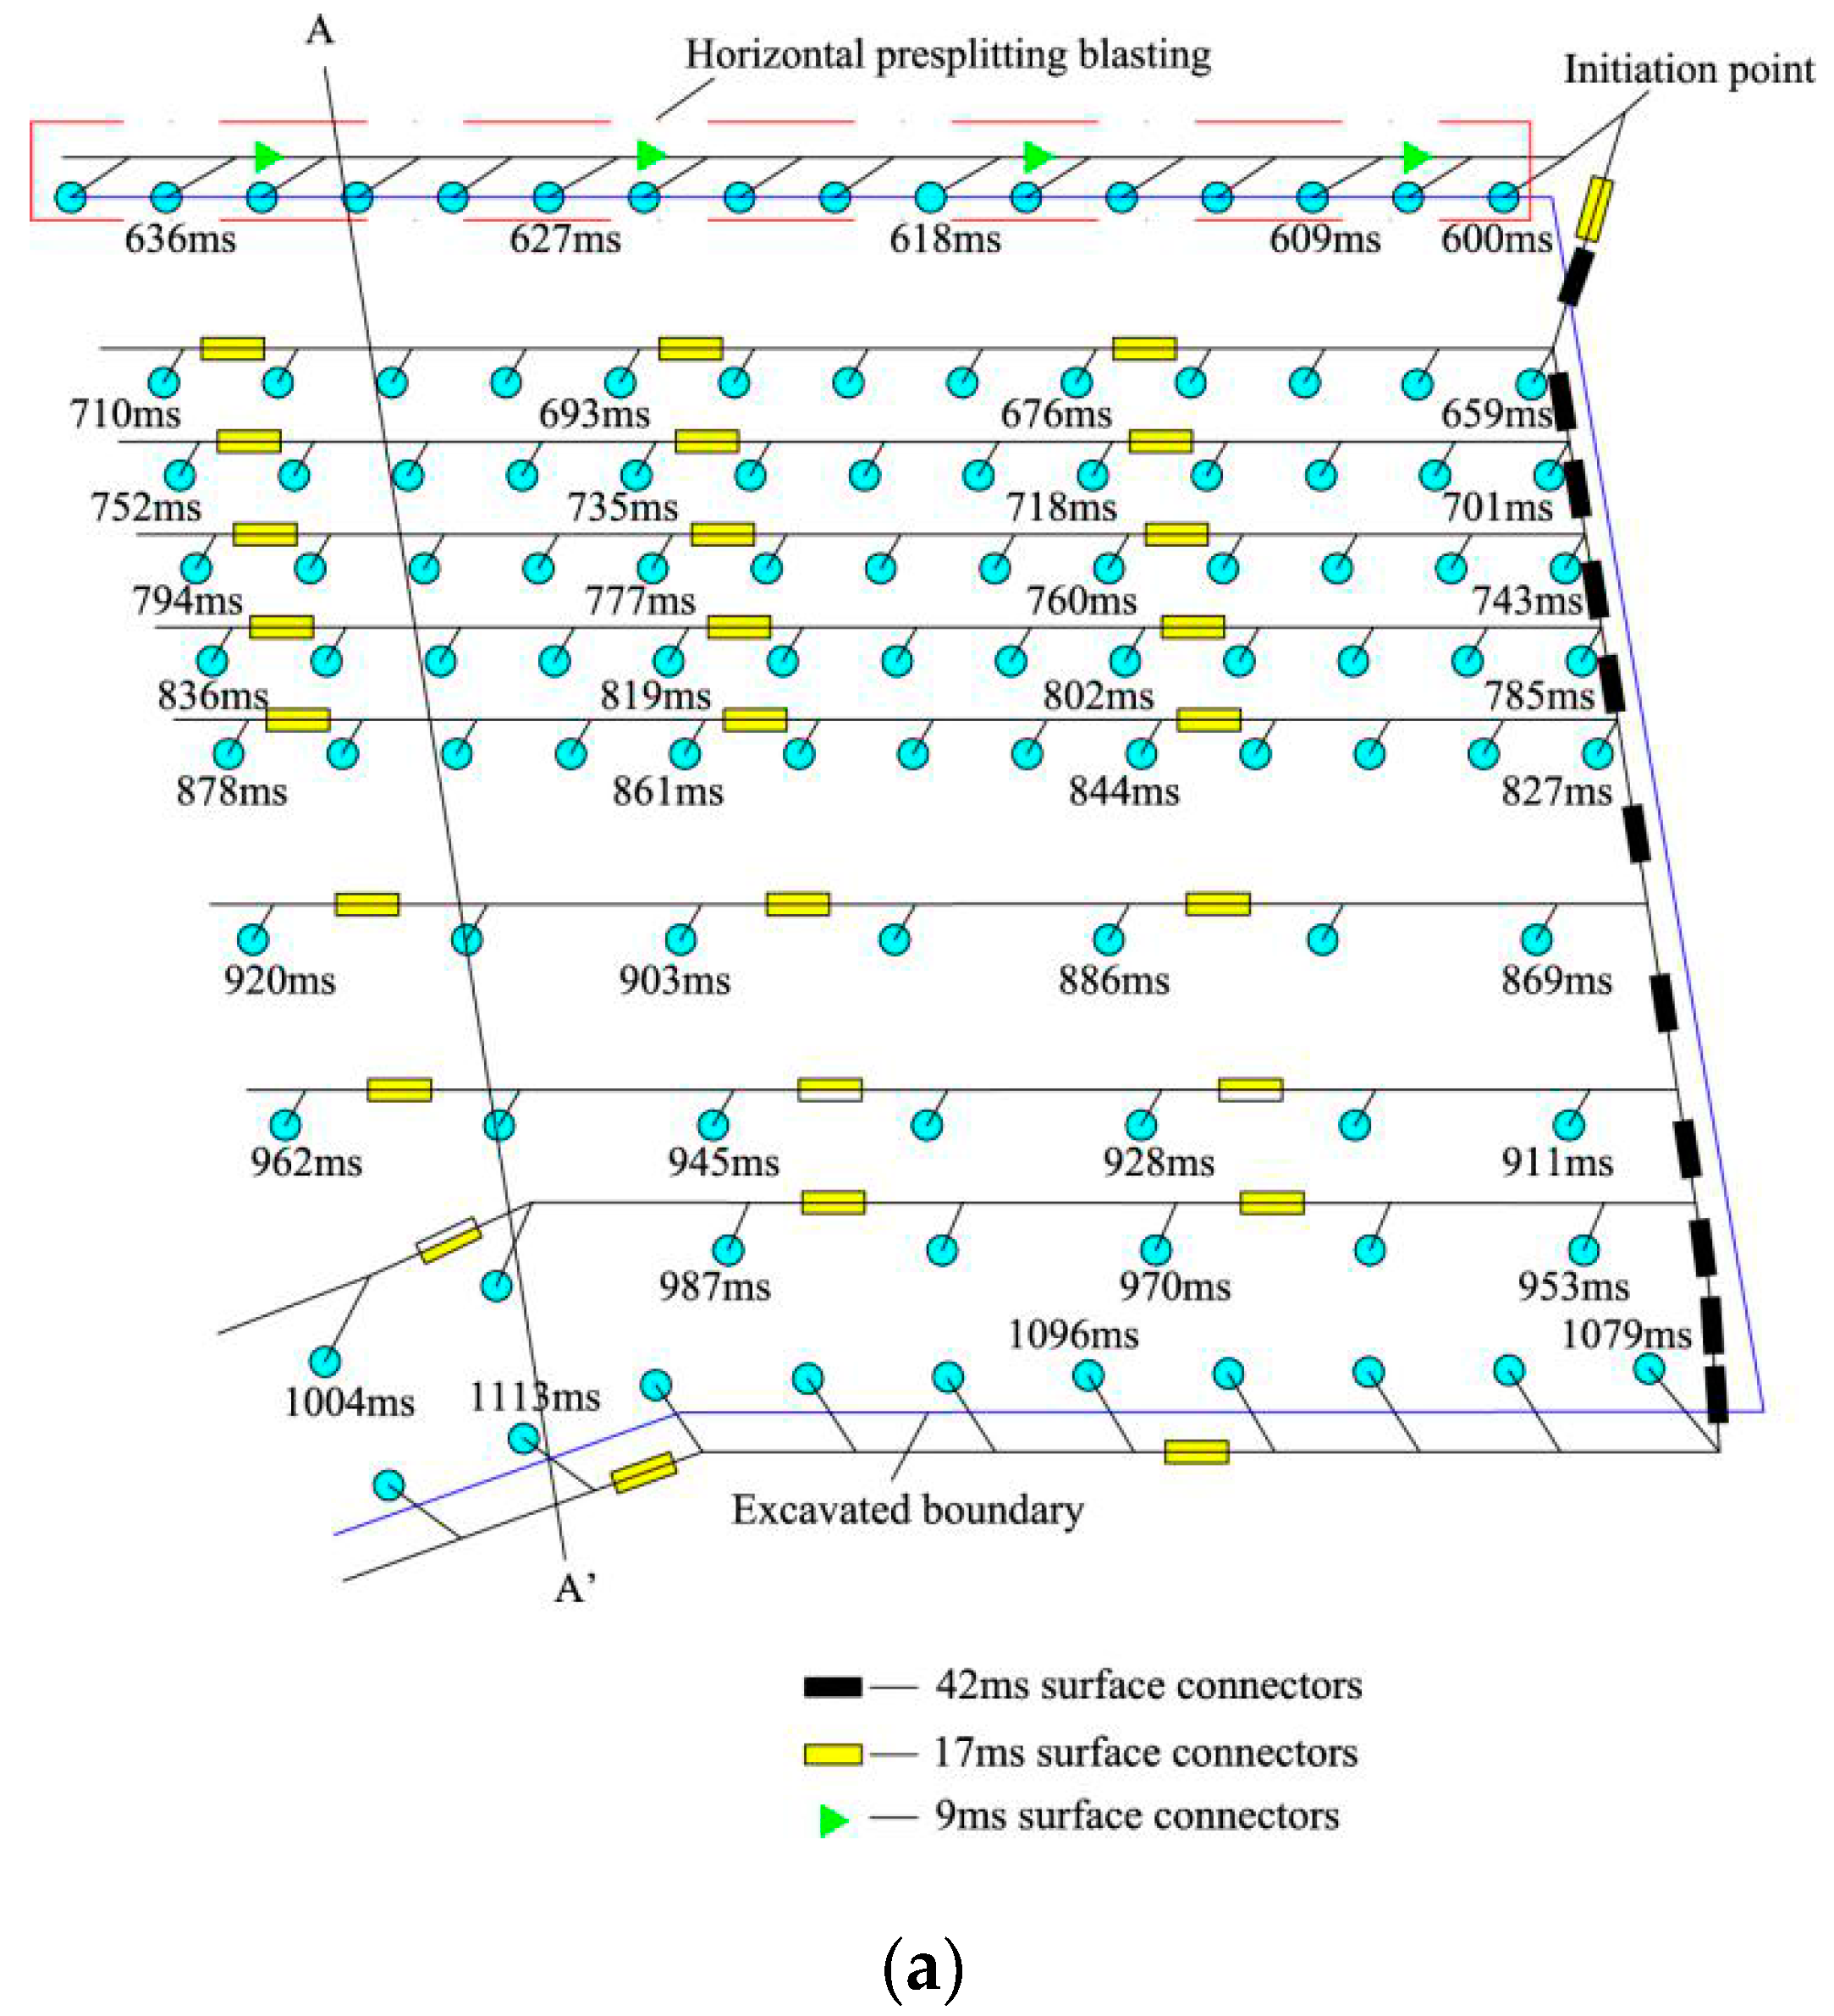
3.1. Blast Design

Considering that the surrounding environment of the cofferdam was complex, it was completely demolished within five steps. Firstly, region II was demolished by mechanical crushing. The rest was demolished by blasting in turn as shown in Figure 4. Of special note was that the economic section was conformed at 272 m elevation due to land blasting above the economic section. In order to prevent the impact of water pressure, underwater blasting was adopted under the economic section except for regionI. In addition, explosives charge weight per delay had been accurately designed to control blast-induced vibration.
All regions contained deep hole blasting, pre-splitting blasting, and cushion blasting. Besides this, region I contained shallow holes below 5 m. The depth of drilling holes varied from 1.5 m to 19.5 m. To control the influence of blast-induced vibration, the diameter of the shallow holes below 5 m depth was 42 mm, while the deep hole over 5 m depth was 76 mm. According to the results of the blasting demolition of the longitudinal cofferdam of Xiangjiaba hydropower station [17], the recommended explosive unit consumption (EUC) in land blasting was 0.50–0.60 kg/m3.
To ensure the safety of adjacent structures, the total explosives charge weight of region I, region III, and region IV were 2337.6 kg, 2578.9 kg, and 4724.8 kg, respectively. The shallow holes were charged with Φ32 mm rock emulsion explosive, while the deep holes were charged with Φ50 mm rock emulsion explosive. The density, detonation velocity, and minimum distance of sympathetic explosion of rock emulsion explosive was 1140 kg/m3, 4600 m/s, and 6 cm respectively. Accordingly, the maximum explosives charge weight per hole was controlled at 12 kg, 16 kg, and 18.4 kg by air-decked charging. In particular, the explosives were fixed on bamboo slices to ensure calculated spacing between explosive decks in the blasthole. The surface connectors with three delay times (9 ms, 17 ms, and 42 ms) were used in initiation network, and detonating cord was additionally connected to all explosive decks to ensure detonation transfer between all explosive decks. The typical blast network structure diagram and charge structure diagram are shown in Figure 5.

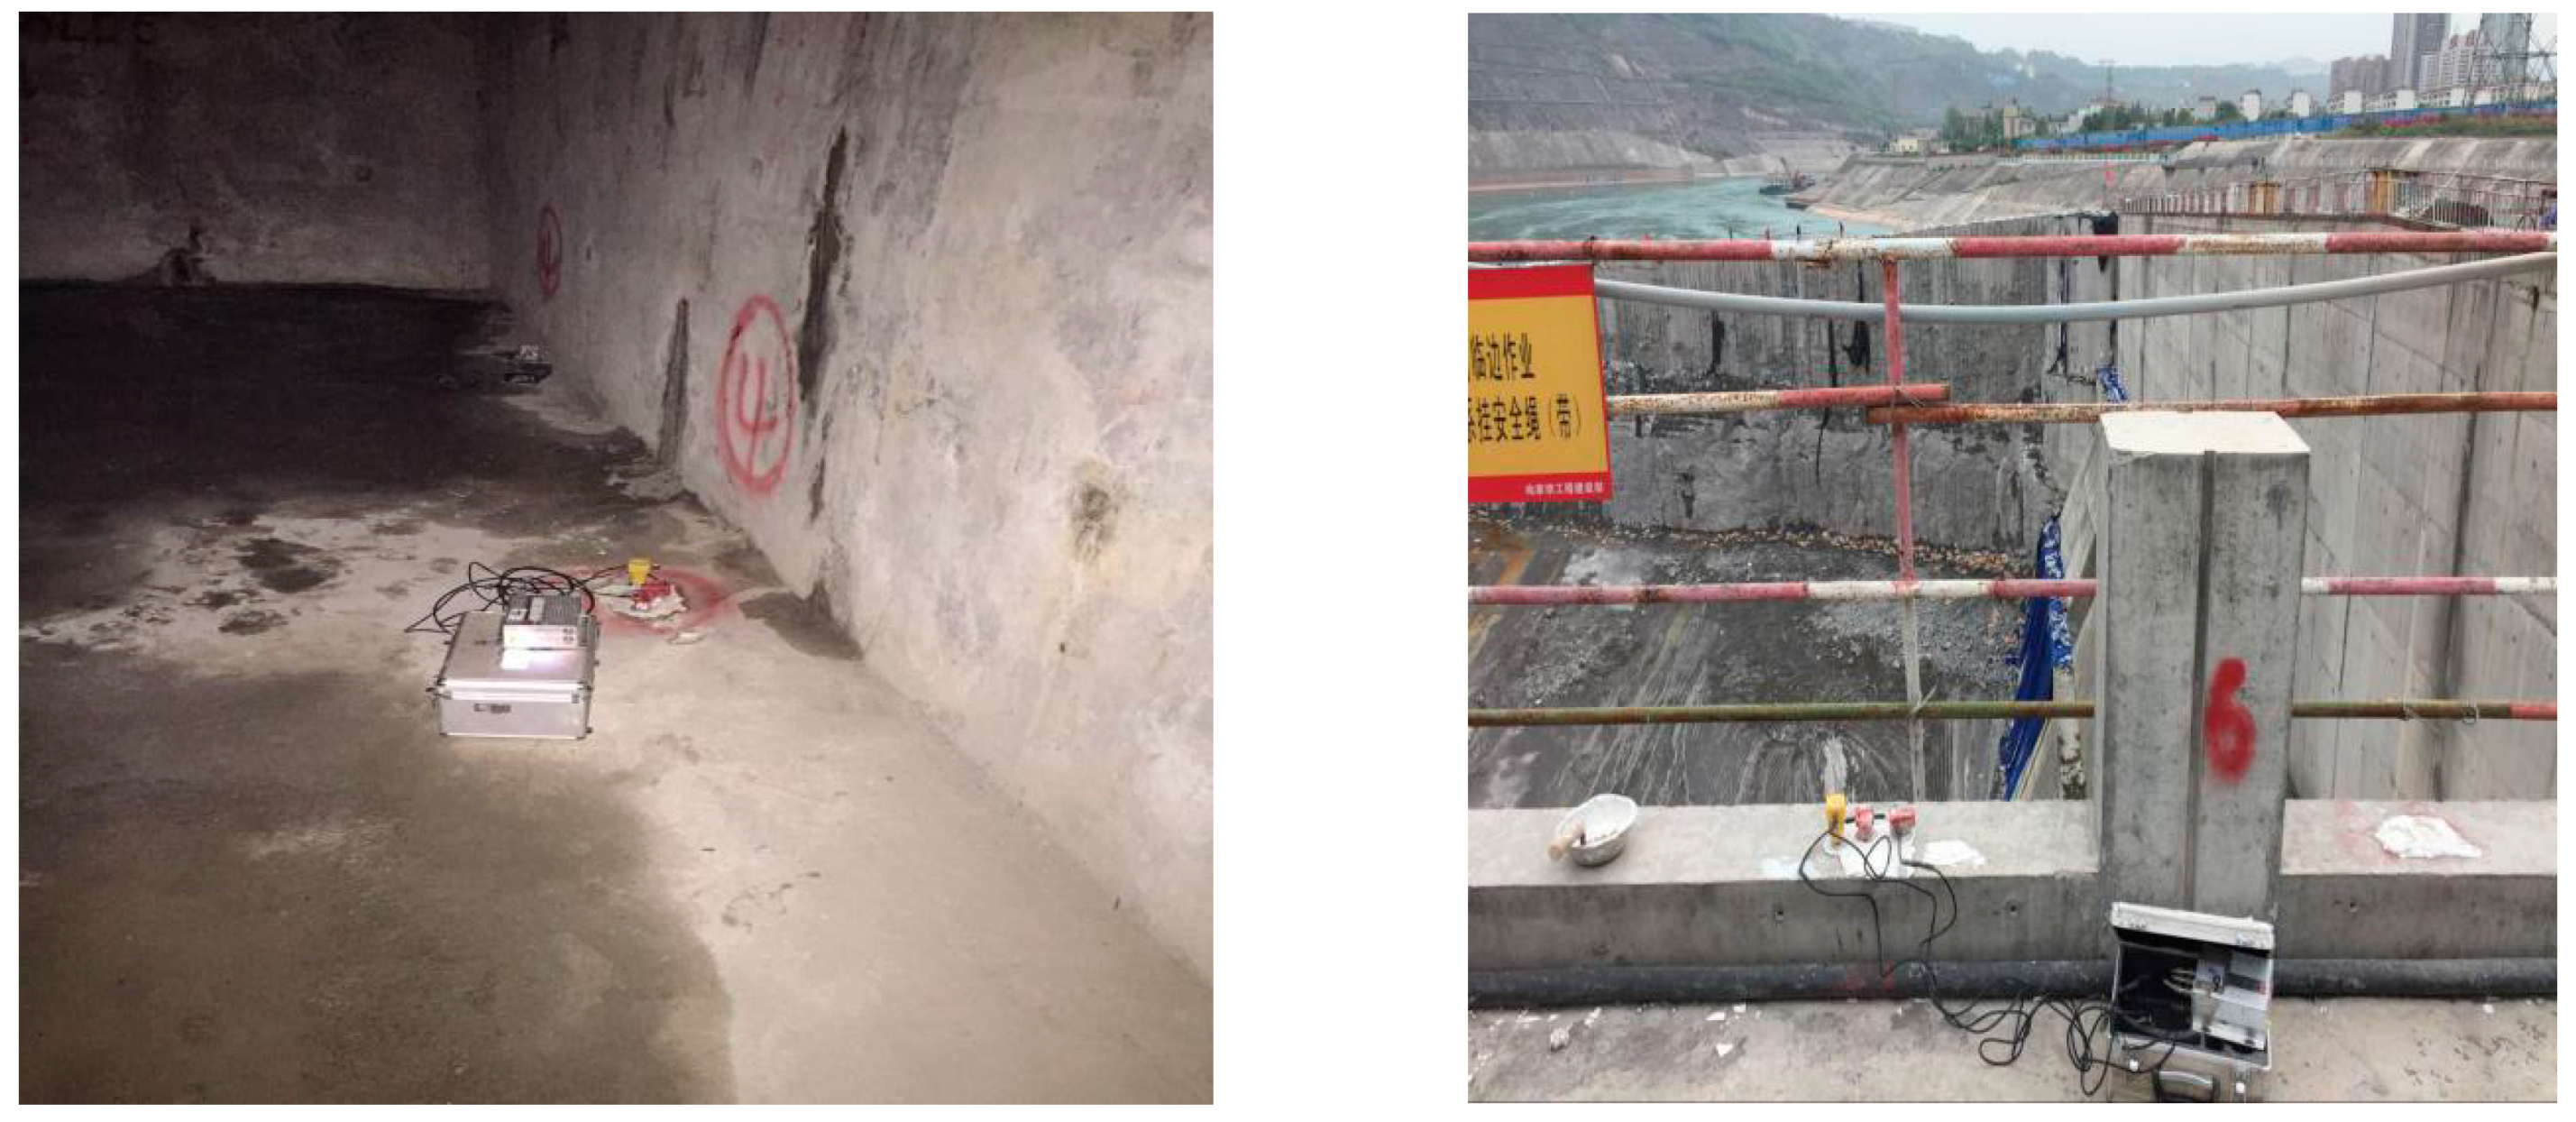
3.2. Monitoring of Vibration

There were many precise instruments and building structures that needed to be protected in the vicinity of the blasting area, such as the main generator room, curtain grouting area, tailgate pier, etc. Ubox-5016 piezoelectric vibration velocity sensors were used. The main performance parameters of the sensors were as follows:
(1)
Maximum sampling rate: 200 ksps/channel.
(2)
Analog input channel: 1–4 channels/each device, multiple sets can be expanded in parallel.
(3)
Acquisition mode: multi-channel parallel acquisition.
(4)
Input signal bandwidth: 0–20 KHz.
(5)
Dc accuracy error: ≤±0.5%.
(6)
Amplitude range: 0.001–35.5 cm/s.
Nine measurement points were arranged to monitor blast-induced vibration data in longitudinal, tangential, and vertical directions, as shown in Figure 2. On-site monitoring data of blast-induced vibration are shown in Figure 6.
Altogether 1386 holes were detonated in land blasting. A total of 57 blast-induced vibration data were recorded as shown in Table 1. Among them, 18 measured data were in region I, 18 measured data were in region III, and 21 measured data were in region IV. The PPV in region I was 8.74 cm/s with an explosive charge weight per delay of 26.4 kg and total explosives charge weight of 2337.6 kg, at a distance of 15 m away from explosion source. In region III, the PPV was 7.03 cm/s and the explosives charge weight per delay and total explosives charge weight were 28 kg and 2578.9 kg at 18 m from explosion source. The PPV in region IV was 5.15 cm/s. The total explosive charge weight was 4724.8 kg with an explosive charge weight per delay of 28.5 kg at 20 m from explosion source. The PPV in the x (longitudinal), y (transversal), and z (vertical) direction can be found in Figure 7.
Sadovsky’s empirical formula is widely used to show the attenuation law of PPV [18]. Accordingly, PPV is related to the distance between the monitoring point and blast source R, and the explosives charge weight per delay Q.
P P V = k ( S D ) α
where k is a coefficient in blast design, S D = R / Q 1 / 3 is the scaled distance (m/kg1/3), R is the distance between the blast source and the monitoring point (m), Q is the explosives charge weight per delay (kg), and α is the attenuation coefficient.
According to the blast-induced vibration measured values in Table 1, PPV in different regions can be expressed as Figure 8.

4. Discussions

Generally speaking, the main difference between underwater blasting and land blasting is the medium of solid contact surface, involving water and air. According to the continuity condition of interface and Newton’s third law [19], the reflection and transmission of stress wave produced by a solid medium blast would occur at the interface of two kinds of medium:
σ r = σ i ( ρ 2 C P 2 ρ 1 C P 1 ) / ( ρ 2 C P 2 + ρ 1 C P 1 ) = F σ i
where ρ 1 and ρ 2 are densities of different media (kg/m3), C P 1 and C P 2 are p-wave propagation velocities of different media (m/s), σ r , σ i are stress of reflected wave and incident wave in solid medium, and F is the reflection coefficient.
When blasting on land, the acoustic impedance of air ( ρ 2 C P 2 ) can be approximated to 0; that is,
σ r 1 = F σ i 1
When blasting underwater, ρ 2 C P 2 < ρ 1 C P 1 , F < 0 , the reflected wave stress is
σ r 2 = F σ i 2
The underwater solid medium is subjected to pre-stress, its tensile strength increases, and the dynamic tensile strength coefficient K is
K = ( [ σ ] + 0.01 h ) / [ σ ]
where [ σ ] is dynamic tensile strength (MPa) and h is the depth of water (m).
Therefore, to achieve the same blast effect for the same solid medium both on land and underwater, the following conditions should be satisfied:
σ r 1 = K σ r 2 ,
σ i 1 = F σ i 2 / K
Because the pressure of shock wave in solid medium tends to attenuate during its propagation,
σ i = P 0 / R α
R α = ( R / R e ) α
where P 0 is the initial shock wave pressure produced by explosion (MPa), R α is the proportional distance, R e is the cartridge radius (m), α is the pressure attenuation coefficient of solid medium, and α = 1 ~ 3 .
Substituting Equation (8) into Equation (9) finds,
R 2 α = F R 1 α / K
R 1 α = ( R 1 / R e 1 ) α = R 1 α / ( β Q 1 1 / 3 ) α
R 2 α = ( R 2 / R e 2 ) α = R 2 α / ( β Q 2 1 / 3 ) α
when R 1 = R 2 .
Substituting Equation (11) and (12) into Equation (10) finds,
Q 2 / Q 1 = ( K / F ) 3 / α = ( 1 + 0.01 h / [ σ ] ) 3 / α F 3 / α
where Q 1 and Q 2 are explosive unit consumption in land and underwater blasting (kg/m3), and β is the volume conversion constant.
According to the characteristics of concrete structures in different regions, the parameters of underwater blasting can be accurately calculated as shown in Table 2. Water pressure affects fracture radius when emulsion explosive explodes in concrete under water: the deeper the water is, the smaller the fracture radius is. Therefore, compared with land blasting, in order for the underwater blasting on same solid medium to have satisfactory effectiveness there should be an increase of 1.69 times and 1.91 times the explosives in region V and VI, respectively. The EUC would be better if increased from 0.53 kg/m3 and 0.61 kg/m3 to 0.89 kg/m3 and 1.16 kg/m3 in regions V and VI, as shown in Figure 9.
Naturally, the blast-induced vibration velocity of underwater blasting is smaller than that of land blasting due to the attenuation of water fluctuation [20].
Considering that region V and region VI were composed of PC and RCC, which were located in shallow water, the charge weight per delay should meet the following formulas:
P P V limit max { P P V x , P P V y , P P V z }
that is:
P P V limit ( P C ) max { 35.23 [ S D ] 1.31 , 198.09 [ S D ] 1.84 , 74.12 [ S D ] 1.52 }
P P V limit ( R C C ) max { 16.58 [ S D ] 0.95 , 135.03 [ S D ] 1.65 , 27.60 [ S D ] 1.04 }
Variation of maximum charge weight per delay with distance predicted by fitting formula are shown in Figure 10.
Aiming to meet the requirements of each structure for blast-induced vibration, explosives charge weight per delay were calculated by Sadovsky’s empirical formula as shown in Table 3. The maximum explosives charge weight per delay in region V and VI was 61 kg and 27 kg, respectively.
The underwater blasting parameters were designed accurately, hole spacing was 1.4 m, row spacing was 1.2 m, hole depth was 12 m, and the explosives charge weight per hole was 18 kg and 23.4 kg in regions V and VI. The width of the cofferdam was 12 m with 10 rows of drill hole named K1–K10. Among them, K1–K6 rows were arranged in region VI and K7–K70 rows were arranged in region V. The blast network was shown in Figure 11. The total explosives charge weight in region V and VI was 4953 kg and 6934.7 kg, respectively.
Consequently, three holes per delay were charged with 54 kg to decrease blast-induced vibration effectively in region V, while one hole per delay was charged with 23.4 kg except row K4. Row K4 was divided into two parts by the gallery, the upper explosives charge weight was 6.71 kg, and the lower explosives charge weight was 6.69 kg in region VI (Figure 12). Surface connectors of 17 ms were chosen in the whole surface detonation network.
Underwater blasting was carried out with recommended parameters in region V and VI, and blast-induced vibration was monitored at point 1–9. Among them, point 7–9 were too far from the source explosion to measure any data. The maximum blast-induced vibration velocity in region V and VI are shown in Figure 13 and PPVmax was 7.65 cm/s and 4.21 cm/s, respectively. All the measured values were less than the maximum allowable values. Mean percent error (MAPE) was 13.92% and 17.26% after analyzing the prediction values and measured values of blast vibration velocity by Equation (17). The results showed that the underwater blasting parameters obtained by land blasting test can meet the blast requirements.
M A P E = ( 1 n i = 1 n | y i y i y i | ) × 100 % ,
where M A P E is the mean percent error, y i is the measured value, y i is the predicted value, n is the numbers of data.

5. Conclusions

(1)
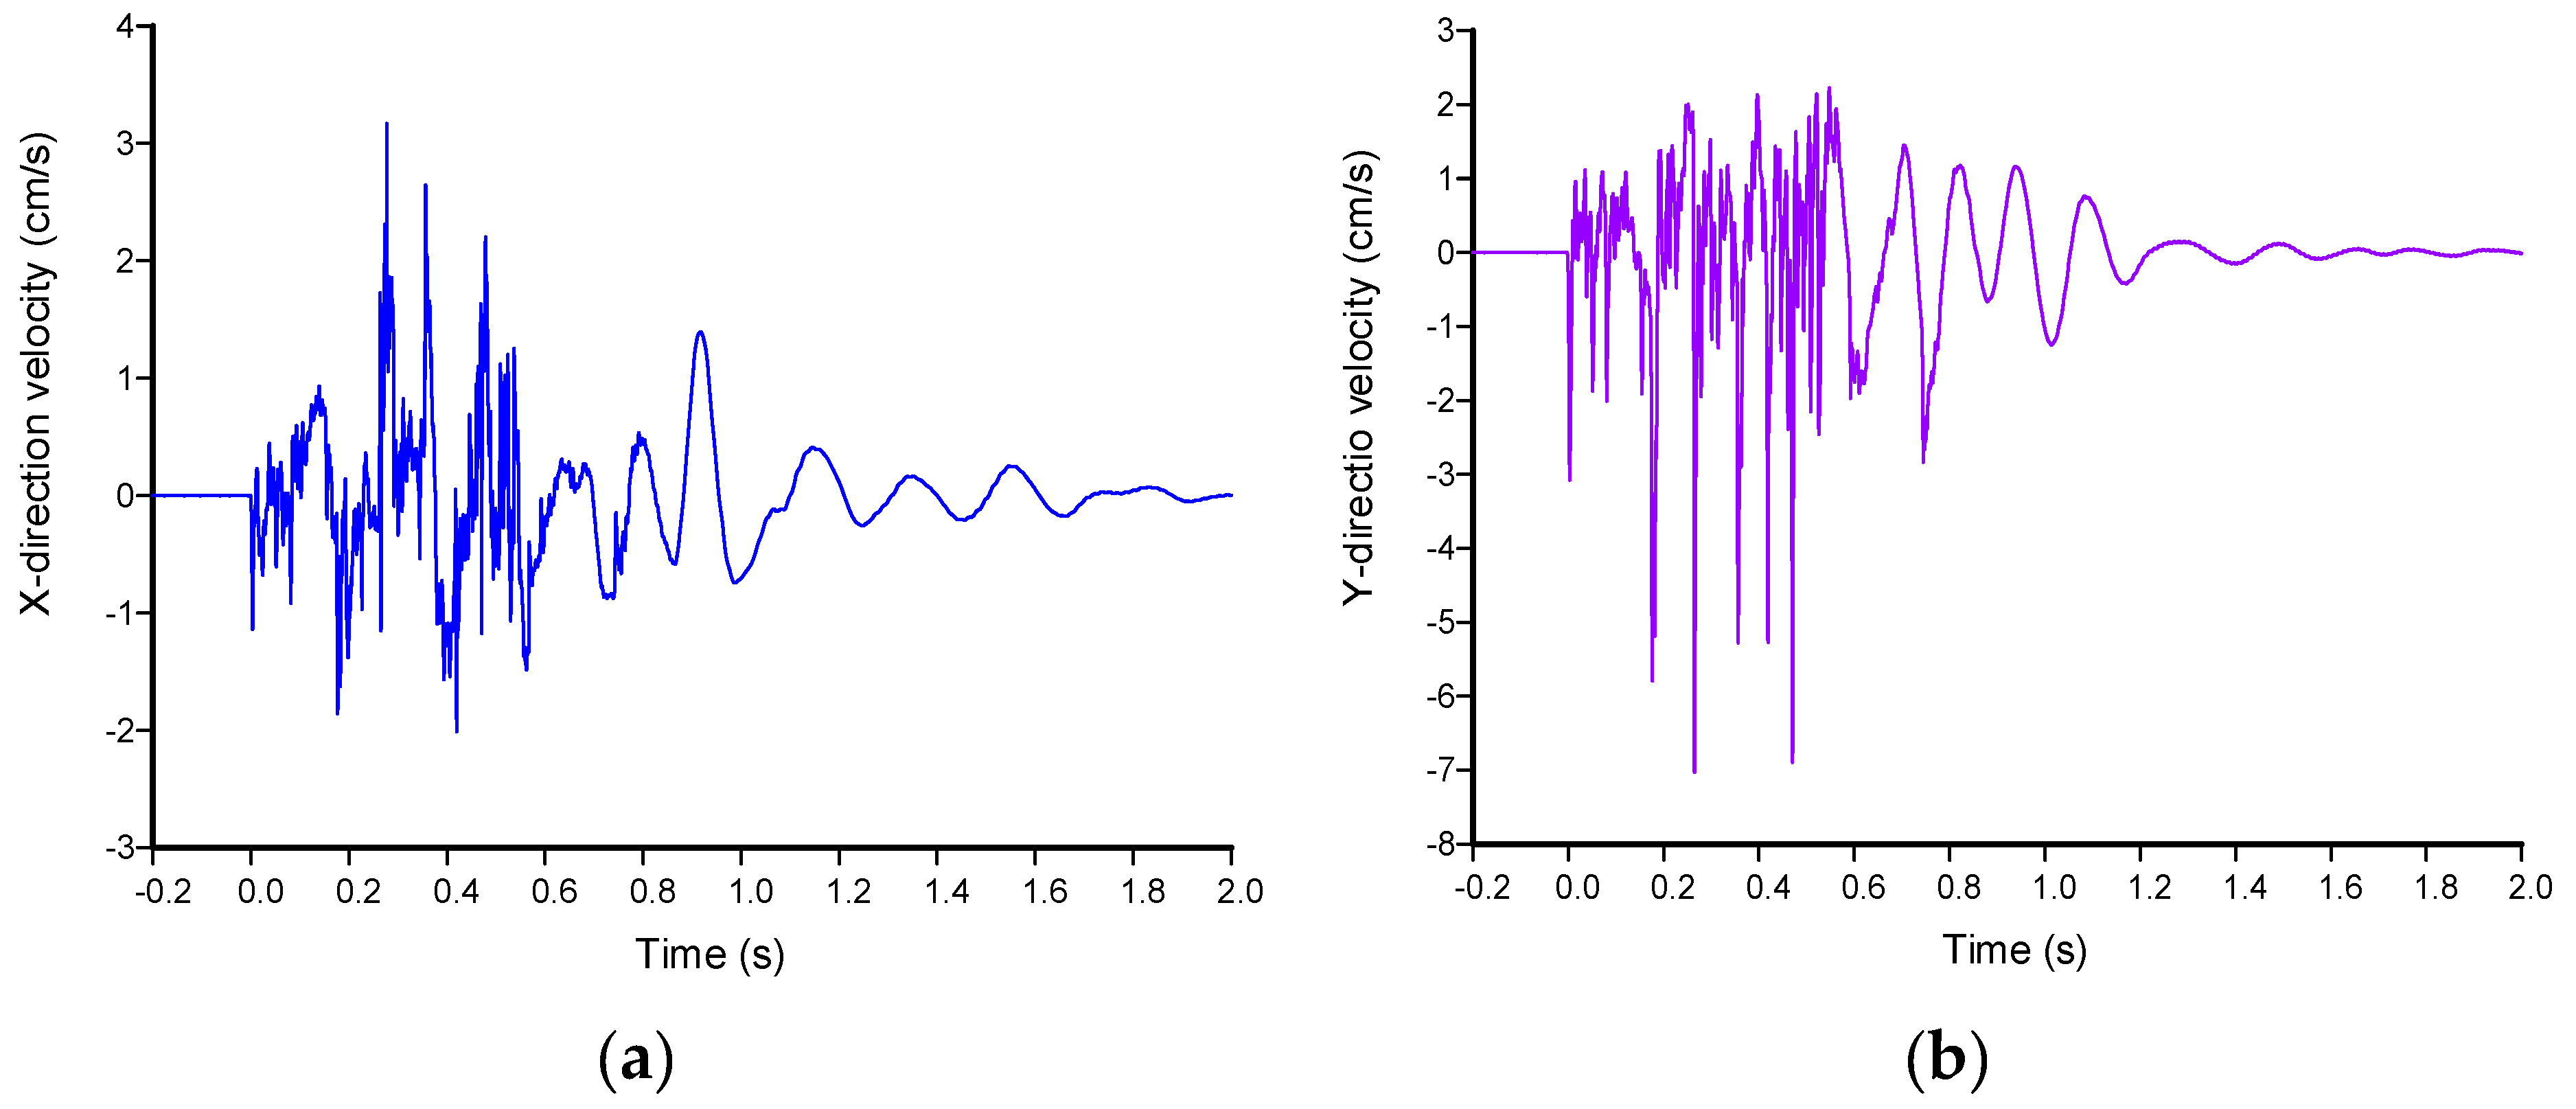
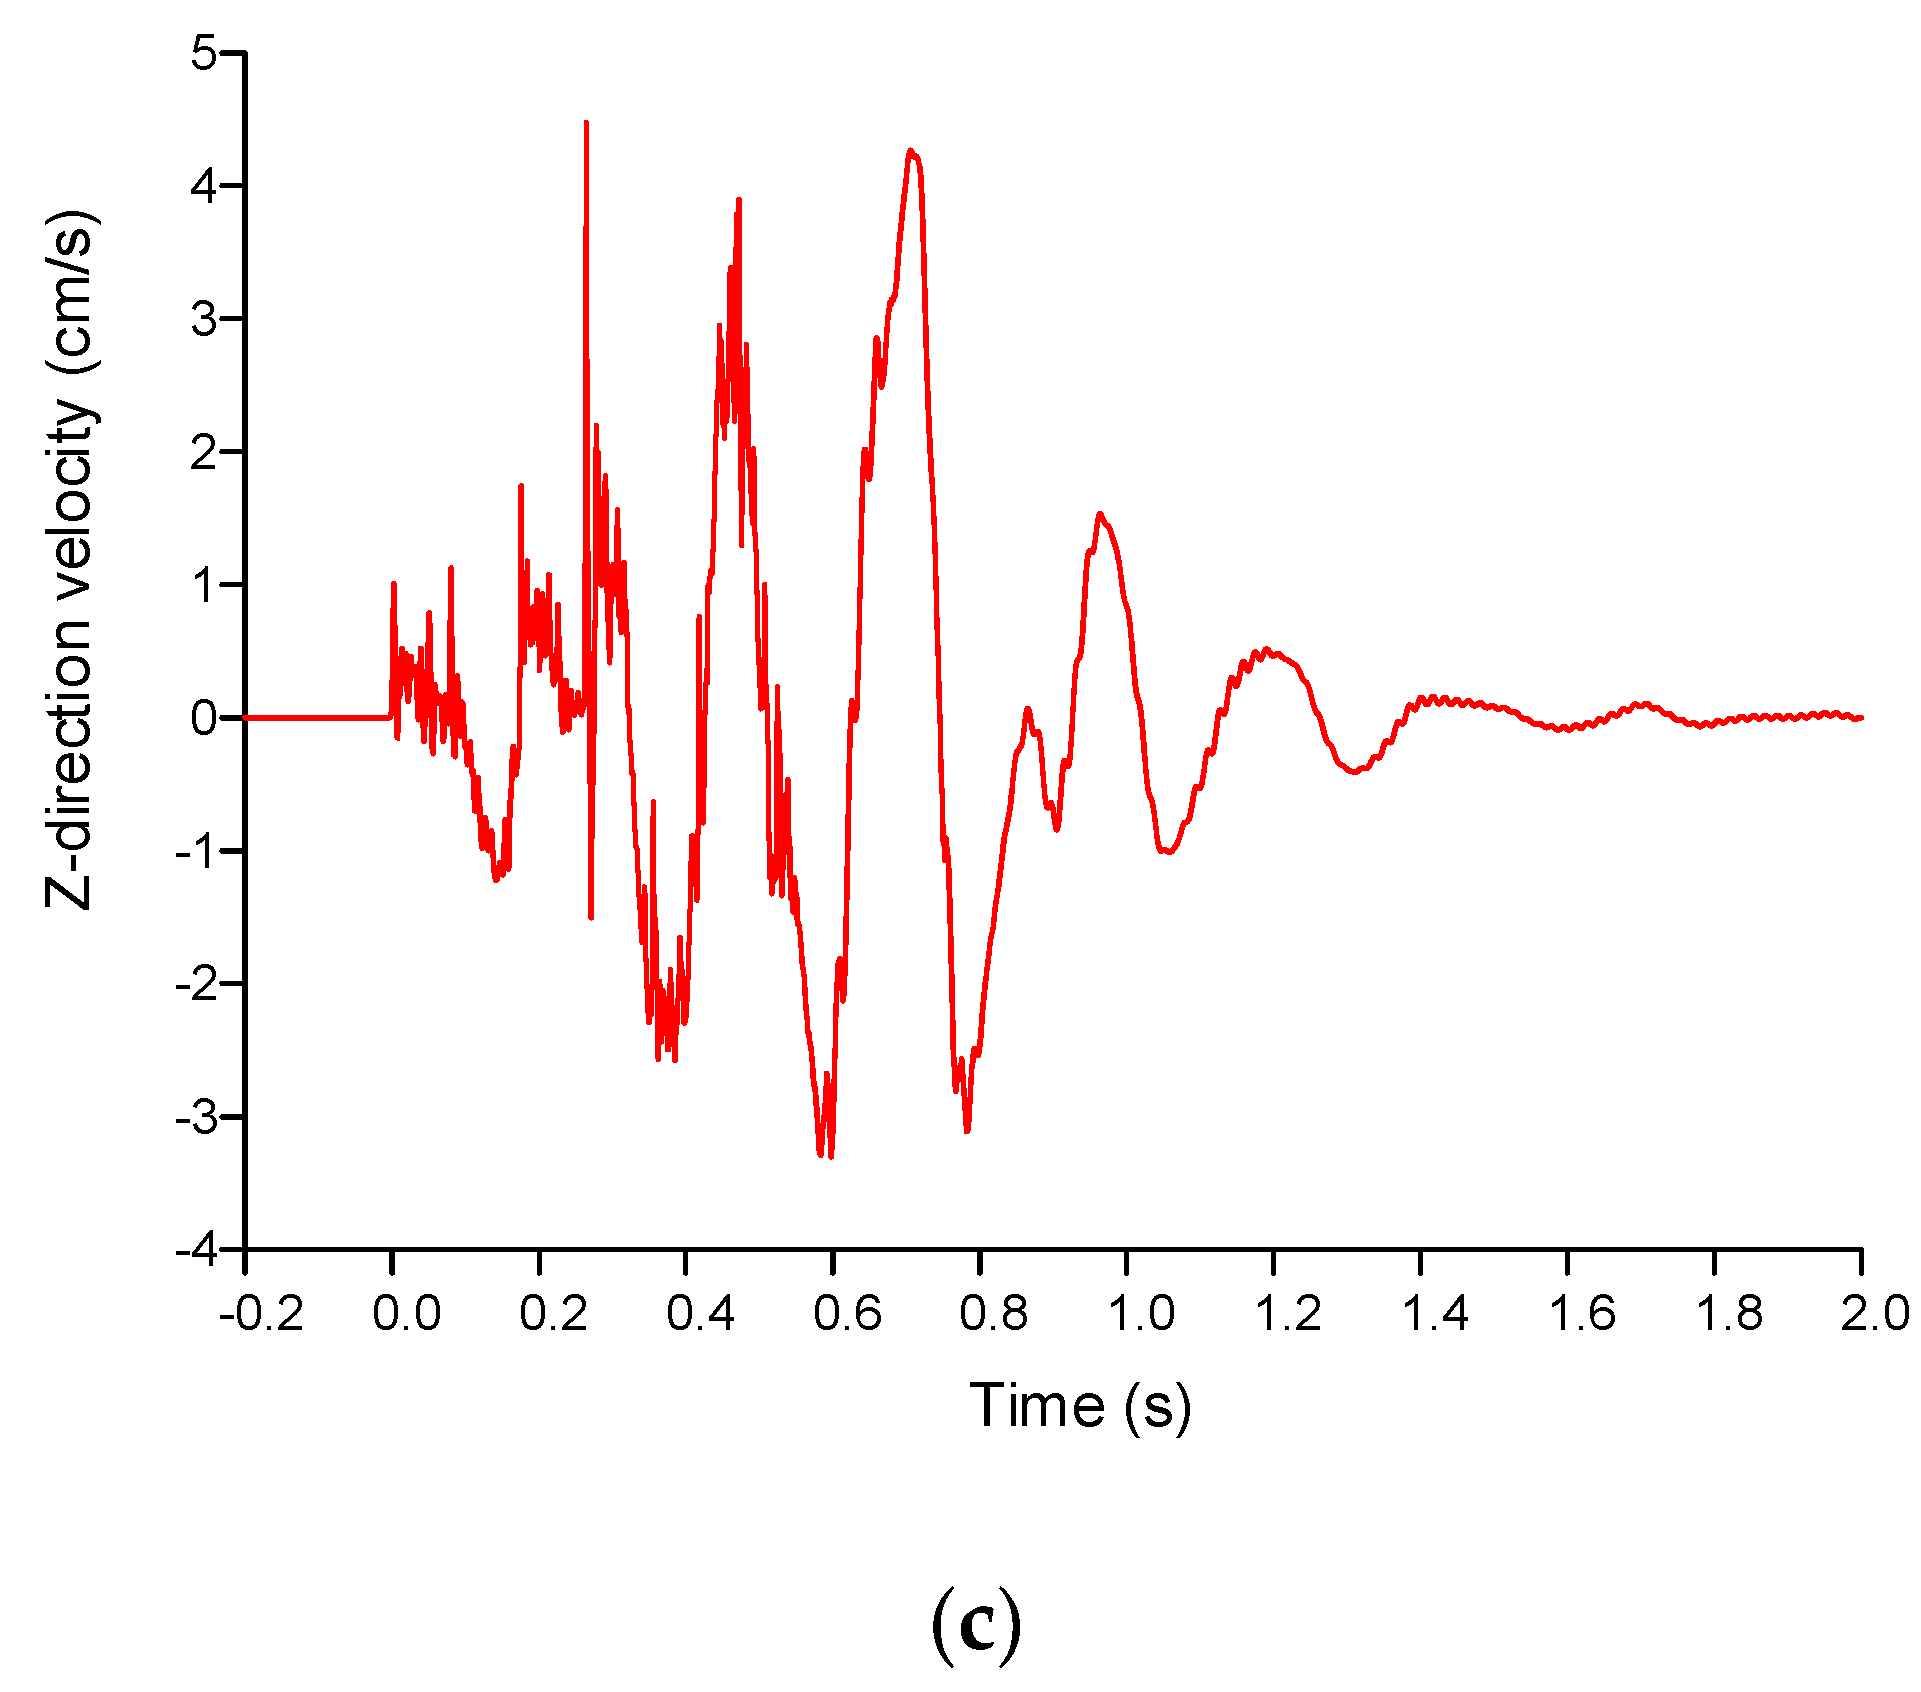
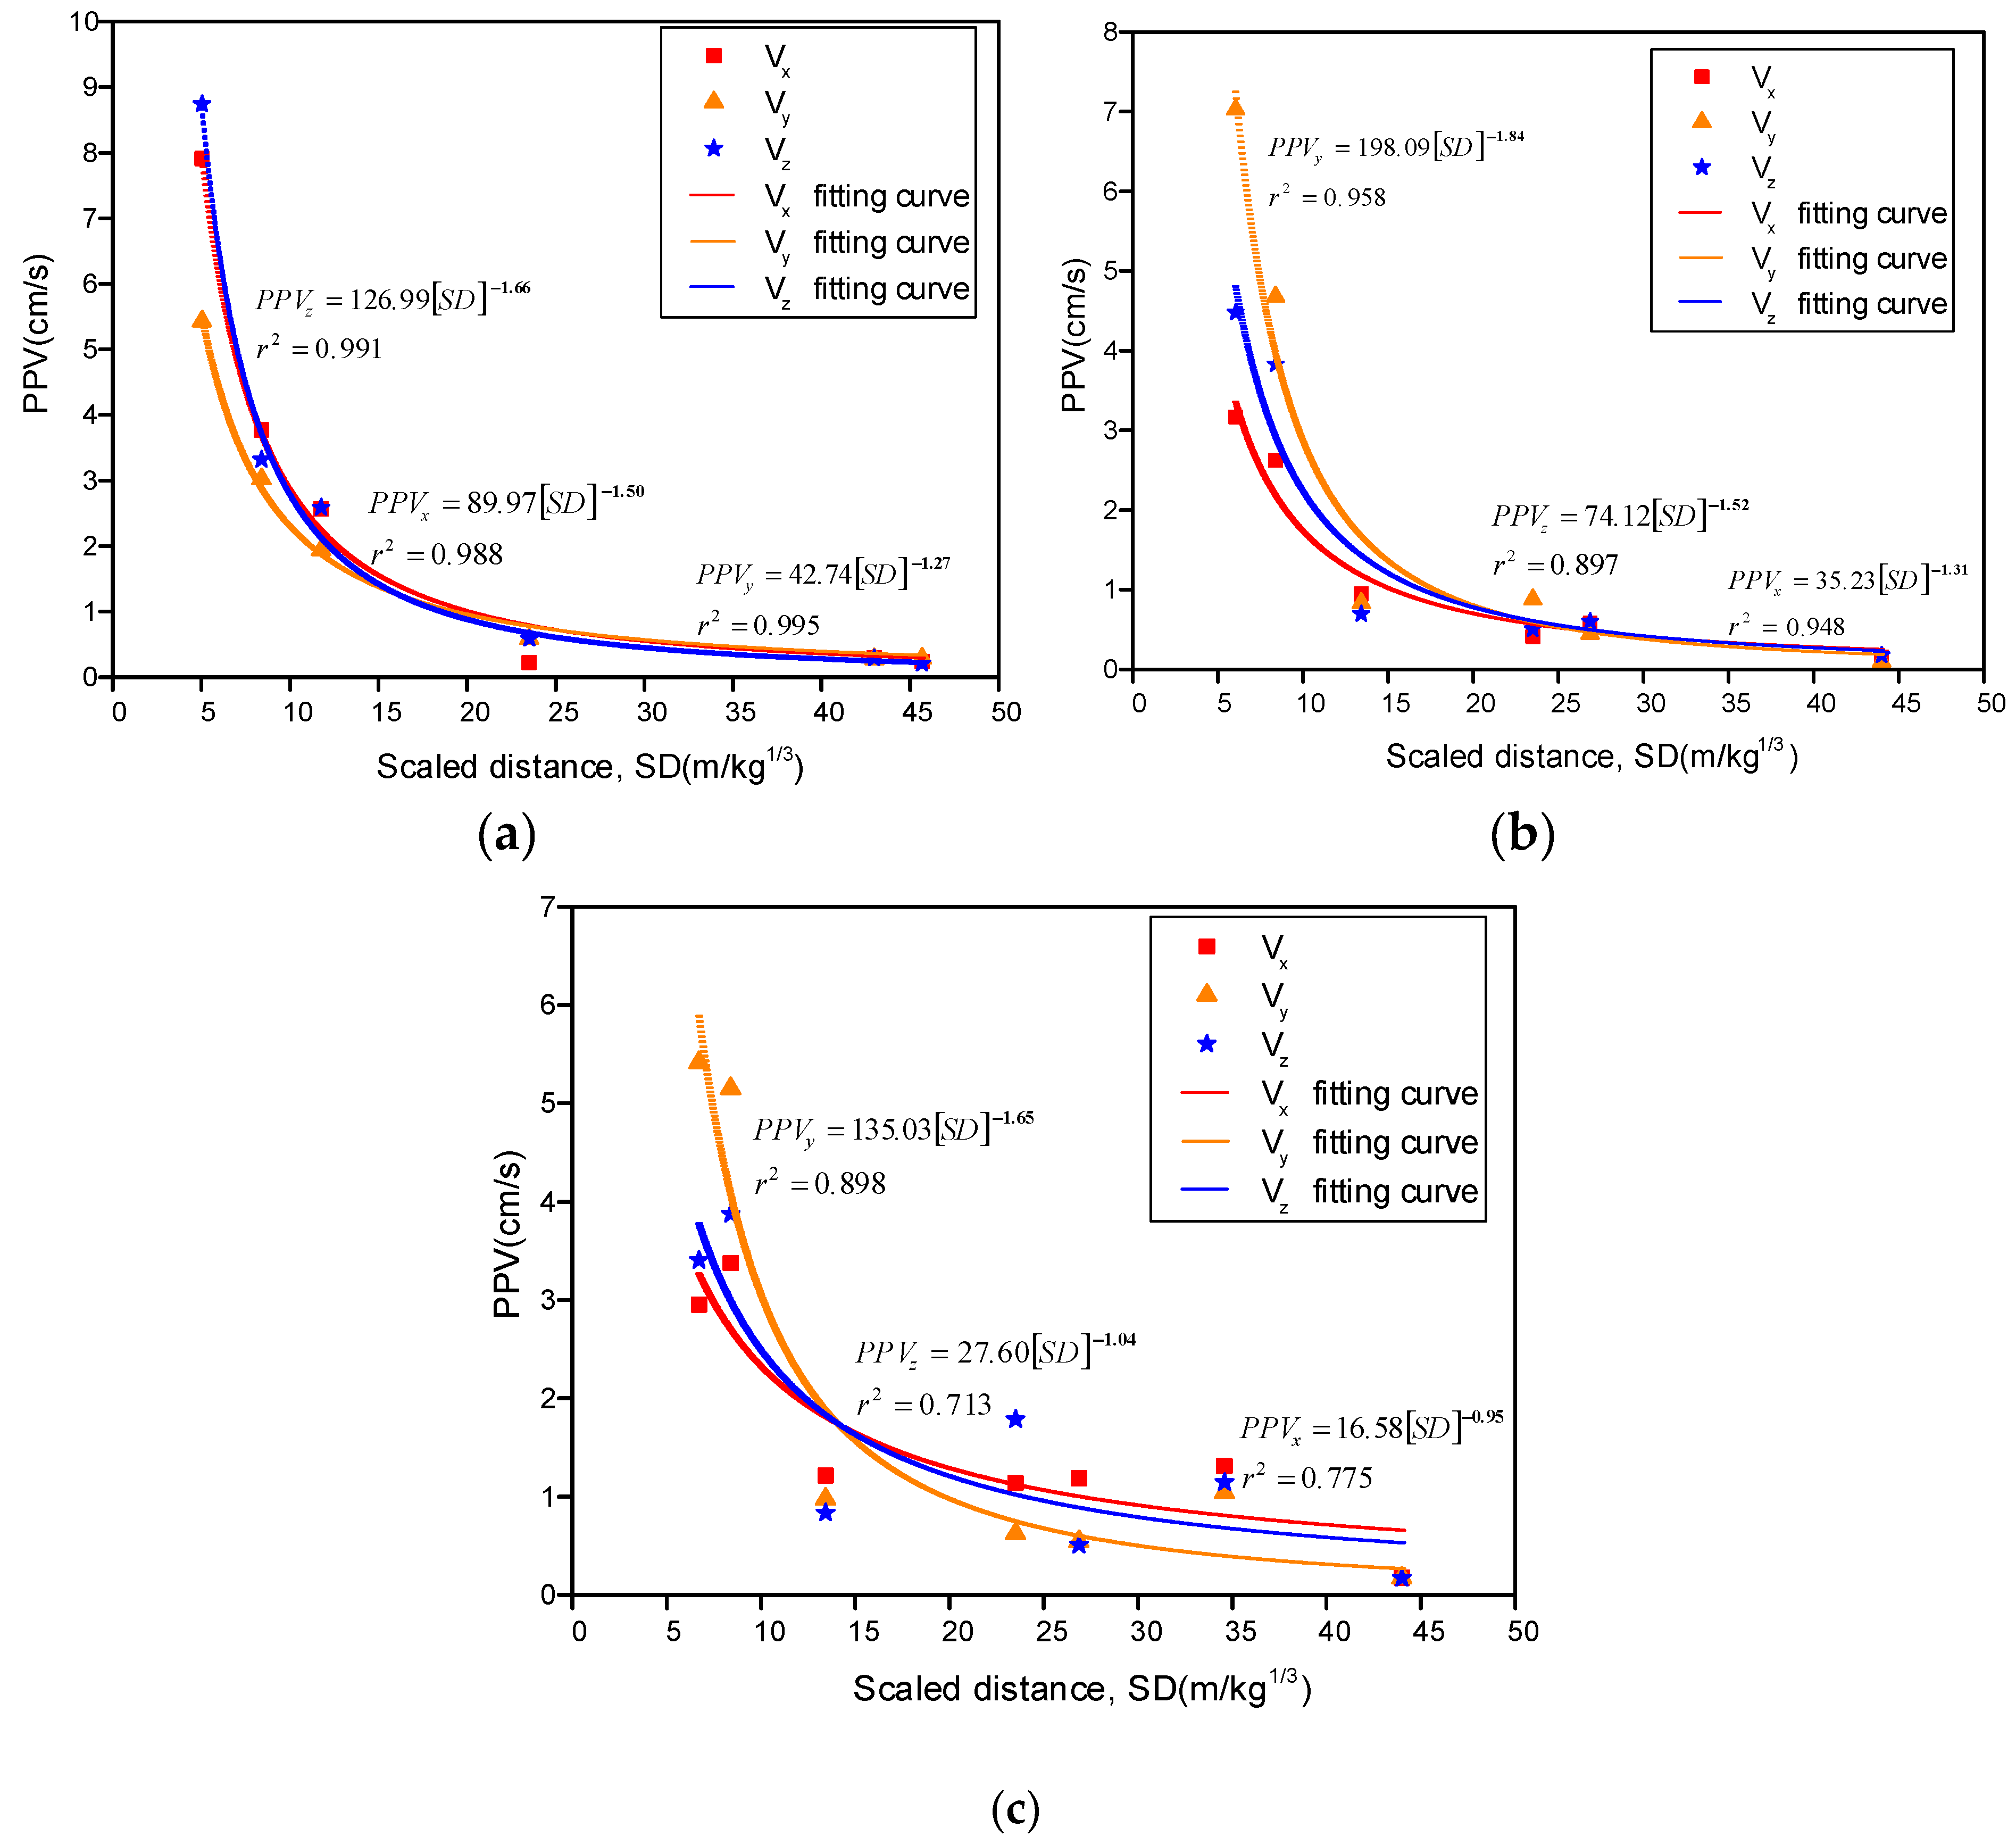
The transverse cofferdam of Xiangjiaba hydropower station was divided into six regions based on its structural features, which consisted of masonry, PC, and RCC. The maximum explosives charge weight per delay in the masonry structure, PC, and RCC above water were 26.4 kg, 28 kg, and 28.5 kg. The PPV reached 8.741 cm/s, 4.479 cm/s, and 3.878 cm/s, respectively.
(2)
The attenuation law of PPV land blasting was revealed in different structures through the blast-induced vibration data, and then the prediction formulas of explosives charge weight per delay in PC and RCC structures were put forward combining Newton’s third law.
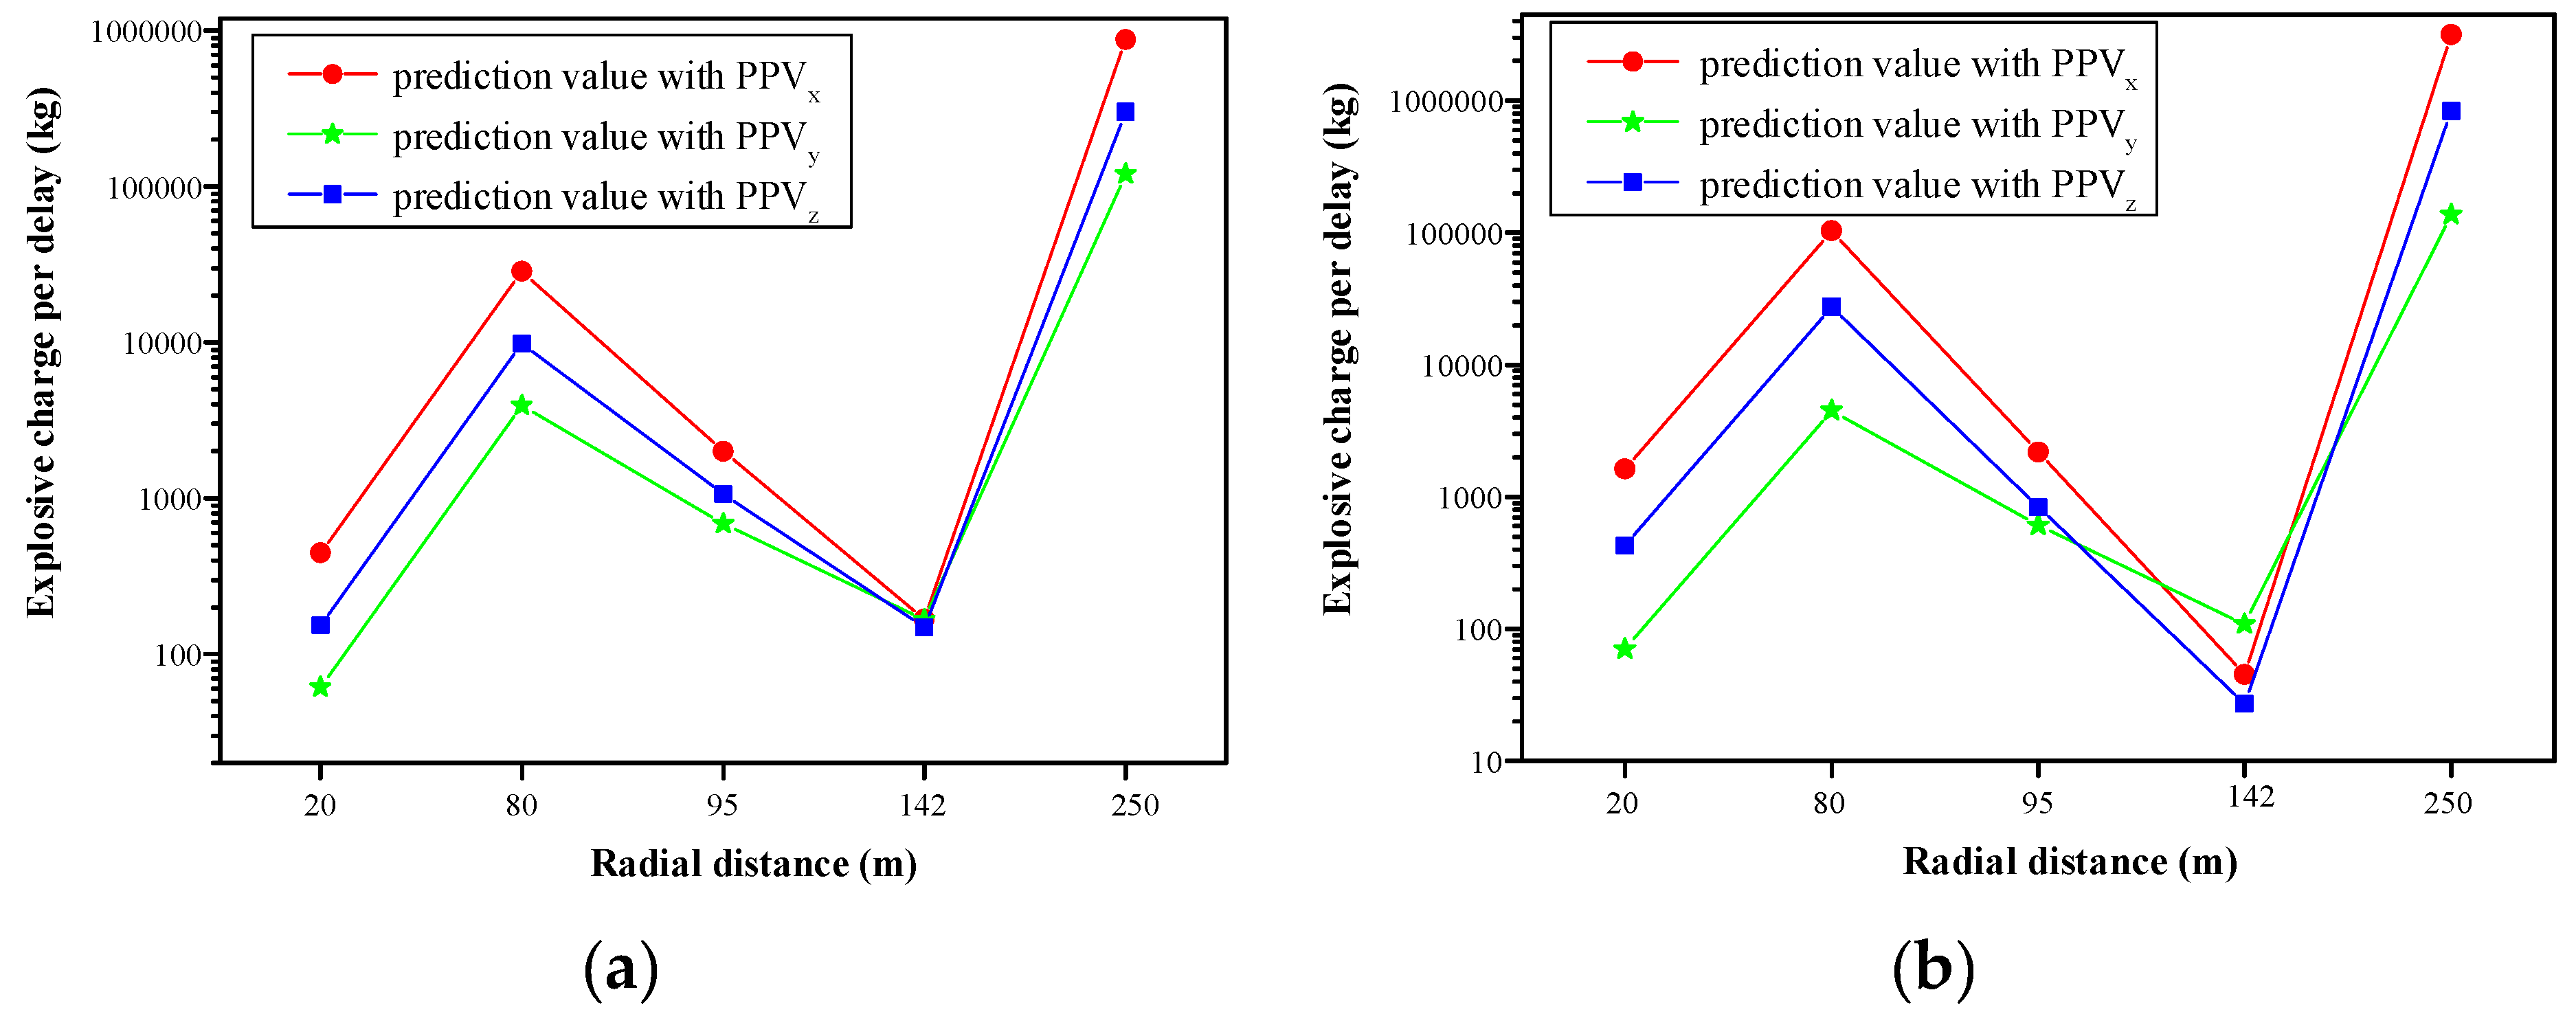
(3)
Considering permissible blast-induced vibration values of adjacent structures in Xiangjiaba hydropower station, the maximum permissible explosives charge weight per delay in PC and RCC underwater structures were calculated by the prediction formulas, which were 67 kg and 27 kg, respectively.
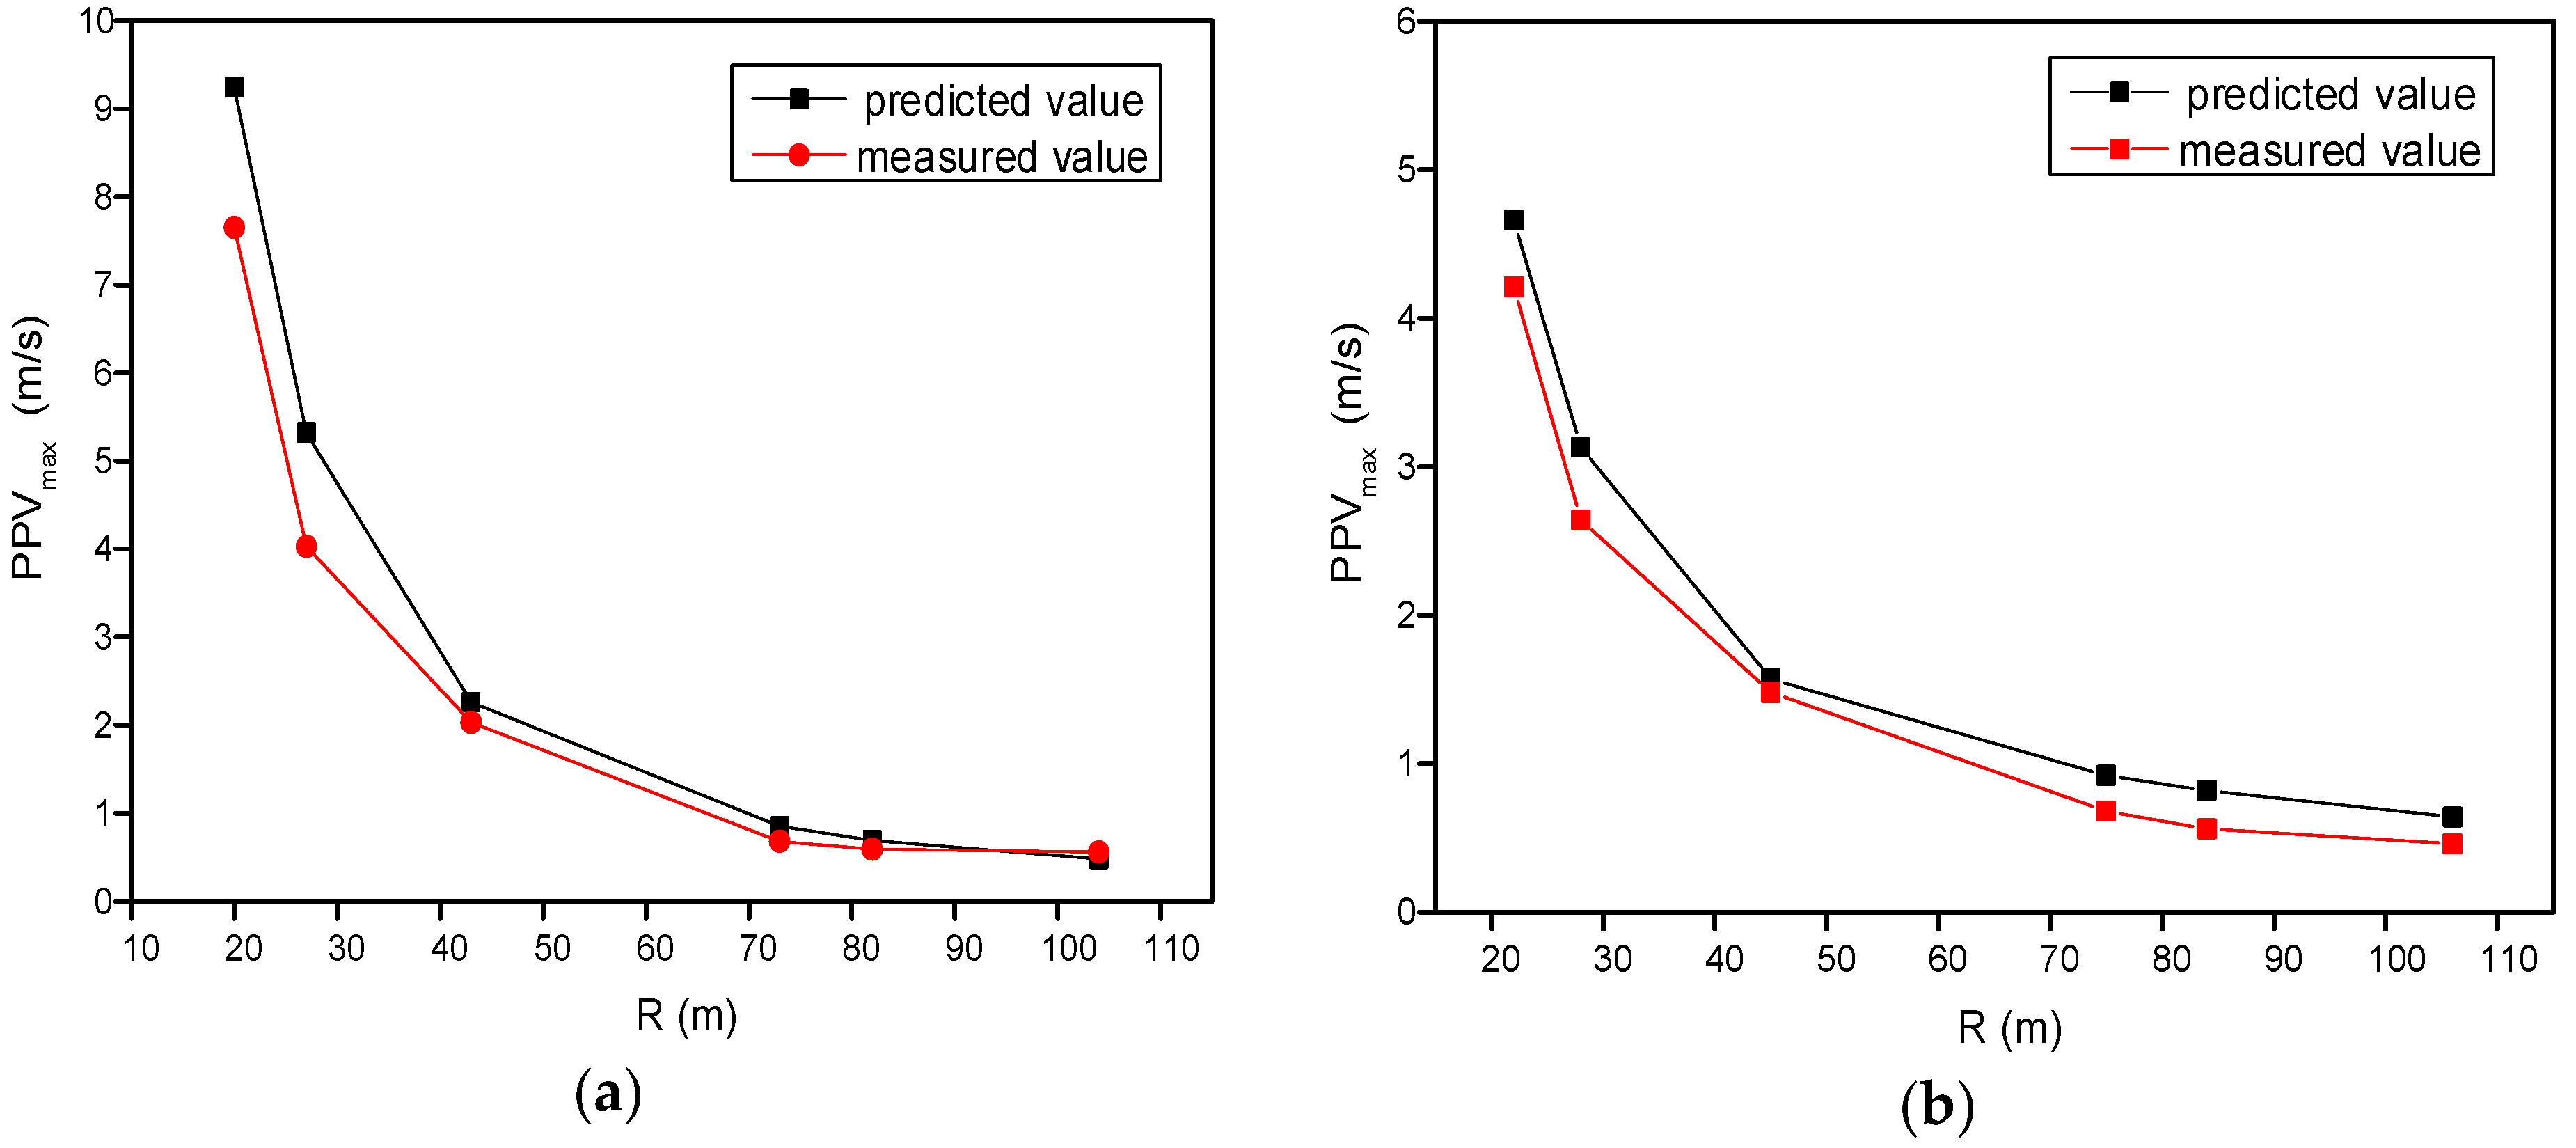
(4)
The actual explosives per delay in PC and RCC underwater structures were 54 kg and 23.4 kg, respectively, where the PPV was 7.65 cm/s and 4.21 cm/s. Both of them were less than the maximum allowable values. Simultaneously, the prediction formulas were proven to meet the blast requirements by the analysis of MAPE. Consequently, the PPV underwater blasting could be predicted by analyzing the PPV of land blasting in same structure, which provided the basis for the design of underwater blasting parameters. A reliable method for cofferdam demolition in hydropower stations was proposed, which provided a reference for similar projects.

Author Contributions

Conceptualization, C.L.; methodology, Y.M.; formal analysis, Y.M. and X.Z.; resources, Y.M.; data curation, J.Z.; writing—review and editing, Y.M.; funding acquisition, P.W. All authors have read and agreed to the published version of the manuscript.

Funding

This research was funded by the National Natural Science Foundation of China, grant number 51804114.

Conflicts of Interest

The authors declare no conflict of interest.

References

  1. Xia, X.; Li, H.B.; Liu, Y.Q.; Yu, C. A case study on the cavity effect of a water tunnel on the ground vibrations induced by excavating blasts. Tunn. Undergr. Space Technol. 2018, 71, 292–297. [Google Scholar] [CrossRef]
  2. Avellan, K.; Belopotocanova, E.; Puurunen, M. Measuring, monitoring and prediction of vibration effects in rock masses in near-structure blasting. Procedia Eng. 2017, 191, 504–511. [Google Scholar] [CrossRef]
  3. Jiang, N.; Gao, T.; Zhou, C.; Luo, X. Effect of excavation blasting vibration on adjacent buried gas pipeline in a metro tunnel. Tunn. Undergr. Space Technol. 2018, 81, 590–601. [Google Scholar] [CrossRef]
  4. Lu, W.; Leng, Z.; Hu, H.; Chen, M.; Wang, G. Experimental and numerical investigation of the effect of blast-generated free surfaces on blasting vibration. Eur. J. Environ. Civ. Eng. 2016, 22, 1374–1398. [Google Scholar] [CrossRef]
  5. Qiu, X.; Shi, X.; Gou, Y.; Zhou, J.; Chen, H.; Huo, X. Short-delay blasting with single free surface: Results of experimental tests. Tunn. Undergr. Space Technol. 2018, 74, 119–130. [Google Scholar] [CrossRef]
  6. Tripathy, G.; Shirke, R.; Kudale, M. Safety of engineered structures against blast vibrations: A case study. J. Rock Mech. Geotech. Eng. 2016, 8, 248–255. [Google Scholar] [CrossRef] [Green Version]
  7. Agrawal, H.; Mishra, A. Modified scaled distance regression analysis approach for prediction of blast-induced ground vibration in multi-hole blasting. J. Rock Mech. Geotech. Eng. 2019, 11, 202–207. [Google Scholar] [CrossRef]
  8. Blair, D. Blast vibration dependence on charge length, velocity of detonation and layered media. Int. J. Rock Mech. Min. Sci. 2014, 65, 29–39. [Google Scholar] [CrossRef]
  9. Blair, D. The free surface influence on blast vibration. Int. J. Rock Mech. Min. Sci. 2015, 77, 182–191. [Google Scholar] [CrossRef]
  10. Xia, Y.; Jiang, N.; Zhou, C.; Luo, X. Safety assessment of upper water pipeline under the blasting vibration induced by Subway tunnel excavation. Eng. Fail Anal. 2019, 104, 626–642. [Google Scholar] [CrossRef]
  11. Uysal, O.; Erarslan, K.; Cebi, M.A.; Akcakoca, H. Effect of barrier holes on blast induced vibration. Int. J. Rock Mech. Min. Sci. 2008, 45, 712–719. [Google Scholar] [CrossRef]
  12. Zeng, Y.; Li, H.; Xia, X.; Liu, B.; Zuo, H.; Jiang, J. Blast-induced rock damage control in Fangchenggang nuclear power station, China. J. Rock Mech. Geotech. Eng. 2018, 10, 914–923. [Google Scholar] [CrossRef]
  13. Roy, M.P.; Singh, P.K.; Sarim, M.; Shkhawat, L.S. Blast design and vibration control at an underground metal mine for the safety of surface structures. Int. J. Rock Mech. Min. Sci. 2016, 83, 107–115. [Google Scholar] [CrossRef]
  14. Kim, J.-G.; Song, J.-J. Abrasive water jet cutting methods for reducing blast-induced ground vibration in tunnel excavation. Int. J. Rock Mech. Min. Sci. 2015, 75, 147–158. [Google Scholar] [CrossRef]
  15. Ongen, T.; Karakuş, D.; Konak, G.; Onur, A.H. Assessment of blast-induced vibration using various estimation models. J. Afr. Earth Sci. 2018, 145, 267–273. [Google Scholar] [CrossRef]
  16. Navarro Torres, V.F.; Leandro, G.C.S.; Paulo, F.T.L.; Hernani, M.L. Assessing and controlling of bench blasting-induced vibrations to minimize impacts to a neighboring community. J. Clean. Prod. 2018, 187, 514–524. [Google Scholar] [CrossRef]
  17. Yang, G.L. Discussion on blasting removal technology of concrete guide wall in Xiangjiaba Hydrppower station. Yangtze River 2015, 46, 37–39. (In Chinese) [Google Scholar]
  18. GB6722-2014 Safety Regulations for Blasting; Standards Press of China: Beijing, China, 2014. (In Chinese)
  19. Zhao, G. Study on Technology of the Cofferdam Demolition Blasting in Deep Water Conditions. Ph.D. Thesis, University of Science and Technology of China, Hefei, China, 2008. (In Chinese). [Google Scholar]
  20. Shao, W.; Wang, C.B. Study on vibration characteristics and attention law of underwater blasting. Eng. Blasting 2018, 24, 15–22. (In Chinese) [Google Scholar]
Figure 1. Actual photo of transverse cofferdam in Xiangjiaba hydropower station. (a) Aerial view, (b) detail picture.
Applsci 10 06195 g001
Figure 2. Plane plan of the transverse cofferdam.
Applsci 10 06195 g002
Figure 3. A-A profile of the transverse cofferdam.
Applsci 10 06195 g003
Figure 4. Blasting sequence and blasting hole arrangement.
Applsci 10 06195 g004
Figure 5. Typical blast parameters of region I. (a) Blast network structure, (b) A-A’ profile charge structure (unit:m).
Applsci 10 06195 g005aApplsci 10 06195 g005b
Figure 6. Layout of blast-induced vibration monitoring points.
Applsci 10 06195 g006
Figure 7. Time history curve of blast vibration of no. 1 monitoring point in region III. (a) X-direction velocity, (b) Y-direction velocity, (c) Z-direction velocity.
Applsci 10 06195 g007aApplsci 10 06195 g007b
Figure 8. Regression results of PPV and scaled distance in (x) longitudinal, (y) tangential and (z) vertical directions. (a) Masonry, (b) plain concrete, and (c) roller compacted concrete.
Applsci 10 06195 g008
Figure 9. The explosive unit consumption in land blasting and underwater blasting.
Applsci 10 06195 g009
Figure 10. Prediction value of explosives charge weight per delay in different regions. (a) Region V and (b) region VI.
Applsci 10 06195 g010
Figure 11. Recommended blast network of region V and region VI.
Applsci 10 06195 g011
Figure 12. B-B’ profile charge structure of region V and region VI (unit:m).
Applsci 10 06195 g012
Figure 13. Maximum blast vibration velocity at different distances. (a) Region V and (b) region VI.
Applsci 10 06195 g013
Table 1. Recorded blast vibration data.
RegionShot No.Charge Weight Per Delay (kg)Total Charge Weight (kg)Radial Distance (m)Longitudinal Velocity (cm/s)Transversal Velocity (cm/s)Vertical Velocity (cm/s)
I126.42337.6157.9095.4318.741
226.42337.6700.2240.5910.588
326.42337.6253.7723.0253.318
526.42337.6352.5671.9432.588
726.42337.61280.2960.2780.289
826.42337.61360.2380.2890.209
III1282578.9183.1687.0274.479
2282578.9700.4110.880.506
3282578.9252.6254.6783.828
4282578.9800.5810.450.601
5282578.9400.9470.8310.695
8282578.91310.1530.0960.178
IV128.54724.8202.9555.4153.408
228.54724.8701.1390.6231.786
328.54724.8253.3785.1493.878
428.54724.8801.1880.5440.509
528.54724.8401.2130.9760.837
628.54724.81031.3111.0411.147
828.54724.81310.1750.1760.172
Table 2. Relevant parameters of underwater blasting.
Regionsh (m)[σ] (MPa)αρ1 (kg/m3)CP1 (m/s)ρ2 (kg/m3)CP2 (kg/m3)Q2/Q1
V61.05324002700100015001.69
VI61.65225603000100015001.91
Table 3. Permissible blast vibration values of hydropower station.
LocationPPVlimit (cm/s)Radial Distance (m)Explosive Charge Weight Per Delay (kg)
Region VRegion VI
Concrete structure<10250120,052137,560
Grouting of dam foundation, stilling basin and factory building<2.595687606
Rock mass-infrastructure surface<10206170
Stilling basin foundation<108039334507
Precision control instrument (underground power house)<0.514214827

