Article

Strain Field Evolution Characteristics of Free Surface during Crater Blasting in Sandstone under High Stress

Key Laboratory of Ministry of Education on Safe Mining of Deep Metal Mines, Northeastern University, Shenyang 110819, China
*
Author to whom correspondence should be addressed.
Appl. Sci. 2020, 10(18), 6285; https://doi.org/10.3390/app10186285
Submission received: 9 July 2020 / Revised: 25 August 2020 / Accepted: 6 September 2020 / Published: 10 September 2020
(This article belongs to the Section Mechanical Engineering)

Abstract

:
Considering the problems related to hard rock blasting under high in-situ stresses at large depths, we conducted crater blasting tests on sandstone specimens under three static load conditions to investigate the strain field evolution of rock blasting under high stress. The digital image correlation (DIC) technique was used to monitor the evolution of the strain field on the free surface. Thus, the influence of the static stress on the blasting strain field was analyzed, and the formation mechanism of cracks on the free surface was elucidated. The results indicate that a circular tensile strain zone was formed without static loading. The direction of the maximum principal strain was perpendicular to the radius, which lead to the random emergence of multiple radial tensile cracks. Under a uniaxial static loading, an elliptical tensile strain zone was formed. The direction of the maximum principal strain was perpendicular to the static loading direction. This facilitated the initiation and propagation of tensile cracks preferentially in the direction parallel to the static loading. Under an equal biaxial static loading, the initial compressive strain in the specimen reduced the increment rate of the blasting strain, and restrained the formation of surface cracks. Besides, a determination method for dynamic tensile fracture strain of rock was proposed.

1. Introduction

The number of deep rock engineering structures, such as mines and tunnels, is increasing [1,2]. Additionally, it has been found that geostress gradually increases with depth [3]. During excavation using the drilling-and-blasting method, rock blasting is conducted under the combined actions of high static stresses and blasting-induced dynamic loading. Compared with shallow operations, the blasting for deep rock engineering projects is more complex owing to the high static stresses. The uneven stress distribution near the working face leads to a significant difference in blasting efficiency, severe over- or under-excavation, and difficulty in the control of the final shapes of the deep rock structures [4,5]. Therefore, it is necessary to study the effect of high static stress on rock blasting [6,7,8,9,10].
The crater blasting theory and tests are effective means to understand the rock fragmentation mechanism under blasting, which has been extensively investigated [11,12]. Ma and An [13] have simulated the two-dimensional (2D) crack propagation under blasting with a single free surface based on the Johnson-Holmquist material model using the LS-DYNA software and studied the effects of the loading rate, uniaxial stress field, and joints on the blasting performance. Yi et al. [14] have simulated the damage evolution and crack development in rock upon blasting under confining in-situ stresses and reported damage development trends toward the direction of the high applied initial pressure. Yilmaz and Unlu [15] have numerically modeled the explosion of a cylindrical charge based on the Mohr-Coulomb failure criterion using the FLAC3D program and the results have indicated that the anisotropy in the shape of the cracked zone has significantly increased with the anisotropy of the static stress field.
The miniaturized crater blasting model experiment can be used to study the whole blasting process, such as the initiation and propagation of cracks. In order to study the influence of static stress on blasting, many scholars have carried out miniaturized crater blasting model experiments [16,17,18,19]. Yang et al. [16], Yang and Ding [17] investigated the effect of static stress on the propagation of blasting cracks using PMMA (polymethyl methacrylate) specimens with dimensions of 315 × 285 × 6 mm3, and the results indicated that static stress plays an important role in crack formation and propagation. He and Yang [18] used 250 × 250 × 100 mm3 rock model specimens to study the characteristics of free surface cracks in single-hole and double-hole blasting. Zhang et al. [19] have carried out experimental studies on crater blasting under various static stresses and reported that the static stress has promoted crack propagation during the blasting. Hence, the high static stress is one of the main factors influencing the blasting efficiency in deep rock engineering.
From previous studies, it can be seen that static stresses play an important role in the crack initiation. Although numerous studies have been focused on the influences of static stress on crack initiation and propagation, no extensive studies have been conducted on the strain field evolution characteristics before crack initiation. However, at the initial stage of blasting, cracks do not emerge and the strain field has a significant role in the crack initiation and blasting crater shape. Zhang et al. [20] used high-speed camera and 2D-DIC technology to observe the blasting process of crater blasting under the coupling of dynamic and static loads processing, including strain field evolution, crack propagation process, blasting crater shape and blasting fragmentation. However, this paper only conducted qualitative analysis on the evolution of the strain field, and the mechanism of static stress affects blasting crack formation is still unclear.
Therefore, Crater blasting tests on sandstone specimens were carried out in the cases of no static stress, under uniaxial, and equal biaxial static stresses. On the basis of Ref. [20], the shooting speed of high-speed camera was increased from 200,000 frames/s to 1,000,000 frames/s to quantitatively analyze the strain field on the surface during the period from initiation of detonation to the appearance of macroscopic cracks. The evolution law of the maximum principal strain on the free surface under various loading conditions was investigated. The influence of the static stress on the maximum principal strain field was analyzed. The mechanism of formation of cracks on the free surface was revealed.

2. Test Apparatus, Specimens, and Procedure

2.1. Test Apparatus

The test apparatus used in this study mainly consists of an electric explosion system, loading system, measurement system, and control system [21], as shown in Figure 1. The electric explosion system transforms electric energy into mechanical energy by utilizing the plasma explosion of wires and replaces the chemical explosion for rock blasting. The loading system can apply loads on specimens having various sizes (maximum sizes: 500 × 500 × 250 mm). The DIC-2D speckle analysis software (CSI, Irmo, SC, USA) and Kirana05M ultrahigh-speed camera (Kirana, Pitstone, UK) were employed for the measurement system, which was used to monitor the evolution of the strain field on the free surface during blasting. Table 1 lists the parameters of the DIC hardware in the test. Table 2 lists the DIC analysis parameters of the software in the test. The control system can coordinate the electric explosion system and measurement system.

2.2. Test Specimens

Sandstone specimens with a density of 2114 kg/m3, elastic modulus E of 13.39 GPa, Poisson’s ratio μ of 0.27, P-wave velocity of 1950 m/s, uniaxial compressive strength σc of 71.9 MPa, and tensile strength σt of 4.19 MPa were tested. The specimen had dimensions of 300 mm × 300 mm × 150 mm. The blasthole diameter was 12 mm, while the line of least resistance was 20 mm. A schematic and photograph of the sandstone specimen are shown in Figure 2. A copper wire (diameter: 0.4 mm, length: 50 mm) was used as the explosion wire for the electric explosion tests. The copper wire was coiled into the shape shown in Figure 2 and installed in the blasthole as the loading end of the electric explosion. The charging voltage was 50 kV, while the energy storage was 5.0 kJ during the tests. The filming speed of the ultrahigh-speed camera was 106 frames/s, while the recording duration was 179 μs.

2.3. Test Procedure

A blasthole was drilled in the specimen, as designed. The coiled wire was inserted to the bottom of the blasthole. The blasthole was then filled by a fast-setting gypsum. After the filling material was sufficiently solidified and the filling effect was sufficiently good, the designed static load was applied before the blasting.
The tests were carried out in three groups. For the first group, no static load was applied. For the second group, uniaxial static compressive stresses of σy0 = σ0 = −30 MPa were applied on the two specimen ends along the y direction. The stress-strength ratio σ0c was 0.42. For the third group, equal biaxial compressive stresses of σx0 = σy0 = σ0 = −30 MPa were applied on the sides of the specimen. The stress-strength ratio remained σ0c = 0.42. The static load was applied in a force-controlled manner. The loading rate was 1.5 kN/s, while the maximum load was 1350 kN. The horizontal and vertical loads were applied simultaneously and equally in the third group of tests.

3. Test Results and Analyses

3.1. Initial Strain Induced by the Static Stress

In this study, the distribution characteristics of the static strain field on the free surface of the specimen under different static loading conditions were analyzed.
For the first group of tests, initial static load was not applied. Hence, the initial static strain was 0 in this case.
For the second group of tests, uniaxial static compressive stresses of σy0 = σ0 = −30 MPa were applied on both ends of the specimen along the y direction. The strain components and principal strain near the free surface induced by the static stresses were
ε 10 = ε x 0 = μ σ 0 E = 605 × 10 6 ε 20 = ε y 0 = σ 0 E = 2240 × 10 6 ε z 0 = μ σ 0 E = 605 × 10 6
where εx0, εy0, and εz0 are the linear strains in the x, y, and z directions, respectively, ε10 and ε20 are the maximum and minimum principal strains on the free surface, respectively, and μ is the Poisson’s ratio. The tensile strain was positive.
Tensile strains were observed in both x and z directions owing to the uniaxial static compressive stresses. The maximum principal strain on the free surface was tensile. Its magnitude and direction were the same as those of the linear strain in the x direction. The minimum principal strain was compressive. Its magnitude and direction were the same as those of the linear strain in the y direction.
For the third group of tests, biaxial static compressive stresses of σx0 = σy0 = σ0 = −30 MPa were applied on the top, bottom, left, and right sides of the specimen. The strain components and principal strain near the free surface induced by the static stresses were
ε 20 = ε x 0 = ε y 0 = ( 1 μ ) σ 0 E = 1636 × 10 6 ε 10 = ε z 0 = 2 μ σ 0 E = 1210 × 10 6
Compressive strains were observed in both x and y directions. The maximum principal strain changed from tensile to compressive, compared to the case with the uniaxial compression. Its magnitude and direction were the same as those of the linear strain. It exhibited anisotropy characteristics. A tensile strain was observed only along the z direction, perpendicular to the free surface. Its magnitude was twice that under the uniaxial compression.

3.2. Calculation Method of Strain in DIC

DIC is an effective method for measurements of surface displacement and strain, widely used in rock mechanics [22,23,24,25]. The DIC-2D speckle system can monitor the deformations in two directions, u and v, for each point on the free surface. In the coordinate system shown in Figure 2, the xy plane is the free surface. The relationship between the strain components and in-plane deformation for a point can be expressed by [26]
ε x = u x + 1 2 [ ( u x ) 2 + ( v x ) 2 ] ε y = u y + 1 2 [ ( u y ) 2 + ( v y ) 2 ] γ x y = u y + v x + u x u y + v x v y
where u and v are the deformations for a point in the x and y directions, respectively, εx, εy, and γxy are the linear and angular strains of the point in the x and y directions, respectively.
The in-plane principal strains ε1 and ε2 can be expressed as [27]
ε 1 = ε x + ε y 2 + ( ε x ε y 2 ) 2 + 1 4 γ x y 2 ε 2 = ε x + ε y 2 ( ε x ε y 2 ) 2 + 1 4 γ x y 2
The tensile strain failure criterion [28,29] for surface crack formation is used
ε t ε t d
where εt is the maximum dynamic tensile strain of a point during the blasting and εtd is the dynamic tensile fracture strain of the rock.

3.3. Strain Field Evolution Characteristics of the Free Surface

3.3.1. Without Static Load

Figure 3 presents the magnitude and direction of the maximum principal strain on the free surface in the case without static load. t = 0 corresponds to the distribution of the maximum static principal strain ε10 immediately after the static load was applied and before the blasting was started. The static strain on the free surface was zero when static load was not applied. The direction of the principal strain was randomly distributed, consistent with the actual situation. During the blasting, owing to expansion of the impact waves induced by the copper wire explosion, a circular tensile strain zone was formed near the blasthole center. The direction of the maximum tensile strain ε1 was perpendicular to the radius of the blasthole. When its magnitude satisfied Equation (5), radial tensile cracks emerged. The monitoring results show that the first expansion-induced tensile crack emerged on the free surface at 36 μs after the blasting; the corresponding maximum tensile strain was 0.00325. Hence, the dynamic tensile strength of the sandstone εtd was 0.00325 under such blasting conditions.
The coordinate origin o in Figure 2 is the intersection point of the blasthole axis and free surface. The points on the axes were traced to quantitatively analyze the evolution law of the strain field on the free surface. Figure 4 depicts the variations in maximum principal strains ε1 at various points on the x and y axes at different moments. The distributions of the maximum principal strains ε1 for various points on the axes at the same moment were similar. The maximum principal strain was observed at the coordinate origin o and decreased gradually to the initial static strain ε10 with the increase in distance from the blasthole center. The strains exhibited almost equal magnitudes at points that were at the same distance from the blasthole center. This indicates that the maximum principal strain ε1 was distributed approximately concentrically and uniformly on the free surface, exhibiting axisymmetric characteristics. The tensile strain distribution led to a random emergence of cracks on the free surface; multiple cracks might simultaneously appear (Figure 5). This can well explain the phenomenon reported by Zhang et al. [17,20], i.e., the random emergence of 3–5 radial cracks on the free surface simultaneously, and the radially outward propagation of cracks from the center.

3.3.2. Uniaxial Static Compressive Load

Figure 6 shows the magnitude and direction of the maximum principal strain on the free surface. t = 0 corresponds to the distribution of the maximum static principal strain ε10 immediately after the static load was applied and before the blasting was started. Figure 7 shows the variations in maximum principal strains ε1 at various points on the x and y axes at different moments. In Figure 6a, the maximum static principal strain ε10 is tensile and distributed relatively evenly. Its magnitude slightly fluctuates around ε10 = 605 × 10−6. The principal strains at various points are perpendicular to the direction of the static compression and parallel to the x axis. The monitoring results agree well with Equation (1). The above results indicate that despite the blasthole, no strain concentration occurs on the free surface and the strain field is uniformly distributed. The blasthole is completely filled and thus it is rational to ignore the effect of the blasthole in the analysis of the static strain.
Under the uniaxial compression, the tensile strain concentration zone is elliptical, with the long axis in the direction of the static load and the short axis perpendicular to the direction of the static load. The length of the long axis gradually increases, while no considerable change in the short axis is observed with the increase in static load. A compressive strain concentration zone appears on the extension line of the short axis of the tensile strain concentration zone, symmetrical with respect to the extension line. The compressive strain concentration zone gradually enlarges with the action time of the impact waves. Besides, the direction of the maximum principal strains in the strain concentration zone is perpendicular to the static loading direction and consistent with the direction of the initial static strain. However, the direction of the maximum principal strain in the tensile–compressive strain transition zone changes (Figure 6). Generally, the direction of the maximum principal strain field under the coupled static stress and blasting-induced dynamic stress is controlled by the static strain field. Under the uniaxial compressive stress, the maximum dynamic tensile principal strain rapidly increases from the blasthole center along the loading direction or y direction (Figure 7b). The strain in the direction perpendicular to the loading direction or x direction rapidly decreases. The maximum principal strain changes from tensile to compressive (Figure 7a). In reference [20], the evolution of maximum principal strain in the crater blasting process was analyzed. The initial state of specimen was the state after the static stress was applied. In this paper, the evolution of maximum principal strain under the coupling action of static stress and blasting stress was analyzed. The initial state of specimen is the state without static stress. Therefore, although the experimental conditions are the same, the maximum principal strain field shows some differences. At the same time, it can be seen that the strain caused by blasting and static stress are nonlinear superposition. The eight curves in Figure 7a at different moments intersect at the same point, where the strain is zero, at x = 28 mm. This shows that the boundary between the tensile and compressive strains perpendicular to the loading direction does not change with time or increase in strain at the center point. Under the uniaxial static load, only tensile cracks parallel to the loading direction appear (Figure 8), as determined by the shape of the tensile strain concentration zone and variations in strain direction and magnitude. When microcracks initiate and propagate in the high-strain zone near the center point, leading to the formation of macrocracks, other parallel microcracks are restrained. Finally, only one macrocrack parallel to the loading direction emerges.
The monitoring results also indicate expansion-induced tensile cracks at 32 μs after the explosion. The corresponding maximum dynamic tensile strain is 0.00319, approximately equal to that without static load. The dynamic tensile fracture strain of the sandstone under such blasting conditions can be determined by integrating the experiment results for the two cases
ε t d =   0.00322

3.3.3. Biaxial Static Compressive Load

Figure 9 presents the magnitude and direction of the maximum principal strain on the free surface. t = 0 corresponds to the distribution of the maximum static principal strain ε10 immediately after the static load was applied and before the blasting was started. Figure 10 shows the variations in maximum principal strains ε1 at various points on the x and y axes at different moments.
Figure 9a shows that the distribution of the maximum principal strain ε10 on the free surface is uneven; it fluctuates around ε10 = −1636 × 10−6. The directions of the maximum principal strains at various points are random, different from the uniform and isotropic distribution in Equation (3). The uneven distribution of the strain may be attributed to two factors, (1) errors in the specimen preparation, including the surface smoothness, verticality of adjacent surfaces, and parallelism of opposite surfaces and (2) rock heterogeneity in the specimen. The monitoring results in Figure 9 show that the main factor is the latter, i.e., the material heterogeneity affects the evolution of the dynamic strain field and shape of the blasting crater.
The results in Figure 9 and Figure 10 indicate that the blasting-induced dynamic strain evolution is similar to that without static load. An approximately circular tensile strain concentration zone is formed near the blasthole center. The direction of the maximum principal strain ε1 is perpendicular to the radius of the circle. However, owing to the relatively high initial compressive strain, the maximum tensile strain at the center does not reach εtd. Therefore, no radial tensile cracks appear on the surface during the blasting. Instead, circumferential cracks emerge (Figure 11). As the material heterogeneity leads to a nonuniform distribution of the static strain, the distribution of the dynamic strain field is not circular and axisymmetric, as predicted theoretically. Instead, an irregular and approximately circular distribution is observed and the direction of the maximum principal strain is controlled by the blasting-induced dynamic load.

4. Discussion

4.1. Dynamic Tensile Fracture Strain and Its Determination Method

Figure 12 presents the variations of maximum principal strain ε1 at the center point o with time for the three static loading conditions. From the detonation of electric explosion to the moment when the impact waves reach the free surface, the initial values of the maximum principal strains for the three loading conditions fluctuate around 0, 605 × 10−6, and −1636 × 10−6, respectively.
The average time taken by the impact waves to reach the free surface is 11 μs. Thus, the propagation of blasting-induced impact waves from the blasthole bottom to the free surface lasts for 10–11 μs. The line of least resistance in the experiments is 20 mm. The calculated velocity of the impact waves is 1818–2000 m/s, which agree well with the measured value of 1920 m/s. This confirms that the experimental results in this study are accurate and reliable.
In Figure 12, the dynamic tensile fracture strain of εtd = 0.00322 intersects the two curves of maximum principal strains under the uniaxial compression and zero static load at t = 32 μs and t = 36 μs, respectively. However, no intersection is observed between the dynamic tensile fracture strain of εtd = 0.00322 and curve of maximum principal strain under the equal biaxial compression. This indicates that radial cracks appear on the free surfaces of the sandstone specimens subjected to the uniaxial compression and zero static load at 32 and 36 μs, respectively, while no radial cracks emerge under the equal biaxial compression. Although the time corresponding to the emergence of radial cracks is related to the initial static strain, the dynamic tensile fracture strain is independent of the static stress. Instead, as an important index in the theoretical analysis and numerical modeling, it is a material constant related to the strain rate and lithology.
The dynamic tensile fracture strains of the rock at different loading rates can be further investigated using the test apparatus and method proposed in this study. Particularly, when only one macroscopic tensile crack emerges under the uniaxial compressive stress, the proposed method is effective in the measurement of the dynamic tensile fracture strain of a hard rock under blasting.

4.2. Effect of a High Stress on the Strain Field

The transition law and boundary between the maximum tensile and compressive principal strains have significant effects on the range and shape of the tensile failure zone on the free surface. Without static load, the initial maximum principal strains at various points are ε10 = 0 and the maximum dynamic principal strain on the free surface during the blasting satisfies ε10 ≥ 0 (Figure 4); no transition from tensile to compressive strain occurs.
Under the uniaxial compression, the initial maximum principal strains ε10 at various points are tensile, as calculated by Equation (2). The maximum dynamic principal strain on the free surface exhibits anisotropy characteristics. The high-tensile-strain zone rapidly moves outward along the loading direction or y direction, forming the long axis of the tensile strain concentration zone. Notably, no transition from tensile to compressive principal strain occurs along this direction (Figure 7b). Although the maximum principal strain at the center point rapidly increases, it rapidly decreases along the direction perpendicular the loading direction or x axis. The maximum principal strain changes from tensile to compressive, forming the short axis of the tensile strain concentration zone. As shown in Figure 7a, the boundary point between the maximum tensile and compressive principal strains on the short axis does not change with the increase in action time of blasting or increase in strain at the center point. This indicates that the tensile strain concentration zone is elliptical with a gradually extending long axis and unchanging short axis during the blasting. Under the uniaxial static compression, a boundary between the maximum principal tensile and compressive strains exists, which does not change with the blasting.
Under the equal biaxial compression, the initial strains at various points can be calculated by Equation (3). The initial maximum principal strain ε10 is compressive and evenly distributed. A circular tensile strain zone appears near the blasthole center during the blasting. The boundary between the maximum principal tensile and compressive strains is a circle. Its radius increases with the action time of blasting, i.e., the circular boundary between the dynamic tensile and compressive strains gradually moves outward with the increase in time under such static loading.
The above results indicate that the maximum principal strain can transit from tensile to compressive on the free surface and that the location and shape of the boundary during the blasting are determined by the static stress state of the specimen. Various issues should be further systematically studied, such as the effects of other factors (such as the line of least resistance and lithology), role of the boundary in the crack initiation and propagation and formation of the blasting crater, and its effect on the shape of the blasting crater.

5. Conclusions

In order to study the mechanism of the static stress on the initiation of blasting cracks, crater blasting tests on sandstone specimens were conducted without static load, under uniaxial and equal biaxial compressions. The DIC non-contact measurement technique has been used to monitor the evolution of the strain field on the free surface. The evolution law of maximum principal strain under different static stress conditions and the influence of static stress on strain field were analyzed. The maximum tensile strain failure theory was used to explain the mechanism of static stress on crack formation. At the same time, a method to measure the dynamic fracture strain of rock was proposed. The conclusions are as follows:
(1)
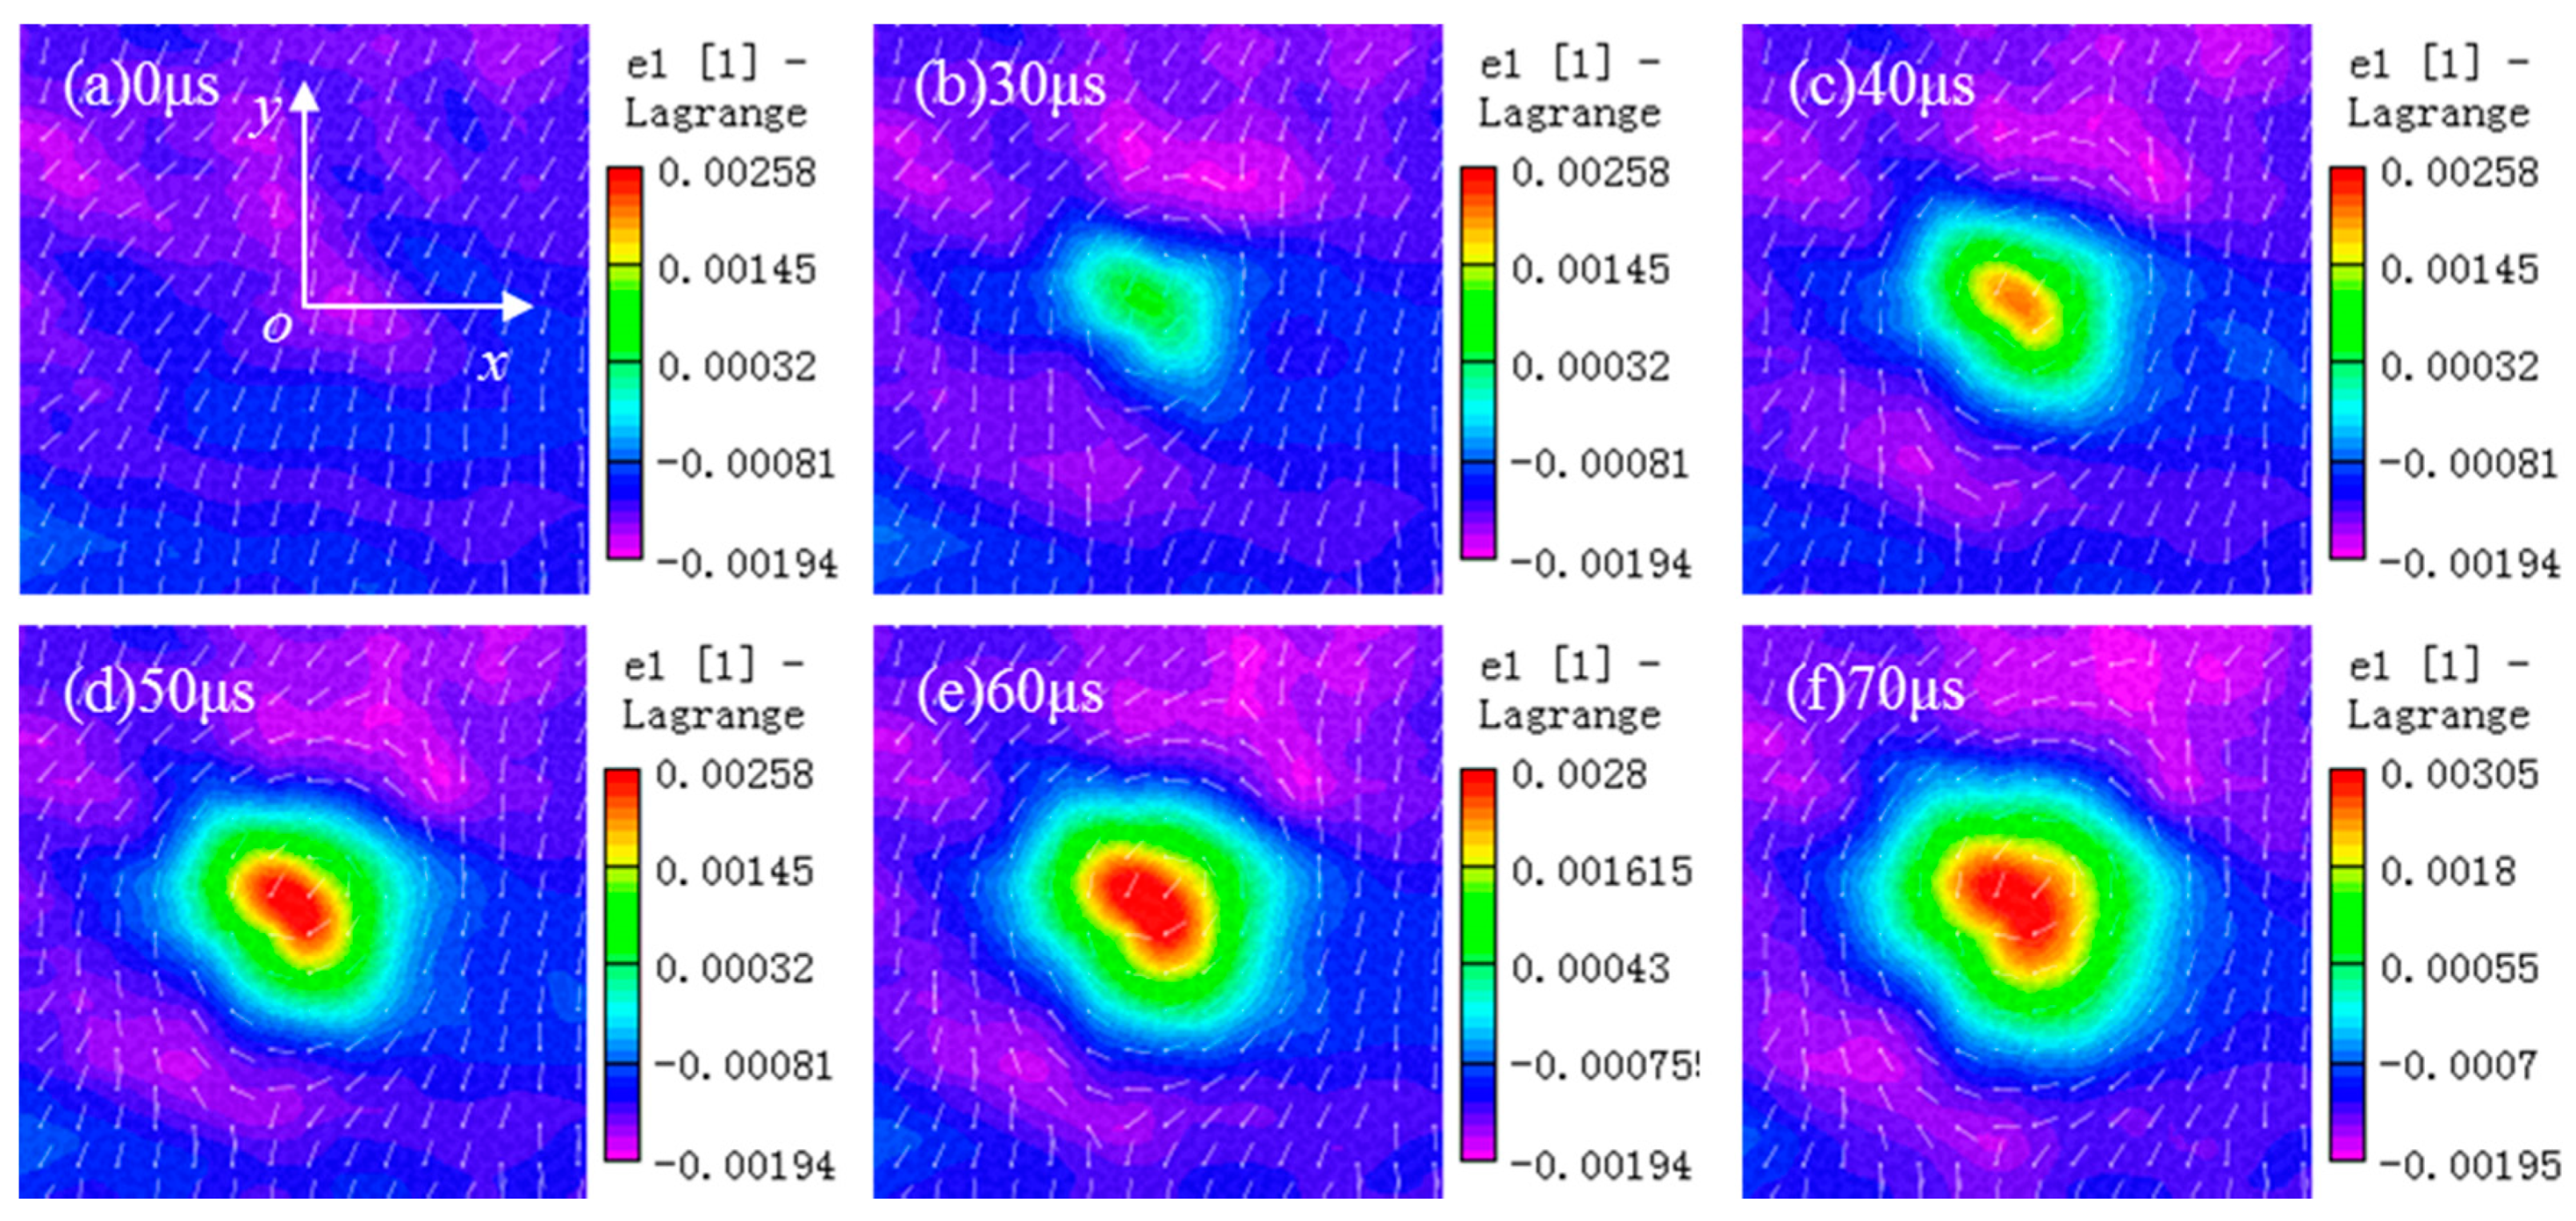
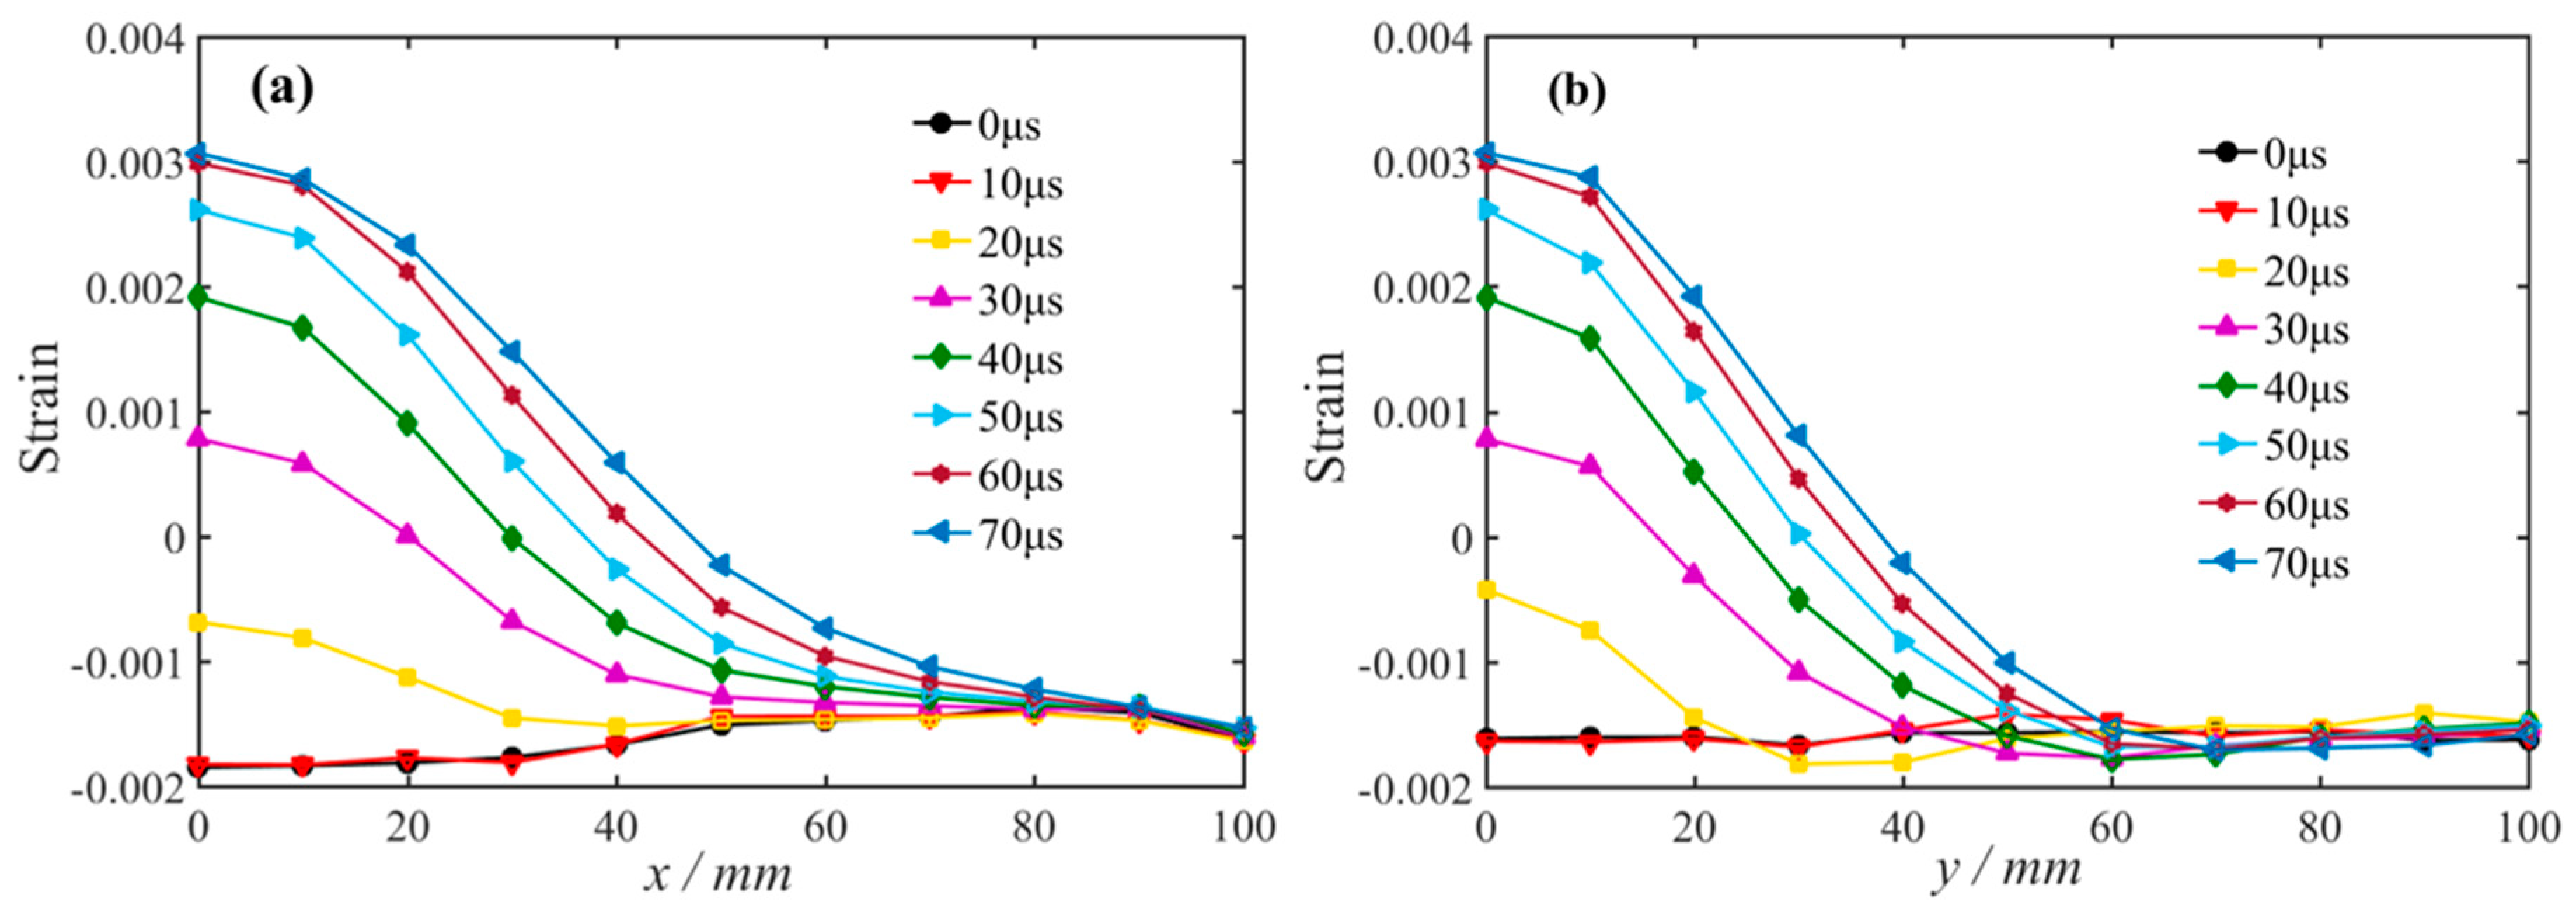
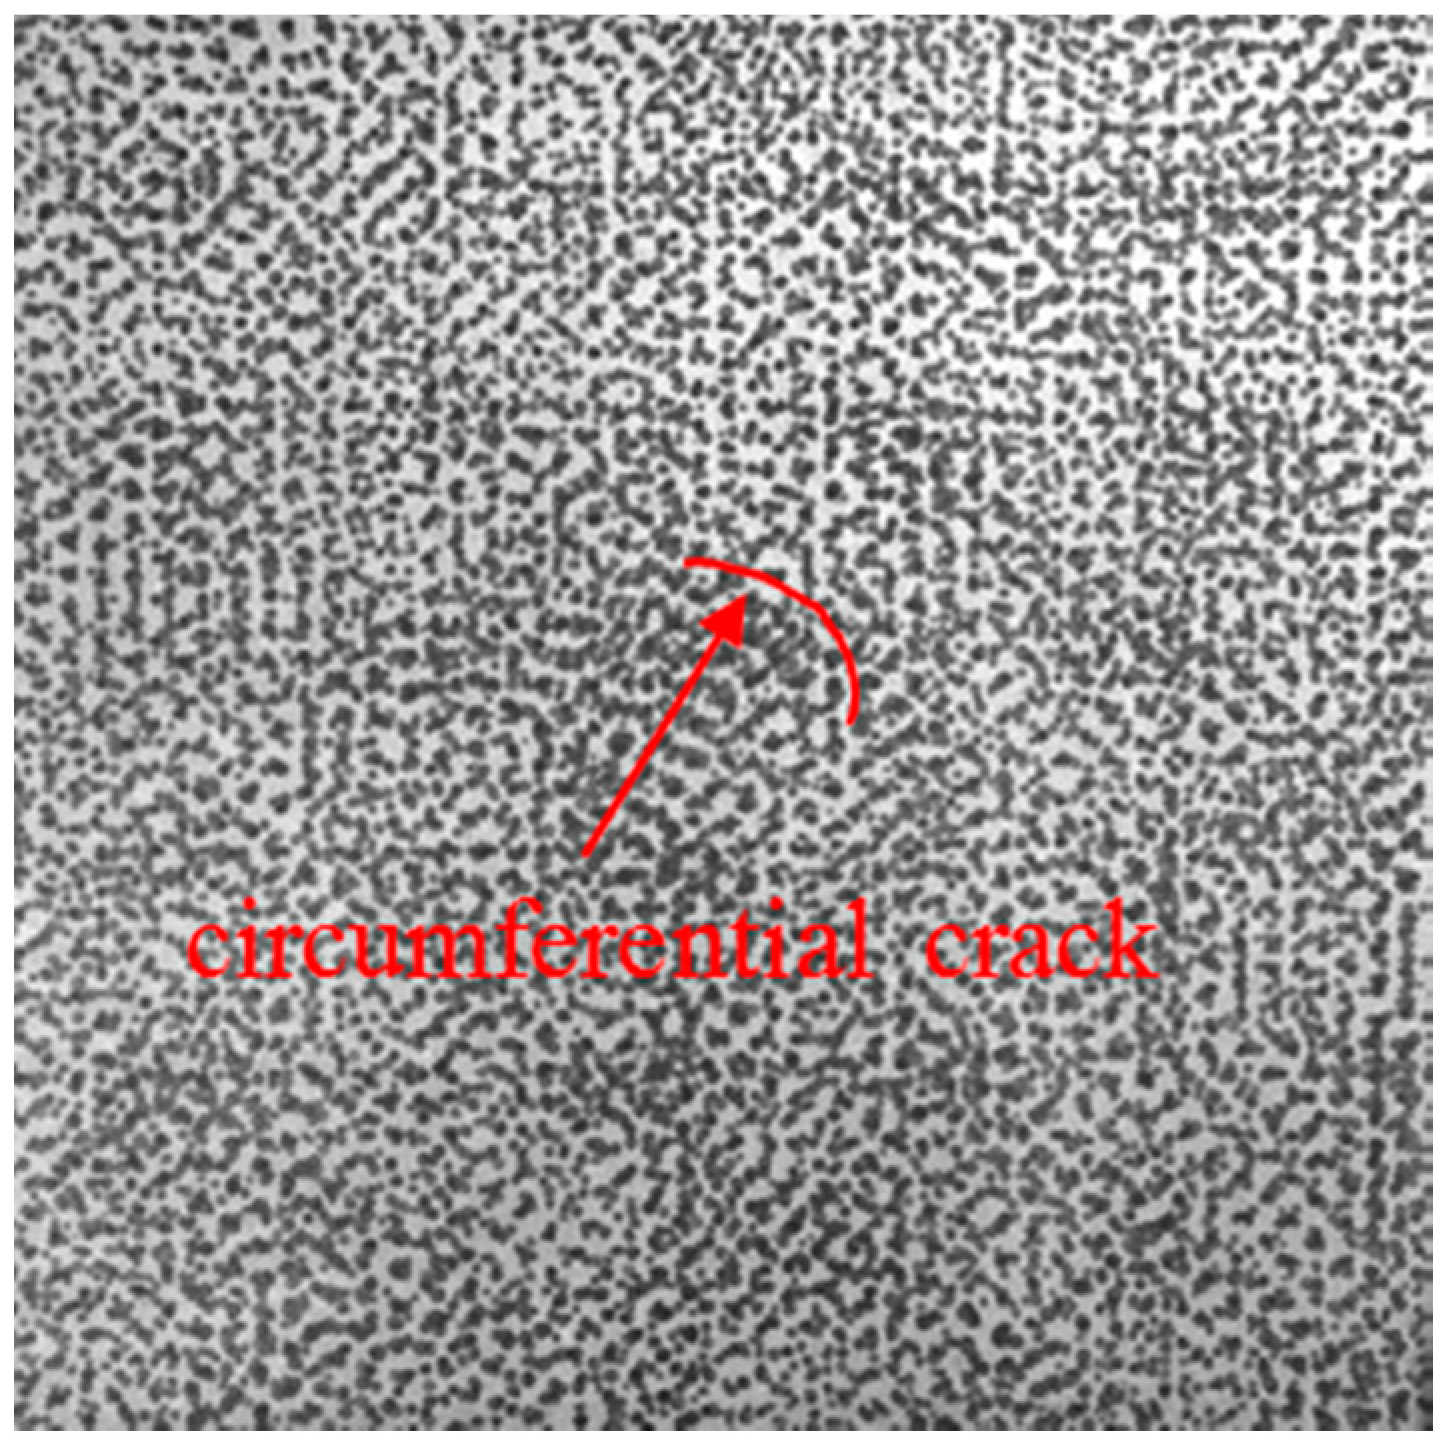
Static stress controls the pattern of the maximum principal strain field during crater blasting. Without static load and under the equal biaxial compression, an axisymmetric circular tensile strain zone was formed on the free surface. The maximum principal strain was observed at the center of the circle and gradually decreased to the initial static strain with the increase in radius. Under the uniaxial static compression, an elliptical tensile strain field with the long axis parallel to the direction of static stress was formed. The long axis extended with the action time of blasting and the short axis was unchanged during the blasting. In the direction of vertical static stress, the maximum principal strain transitions from tensile strain to compressive strain, forming a concentration zone of compressive strain.
(2)
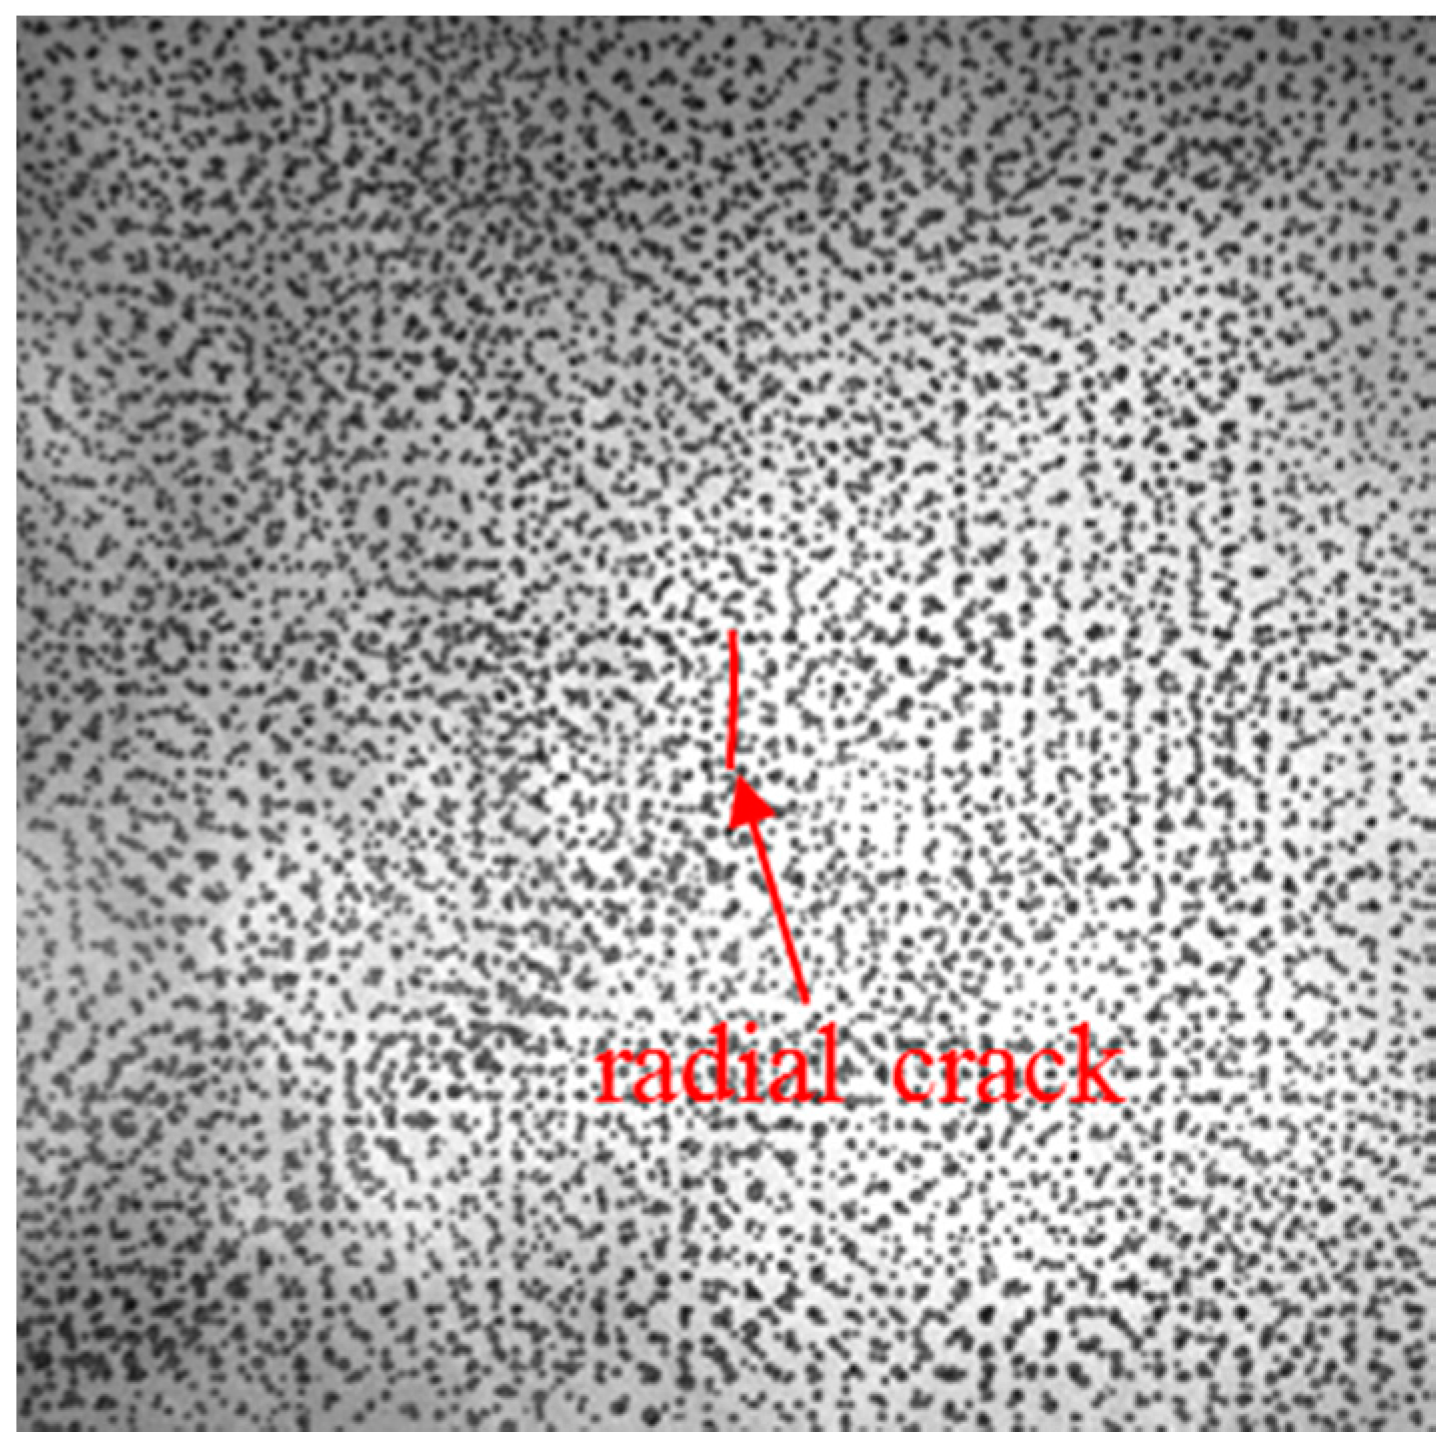
Static stress controls the direction of the maximum principal strain field during crater blasting, which in turn affects the formation of cracks. Without static load and under the equal biaxial compression, the direction of the maximum principal strain was perpendicular to the radius. Without static load, the maximum principal strain at the center of blasthole is greater than the dynamic fracture strain of rock, which led to the formation of randomly distributed radial tensile cracks on the free surface. Under the equal biaxial compressive static load and the stress-strength ratio was 0.42, the maximum principal strain at the center of blasthole did not reach the dynamic fracture strain of rock, which restrained the emergence of tensile cracks on the free surface. Under the uniaxial compressive static load, the maximum principal strain was perpendicular to the static loading direction. Under such tensile strain, initially, tensile cracks parallel to the loading direction emerged and propagated. Finally, only one macroscopic tensile crack parallel to the static loading direction was formed on the free surface and the other cracks were restrained.
(3)
Without static load and under the uniaxial compression, the dynamic tensile fracture strain of the sandstone was εtd = 0.00322. This indicated that, under the blasting-induced dynamic loading, the dynamic tensile fracture strain of the rock was independent of the initial static stress state. Therefore, considering the uniqueness of the tensile crack initiation and propagation on the free surface under the uniaxial compression, the proposed method can be used to measure the dynamic tensile fracture strains of various rocks at different loading rates.

Author Contributions

This paper is a result of the collaboration of all co-authors. F.Z. conceived and designed the study; G.Y. and Q.Y. conducted the experimental; G.Y. drafted the manuscript; J.G. and Y.L. revised the manuscript. All authors have read and agreed to the published version of the manuscript.

Funding

This research was funded by the State Key Research Development Program of China (Grant No. 2017YFC0602902).

Conflicts of Interest

The authors declare no conflict of interest.

References

  1. Egger, P. Design and construction aspect of deep tunnels. Tunn. Undergr. Space Technol. 2000, 15, 403–408. [Google Scholar] [CrossRef]
  2. Ranjith, P.; Zhao, J.; Ju, M.; Silva, R.; Rathnaweera, T.; Bandara, A. Opportunities and challenges in deep mining: A brief review. Engineering 2017, 3, 546–551. [Google Scholar] [CrossRef]
  3. Kang, H.P.; Zhang, X.; Si, L.P.; Wu, Y.Z.; Gao, F.Q. In-situ stress measurements and stress distribution characteristics in underground coal mines in China. Eng. Geol. 2010, 116, 333–345. [Google Scholar] [CrossRef]
  4. Dong, L.J.; Zou, W.; Li, X.B.; Shu, W.W.; Wang, Z.W. Collaborative localization method using analytical and iterative solutions for microseismic/acoustic emission sources in the rockmass structure for underground mining. Eng. Fract. Mech. 2019, 210, 95–112. [Google Scholar] [CrossRef]
  5. Kong, P.; Jiang, L.H.; Jiang, J.Q.; Wu, Y.N.; Chen, L.J.; Ning, J.G. Numerical analysis of roadway rock-burst hazard under superposed dynamic and static Loads. Energies 2019, 12, 3761. [Google Scholar] [CrossRef] [Green Version]
  6. Li, X.B.; Gong, F.Q.; Tao, M.; Dong, L.J.; Du, K.; Ma, C.D.; Zhou, Z.L.; Yin, T.B. Failure mechanism and coupled static-dynamic loading theory in deep hard rock mining: A review. J. Rock Mech. Geotech. Eng. 2017, 9, 767–782. [Google Scholar] [CrossRef]
  7. Li, H.B.; Li, J.C.; Liu, B. Direct tension test for rock material under different strain rates at quasi-static loads. Rock Mech. Rock Eng. 2013, 46, 1247–1254. [Google Scholar] [CrossRef]
  8. Peng, J.Y.; Li, Y.H.; Zhang, F.P.; Qiu, Z.G. Failure process and mechanism of sandstone under combined equal biaxial static compression and impact loading. Strain 2018, 54, e12267. [Google Scholar] [CrossRef]
  9. Feng, P.; Dai, F.; Liu, Y.; Xu, N.W.; Fan, P.X. Effects of coupled static and dynamic strain rates on mechanical behaviors of rock-like specimens containing pre-existing fissures under uniaxial compression. Can. Geotech. J. 2018, 55, 630–652. [Google Scholar] [CrossRef] [Green Version]
  10. Xie, L.X.; Lu, W.B.; Zhang, Q.B. Analysis of damage mechanisms and optimization of cut blasting design under high in-situ stresses. Tunn. Undergr. Space Technol. 2017, 66, 19–33. [Google Scholar] [CrossRef]
  11. Li, Y.H.; Peng, J.Y.; Zhang, F.P.; Qiu, Z.G. Cracking behavior and mechanism of sandstone containing a pre-cut hole under combined static and dynamic loading. Eng. Geol. 2016, 213, 64–73. [Google Scholar] [CrossRef]
  12. Zhu, Z.M. Numerical prediction of crater blasting and bench blasting. Int. J. Rock Mech. Min. Sci. 2009, 46, 1088–1096. [Google Scholar] [CrossRef]
  13. Ma, G.W.; An, X.M. Numerical simulation of basting-induced rock fractures. Int. J. Rock Mech. Min. Sci. 2008, 45, 966–975. [Google Scholar] [CrossRef]
  14. Yi, C.P.; Johansson, D.; Greberg, J. Effects of in-situ stresses on the fracturing of rock by blasting. Comput. Geotech. 2018, 104, 321–330. [Google Scholar] [CrossRef]
  15. Yilmaz, O.; Unlu, T. Three dimensional numerical rock damage analysis under blasting load. Tunn. Undergr. Space Technol. 2013, 38, 266–278. [Google Scholar] [CrossRef]
  16. Yang, R.S.; Ding, C.X.; Li, Y.L.; Yang, L.Y.; Zhao, Y. Crack propagation behavior in slit charge blasting under high static stress conditions. Int. J. Rock Mech. Min. Sci. 2019, 119, 117–123. [Google Scholar] [CrossRef]
  17. Yang, L.Y.; Ding, C.X. Fracture mechanism due to blast-imposed loading under high static stress conditions. Int. J. Rock Mech. Min. Sci. 2018, 107, 150–158. [Google Scholar] [CrossRef]
  18. He, C.L.; Yang, J. Experimental and numerical investigations of dynamic failure process in rock under blast loading. Tunn. Undergr. Space Technol. 2019, 83, 552–564. [Google Scholar] [CrossRef]
  19. Zhang, F.P.; Peng, J.Y.; Qiu, Z.G.; Chen, Q.K.; Li, Y.H.; Liu, J.P. Rock-like brittle material fragmentation under coupled static stress and spherical charge explosion. Eng. Geol. 2017, 220, 266–273. [Google Scholar] [CrossRef]
  20. Zhang, F.P.; Yan, G.L.; Peng, J.Y.; Qiu, Z.G.; Dai, X.H. Experimental study on crack formation in sandstone during crater blasting under high geological stress. B Eng. Geol. Environ. 2020, 79, 1323–1332. [Google Scholar] [CrossRef]
  21. Peng, J.Y.; Zhang, F.P.; Yan, G.L.; Qiu, Z.G.; Dai, X.H. Experimental study on rock-like materials fragmentation by electric explosion method under high stress condition. Powder Technol. 2019, 356, 750–758. [Google Scholar] [CrossRef]
  22. Gao, G.; Yao, W.; Xia, K.W.; Li, Z. Investigation of the rate dependence of fracture propagation in rocks using digital image correlation (DIC) method. Eng. Fract. Mech. 2015, 138, 146–155. [Google Scholar] [CrossRef] [Green Version]
  23. Alam, S.Y.; Loukili, A.; Grondin, F.; Roziere, E. Use of the digital image correlation and acoustic emission technique to study the effect of structural size on cracking of reinforced concrete. Eng. Fract. Mech. 2015, 143, 17–31. [Google Scholar] [CrossRef]
  24. Xing, H.Z.; Zhang, Q.B.; Ruan, D.; Dehkhoda, S.; Lu, G.X.; Zhao, J. Full-field measurement and fracture characterisations of rocks under dynamic loads using high-speed three-dimensional digital image correlation. Int. J. Impact Eng. 2018, 113, 61–72. [Google Scholar] [CrossRef]
  25. Zhang, H.; Nath, F.; Parrikar, P.N.; Mokhtari, M. Analyzing the validity of brazilian testing using digital image correlation and numerical simulation techniques. Energies 2020, 13, 1441. [Google Scholar] [CrossRef] [Green Version]
  26. Blaber, J.; Adair, B.; Antoniou, A. Ncorr: Open-source 2D digital image correlation matlab software. Exp. Mech. 2015, 55, 1105–1122. [Google Scholar] [CrossRef]
  27. Fauchille, A.; Hedan, S.; Valle, V.; Prêt, D.; Cabrera, J.; Cosenza, P. Effect of microstructure on hydric strain in clay rock: A quantitative comparison. Appl. Clay Sci. 2019, 182, 105244. [Google Scholar] [CrossRef]
  28. Wesseloo, J.; Stacey, T. A reconsideration of the extension strain criterion for fracture and failure of rock. Rock Mech. Rock Eng. 2016, 49, 4667–4679. [Google Scholar] [CrossRef]
  29. Fujii, Y.; Kiyama, T.; Ishijima, Y.; Kodama, J. Examination of a rock failure criterion based on circumferential tensile strain. Pure Appl. Geophys. 1998, 152, 551–577. [Google Scholar] [CrossRef]
Figure 1. Photo of the testing apparatus.
Applsci 10 06285 g001
Figure 2. Schematic and photo of the sandstone specimen (unit: mm).
Applsci 10 06285 g002
Figure 3. Magnitude and direction of maximum principal strain on the free surface in case of no static load: (af) images of maximum principal strain after 0 μs, 30 μs, 40 μs, 50 μs, 60 μs and 70 μs of explosion.
Applsci 10 06285 g003
Figure 4. Variation of ε1 at various points on the x and y axes at different moments in case of no static load: (a) x axis direction; (b) y axis direction.
Applsci 10 06285 g004
Figure 5. Initial pattern of cracks on the free surface in case of no static load.
Applsci 10 06285 g005
Figure 6. Magnitude and direction of maximum principal strain on the free surface in case of uniaxial static load: (af) images of maximum principal strain after 0 μs, 30 μs, 40 μs, 50 μs, 60 μs and 70 μs of explosion.
Applsci 10 06285 g006
Figure 7. Variation of ε1 at various points on the x and y axes at different moments in case of uniaxial static load: (a) x axis direction; (b) y axis direction.
Applsci 10 06285 g007
Figure 8. Initial pattern of cracks on the free surface in case of uniaxial compression load.
Applsci 10 06285 g008
Figure 9. Magnitude and direction of maximum principal strain on the free surface in case of equal biaxial compression: (af) images of maximum principal strain after 0 μs, 30 μs, 40 μs, 50 μs, 60 μs and 70 μs of explosion.
Applsci 10 06285 g009
Figure 10. Variation of ε1 at various points on the x and y axes at different moments in case of equal biaxial compression: (a) x axis direction; (b) y axis direction.
Applsci 10 06285 g010
Figure 11. Initial pattern of cracks on the free surface in case of biaxial compression load.
Applsci 10 06285 g011
Figure 12. Variation of the maximum principal strain ε1 at the blasthole center with time for different static loading conditions.
Applsci 10 06285 g012
Table 1. DIC hardware parameters.
CameraSpecialised Imaging, Kirana05M
Image resolution924 × 768 pixels2
Strain measurement accuracy3D ≤ 50 με; 2D ≤ 10 με
Measurement range0.005%–2000%
Maximum image acquistion rate5 million Hz, with 180 frames per shot
Image acquistion rate in experiment1 million Hz
LensNikon, AF 80–200 mm f/2.8D ED
Field-of-view320 × 385 mm2
Image scale2.4 pixels/mm
Stand-off distance2.0 m
Patterning techniqueBase of specimen surface with black ink stamped speckles
Pattern feature size (approximate)6 pixels
Table 2. DIC analysis parameters.
DIC softwareCSI, Vic-2D 6.0.6
Subset size17 pixels/7.08 mm
Step size7 pixels/2.92 mm
Subset shape functionAffine
Matching criterionZero-normalized squared differences
InterpolantOptimized 8-tap
Strain window6219 data points
Virtual strain gauge size600 pixels/250 mm
Strain FormulationLagrange
Displacement noise-floor0.01 pixels/0.0042 mm
Strain noise-floor10 μm/m

