Article

A Diversity Combination Model Incorporating an Inward Bias for Interaural Time-Level Difference Cue Integration in Sound Lateralization

1
Department of Biomedical Science and Engineering, Collage of Engineering, Koç University, 34450 Istanbul, Turkey
2
Collage of Engineering, Koç University, 34450 Istanbul, Turkey
3
Department of Medicine, Koç University, 34450 Istanbul, Turkey
*
Author to whom correspondence should be addressed.
Appl. Sci. 2020, 10(18), 6356; https://doi.org/10.3390/app10186356
Submission received: 31 July 2020 / Revised: 7 September 2020 / Accepted: 8 September 2020 / Published: 12 September 2020
(This article belongs to the Section Acoustics and Vibrations)

Abstract

:
A sound source with non-zero azimuth leads to interaural time level differences (ITD and ILD). Studies on hearing system imply that these cues are encoded in different parts of the brain, but combined to produce a single lateralization percept as evidenced by experiments indicating trading between them. According to the duplex theory of sound lateralization, ITD and ILD play a more significant role in low-frequency and high-frequency stimulations, respectively. In this study, ITD and ILD, which were extracted from a generic head-related transfer functions, were imposed on a complex sound consisting of two low- and seven high-frequency tones. Two-alternative forced-choice behavioral tests were employed to assess the accuracy in identifying a change in lateralization. Based on a diversity combination model and using the error rate data obtained from the tests, the weights of the ITD and ILD cues in their integration were determined by incorporating a bias observed for inward shifts. The weights of the two cues were found to change with the azimuth of the sound source. While the ILD appears to be the optimal cue for the azimuths near the midline, the ITD and ILD weights turn to be balanced for the azimuths far from the midline.

1. Introduction

The localization of sound sources plays a crucial role in animal behavior, and it is also a very important function for humans. Detecting sound source direction in horizontal plane is based on the disparities in time and the intensity of the sound reaching both ears, namely interaural time difference (ITD) and level differences (ILD) which are assumed to be responsible for sound lateralization in low and high frequencies, respectively [1]. This frequency-based behavioral dichotomy, which is known as the duplex theory of sound lateralization, has a physio-anatomical counterpart in the brain as is briefly explained below. Studies conducted on the hearing system suggest that ITD and ILD cues to sound lateralization are processed in the medial superior olive (MSO) and the lateral superior olive (LSO) sub-nulei of the superior olivary complex (SOC) located in the brainstem, respectively. However, there is some debate about the roles and neural mechanisms of these nuclei in mammalian sound lateralization [2]. The impulses from the cochlear nucleus ipsilateral to the ear are considered to go directly to the ipsilateral LSO. These impulses provide excitatory input to the neurons of ipsilateral LSO and send inhibitory impulses to the contralateral LSO via inhibitory interneurons in the medial nucleus of the trapezoid body (MNTB) [2]. This process provides the nucleus a neural mechanism capable of encoding interaural intensity differences [3]. On the other hand, the MSO receives excitatory inputs directly from both ipsi- and contra-lateral cochlear nuclei. Meanwhile, a neural network forms axonal delay lines that travel in opposite directions over the impulses from the two ears [4]. Such an arrangement makes the nucleus a neural mechanism capable of encoding interaural time differences as hypothesized by Jeffress in his classical model [5]. In addition to this histo-anatomical arrangement, there exists a tonotopic organization in the auditory system of the brain so much so that the neurons display selectivity to the frequency of the stimulating sound. Interestingly, most LSO units that produce discharge rates related to interaural level difference are mostly responsive to sounds with high frequencies [2,6]. On the other hand, the majority of the units in MSO, which achieves the place-coding of interaural time differences, are most responsive to sounds with low frequencies [2]. This appears to be a physio-anatomical compliance of the auditory brain with the physics of the acoustical environment, which reveals itself as the frequency-dependent weights of ITD and ILD in sound lateralization as expressed by duplex theory [7]. This theory describes the complementary roles of ITD and ILD cues in the lateralization of pure tones at low and high frequencies, respectively. While the acoustic shadowing of the head is negligible for low-frequency sounds, it is quite large for the sounds at high frequencies. This results in the ILD assuming a dominant role in the lateralization of high-pitched sounds [1,8,9]. There is indeed a vast amount of information in the literature about the coding of the ITD and ILD cues in auditory nuclei of the brainstem and tegmentum in avaians and vertebrates. However, how these two pieces of information are combined in the higher centers of the brain and cortex still remains to be explained and modeled. The present modelling study using a communications approach based on the measured psychophysical error-rate data is an attempt in this direction.
Sound localization in humans has been studied intensively for several years. Some of the studies [9,10,11,12,13] focused on trading between ITD and ILD cues by adjusting these cues to produce a centered acoustic image that gives the point of equivalence between the cues, and the ratio of ITD to ILD in that situation gives the ITD/ILD trading ratio using single-frequency tones.
The frequency-based behavioral dichotomy which is known as the duplex theory of sound lateralization is a simplification. In the real world, the listener exposed mostly to the sounds, which are the combination of many frequencies rather than a single tone. Therefore, in later years researchers went beyond the classical duplex theory and studied the utility of ongoing ITD cues in the envelopes of low-frequency, high-frequency and complex sounds presented via headphones [8,14].
Other groups of studies focused on processing information in different layers of the hearing system, from the external ears to the auditory cortex, by investigating the combination or integration of ITD and ILD cues by the means of electro-encephalography (EEG) and/or psychophysical experiments. Schroger [15] used a single tone and a complex sound to study the availability of two separate regions in the brain to process ITD and ILD information. Salminen et al. [16] used independently manipulated stimulations to produce sounds with either only one or both ITD and ILD cues by using head-related transfer function (HRTF) of the participants. The value of only one of the cues was applied by keeping the other cue at zero for ITD-only and ILD-only conditions. Their magneto-encephalographic (MEG) and psychoacoustical results, however, reveal the existence of neurons sensitive to both ITD and ILD cue information in the auditory cortex.
Physically in the real world, ITD and ILD change together with the azimuthal position of a sound source. However, in dichotic hearing conditions, where the sound to the ears is transmitted via stereophonic earphones, the ILD and ITD cues can be changed independently of each other. It is even possible to compensate an ITD-induced sound image shift towards one ear by changing the ILD in favor of the other ear [17]. There are two approaches available regarding the sound images based on the ITD and ILD cues. The first one suggests that the cues may not be completely combined and the subjects sometimes perceive two images when ITDs and ILDs conflict [18]. The second scenario is that the two pieces of information carried by these two cues should either share a common pathway or undergo a combining process in the brain. The commonality in the coding of ITD and ILD cues is discussed by Hafter et al. [19]. The results show a combination of the cues by algebraically adding the d’values resulted from the judgments of the ITD-only and ILD-only stimulus types. They argue that the ITD and ILD cues are sharing a common neural representation.
In order to understand the significance of cues in different frequencies, Macpherson and Middlebrooks [8] used a virtual auditory space approach to quantify the relative strength (weight) of ITD and ILD cues in low-pass, high-pass, and wideband noise bursts. In their stimulation sounds, the interaural time and level differences were manipulated by delaying or attenuating the stimuli sound to one ear. Their results revealed that, while the ITD is weighted weakly for high-pass stimuli the ILD is weighted strongly for high-pass stimuli even when substantial biases were introduced. In some studies, the performance of the participants in judgments differs depending on the direction and the cue used in the stimulation sounds. To test the existence of bias in lateralization, Wood and Bizley [20] studied the relative sound localization (the target sound originated from the left or right of a reference sound) with rather greater values of the time and level differences when a multi-source noise background is present besides stimulation sounds. Their results showed that the subjects were more biased in the band-pass noise condition. They claimed this type of bias which shifts the decision criteria in the direction of the hemifield in which the stimulation is presented as the “response bias” [20,21]. To test the effect of direction in localization, however, Magezi and Krumbholz [22] studied EEG responses for the low-pass filtered stimulations (1500 ms–250 ms pair of noise sounds with a frequency less than 1kHz) in which the ITD change was either away from (outward) or toward the midline (inward). Their findings suggest that ITDs are coded non-topographically and the majority of the neurons in each hemisphere are sensitive to ITD. Results of a similar study [23] confirm the effect of biasing perceived laterality toward midline with decreasing intensity of stimulation sound.
Regardless of whether its origin is a real source or is an intracranial image (created by dichotically presented acoustic signals), a sound is always associated with a pair of directional ITD and ILD cues. To have a proper assessment of the weights of the ITD and ILD cues in the localization of a sound source each of the cues must be presented separately for the listener and their lateralization performance must be measured. ILD and ITD cues can be changed independently from each other under dichotic hearing conditions. However, this does not provide the opportunity to present one of these cues to the listener on its own and discarding the other cue completely. That is, only a single cue cannot be isolated and studied by ignoring the other. For instance, when a sound is presented with a cue combination of ITD = 0 s and ILD = 6 dB, it does not mean that the sound will carry no ITD information but that the ITD cue will still be pointing the median plane, and it will have a certain effect on the perceived lateralization of the source.
The main aim of the present study is to investigate the relative contribution of ITD and ILD cues in sound lateralization and their weight values by the means of complex stimuli consisting of low and high frequencies. For this reason, instead of absolute azimuthal positions, the changes in the azimuth of a sound source are used in the present study. The stimuli are designed as pairs of sounds to create the necessary azimuthal changes. The first sound (reference) of the stimulus pair is made to have the ITD and ILD of a reference azimuth ( θ ). The azimuth of the second sound (probe) differed from the first one, assuming an azimuthal change of 10 for both or either of the ITD and ILD cues. This change is made in the following three ways to produce azimuthal shifts toward the midline or the periphery:
(i)
TO: Only ITD cue moves from θ to either θ 10 or θ + 10 .
(ii)
LO: Only ILD cue moves from θ to either θ 10 or θ + 10 .
(iii)
TL: Both ITD and ILD cues move from θ to either θ 10 or θ + 10 .
Using paired-comparison in psychological experiments has several advantages in the cross-moderation context. Firstly, the securities of the judges are not based on the individuals, rather the relative merit turns out to be important. Secondly, the analysis model handles missing data as the estimate of the scale separation between any two series does not depend on which other scripts they are compared with. Thirdly, fitting an explicit model to the results allows investigating the residuals to detect misfitting series and bias in judgments [24]. Choosing such a method makes it possible to impose either of the ITD and ILD cues independently from each other as is also the case when conventional methods are used to assess the relative roles of these cues in sound lateralization and the trading between them.
A study by Buus et al. [25] showed that the psychometric functions, which were used for the auditory discrimination and detection tasks were parallel for single and 18-tone complex stimulation. The weights of the ITD and ILD cues were found to depend on the sound frequency [1,8,26]. To have both the ITD and ILD cues and a complex stimulus rather than a single low or high-frequency pure tone in the present study, the test stimulus sounds are chosen from a combination of low- and high-frequency harmonics of a 261 Hz tone. The harmonics included, as shown in Figure 1, are at the frequencies of 261, 522, 1827, 2349, 2871, 3393, 3915, 4437, and 4959 Hz. In a study by Rakerd and Hartman [27], they used complex signals of mid-band (noise with a center frequency of 750 Hz) and high-band (noise with a center frequency of 2850 Hz) to find the effectiveness of ITD and ILD cues by measuring the ITD when there was an opposing ILD of 0, 1 or 2 dB in different reverberation conditions. In the present study, however, the first two harmonics of a 261-Hz tone are chosen as low-frequency components and its 7th through 19th odd harmonics are chosen as high frequency components of the test stimulus. As the effect of the ITD and ILD cues are of equal importance for mid-frequencies (783 Hz∼1566 Hz) this range are discarded from the stimulus and instead, the ranges in which either of the ITD and ILD cues is mostly effective in lateralization are selected. Another reason why the second harmonic of the 261 Hz-tone, which would have been at 783 Hz, is not included in the low-frequency band of the sound stimulus is connected to the findings suggesting that humans may use different ITD-based sound lateralization strategies for different sound frequencies. For instance, based on data from the barn owl, gerbil, cat, and human, Harper and McAlpine [28] proposed a model in which two types of optimum coding strategy were apparent: In humans, for the lowest frequencies, the optimum strategy involves two distinct sub-populations, as for the classical case of the gerbil, whereas for the highest frequencies above 700 Hz a homogeneous distribution is optimal. Because 500 Hz appears to be the frequency where the transition from the classical strategy to a different strategy takes place, we prefer the former to avoid possible complications which might be caused by the involvement of two different ITD-coding strategies respectively for frequencies lower than 700 Hz and between 700 Hz and 1500 Hz. To impose location information to sound bursts, various studies conducted previously used arbitrary ITD and/or ILD values from available trading ratio tables [29] or the cue values extracted from the head-related transfer function (HRTF) [30,31,32]. The results of a study by Begault et al. [33], in which they compared the localization performances of the subjects when they were presented with virtual sounds simulated by using individualized and generic HRTFs, showed that there was no clear advantage in using individualized HRTFs in this respect (under both echoic and anechoic conditions). Therefore, in the current study, we use the ITD and ILD values that are extracted from a generic HRTF dataset.
In the current study, we present two main contributions in modeling roles of ITD and ILD in sound lateralization. First, we model the direction of arrival of a single tone separately for ITD and ILD cues in the form of phase and magnitude differences, which are extracted from the frequency domain characterization of the right and left HRTF responses. This avails us to monitor contribution of each cue in perceived lateralization change precisely, whereas in the literature common practice sets one of the ITD or ILD cue as the control signal and sets the other one to zero that results one cue to point the center. Second, we estimate the relative contribution of the ILD and ITD cues in sound lateralization using the diversity combination assumption for the integration of these cues based on the binary additive white-Gaussian noise channel model.

2. Experimental Methodology

2.1. Participants

The participants of this study were three male and two female subjects, all of which were a student at KOÇ University and aged between 25 and 35. The participants received a reward for participating in the study. All the participants passed an audiological test with pure-tone thresholds for both ears within normal limits from 250 to 9000 Hz, and none of the participants reported to have any audiological or neurological diseases. The experiment procedure of the study was approved by the Ethics Committee of the School of Medicine at the KOÇ University.

2.2. Stimulation

The time and level differences were extracted between the left and right channels at a given frequency using the discrete Fourier transform (DFT) of the impulse response sequences from a previously recorded HRTF database [34]. The DFT of a single channel HRTF impulse response h θ c ( n ) at frequency index k i is given as,
H θ c ( k i ) = 1 N n = 0 N 1 h θ c ( n ) e j 2 π k i n N ,
where the HRTF h θ c ( n ) is defined for channel c, left or right, at azimuth angle θ , and k i is the frequency index that corresponds to k i = f i f s + 0.5 at frequency f i with sampling frequency f s . Magnitude ratio and phase difference of the right, H θ r , and the left, H θ l , channels at frequency f i are respectively computed as,
α θ ( k i ) = | H θ r ( k i ) | | H θ l ( k i ) | ,
ϕ θ ( k i ) = a r g ( H θ r ( k i ) ) a r g ( H θ l ( k i ) ) .
Then, the power ratio of α θ 1 2 at azimuth θ 1 and the phase difference of ϕ θ 2 at azimuth θ 2 are used to define a sound stimulus with the right and left channels as,
s r ( t ; α θ 1 , ϕ θ 2 ) = 1 9 i = 1 9 α θ 1 ( k i ) s i n ( 2 π f i t + 1 2 ϕ θ 2 ( k i ) ) ,
s l ( t ; α θ 1 , ϕ θ 2 ) = 1 9 i = 1 9 1 α θ 1 ( k i ) s i n ( 2 π f i t 1 2 ϕ θ 2 ( k i ) ) ,
where the azimuth angles θ 1 and θ 2 respectively refer to the ILD and ITD cues. It should be noted that the formulated sound stimulus was flexible to set the ILD and ITD cues from different azimuth angles. The duration of the sound signals was set to 200 ms and a Hanning window of 50 ms for onset and 50 ms for offset was used to eliminate the onset/offset effects of the rise and fall of the stimuli on the perceived lateralization through its envelope ITD.
In the experiments, the stimuli sounds were presented to the participants in pairs of sound bursts consisting of a reference sound and a probe sound with a 200 msec gap between them. The reference sound was the first sound of the stimulus pair and contained interaural time and level cue information of azimuth θ . That is, the α and ϕ values were set to azimuth θ and the reference sound was defined as, s c ( t ; α θ , ϕ θ ) , at channel c. The probe sound was the second sound of the stimulus pair. Probe sounds are defined under three conditions based on time and level cues they use. These conditions are time-only (TO), level-only (LO), and time-level (TL). The TO probe sound uses the ILD information from azimuth θ and the ITD information from azimuth ( θ ± 10 ). Then, the resulting TO stimulus can be given as: s c ( t ; α θ , ϕ θ ± 10 ) . The LO probe sound uses the ITD information from azimuth θ and the ILD information from azimuth ( θ ± 10 ). Then, the resulting LO stimulus can be given as: s c ( t ; α θ ± 10 , ϕ θ ) . The TL probe sound uses both of the ITD and ILD information from azimuth ( θ ± 10 ). Hence, the resulting TL stimulus can be given as: s c ( t ; α θ ± 10 , ϕ θ ± 10 ) . A sample visualization of the reference and probe sounds are given in Figure 2.
To adjust the intensity of the sound stimuli to be used in experiments, the reference sound for zero azimuth was presented to fifteen normal hearing participants with no reported audiological problems, and their absolute hearing thresholds for this sound were determined. Taking the average of these individual thresholds as 0 dB nHL, the intensity of this reference sound was set to 67 dB above that level namely to 67 dB nHL.)

2.3. Experiments

The psychophysical lateralization experiments were conducted inside a chamber with 40-dB sound attenuation. Stimuli were presented with an inter-stimulus interval of 3 seconds. There were always 10 degrees of azimuth difference between the reference and probe sounds of the stimulus and the participants’ task was to report whether the probe sound was heard from the left or right side of the reference sound by pressing one of the two respective keys (Left/Right arrows) on a typical computer keyboard before the next stimulus.
Stimulation sounds were presented by using a pair of Etymotic Research 61-Martin Lane (Etymotic R-2A) audiological earphones with a flat frequency response that was driven by an external USB sound card (MUSE Mini DAC). The stimuli were presented to the participants using a MATLAB Graphical User Interface (GUI). During the experiments, the sound pairs with different reference azimuthal angles and shift directions were randomly presented so that the participants were not able to learn and predict the type of the next pair of sounds in the stimulation sequence. An experiment with one subject was performed in three separate sessions for each of the TO, LO, and TL conditions. Table 1 shows all the stimulation pairs presented in the experiments. It should be noted that only the ones that were symmetric around the reference were used in the error rate calculations (In contrast to these azimuths, each of which has a pair of outward and a pair of inward trials, the azimuth 40 degree, has only one outward and one inward conditions, that is, “30 to 40” and “40 to 30”. In order to maintain an equal number of samples for every azimuth, 40 degrees is excluded from the analysis.). Each session included 10 experimental blocks. Each block included 16 combinations of reference-probe sounds from 3 conditions (i.e., 16 TO, LO or TL) and each combination was repeated 10 times in a block. Hence, the test included 4800 judgments per subject.
Since the experiment was in a two-alternative forced-choice (2AFC) format, each response to the stimulus pair was taken as a HIT or a FALSE. If the participant was unable to answer the test in 2 s, a MISS was reported for the stimuli. The experimental data showed that the total MISS rate was 3 out of 24,000 trials (0.0125%), thus the MISS responses were discarded. The error rate was found over the total number of HIT and FALSE responses as,
E r = N F N H + N F ,
where N H and N F are respectively the total numbers of hit and false responses. The experimental SNR (Signal to Noise Ratio)values were then extracted from the error rate, E r , under the binary additive white-Gaussian noise channel model as,
S N R = ( erfc 1 ( 2 E r ) ) 2 ,
where erfc 1 ( ) is the inverse of the complementary error function [35] defined as,
erfc ( x ) = 2 π x e t 2 d t .
The error rate at each azimuth θ also defined based on whether the probe sound’s azimuth is inward (towards the center) or outward (away from the center) with respect to the reference sound’s azimuth. The inward and outward azimuth angles are defined as θ i n = s i g n ( θ ) ( | θ | 10 ) and θ o u t = s i g n ( θ ) ( | θ | + 10 ) , where s i g n ( θ ) is positive if the azimuth θ is at the right side and negative if the azimuth is at the left side of the horizontal mid-line.
N F ( θ r , θ p ) is used to define the number of false responses for the azimuth of the reference and probe stimuli for θ r and θ p , respectively. In this case, the number of false responses for inward N F i n ( θ ) , and outward N F o u t ( θ ) , cases are defined as,
N F i n ( θ ) = N F ( θ o u t , θ ) + N F ( θ , θ i n ) ,
N F o u t ( θ ) = N F ( θ , θ o u t ) + N F ( θ i n , θ ) ,
for all non-zero θ values, that is, θ = ± 10 , ± 20 , ± 30 degrees. The number of hit responses for inward and outward cases can be computed similarly and represented as N H i n ( θ ) and N H o u t ( θ ) .
Considering the symmetry of the left and right sides of the horizontal mid-line, the number of false and hit responses can be calculated for absolute azimuth angles over both the left and right sides. The number of false responses around an absolute azimuth θ in inward and outward directions are found at absolute azimuth values, θ = 10 , 20 , 30 as follows:
N F i n ( | θ | ) = N F i n ( θ ) + N F i n ( θ ) ,
N F o u t ( | θ | ) = N F o u t ( θ ) + N F o u t ( θ ) .
Similarly, N H i n ( | θ | ) and N H o u t ( | θ | ) can be defined for hit responses. At θ = 0 , the inward and outward false responses are defined as,
N F i n ( θ ) = N F ( 10 , θ ) + N F ( 10 , θ ) ,
N F o u t ( θ ) = N F ( θ , 10 ) + N F ( θ , 10 ) .
Finally, the error rates for inward (in) and outward (out) cases are defined at absolute azimuth values, θ = 0 , 10 , 20 , 30 as follows:
E r i n ( | θ | ) = N F i n ( | θ | ) N F i n ( | θ | ) + N H i n ( | θ | ) ,
E r o u t ( | θ | ) = N F o u t ( | θ | ) N F o u t ( | θ | ) + N H o u t ( | θ | ) .

3. Experimental Results

3.1. Experimental Data

The experimental data obtained from the five participants are pooled together and SNR values computed from error rates are presented in Table 2. Note that, S N R i n and S N R o u t are calculated using E r i n and E r o u t values.
The results in Table 2 also emphasize the differences between inward ( S N R i n ) and outward ( S N R o u t ) SNR values. It can be seen from the table that the SNR values of the inward cases are consistently larger than the outward ones except for the S N R L O o u t at 0 azimuth. For the TO, LO, and TL conditions, the SNR difference ( S N R i n S N R o u t ) increases with the increasing azimuth. This can be considered as a bias between inward and outward decisions, meaning that the participants mostly chose to make a “toward center” decision for sound’s azimuth changes when they find it difficult to make a decision. Note that this bias occurs regardless of the type and azimuth of the imposed cue and gets smaller as the azimuth moved toward the horizontal mid-line.

3.2. Statistical Results

A 3-way ANOVA over the SNR values with the independent factors being Azimuth ( 0 , 10 , 20 , 30 ), Cue (TO, LO, TL) and shift Direction (inward, outward) confirmed the statistical significance of Azimuth [F(3,57) = 254.52, p< 0.000, η p a r t i a l 2 = 0.931 ], Cue [F(2,38) = 2282.04, p< 0.000, η p a r t i a l 2 = 0.992 ] and Direction [F(1,19) = 1945.69, p< 0.000, η p a r t i a l 2 = 0.990 ]. The values confirmed that each of the factors individually affect the performance of detecting shift direction. Interactions among all pairs of factors were also significant as follows. Azimuth x Cue: [F(6,114) = 365.42, p< 0.000, η p a r t i a l 2 = 0.951 ], Cue x Direction: [F(2,38) = 13.48, p< 0.001, η p a r t i a l 2 = 0.415 ] and Azimuth x Direction: [F(3,57) = 1011.58, p< 0.000, η p a r t i a l 2 = 0.982 ]. The differences in all of the tests are confirmed to be statistically significant. The Azimuth x Cue x Direction interaction is also found to be significant [F(6,114) = 5.66, p = 0.002, η p a r t i a l 2 = 0.230 ]. This shows that each of the pairwise interactions may change significantly depending on the levels of the remaining factors.
The stimuli used in the study have three types: TO, LO and TL. The sum of the SNR values of the TO and LO conditions is denoted by S N R T + L and compared to the S N R T L to see if the cue combination is additive ( S N R T L = S N R T + L ), super-additive ( S N R T L > S N R T + L ) or sub-additive ( S N R T L < S N R T + L ).
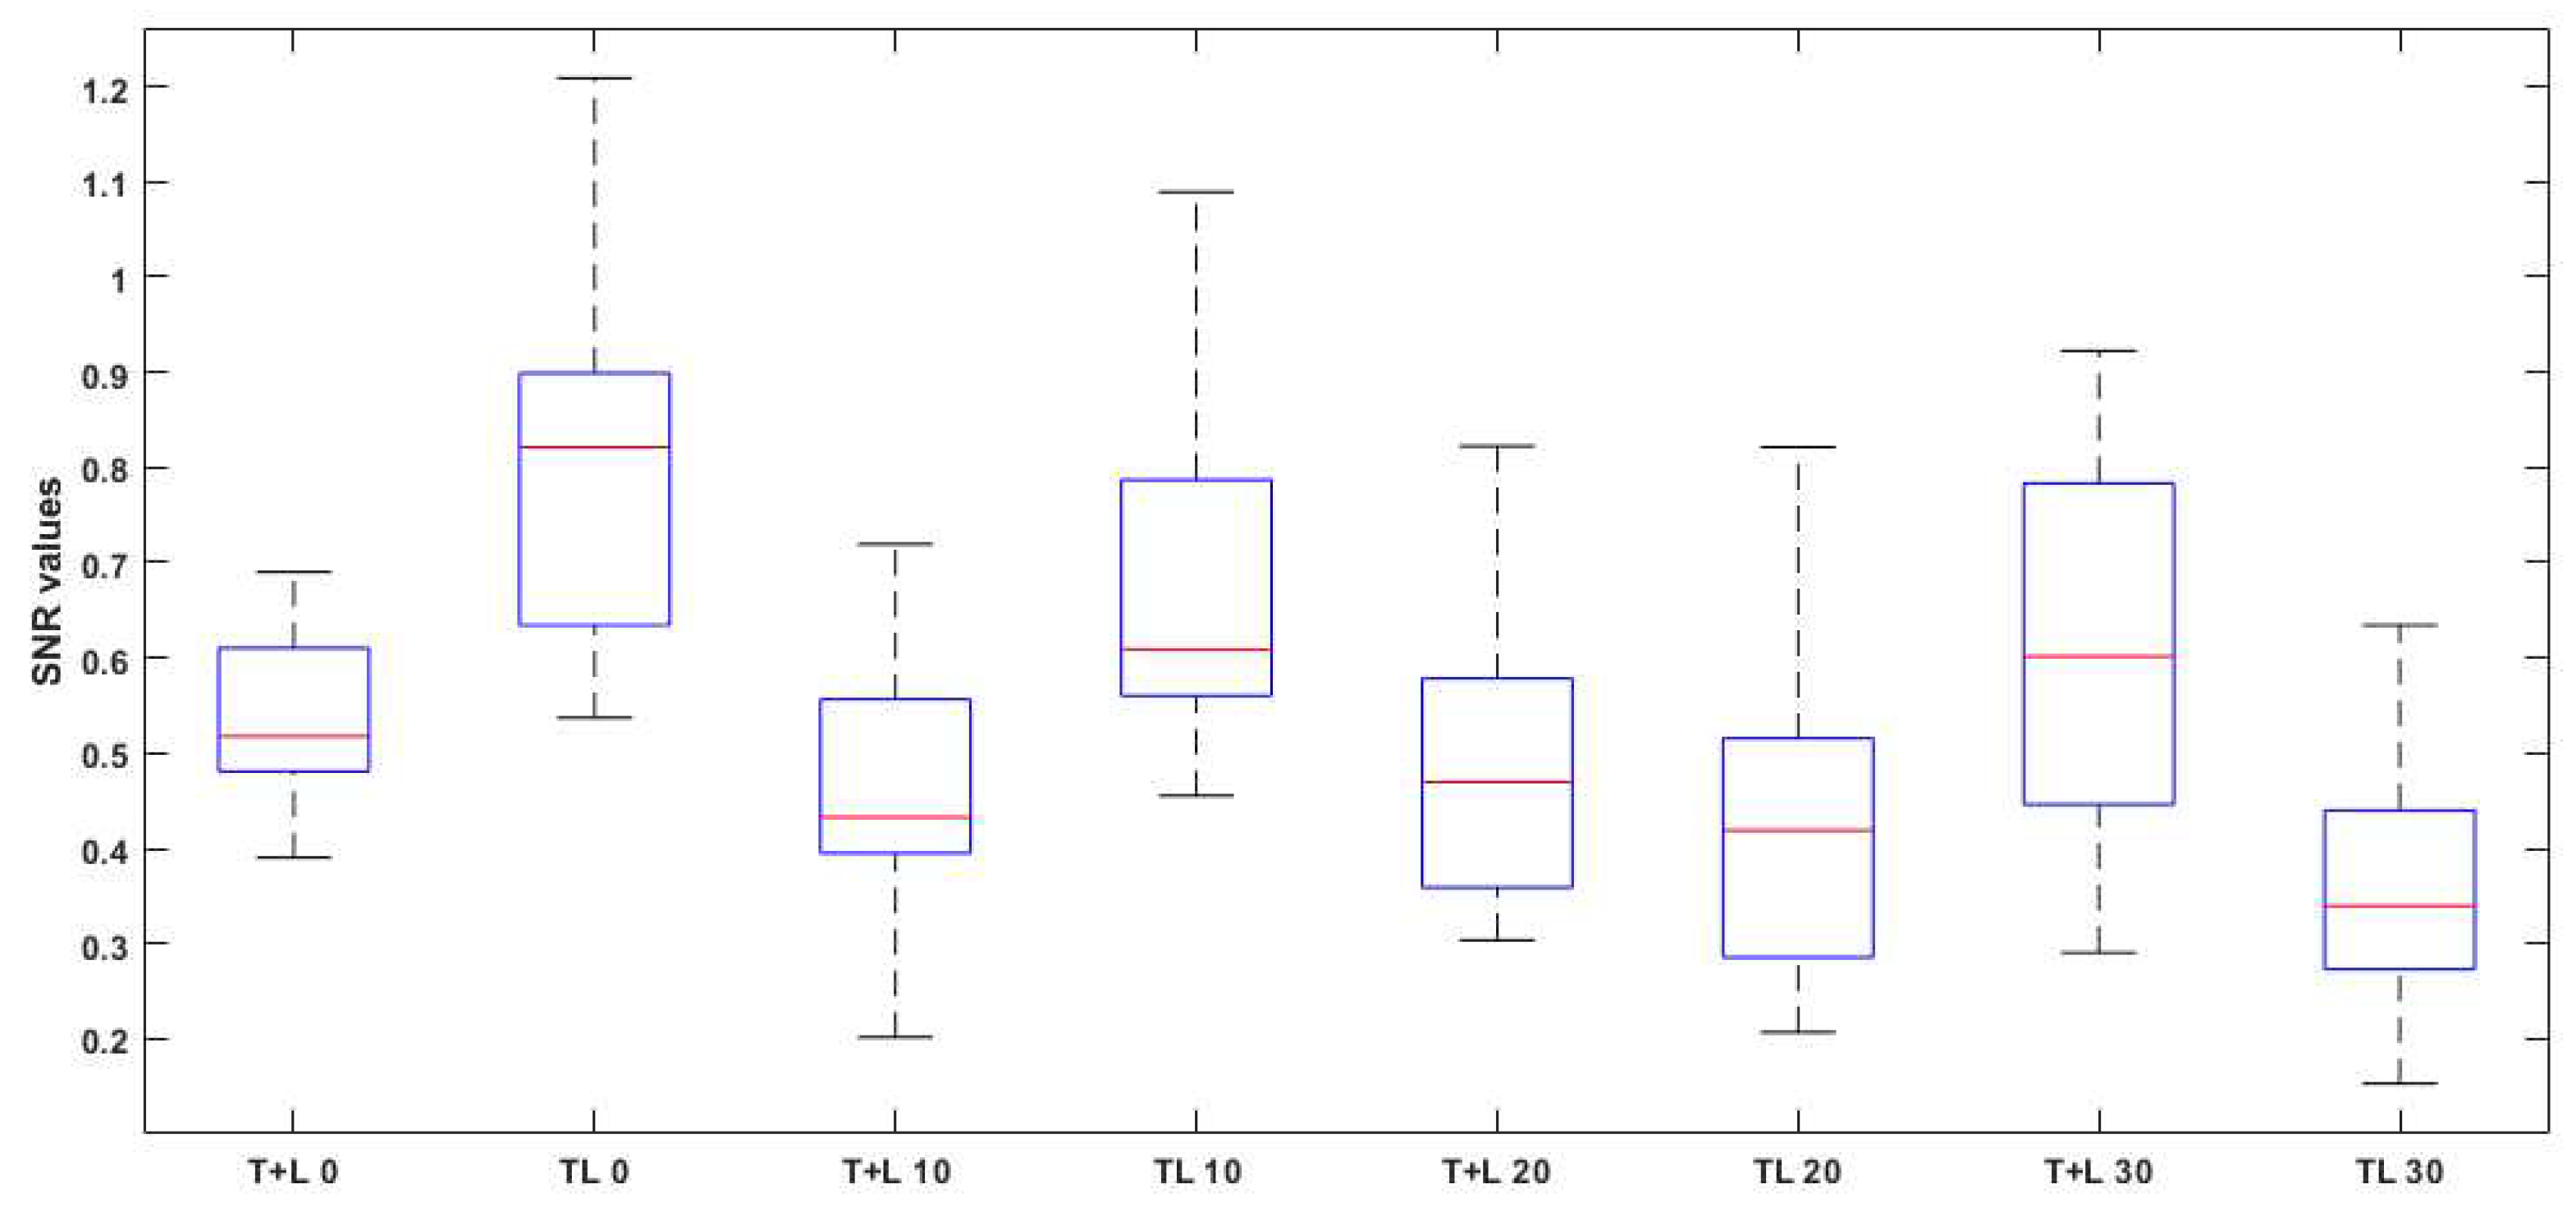
In order to test if S N R T L and S N R T + L are significantly different from each other, the error rate data of the five participants are pooled and 20 re-sampled (bootstrapped) data of size 100 samples were drawn. The median, quartile, minimum, and maximum SNR values computed from these error rates for the mentioned combinations are given as boxplots in Figure 3. The SNR values of T+L are calculated ( S N R T + L = S N R T L + S N R L ). Then the SNR data used for testing the additivity, super- and sub-additivity of the cues in different azimuths. Based on the data a super-additivity is observed for 0 and 10 . Increasing the azimuth leads to additivity and sub-additivity in rather peripheral azimuths of 20 and 30 . To test the statistical significance of the differences between combinations, a 2-way ANOVA with the factors Combination (T+L and TL) and Azimuth (0, 10, 20, and 30) is applied. Significant effects are noted for Combination [F(1,19) = 5.99, p = 0.024, η p a r t i a l 2 = 0.240 ] and for Azimuth [F(3,57) = 9.41, p< 0.000, η p a r t i a l 2 = 0.331 ]. Interaction of Azimuth with Combination also proves to be significant [F(3,57) = 30.56, p< 0.000, η p a r t i a l 2 = 0.617 ], which indicates that the effect of Combination strongly depends on Azimuth. To study this dependency p o s t h o c t-tests are also applied for testing the significance of the differences between S N R T L and S N R T + L in the four azimuthal conditions. The differences are found significant, except for 20 where T+L and TL profile lines intersect each other, indicating a transition in the type of cue-combination from super-additivity to sub-additivity.

4. Modeling

4.1. Biased Diversity Combination

A diversity combination approach is proposed for the fusion of the ITD and ILD cues for the lateralization decision in the brain. The lateralization decision could be considered as an estimation problem under additive white Gaussian noise for each of the cues as,
Δ ^ L = Δ L + n L ± β L and Δ ^ T = Δ T + n T ± β T ,
where Δ ^ L and Δ ^ T respectively represent observed lateralization changes due to the ILD and ITD cues while n L and n T are zero-mean Gaussian random noise sources with σ L 2 and σ T 2 variances, and β L and β T are the positive bias factors for LO and TO conditions representing the inward and outward decisions respectively with additive (plus) and subtractive (minus) contributions.
The fusion of the ITD and ILD cues for the lateralization decision is defined in the diversity combination framework as follows:
Δ ^ T L = λ Δ ^ L + ( 1 λ ) Δ ^ T = λ ( Δ L + n L ± β L ) + ( 1 λ ) ( Δ T + n T ± β T ) = Δ T L + λ n L + ( 1 λ ) n T ± λ β L ± ( 1 λ ) , β T
where Δ T L = Δ L = Δ T is the noise-free lateralization change, Δ ^ T L is the observed lateralization change due to weighted fusion of ILD and ITD cues with weights λ and ( 1 λ ) , respectively. The weight parameter λ should be in ( 0 , 1 ) interval. Assuming that the noise sources are uncorrelated, the estimated SNR of the observed lateralization change of the combined cues were found as,
S N R T L ¯ ± = ( Δ T L ± λ β L ± ( 1 λ ) β T ) 2 λ 2 σ L 2 + ( 1 λ ) 2 σ T 2 ,
where the plus representing the inward and the minus representing the outward decisions.
Under the biased diversity combination assumption, the task is to find the optimal model parameters in order to minimize the difference between the estimated and experimental SNR values. These parameters are noise variances, bias factors and the fusion weight. This results into a multi-variable optimization problem, where the following six SNR difference functions are defined as,
D 1 = S N R T O ¯ + S N R T O i n = ( ( 1 λ ) ( Δ + β T ) ) 2 λ 2 σ L 2 + ( 1 λ ) 2 σ T 2 S N R T O i n ,
D 2 = S N R L O ¯ + S N R L O i n = ( λ ( Δ + β L ) ) 2 λ 2 σ L 2 + ( 1 λ ) 2 σ T 2 S N R L O i n ,
D 3 = S N R T O ¯ S N R T O o u t = ( ( 1 λ ) ( Δ β T ) ) 2 λ 2 σ L 2 + ( 1 λ ) 2 σ T 2 S N R T O o u t ,
D 4 = S N R L O ¯ S N R L O o u t = ( λ ( Δ β L ) ) 2 λ 2 σ L 2 + ( 1 λ ) 2 σ T 2 S N R L O o u t ,
D 5 = S N R T L ¯ + S N R T L i n = ( Δ + λ β L + ( 1 λ ) β T ) 2 λ 2 σ L 2 + ( 1 λ ) 2 σ T 2 S N R T L i n ,
D 6 = S N R T L ¯ S N R T L o u t = ( Δ λ β L ( 1 λ ) β T ) 2 λ 2 σ L 2 + ( 1 λ ) 2 σ T 2 S N R T L o u t ,
which are jointly minimized for λ , β T , β L , σ T and σ L when the experimental lateralization change is set as Δ = 10 . Note that a set solution for the parameters can be extracted for each absolute azimuth values, θ = 0 , 10 , 20 , 30 .
Let us define the parameter vector for the optimization problem as x = [ λ , β T , β L , σ T , σ L ] and the mean square SNR error over the six SNR differences as F ( x ) = 1 6 k = 1 6 D k 2 . Then the optimization problem is defined to minimize the mean square error,
x * = a r g m i n s . t . x 0 = 0 , l b x u b F ( x ) ,
where x 0 is the initial parameter vector and l b and u b are set to [0, 0, 0, 0, 0] and [1, 10, 10, 100, 100] as the lower and upper bounds for the x vector, respectively. The above optimization problem was solved by the nonlinear solver (fmincon) based on the Rosenbrock function [36] using the MATLAB Optimization Toolbox [37].

4.2. Fitting the Model to Experimental Data

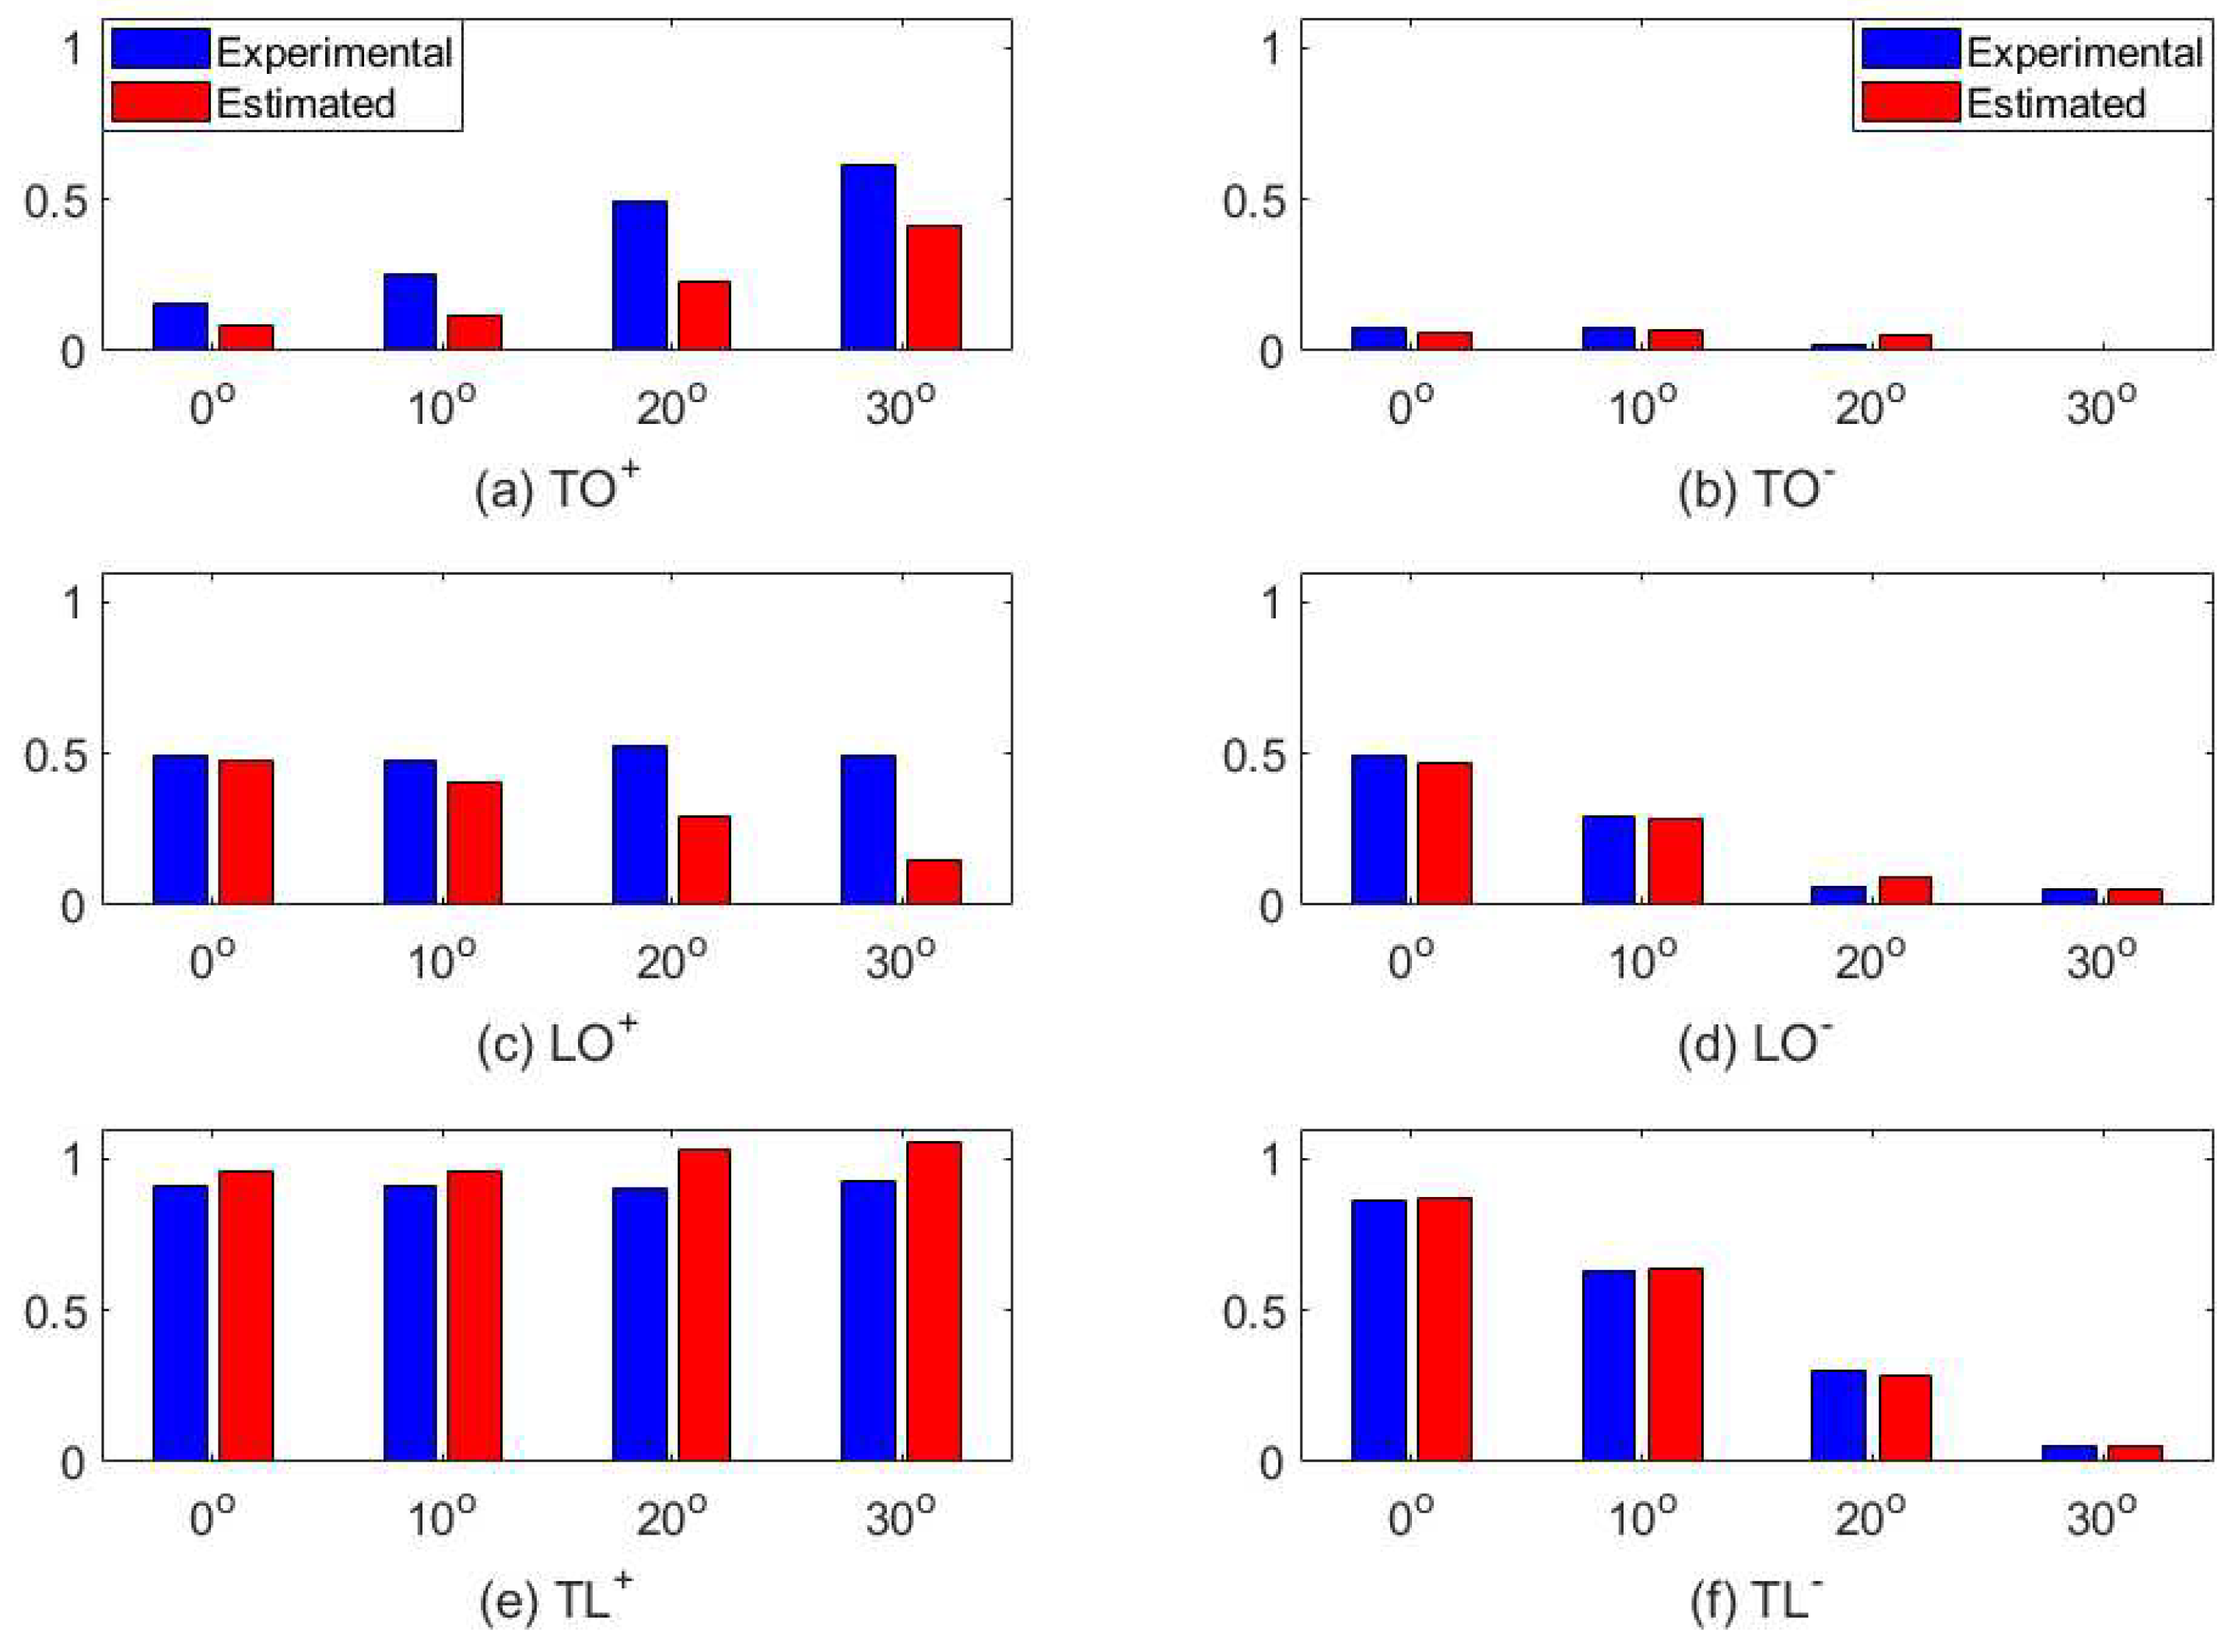
As a result of the optimization in (26) optimal values of λ , β T , β L , σ T and σ L were extracted and presented in Table 3. The estimated SNR values were calculated using the optimal parameter values in (19) at each azimuth and presented in Table 4. The differences between the experimental and estimated SNR values were then calculated for TO, LO and TL (inward and outward) cases as T O + , T O , L O + , L O , T L + and T L . The experimental and estimated SNR differences are given in Figure 4. All of the SNR values, apart from T O + (all azimuths) and L O + (20o and 30o), were close to the experimental data.
Table 3 shows that the ILD cue weight, λ , is decreasing with the increasing azimuth and the bias values, β T and β L are increasing as azimuth increases. The increase in azimuth has more influence on ITD than ILD as the β T increased drastically from 0.900 for 0 to 9.868 for 30 . The increase in azimuth makes the differences in β T more apparent, which shows the inability of the ITD cue to compensate for the ILD cue in larger azimuths.
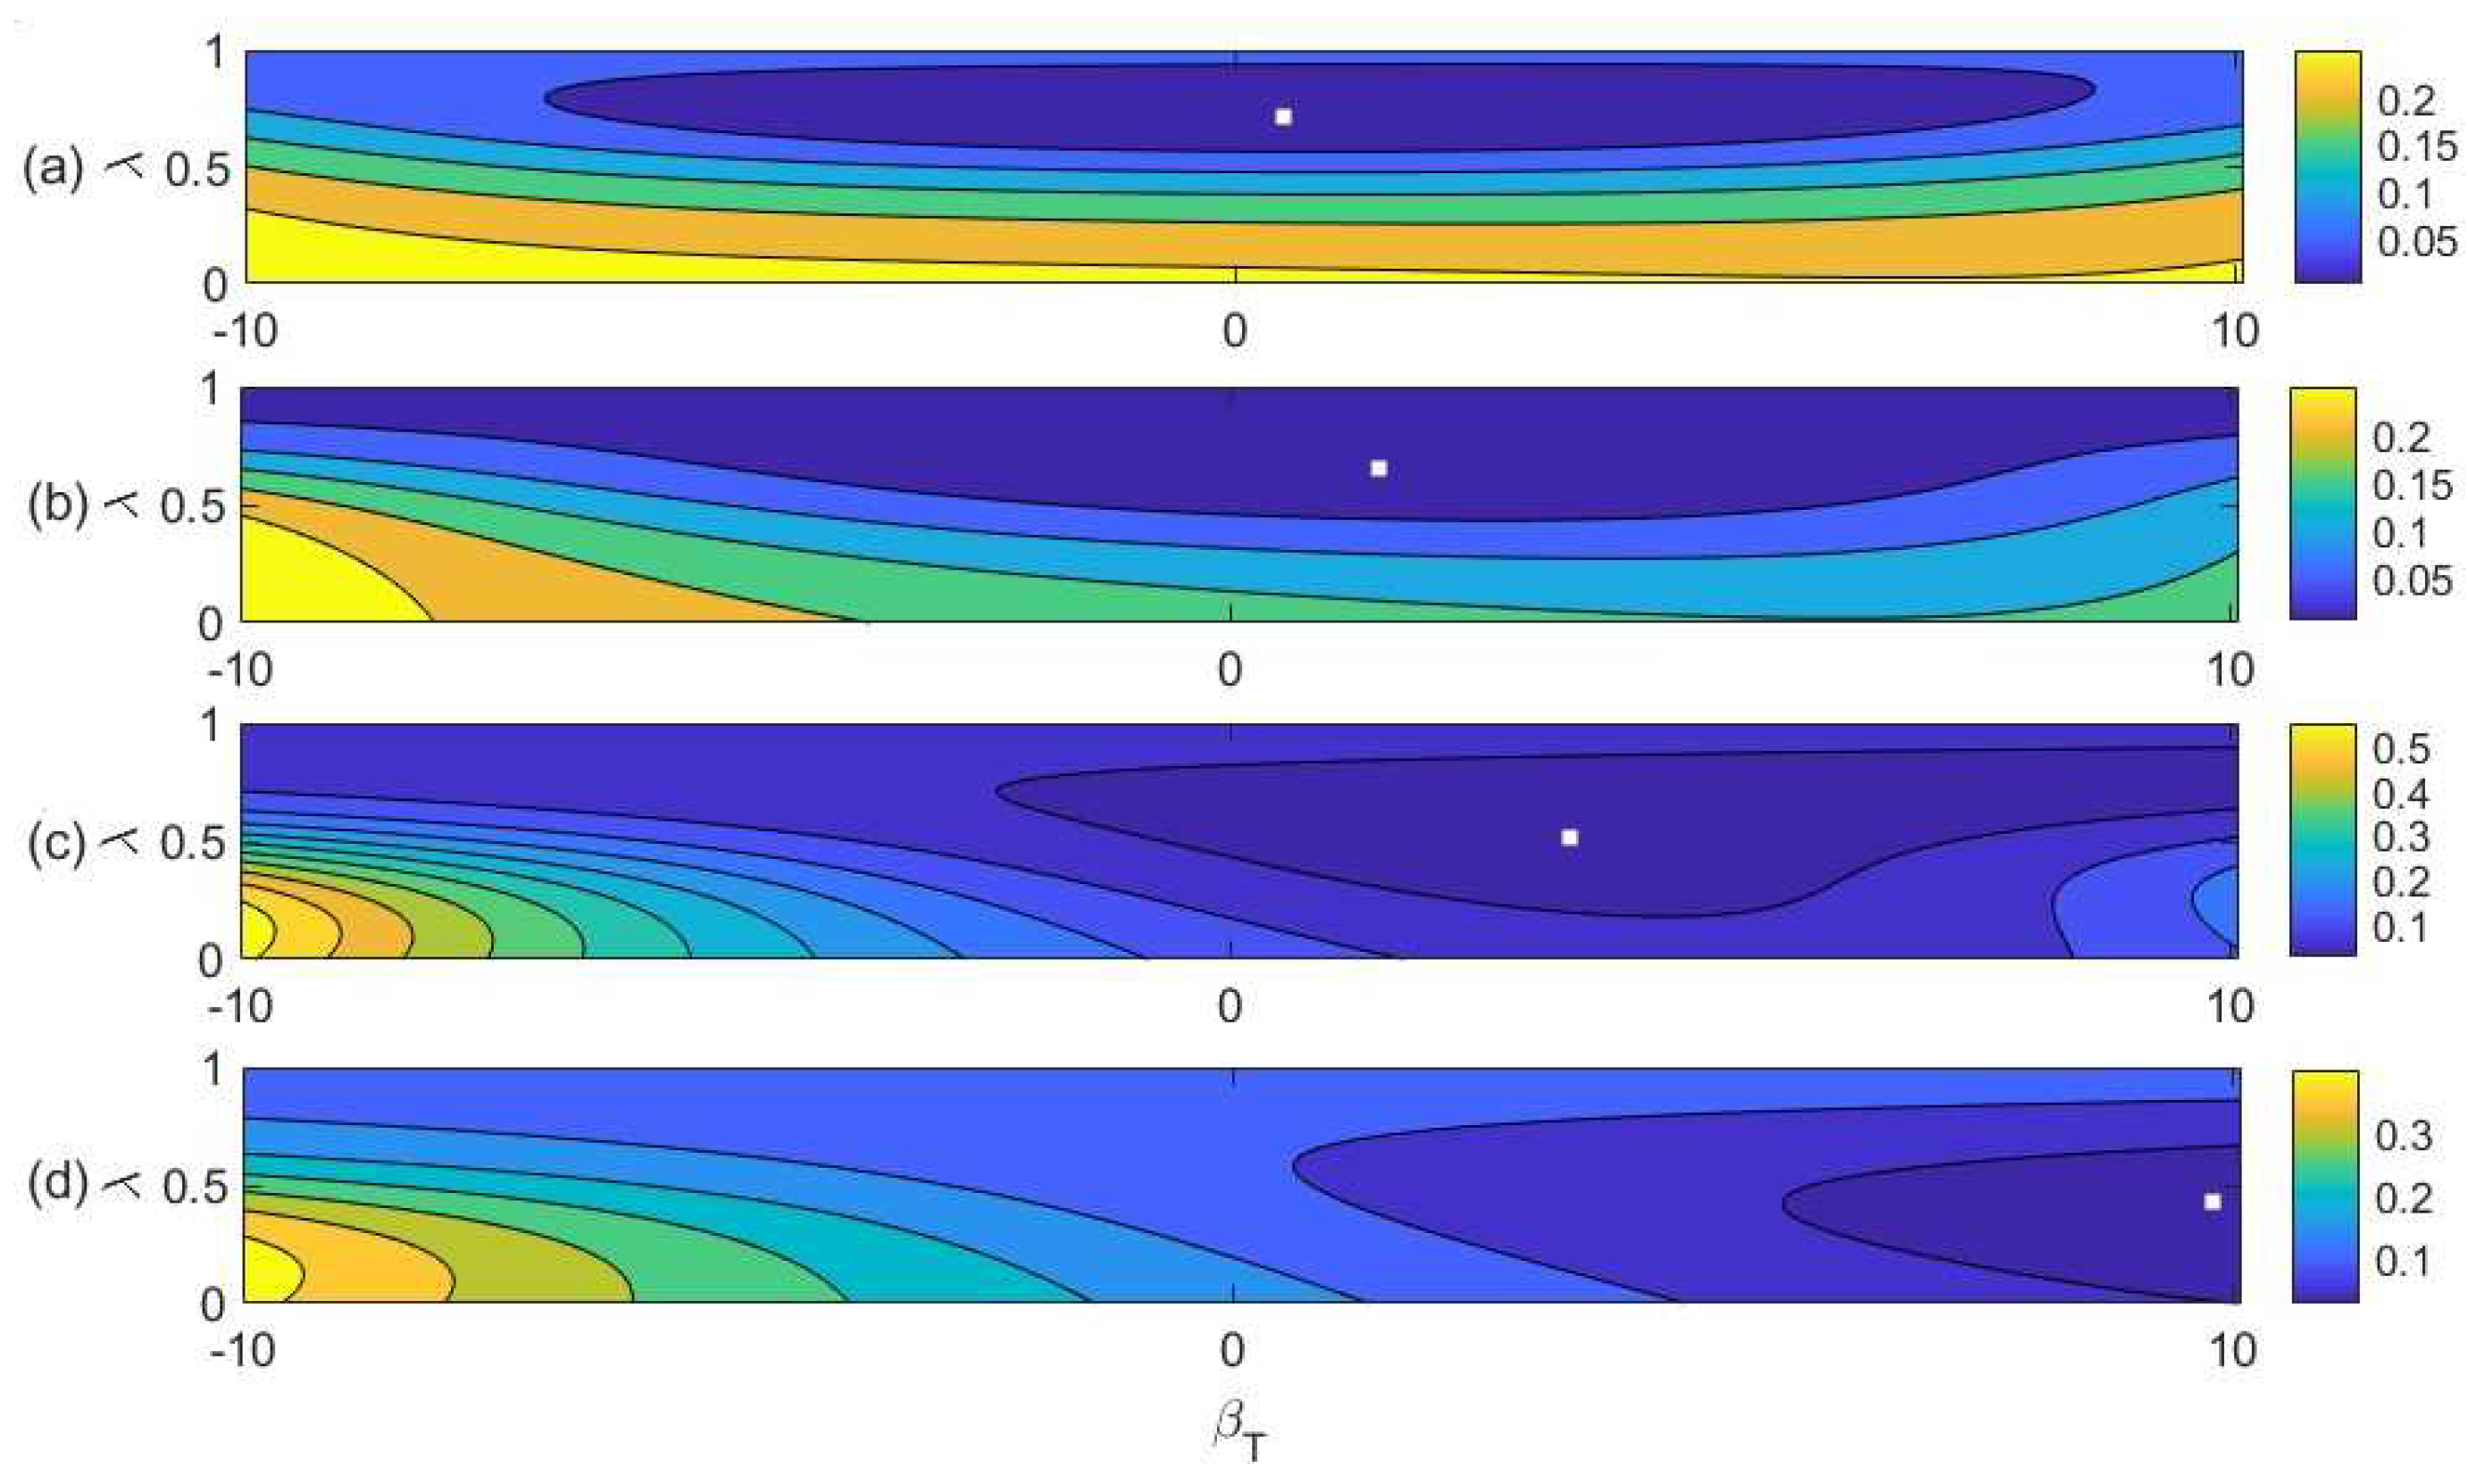
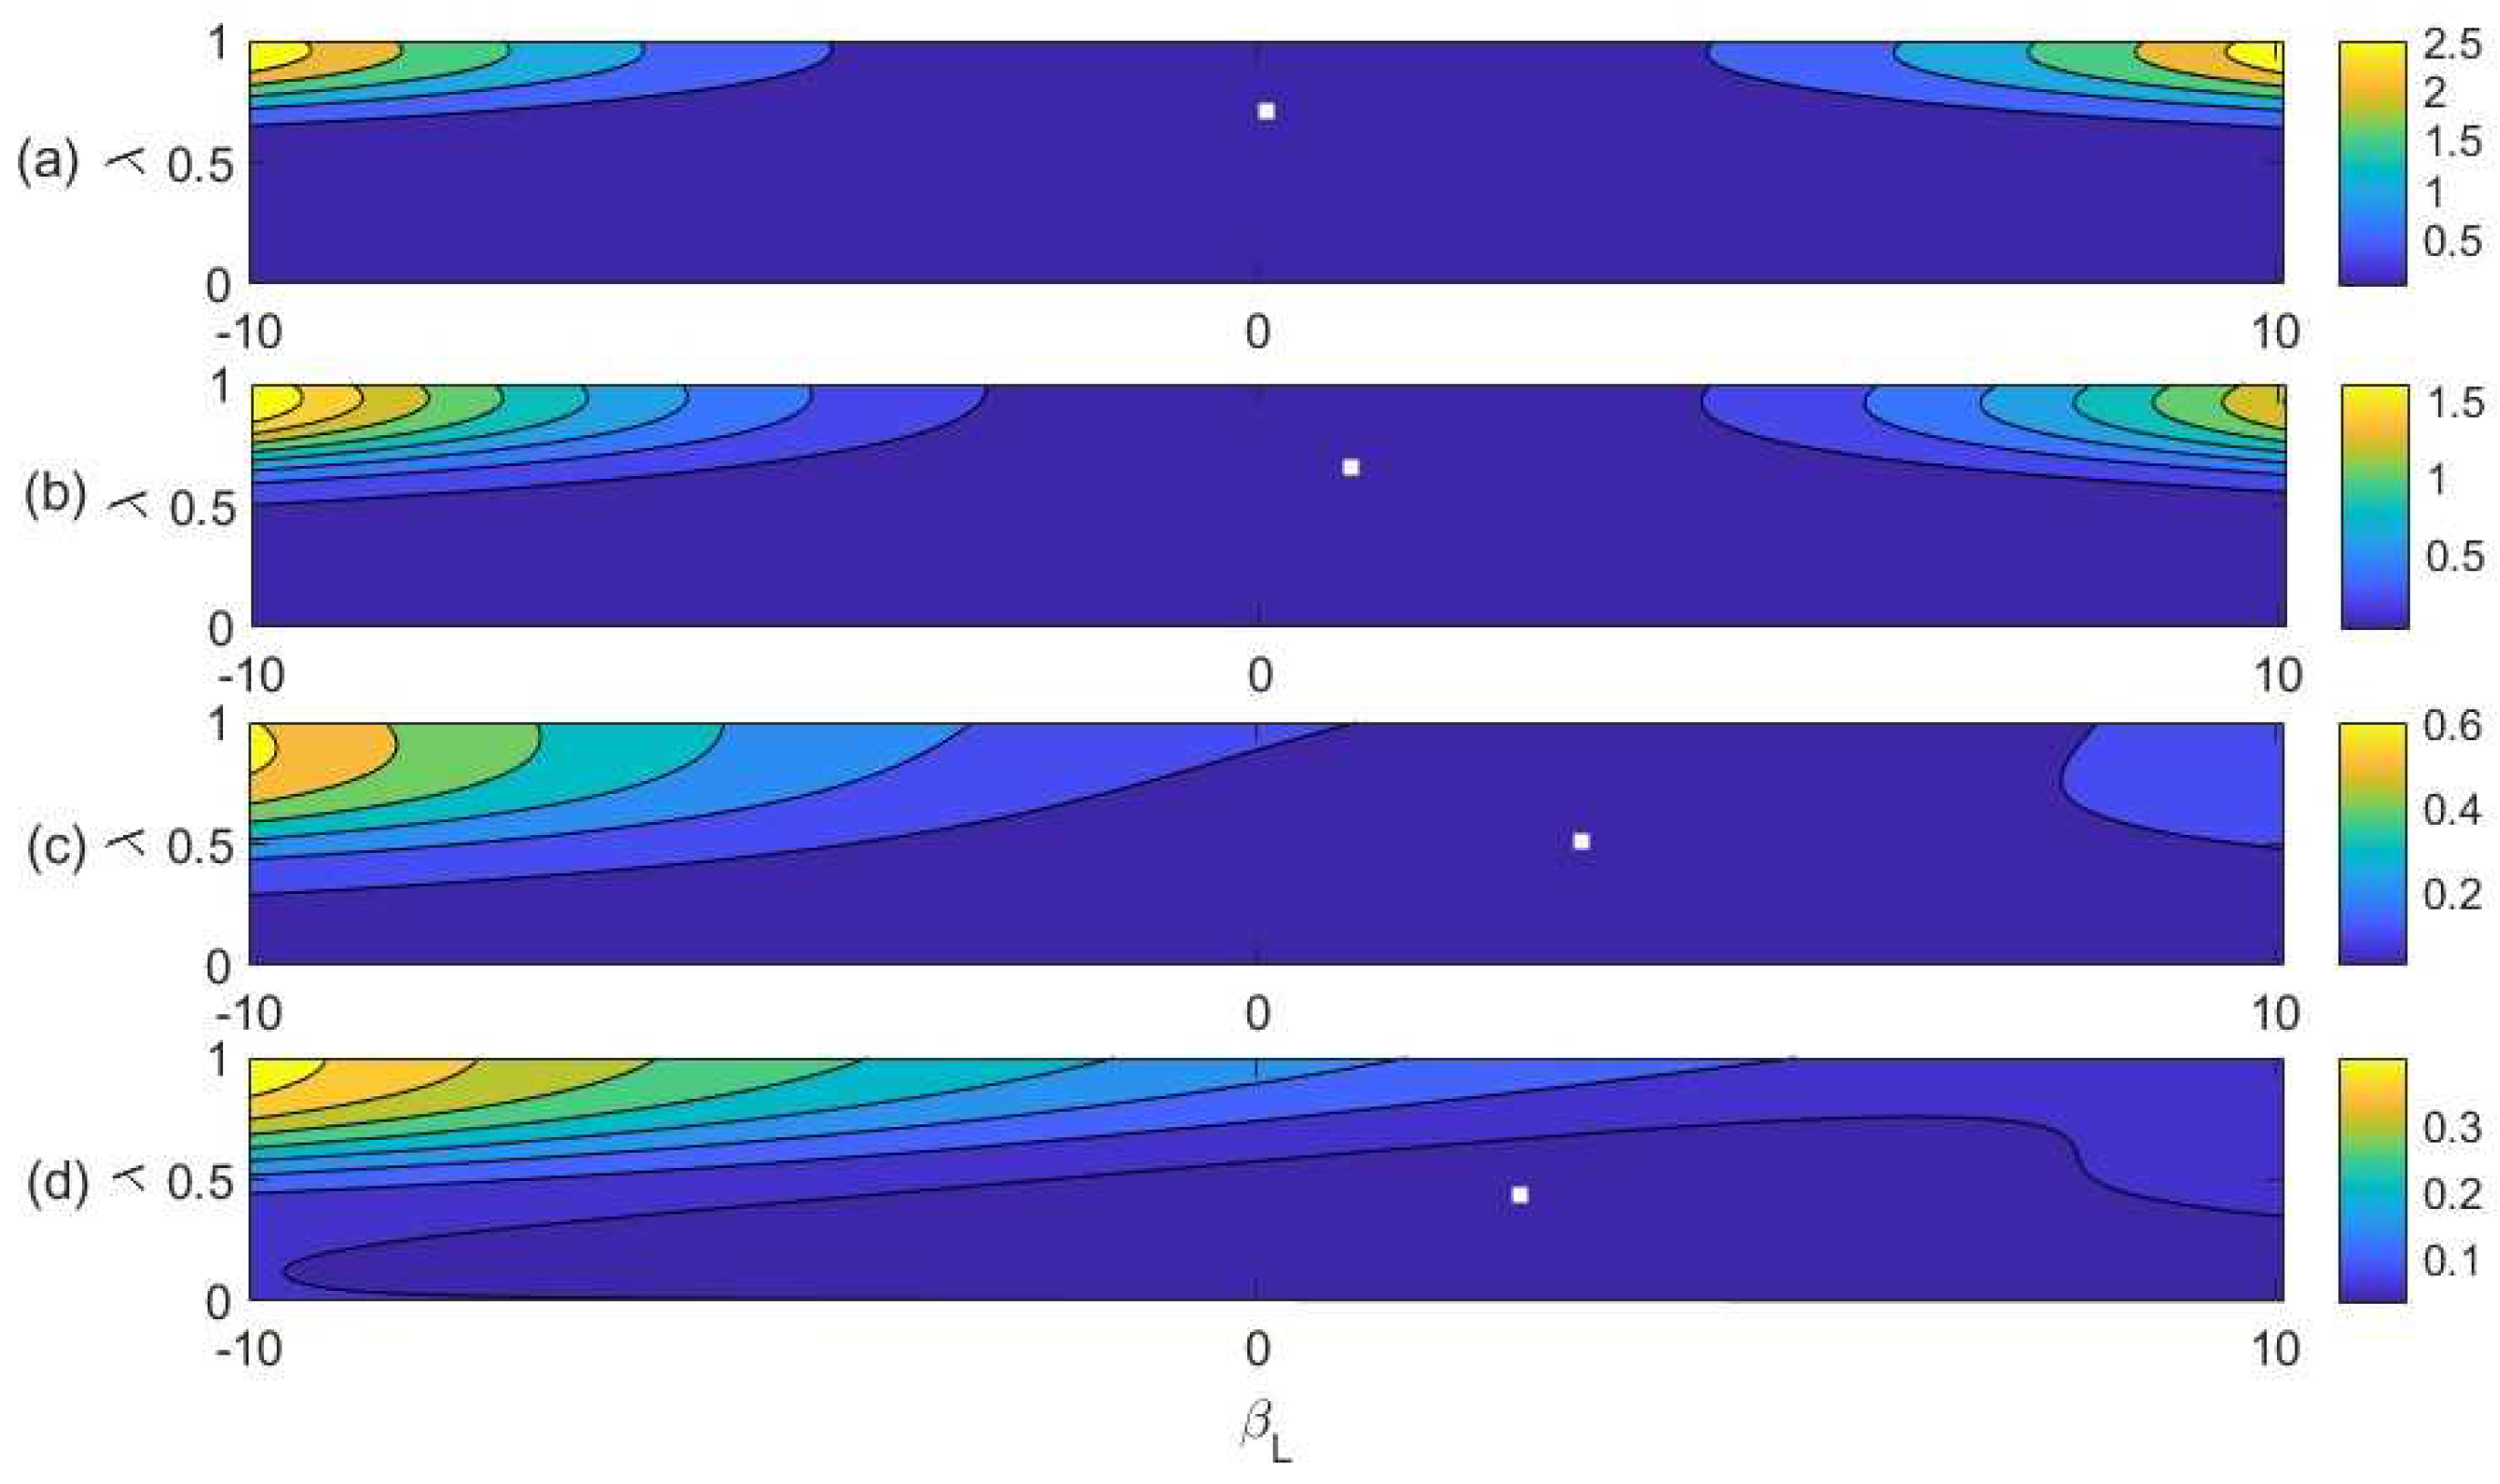
In order to double-check the precision in calculations, heat-map plots of the mean square SNR error F ( x ) as a function of λ vs. β T and β L are presented in Figure 5 and Figure 6 for azimuth 0 , 10 , 20 and 30 values. Figure 5 plots the mean square SNR error F ( x ) as a function of λ vs. β T after fixing the β L , σ T and σ L at the extracted optimal values as given in Table 3. Similarly, Figure 6 plots the mean square SNR error F ( x ) as a function of λ vs. β L after fixing the β T , σ T and σ L at the extracted optimal values. The optimal λ and β values for azimuth 0 , 10 , 20 and 30 extracted from the proposed model are shown with white dots in Figure 5 and Figure 6.
Similar to the results given in Table 2, the SNR values of the inward cases are found to be greater than the outward ones in all azimuth values. For the TO, LO, and TL conditions, the difference between the inward and outward SNR values are decreasing with the increasing azimuth.

5. Discussion

One needs error rates for lateralization decisions made by using only the ITD information, only the ILD information, and both of these two pieces of information. However, it is not possible to provide either one of these cues alone. Even when one of them is made zero, as it is generally done in ITD/ILD trading studies [17], both of the cues are made available inevitably, because either zero-ITD or zero-ILD still bears a spatial information indicating zero azimuth when sound is delivered dichotically. To circumvent this issue, we did not test the subject’s accuracy in judging the absolute lateralization of single sound stimuli, but preferred using pairs of successive sounds producing bidirectional shifts in perceived lateral position of the sound, and tested the subject’s performance (or error rate) in identifying the shift direction. By this way, it was possible to change only one of the cues without the condition that the other one must be set to zero. This made also possible to assess the bidirectional shift sensitivity of the system around different azimuthal angles in the azimuth range of 0 and 30 degrees. The results of the present study regarding the judgments of the TO, LO, and TL shifts conform to the results of a previous study conducted by Schroger [15], which compared the mismatch negativity outcomes with ITD-ILD deviant complex stimulations. In both studies, Schroger [15] and the present one, the responses of the participants are more in line with estimated perceived azimuth based on the generic HRTF in the TL cases than TO cases. Simultaneous presentation of the ITD and ILD cues to the participants resulted in increased SNR values in all of the four azimuthal cases. While utilization of either ITD or ILD cue by the hearing system is possible, it is the combination of these two pieces of information when they are simultaneously available that leads to more confident lateralization of acoustical sources [8,38].
Based on the SNR values of the experiments it can be said that the participants mostly trust the ILD cue for lateralizing the sound sources around the midline, whereas they relied almost equally on both the ITD and ILD cues for relatively peripheral azimuths. Our experimental results (available in Table 2) are in agreement with the findings of Morikawa [39] that suggested an increase in error rates for smaller azimuth with ITD-imposed sound stimuli and larger azimuth with ILD-imposed sound stimuli. The auditory system relies more on the most consistent cue in lateralizing sound sources [40] and this could provide an explanation for the azimuth-dependent of the cues.
Our diversity combination model considers the ITD and ILD cues as independent and uncorrelated cues. Based on our model, the experimental SNR values should fit the SNR values estimated by the model, depending on the level of independence of these cues from each other. While additive combination shows that the ITD and ILD cues are independently encoding, super- or sub-additive combination shows an interaction/coupling between the mechanisms encoding these cues or the channels transmitting them toward the brain’s cortex. The experimental results of the present study showed super-additivity of the cues for azimuth near the midline, additivity for 20 , and sub-additivity for 30 . This suggests a nonlinear combination of modality-specific influences as the multi-cue whole is greater than the sum of its uni-cue parts. The results of the other studies [40,41] investigating the significance of ITD and ILD in sound lateralization, have demonstrated subadditivity of the ITD and ILD cues, which indicates an overlap between the neural mechanisms processing the two cues, rather than their independence in cue coding.
An important observation of the present study is the decrease in SNR values accompanied by an increase in the bias values that occurred as a result of the increase in azimuth. This directional bias in the SNR data, may be discussed in connection to some recent studies examining a population rate-based opponent-channel model in ITD [22,42,43] and ILD coding [44,45,46]. According to the findings of these studies, a rapid increase in ITD (i.e., outward lateralization shift), results in a stronger brain response than does a decrease in ITD (i.e., inward lateralization shift). The opponent-channel model seems to provide an explanation for these findings. The bias observed in favor of inward lateralization shift in the present study seems, however, to be in contradiction with what would be predicted by the opponent-channel model.
In a recent study by Ozmeral et al. [47] on hemispheric ITD and ILD cues coding, the stimuli were presented to both the left and right hemifields. The most strong N1 responses (N1 and P2 are components of the human scalp-recorded event-related potentials), evoked by ILD cue, were recorded from the right auditory cortex, while the strongest ITD evoked responses were recorded from the contralateral hemisphere. The main effect of shift magnitude for N1 and P2 latencies suggested a common neural weighting in the lateralization of the cues. Moreover, larger responses for inward shifts in the right hemifield compared to the outward shifts in the ipsilateral primary auditory cortex were recorded. From the other side, the inward shifts in the left hemifield resulted in stronger P2 responses in the ipsilateral primary auditory cortex. Dominance of the responses to inward shifts reported in this study is parallel to the inward bias of SNR in the present study, and the authors concluded that there must be an alternative processing scheme apart from those predicted by the opponent-channel model.
In contrast to the opponent-channel model, a modified topographic model, in which the ITD-selective units tuned to locations near the midline are more numerous and tightly tuned than those to periphery [48,49], would predict a stronger neural response [22], thus a better detection performance [20] for inward stimulations compared to outward stimulations. Both models predict, however, that performance should be better for stimuli around midline than in the periphery. The SNR results of the present study, which indicates a bias for inward changes in addition to the putative midline advantage, are in harmony with the prediction of the midified topographic model. Considering the results of some recent neuroimaging studies supporting the opponent-channel hypothesis of sound lateralization in humans [22,42,50], the results of the present study may not lead to a firm discussion. However, as suggested by Harper et al. [51], lateralization coding could be achieved simultaneously by complementary functioning of an opponent two-channel mechanism at low frequencies and a topographic mechanism at higher frequencies. This may be an explanation for the inward bias observed in the present study in which the stimulus employed is a complex sound with a power spectrum dominated by high frequency harmonic components.
The discrimination bias, which is revealed in the experimental results and fitted the proposed diversity combining model appropriately, indicates that the participants’ performance in identifying the direction of a change in the azimuth of an auditory source is lower for a change toward the periphery than for a change toward the center. Even though the exact reason underlying the observed bias for inward azimuthal changes is unknown, it can be considered as a result of an attentional priority formed throughout life. This priority may be in the focused attention and cognition mechanisms which are active during the tests, or in an unintentional and thus pre-attentive change detection mechanism similar to the one described by Näätänen [52] and Kriegstein et al. [53].
The limitations regarding the generality of the experiments in the current study could be summarized as follows. Under the diversity combining approach, we assume that the response bias observed for inward stimuli is sensory in nature. However, we recorded and evaluated behavioral responses, which are the output of the overall sound lateralization system. It includes both of its sensory and cognitive sub-systems, which are responsible respectively for auditory processing of the acoustic stimuli and for attention and decision making for the type of motor response (i.e., key-pressing). Therefore, by using only the final behavioral response, one may not know if that bias should be linked to the former or latter sub-systems or both. To delineate possible contributions of these sub-systems to the observed bias, it is necessary to have the neural responses of the sensory mechanisms of the brain detecting the directional difference between the inward and outward sound image shifts. The electroencephalographic (EEG) responses called MMN (mismatch negativity), which are known to be the electrical responses of the pre-attentive sensory change-detection mechanism [54,55] can be used for this purpose. Another EEG response called P300, which is known to be the electrical response of the cognitive system related to the processes of selective attention and decision [52,56], may serve, on the other hand, as a measure for the involvement of attentional cognitive mechanisms in the observed bias. This may be a subject for future research based on the model suggested in the present study.

6. Conclusions

The results of the behavioral experiments show that ILD information is more important than ITD information in detecting a change in the lateral position of sound sources with relatively small azimuths. As the azimuth of the source increases, the roles of ITD and ILD cues in sound lateralization tend to be balanced.
A behavioral bias, which is independent of the type of cue, misled the participants in determining the direction of change in the lateral position of a sound source. This centripetal bias seems to increase with increasing azimuth and exhibit a minimum for an azimuthal change of ± 10 around the median plane.
The SNR data show that the two pieces of spatial information supplied by the ILD and ITD cues are combined in the brain, but super-additively for shifts in lateral positions around small azimuths, and sub-additively around relatively larger azimuths. Nonetheless, the integration of the ILD and ITD cues can be modeled using a diversity combination approach by incorporating the directional bias mentioned.

Author Contributions

S.M., E.E., and P.U. conceived of the presented idea, developed the theory and designed the experiments; S.M. carried out the experiments, performed the analytic calculations and performed the numerical simulations; S.M. took the lead in writing the manuscript; E.E. and P.U. supervised the experiments and analyses. All authors provided critical feedback and helped shape the research, analysis, and manuscript. All authors have read and agreed to the published version of the manuscript.

Funding

This research received no external funding.

Acknowledgments

The authors would like to thank Alper Erdogan for his valuable suggestions and fruitful discussions in the course of this research.

Conflicts of Interest

The authors declare no conflict of interest.

References

  1. Middlebrooks, J.; Green, D. Sound localization by human listeners. Annu. Rev. Psychol. 1991, 42, 135–159. [Google Scholar] [CrossRef] [PubMed]
  2. Rubel, E. The Auditory System, Central Auditory Pathways; Saunders: Philadelphia, PA, USA, 1990. [Google Scholar]
  3. Sanes, D. An in vitro analysis of sound localization mechanism in the gerbil lateral superior olive. J. Neurosci. 1990, 10, 3494–3506. [Google Scholar] [CrossRef] [PubMed] [Green Version]
  4. Joseph, A.; Hyson, R. Coincidence detection by binaural neurons in the chick brainstem. J. Neurophysiol. 1993, 69, 1197–1211. [Google Scholar] [CrossRef]
  5. Jeffress, L.A. A place theory of sound localization. J. Comp. And Physiol. Psychol. 1948, 41, 35–39. [Google Scholar] [CrossRef] [PubMed]
  6. Abel, S.; Kunov, H. Lateralization based on interaural phase difference effects of frequency, amplitude, duration and shape of rise/delay. J. Acoust. Soc. Am. 1983, 73, 955–961. [Google Scholar] [CrossRef] [PubMed]
  7. Strutt, J. On our perception of sound direction. Philos. Mag. 1907, 13, 214–232. [Google Scholar]
  8. Macpherson, E.A.; Middlebrooks, J.C. Listener weighting of cues for lateral angle: The duplex theory of sound localization revisited. J. Acoust. Soc. Am. 2002, 111, 2219–2236. [Google Scholar] [CrossRef] [Green Version]
  9. Wightman, F.L.; Kistler, D.J. The dominant role of low-frequency interaural time differences in sound localization. J. Acoust. Soc. Am. 1992, 91, 1648–1661. [Google Scholar] [CrossRef]
  10. Cunningham, S. Adapting to remapped auditory localization cues: A decision-theory model. Percept. Psychophys. 2000, 62, 33–47. [Google Scholar] [CrossRef]
  11. Gaik, W. Combined evaluation of interaural time and intensity differences: Psychoacoustic results and computer modeling. J. Acoust. Soc. Am. 1993, 94, 98–110. [Google Scholar] [CrossRef]
  12. Lang, A.G.; Buchner, A. Relative influence of interaural time and intensity differences on lateralization is modulated by attention to one or the other cue: 500-hz sine tones. J. Acoust. Soc. Am. 2008, 124, 3120–3131. [Google Scholar] [CrossRef] [PubMed] [Green Version]
  13. Wightman, F.L.; Kistler, D.J. Monaural sound localization revisited. J. Acoust. Soc. Am. 1997, 101, 1050–1063. [Google Scholar] [CrossRef] [PubMed] [Green Version]
  14. Bernstein, L.R.; Trahiotis, C. Detection of interaural delay in high-frequency sinusoidally amplitude-modulated tones, two-tone complexes, and bands of noise. J. Acoust. Soc. Am. 1994, 95, 3561–3567. [Google Scholar] [CrossRef] [PubMed]
  15. Schroger, E. Interaural time and level differences: Integrated or separated processing? Hear. Res. 1996, 96, 191–198. [Google Scholar] [CrossRef]
  16. Salminen, N.H.; Altoe, A.; Takanen, M.; Santala, O.; Pulkki, V. Human cortical sensitivity to interaural time difference in high-frequency sounds. Hear. Res. 2015, 323, 99–106. [Google Scholar] [CrossRef]
  17. Blauert, J. Spatial Hearing: The Psychophysics of Human Sound Localization; MIT Press: Cambridge, MA, USA, 1997. [Google Scholar]
  18. Hafter, E.R.; Carrier, S.C. Binaural Interaction in Low-Frequency Stimuli: The Inability to Trade Time and Intensity Completely. J. Acoust. Soc. Am. 1972, 51, 1852–1862. [Google Scholar] [CrossRef]
  19. Hafter, E.R.; Dye, R.H., Jr.; Wenzel, E.M.; Knecht, K. The combination ofinteraural time and intensity in the lateralization of high-frequency complex signals. J. Audio Eng. Soc. Audio Eng. Soc. 1990, 87, 1702–1708. [Google Scholar]
  20. Wood, K.C.; Bizley, J.K. Relative sound localisation abilities in human listeners. J. Acoust. Soc. Am. 2015, 138, 674–686. [Google Scholar] [CrossRef]
  21. Hartmann, W.; Rakerd, B. On the minimum audible angle—A decision theory approach. J. Acoust. Soc. Am. 1989, 85, 2031–2072. [Google Scholar] [CrossRef]
  22. Magezi, D.; Krumbholz, K. Evidence for opponent-channel coding of interaural time differences in human auditory cortex. J. Neurophysiol. 2010, 104, 1997–2007. [Google Scholar] [CrossRef] [Green Version]
  23. Ihlefeld, A.; Alamatsaz, N.; Shapely, R.M. Human Sound Localization Depends on Sound Intensity: Implications for Sensory Coding. bioRxiv 2018, 378505. [Google Scholar] [CrossRef]
  24. Bramley, T.; Oates, T. Rank ordering and paired comparisons—The way Cambridge Assessment is using them in operational and experimental work. Int. J. Educ. Dev. 2011, 23, 275–289. [Google Scholar]
  25. Buus, S.; Schorer, E.; Florentine, M.; Zwicker, E. Decision rules in detection of simple and complex tones. J. Acoust. Soc. Am. 1986, 80, 1646–1657. [Google Scholar] [CrossRef] [PubMed]
  26. Morimoto, M.; Aokata, H. Localization cues of sound sources in the upper hemisphere. J. Acoust. Soc. Jpn. 1997, 5, 165–173. [Google Scholar] [CrossRef] [Green Version]
  27. Rakerd, B.; Hartmann, W.M. Localization of sound in rooms. V. Binaural coherence and human sensitivity to interaural time differences in noise. J. Acoust. Am. 2010, 128, 3052–3063. [Google Scholar] [CrossRef] [PubMed] [Green Version]
  28. Harper, N.S.; McAlpine, D. Optimal neural population coding of an auditory spatial cue. Nature 2004, 430, 682–686. [Google Scholar] [CrossRef] [PubMed]
  29. Ungan, P.; Yagcioglu, S.; Goksoy, C. Differences between the N1 waves of the responses to interaural time and intensity disparities: Scalp topography and dipole sources. Clin. Neurophysiol. 2001, 112, 485–498. [Google Scholar] [CrossRef]
  30. Asahi, M.; Matsuoka, S. Effect of the sound anti resonance by pinna on median plane localization—Localization of sound signal passed dip filter. Tech. Rep. Hear. Acoust. Soc. Jpn. 1977, H-40-1. [Google Scholar]
  31. Morimoto, M.; Yoshimura, K.; Kazhiro, I.; Motokuni, I. The role of low frequency components in median plane localization. J. Acoust. Soc. Jpn. E 2003, 24, 76–82. [Google Scholar] [CrossRef] [Green Version]
  32. Salminen, N.H. Human cortical sensitivity to interaural level differences in low- and high-frequency sounds. J. Acoust. Soc. Am. 2015, 137, 190–193. [Google Scholar] [CrossRef] [PubMed] [Green Version]
  33. Begault, E.M.; Wenzel, E.M.; Anderson, M.R. Direct comparison of the impact of head tracking, reverberation, and individualized head-related transfer functions on the spatial perception of a virtual speech source. J. Audio Eng. Soc. Audio Eng. Soc. 2001, 49, 904–916. [Google Scholar]
  34. Kayser, H.; Ewert, S.; Anemuller, J.; Rohdenbudrg, T.; Hohmann, V.; Kollmeier, B. Database of multichannel in-ear and behind-the-ear head-related and binaural room impulse response. Eurasip J. Adv. Signal Process. 2009, 2009, 298605. [Google Scholar] [CrossRef] [Green Version]
  35. Shankar, P.M. Fading and Shadowing Wireless System; Springer International Publishing: Berlin/Heidelberg, Germany, 2011. [Google Scholar]
  36. Rosenbrock, H.H. An automatic method for finding the greatest or least value of a function. Comput. J. 1960, 3, 175–184. [Google Scholar] [CrossRef] [Green Version]
  37. MATLAB. Matlab Optimization Toolbox; The MathWorks: Natick, MA, USA, 2020. [Google Scholar]
  38. Hebrank, J.; Wright, D. Spectral cues used in the localization of sound sources on the median plane. J. Acoust. Soc. Am. 1974, 56, 1829–1834. [Google Scholar] [CrossRef] [PubMed]
  39. Morikawa, D. Effect of interaural difference for localization of spatially segregated sound. In Proceedings of the Tenth International Conference on Intelligent Information Hiding and Multimedia Signal Processing, Kitakyushu, Japan, 27–29 August 2014; pp. 602–605. [Google Scholar]
  40. Edmonds, B.; Krumbholz, K. Are interaural time and level differences represented by independent or integrated codes in the human auditory cortex? J. Acoust. Soc. Am. 2013, 15, 103–114. [Google Scholar] [CrossRef] [PubMed] [Green Version]
  41. Calvert, G.; Thesen, T. Multisensory integration: Methodological approaches and emerging principles in the human brain. J. Physiol. 2004, 98, 191–205. [Google Scholar] [CrossRef]
  42. Briley, P.M.; Kitterick, P.T.; Summerfield, A.Q. Evidence for opponent process analysis of sound source location in humans. J. Assoc. Res. Otolaryngol. 2013, 14, 83–101. [Google Scholar] [CrossRef] [Green Version]
  43. Salminen, N.H.; Tiitinen, H.; Yrttiaho, S.; May, P.J. The neural code for interaural time difference in human auditory cortex. J. Acoust. Soc. Am. 2010, 127, EL60–EL65. [Google Scholar] [CrossRef] [Green Version]
  44. Altmann, C.F.; Terada, S.; Kashino, M.; Goto, K.; Mima, T.; Fukuyama, H.; Furukawa, S. Independent or integrated processing of interaural time and level differences in human auditory cortex? Hear. Res. 2014, 312, 121–127. [Google Scholar] [CrossRef]
  45. Higgins, N.C.; McLaughlin, S.A.; Rinne, T.; Stecker, G.C. Evidence for cue independent spatial representation in the human auditory cortex during active listening. Proc. Natl. Acad. Sci. USA 2017, 114, E7602–E7611. [Google Scholar] [CrossRef] [Green Version]
  46. McLaughlin, S.A.; Higgins, N.C.; Stecker, G.C. Tuning to binaural cues in human auditory cortex. J. Assoc. Res. Otolaryngol. 2016, 17, 37–53. [Google Scholar] [CrossRef] [PubMed]
  47. Ozmeral, E.J.; Eddins, D.A.; Eddins, A.C. Electrophysiological responses to lateral shifts are not consistent with opponent-channel processing of interaural level differences. J. Neurophysiol. 2019, 122, 737–748. [Google Scholar] [CrossRef] [PubMed]
  48. Knudsen, E.I. Auditory and visual maps of space in the optic tectum of the owl. J. Neurosci. 1982, 2, 1177–1194. [Google Scholar] [CrossRef] [Green Version]
  49. Stern, R.; Shear, G. Lateralization and detection of low-frequency binaural stimuli: Effects of distribution of internal delay. J. Acoust. Am. 1996, 100, 2278–2288. [Google Scholar] [CrossRef]
  50. Salminen, N.; May, P.; Alku, P.; Tiitinen, H. A population rate code of auditory space in the human cortex. PLoS ONE 2009, 4, e7600. [Google Scholar] [CrossRef]
  51. Harper, N.S.; Scott, B.H.; Semple, M.N.; McAlpine, D. The neural code for auditory space depends on sound frequency and head size in an optimal manner. PLoS ONE 2014, 9, e108154. [Google Scholar] [CrossRef]
  52. Näätänen, R. Attention and Brain Function; Erlbaum: Hiildile, NJ, USA, 1992. [Google Scholar]
  53. Von Kriegstein, K.; Griffiths, T.D.; Thompson, S.K.; McAlpine, D. Responses to interaural time delay in human cortex. J. Neurophysiol. 2008, 100, 2712–2718. [Google Scholar] [CrossRef] [PubMed] [Green Version]
  54. Näätänen, R.; Alho, K. Mismatch negativity-a unique measure of sensory processing in audition. Int. J. Neurosci. 1995, 80, 317–337. [Google Scholar] [CrossRef]
  55. Schroger, E. Measurement and interpretation of the mismatch negativity. Behav. Res. Methods Instrum. Comput. 1998, 30, 131–145. [Google Scholar] [CrossRef]
  56. Polich, J. Updating P300: An Integrative Theory of P3a and P3b. Clin. Neurophysiol. 2007, 118, 2128–2148. [Google Scholar] [CrossRef] [Green Version]
Figure 1. Frequency spectrum of the TL stimulus sound, s c ( t ; α 30 , ϕ 30 ) , showing the relative magnitudes (spectral amplitudes in arbitrary units) of the pure tones used in the stimuli.
Applsci 10 06356 g001
Figure 2. A sample visualization of probe sounds from azimuth ( θ + 10 ) for ime-only (TO), level-only (LO), and time-level (TL) conditions where the reference sound is from azimuth ( θ ) and direction of lateralization shift is outward.
Applsci 10 06356 g002
Figure 3. Box-plots of the S N R T + L and S N R T L values computed from the re-sampled error rates of T+L and TL cases, respectively, for the four azimuthal angles studied. Note that the SNR values of time and level cues are combined into S N R T L super-additively for 0 and 10 , whereas their combination turns to be additive and sub-additive for 20 and 30 , respectively.
Applsci 10 06356 g003
Figure 4. Experimental and estimated SNR values for inward (+) and outward (−) cases of the azimuths 0 , 10 , 20 and 30 : (a) T O + , (b) T O , (c) L O + , (d) L O , (e) T L + and (f) T L .
Applsci 10 06356 g004
Figure 5. Heat-map plots of the mean square SNR error F ( x ) as a function of λ vs. β T after fixing the β L , σ T and σ L at the extracted optimal values for azimuth (a) 0 , (b) 10 , (c) 20 and (d) 30 . White dots are the optimal λ and β T values extracted from the model.
Applsci 10 06356 g005
Figure 6. Heat-map plots of the mean square SNR error F ( x ) as a function of λ vs. β L after fixing the β T , σ T and σ L at the extracted optimal values for azimuth (a) 0 , (b) 10 , (c) 20 and (d) 30 . White dots are the optimal λ and β L values extracted from the model.
Applsci 10 06356 g006
Table 1. The reference (columns) and the probe (rows) sounds from azimuth angles that are used in the tests: (*) conditions are used in the error rate calculations for the azimuth 0, 10, 20, 30 and 40 degrees. Right and left azimuth angles are respectively denoted by positive and negative signs.
P∖R−40−30−20−100+10+20+30+40
−40 *
−30 * *
−20 * *
−10 * *
0 * *
+10 * *
+20 * *
+30 * *
+40 *
Table 2. SNR values calculated from the experimental error rates.
SNR TO in SNR TO out SNR LO in SNR LO out SNR TL in SNR TL out
0 0.1540.0730.4900.4970.9410.866
10 0.2490.0740.4740.2930.9150.634
20 0.4960.0230.5280.0640.9070.298
30 0.6180.00040.4940.0540.9240.055
Table 3. Estimated λ , β T , β L , σ T and σ L values.
λ β T β L σ T σ L
0 0.7210.9000.00025.31610.697
10 0.6601.4180.82522.77712.364
20 0.5403.1422.87218.60017.900
30 0.4899.8682.50823.36522.453
Table 4. SNR values calculated from the experimental error rates.
SNR TO ¯ + SNR TO ¯ SNR LO ¯ + SNR LO ¯ SNR TL ¯ + SNR TL ¯
0 0.0840.0580.4760.4730.9610.869
10 0.1190.0670.4030.2890.9600.636
20 0.2270.0540.2950.0891.0320.283
30 0.4100.0000.1490.0531.0530.055