Abstract
In this paper, we propose the analysis of the target detection performance of air-to-air airborne radars using long-range propagation simulations with a novel quad-linear refractivity model under abnormal atmospheric conditions. The radar propagation characteristics and the target detection performance are simulated using the Advanced Refractive Effects Prediction System (AREPS) software, where the refractivity along the altitude, array antenna pattern, and digital terrain elevation data are considered as inputs to obtain the path loss of the wave propagation. The quad-linear model is used to approximate the actual refractivity data, which are compared to the data derived using the conventional trilinear refractivity model. On the basis of the propagation simulations, we propose a detection performance metric in terms of the atmosphere (DPMA) for intuitively examining the long-range propagation characteristics of airborne radars in air-to-air situations. To confirm the feasibility of using the DPMA map in various duct scenarios, we employ two actual refractive indices to observe the DPMA results in relation to the height of the airborne radar.
1. Introduction
Recent dramatic advances in radar systems have resulted in the extensive use of a variety of long-range airborne radars, including active electronically scanned array (AESA) radars, synthetic aperture radars (SARs), and airborne early warning (AEW) radars [1,2,3,4,5,6]. Such radars are generally required to exhibit extreme high-performance in order to accurately detect long-range targets in the case of even a low radar cross-section (RCS). However, regardless of the radar performance, the target detection probability can be decreased by various factors, for example, external noise, clutter, atmospheric gas attenuation, polarization mismatches, multipath interference, and the atmospheric refractive index [7]. In particular, the gradient of the atmospheric refractive indices along the altitude usually changed by the temperature, atmospheric pressure, and dew-point temperature, causes the refraction of the wave propagation, that is, sub-, super-, normal-, and duct refraction. These propagation characteristics make it difficult to estimate the long-range target position [8], and it is essential to model the atmospheric refractivity along the altitude to precisely predict the propagation direction, path loss, and propagation factor. Thus, many studies involving the modeling of atmospheric refractive indices at low altitudes of less than 1 km have been conducted by estimating the duct phenomena through the measured path loss values [9], the clutter power values [10], and statistical analyses based on stored atmospheric data [11]. In addition, various studies have also been carried out to estimate the wave propagation characteristics when considering the oversea atmospheric characteristics in ground-to-air and ground-to-ground scenarios. For example, substantial low-altitude atmospheric data concerning certain coastal areas in the United States, Europe, and China have been used to analyze the path loss for wave propagation characteristics. Although previous studies have shown a sufficient analysis of the radar propagation characteristics in a low-altitude situation, it still needs in-depth research regarding the propagation characteristics at high altitudes of over 5 km in air-to-air situations considering the atmospheric effects.
In this paper, we analyze the target detection performance of air-to-air airborne radars using long-range propagation simulations with a novel quad-linear refractivity model under abnormal atmospheric conditions. Both the radar propagation characteristics and the target detection performance are simulated using the Advanced Refractive Effects Prediction System (AREPS) software, as based on a propagation hybrid model [12,13]. In the AREPS simulation conditions, the refractivity along the altitude, the antenna radiation pattern, and the digital terrain elevation data (DTED) are considered to be inputs to obtain the path loss of the wave propagation. The quad-linear lines are employed to model the modified refractive indices for the abnormal atmospheres associated with various elevated ducts. In addition, the radiation pattern is calculated based on a 32 × 32 array antenna with a triangular array configuration used for modeling the airborne radar antenna. Then, the path loss results obtained using the quad-linear model are compared to the results obtained using the conventional trilinear refractivity model and to the actual refractivity data. Subsequently, the resulting path loss and the other radar parameters are used to calculate the radar target detection probability in order to estimate the target detection performance of the airborne radar. Using the calculated target detection probability, we propose a detection performance metric in terms of the atmosphere (DPMA) for intuitively examining the long-range propagation characteristics in air-to-air situations. To investigate the effects of abnormal atmospheric conditions on the radar performance, the DPMA map is examined by varying the height and thickness of the elevated duct. Further, to confirm the feasibility of the DPMA map in various duct scenarios, two actual refractive indices are employed to observe the DPMA results in accordance with the height of the airborne radar. The results demonstrate that the proposed method of analysis can intuitively determine the target detection performance of air-to-air airborne radars under abnormal atmospheric conditions.
2. Long-Range Propagation Analysis of Air-to-Air Airborne Radars
2.1. Abnormal Atmospheric Conditions and Propagation Characteristics
In general, the atmosphere is usually expressed by the refractive index n according to the height, and it can be changed into the modified refractive index M on a hypothetical flat Earth when considering the Earth’s curvature, as expressed in Equation (1) [14].
In fact, with regard to radio wave propagation, the gradient of the modified refractive index M in terms of the height considerably affects the propagation direction.
As shown in Figure 1, there are four typical refractions associated with the wave propagations of an air-to-air airborne radar: sub (157 < ∇M), normal (79 < ∇M ≤ 157), super refraction (0 < ∇M ≤ 79), and duct (∇M < 0). In particular, the duct condition represents the most abnormal phenomenon, which causes the wave to become trapped in the atmosphere as if it propagates in a waveguide. Figure 2 illustrates the modified refractive indices of the elevated duct atmospheres according to the altitude at the Heuksando meteorological observatory on 4 September 2010, 5 June 2015, and 10 December 2015, which are all calculated using the air pressure, temperature, and dew point temperature. Such atmospheric data can be approximated by combinations of linear lines, and there is a conventional method (i.e., a trilinear model) for modeling the refractivity using three linear lines. However, at a high altitude of over 5 km, we find that many elevated duct cases require an additional linear line to accurately model the modified refractivity. Thus, we propose a quad-linear model of the modified refractive indices alongside the higher altitude with four linear lines in order to approximate the elevated duct condition, as shown in Figure 3. The first to third linear lines have heights of h1, h2, and h3, as well as slopes of d1, d2, and d3. The fourth line is modeled by a height of hmax and a slope of d4. Herein, the height and thickness of the elevated duct are indicated by h1 and Δh, respectively.
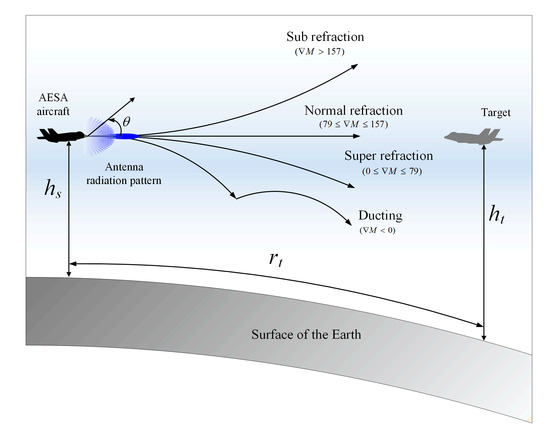
Figure 1.
Four refractive conditions of the wave propagation of an air-to-air airborne radar with the gradient of the modified refractivity M according to the height.
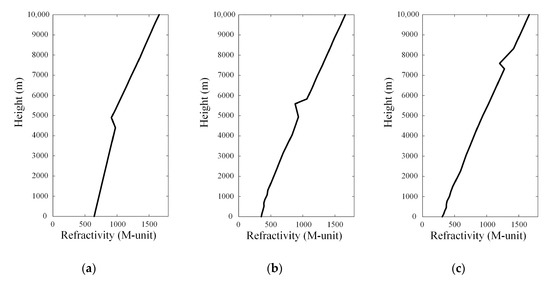
Figure 2.
Modified refractive indices of the elevated duct atmospheres according to the altitude at the Heuksando meteorological observatory in Korea: (a) 4 September 2015; (b) 5 June 2015; (c) 10 December 2015.
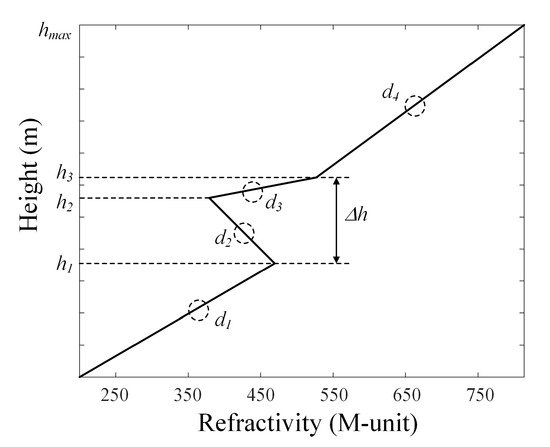
Figure 3.
Quad-linear model of the modified refractivity according to the altitude.
Figure 4 presents comparisons of the quad-linear and trilinear modeling of the actual refractivity data obtained at the Osan meteorological observatory on 1 February 2015. The detailed values of the quad-linear model parameters are h1 = 4.98 km, h2 = 5.16 km, h3 = 5.5 km, hmax = 10 km, d1 = 132.5, d2 = −817.8, d3 = 587, and d4 = 142. The quad-linear modeling result exhibits a good level of agreement with the actual refractivity data when compared with the conventional trilinear model result, where the deviations of each model can be calculated by the equation as follows:
where RMSD is the root-means-square deviation of the refractivity. Mact indicates the refractivity along the altitude, and Mmodel specifies the refractivity in terms of the tri- or quad-linear model along the altitude. The RMSD values are 7.2 M-unit for the quad-linear model and 60.2 M-unit for the trilinear model, respectively. To observe the propagation characteristics in an air-to-air situation, we include both these refractivity models and the actual data in the analysis involving the AREPS simulation software, while the radiation pattern of a conventional airborne array antenna is also applied as a simulation parameter. Figure 5a represents the 32 × 32 triangular array configuration of an airborne array antenna with array distances of 0.475 λ and 0.538 λ along the x- and y-axis. Each element pattern is assumed to be an ideal isotropic pattern, and then the total array pattern with 1204 array elements is calculated in the Az/El domain, as shown in Figure 5b. Figure 5c shows the directivity of the array antenna in the H-plane, which has a half-power beamwidth (HPBW) of 2.85° and a side lobe level (SLL) of −13.5 dB. Figure 6 illustrates comparisons of the AREPS simulation path loss results at hs of 5 km when using the refractivity of the actual data, the quad-linear model, and the trilinear model. The path loss results using the actual data, and the quad-linear model exhibit similar trends in terms of the propagation characteristics in the abnormal atmospheric condition. On the other hand, the trilinear model shows significant deviations in relation to the path loss characteristics. Note that, it is possible that the path loss results can be more different according to the refractivity model, although the RMSD values are small. These AREPS simulation results were previously validated by the measurement in references [15,16] of a long-range propagation in a ground-to-ground situation. Furthermore, to verify these results, we compare the path loss of the AREPS simulation with that of the ITU-R P.528 model [17] and the MATLAB PETOOL software [18]. Figure 7 represents the comparison of the path loss results as a function of range in accordance with the atmospheric conditions without the terrain effects. In the normal atmosphere, all results have a similar tendency of path loss according to the range. In the abnormal atmosphere, the AREPS and PETOOL results also show a similar fluctuation, and both results follow the ITU-R model trend in the long-range propagation. Therefore, the resulting propagation characteristics demonstrate that the quad-linear model of refractivity can provide a highly accurate wave propagation estimation for air-to-air airborne radar simulation in abnormal atmospheric conditions.
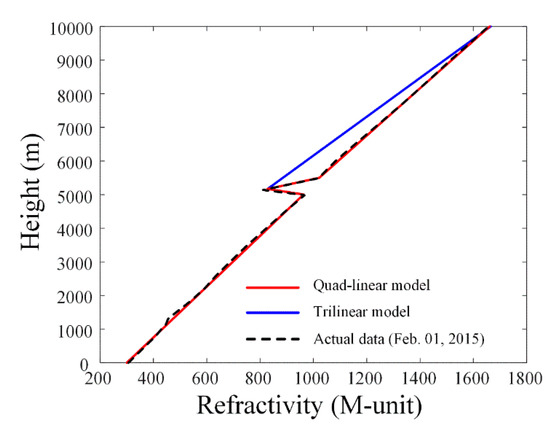
Figure 4.
Quad-linear and trilinear modeling comparisons concerning actual refractivity data obtained at the Osan meteorological observatory on 1 February 2015.
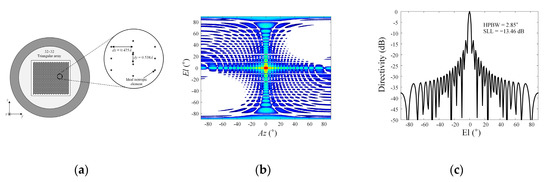
Figure 5.
Array antenna characteristics of the air-to-air airborne radar: (a) 32 × 32 triangular array antenna configuration and array distance; (b) 2D array pattern in the Az/El domain; (c) directivity pattern at the bore-sight direction in the H-plane.
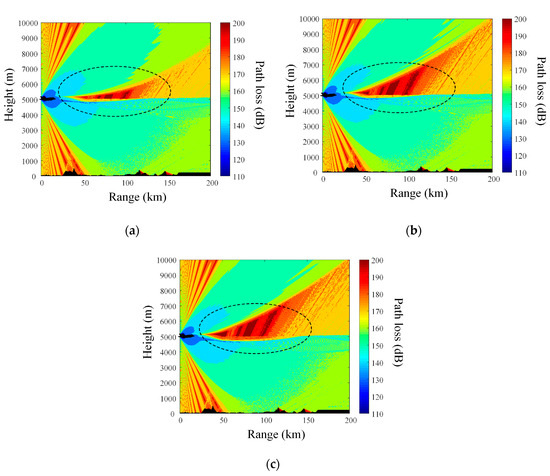
Figure 6.
The Advanced Refractive Effects Prediction System (AREPS) simulation results of path losses employing the linear models and the actual data regarding the modified refractivity: (a) trilinear model; (b) quad-linear model; (c) actual data.
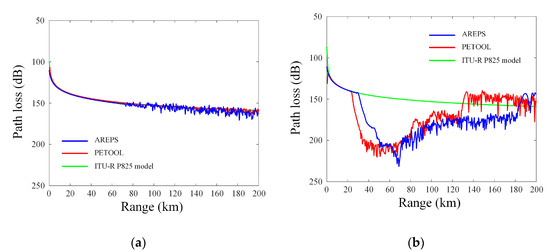
Figure 7.
Path loss comparisons among the AREPS software, the PETOOL software, and the ITU-R P.528 model in terms of the atmospheric conditions: (a) normal atmosphere; (b) abnormal atmosphere.
2.2. Target Detection Performance in Abnormal Atmosphere
In general, many studies on target detection performance have been investigated considering RCS fluctuations with clutters [19], multipath effects [20], regional environments [21], and refractive profiles [22,23,24]. In this research, we calculate the probability of the target detection using thresholds derived from the free-space path loss levels to examine the target detection performance. To calculate the path loss threshold, the detectable range with regard to the detection probability is defined using the radar equation in free space, as written in Equation (3) [25].
where c0 is the speed of light in m/s, and Pt is the transmitting power in W. σ is the RCS in m2, and τ is the pulse length of the radar in s. G is the array antenna gain for the airborne radar, and k is the Boltzmann’s constant. T0 is the absolute temperature in K, and D is the detectability factor. Pd is the detection probability, and f is the operating frequency in Hz. Nf is the noise figure of the radar, and Ls is the miscellaneous system loss. In this equation, all the airborne radar parameters are set as constant, except for the detectability factor D, which is simply approximated by Blake [25]. This factor includes the probability of the target detection and of a false alarm. Thus, it can simply approximate the functional relationship between the target detection probability and the radar equation in free space. Therefore, the free-space propagation loss for the threshold can be defined as follows:
To determine the detection probability in the air-to-air situation for the airborne radar, we obtain the path loss values using the AREPS simulation software, and then we calculate the probability by including the airborne radar system parameters. The detailed parameter values are listed in Table 1.

Table 1.
Detailed airborne radar parameters and values.
Figure 8a,b illustrates the detection probability results for the air-to-air scenario in terms of the normal and abnormal duct atmospheres when the source height hs is 4.8 km. The dashed lines indicate the wave propagation direction at θ = 0.5θHPBW, 0°, and −0.5θHPBW, where θHPBW is an HPBW angle of the airborne radar antenna radiation pattern. As can be seen in Figure 8b, the target detection performance is seriously degraded within the HPBW region as a result of the abnormally elevated duct. To more intuitively analyze the target detection performance, we propose a DPMA, which is defined as the ratio of the detectable area of the normal atmosphere to that of the abnormal atmosphere, as follows:
where Ad,atm and Ad,nor indicate the detectable areas for the abnormal and normal atmospheres, respectively. When the DPMA value is close to 1, the target detection performance is similar to that associated with the normal atmosphere. Fatm and Fnor indicate the contour lines for the detectable areas under the abnormal and normal atmosphere conditions, respectively. To examine the effects of the abnormal atmosphere, the elevated duct height and thickness are varied to provide a DPMA map for the air-to-air radar propagation when the airborne radar is located at heights of 3 km and 5 km, as shown in Figure 9. Due to the elevated duct, low DPMA levels are obtained, particularly near the airborne radar (3 km and 5 km). According to the DPMA map, the minimum values are 0.65 at an h1 of 3 km and 0.69 at an h1 of 5 km, respectively. To verify the feasibility of using the DPMA map, two representative elevated duct conditions, namely Case 1 (Jeju; 5 October 2017) and Case 2 (Pohang; 5 October 2017), are analyzed in more detail. Figure 10a,c presents the refractivity of the duct conditions for the two cases using actual refractivity data with the tri-and quad-linear models. Red solid, blue dashed, green dotted, and black dash-dotted lines specify the actual refractivity, quad-linear model, tri-linear model, and the normal atmosphere, respectively. The duct height and thickness are 4.79 km and 495 m for Case 1 as well as 7.37 km and 715 m for Case 2. Figure 10b,d shows the DPMA results according to the airborne radar height for both cases. In the simulation results, the lowest DPMA values of 0.87 and 0.93 are obtained for Case 1 and Case 2, when the radar height hs is close to the elevated duct height h1. In addition, the DPMA of the quad-linear model well follows that of the actual data, while the DPMA upper h1 of the tri-linear model has a great difference with that of the actual data.
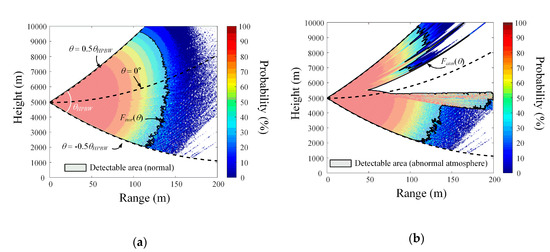
Figure 8.
Detectable area according to the target detection probability: (a) normal atmosphere; (b) abnormal atmosphere.
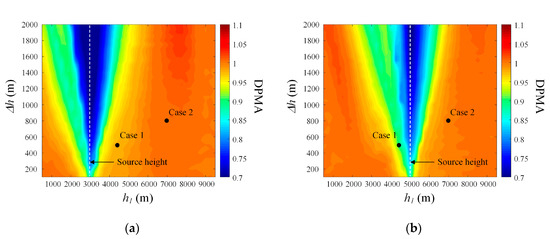
Figure 9.
Detection performance metric in terms of the atmosphere (DPMA) map in accordance with the duct height and thickness: (a) hs = 3 km; (b) hs = 5 km.
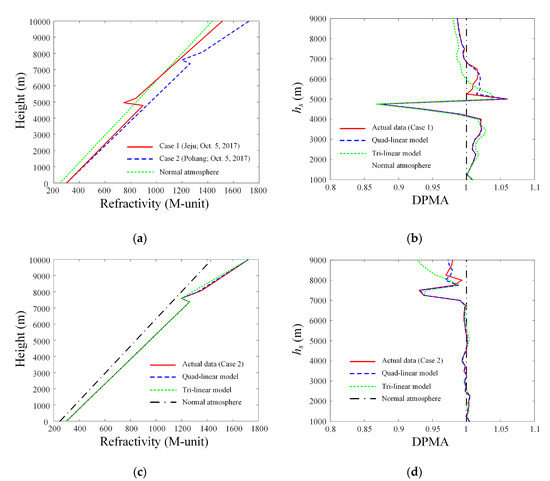
Figure 10.
Two actual abnormal cases in the DPMA map with tri- and quad-linear modeling: (a) refractivity of Case 1; (b) DPMA according to hs for Case 1; (c) refractivity of Case 2; (d) DPMA according to hs for Case 2.
3. Conclusions
In this paper, we analyzed the target detection performance of air-to-air airborne radars using long-range propagation simulations involving a novel quad-linear refractivity model under abnormal atmospheric effects. The radar propagation characteristics and the target detection performances were simulated using the AREPS software. In relation to the AREPS simulation conditions, the quad-linear refractivity model as well as the altitude, the antenna radiation pattern, and the DTED were considered as inputs to obtain the path loss of the wave propagation. The quad-linear modeling result well agreed with the actual refractivity data when compared with the conventional trilinear model, with the root-mean-square deviations of the refractivity being 7.2 M-unit for the quad-linear model and 60.2 M-unit for the trilinear model. The radiation pattern of the 32 × 32 triangular array antenna had an HPBW of 2.85° and an SLL of −13.5 dB, which were used as inputs for the simulation parameters. In terms of the AREPS simulations, the resulting path losses when using the quad-linear model and the actual data exhibited similar propagation characteristic trends. To examine the effects of the abnormal atmosphere, the DPMA maps at airborne radar heights of 3 km and 5 km were provided according to the duct height h1 and thickness Δh, where the minimum DPMA values were 0.65 at an h1 of 3 km and 0.69 at an h1 of 5 km. To verify the feasibility of using the DPMA map, two representative elevated duct conditions (Case 1 and Case 2) were analyzed in more detail. According to the simulation results, the lowest DPMA values of 0.87 and 0.93 were obtained for Case 1 and Case 2, respectively, when the radar height hs was close to the elevated duct height h1. These results confirmed that the proposed analysis could intuitively determine the target detection performances of air-to-air airborne radars under abnormal atmospheric conditions.
Author Contributions
Conceptualization, T.H.L. and H.C.; methodology, T.H.L. and H.C.; software, T.H.L.; validation, T.H.L., M.G., C.S. and H.C.; formal analysis, T.H.L. and H.C.; investigation, T.H.L., M.G., C.S. and H.C.; resources, T.H.L., M.G., C.S. and H.C.; data curation, T.H.L.; writing—original draft preparation, T.H.L. and H.C.; writing—review and editing, T.H.L. and H.C.; visualization, T.H.L.; supervision, H.C.; project administration, C.S. and H.C.; funding acquisition, M.G., C.S. and H.C. All authors have read and agreed to the published version of the manuscript.
Funding
This work was supported by a grant-in-aid of HANWHA SYSTEMS, the Basic Science Research Program through the National Research Foundation of Korea (NRF) funded by the Ministry of Education (No. NRF-2015R1A6A1A03031833), and the NRF grant funded by the Korea government (No. NRF-2017R1A5A1015 596).
Conflicts of Interest
The authors declare no conflict of interest.
References
- Barclay, M.; Pietzschmann, U.; Gonzalez, G.; Tellini, P. AESA upgrade option for Eurofighter Captor radar. In Proceedings of the 2008 IEEE Radar Conference, Rome, Italy, 26–30 May 2008; pp. 1–5. [Google Scholar]
- Benzon, H.-H.; Høeg, P. Wave propagation simulation of radio occultations based on ECMWF refractivity profiles. Radio Sci. 2015, 50, 778–788. [Google Scholar] [CrossRef]
- Farina, A.; Saverione, A.; Timmoneri, L. MVDR vectorial lattice applied to space-time processing for AEW radar with large instantaneous bandwidth. IEE Proc. Radar Sonar Navig. 1996, 143, 41–46. [Google Scholar] [CrossRef]
- Karimian, A.; Yardim, C.; Gerstoft, P.; Hodgkiss, W.S.; Barrios, A.E. Refractivity estimation from sea clutter: An invited review. Radio Sci. 2011, 46, 1–6. [Google Scholar] [CrossRef]
- Kim, C.-K.; Lee, J.-S.; Chae, J.-S.; Park, S.-O. A modified stripmap SAR processing for vector velocity compensation using the cross-correlation estimation method. J. Electromagn. Eng. Sci. 2019, 19, 159–165. [Google Scholar] [CrossRef]
- Rim, J.-W.; Koh, I.-S. SAR image generation of ocean surface using time-divided velocity bunching model. J. Electromagn. Eng. Sci. 2019, 19, 82–88. [Google Scholar] [CrossRef]
- Kim, S.Y.; Sung, J.B.; Torre, A. In-Orbit Antenna Pattern Extraction Method for Active Phased-Array SAR Antennas. IEEE Antennas Wirel. Propag. Lett. 2016, 15, 317–320. [Google Scholar] [CrossRef]
- Wagner, M.; Gerstoft, P.; Rogers, T. Estimating refractivity from propagation loss in turbulent media: Refractivity from propagation loss. Radio Sci. 2016, 51, 1876–1894. [Google Scholar] [CrossRef]
- Xu, J.; Zhu, S.; Liao, G. Space-Time-Range Adaptive Processing for Airborne Radar Systems. IEEE Sens. J. 2015, 15, 1602–1610. [Google Scholar]
- Nathanson, F.E.; O’Reilly, P.J.; Cohen, M.N. Radar Design Principles: Signal Processing and the Environment; Scitech Publ.: Raleigh, NC, USA, 2004. [Google Scholar]
- Skolnik, M.I. Radar Handbook; McGraw-Hill: New York, NY, USA, 2008; ISBN 978-0-07-148547-0. [Google Scholar]
- Thomson, D.J.; Chapman, N.R. A wide-angle split-step algorithm for the parabolic equation. J. Acoust. Soc. Am. 1983, 74, 1848–1854. [Google Scholar] [CrossRef]
- Hitney, H.V. Hybrid ray optics and parabolic equation methods for radar propagation modeling. In Proceedings of the 92 International Conference on Radar, Brighton, UK, 12–13 October 1992; pp. 58–61. [Google Scholar]
- ITU. The Radio Refractive Index: Its Formula and Refractivity Data. ITU-R P.453. 2019. Available online: https://www.itu.int/rec/R-REC-P.453/en (accessed on 8 September 2019).
- Wang, S.; Lim, T.H.; Chong, Y.J.; Ko, J.; Park, Y.B.; Choo, H. Estimation of abnormal wave propagation by a novel duct map based on the average normalized path loss. Microw. Opt. Technol. Lett. 2020, 62, 1662–1670. [Google Scholar] [CrossRef]
- Lim, T.H.; Wang, S.; Chong, Y.-J.; Park, Y.B.; Ko, J.; Choo, H. High altitude ducts causing abnormal wave propagation in coastal area of Korea. Microw. Opt. Technol. Lett. 2020, 62, 643–650. [Google Scholar] [CrossRef]
- ITU. A Propagation Prediction Method for Aeronautical Mobile and Radionavigation Services Using the VHF, UHF and SHF Bands. ITU-R P.528. 2019. Available online: https://www.itu.int/rec/R-REC-P.528/en (accessed on 8 September 2019).
- Ozgun, O.; Apaydin, G.; Kuzuoglu, M.; Sevgi, L. PETOOL: MATLAB-based one-way and two-way split-step parabolic equation tool for radiowave propagation over variable terrain. Comput. Phys. Commun. 2011, 182, 2638–2654. [Google Scholar] [CrossRef]
- Finkelman, I.; Teneh, N.; Lukovsky, G. Detection probability calculations for fluctuating targets under clutter. In Proceedings of the 2020 14th European Conference on Antennas and Propagation (EuCAP), Copenhagen, Denmark, 15–20 March 2020; pp. 1–4. [Google Scholar]
- Gómez-Pérez, P.; Cuiñas, Í.; Crego-García, M. Reduction of radar performance for target detection within forests. J. Appl. Remote Sens. 2016, 10, 026028. [Google Scholar] [CrossRef]
- Fannin, B.; Jehn, K. A study of radar elevation-angle errors due to atmospheric refraction. IRE Trans. Antennas Propag. 1957, 5, 71–77. [Google Scholar] [CrossRef]
- Zhao, X.; Huang, J. Refractive error correction on radar target detection in evaporation duct. In Proceedings of the 2012 6th International Symposium on Antennas, Propagation and EM Theory, Xi’an, China, 22–26 October 2012; pp. 415–418. [Google Scholar]
- Lee, H.; Lee, T.; Chun, J.; Lee, J. Target positioning with surveillance radar by the estimation of atmospheric refractivity profile. IEEE Trans. Aerosp. Electron. Syst. 2020, 56, 2245–2255. [Google Scholar] [CrossRef]
- Fortunati, S.; Gini, F.; Greco, M.S.; Farina, A.; Graziano, A.; Giompapa, S.; Castella, F.R. Correction of refracted propagation effects for airborne radar tracking. IEEE Trans. Aerosp. Electron. Syst. 2013, 49, 20–41. [Google Scholar] [CrossRef]
- Blake, L.V. Radar Range-Performance Analysis; Munro Pub. Co.: Silver Spring, MD, USA, 1991. [Google Scholar]


© 2020 by the authors. Licensee MDPI, Basel, Switzerland. This article is an open access article distributed under the terms and conditions of the Creative Commons Attribution (CC BY) license (http://creativecommons.org/licenses/by/4.0/).