Article

Detection of Adjacent and Non-Adjacent Bar Breakages in Induction Motors Based on Power Spectral Subtraction and Second Order Statistics of Sound Signals

by
Miguel Enrique Iglesias Martínez
1,2,
Pedro Fernández de Córdoba
2,
Jose Alfonso Antonino-Daviu
3,* and
J. Alberto Conejero
2
1
Departamento de Telecomunicaciones, Universidad de Pinar del Río, Martí #270, Pinar del Río 20100, Cuba
2
Instituto Universitario de Matemática Pura y Aplicada, Universitat Politècnica de València (UPV), Camino de Vera s/n, 46022 Valencia, Spain
3
Instituto Tecnológico de la Energía, Universitat Politècnica de València (UPV), Camino de Vera s/n, 46022 Valencia, Spain
*
Author to whom correspondence should be addressed.
Appl. Sci. 2020, 10(19), 6641; https://doi.org/10.3390/app10196641
Submission received: 13 July 2020 / Revised: 10 August 2020 / Accepted: 11 August 2020 / Published: 23 September 2020
(This article belongs to the Section Electrical, Electronics and Communications Engineering)

Abstract

:

Featured Application

We provide a non-intrusive tool for the detection of adjacent and non-adjacent bar breakage from the acoustic noise radiated by a motor. It can be included as a smart application in a transportable device.

Abstract

We apply power spectral analysis based on covariance function and spectral subtraction to detect adjacent and non-adjacent bar breakages. We obtain a spectral pattern when the signal presents one or various broken bars, independent of the relative position of the bar breakages. The proposed algorithm gives satisfactory results for detectability compared to some previous research. Additionally, we also present illustrations of faults and signal to noise in the noise-reduction stage.

1. Introduction

Acoustic signal processing is a distinctive application in numerous sectors in life, like industry and communications. In electric motor diagnosis, acoustic noise investigation is a robust alternative to complement the information given by other methods [1,2,3,4]. A common issue in these machines is the occasional occurrence of rotor damage, such as broken bars. These faults may indeed lead to disastrous disappointments and constrained motor blackouts that can infer critical misfortunes for the businesses using them. In particular, it is especially important in the case of high-voltage motors that are used in exceptionally large machines. Figure 1 depicts a picture of the rotor of a motor with broken bars.
The acoustic noise analysis permits rotor damage to be detected and adjacent broken rotor bars to be classified, as proven in previous works [5]. With regards to the detection of non-adjacent bar breakages, it has not been reliably solved by other techniques like vibration or current analysis techniques that have even provided false-negative diagnostics when detecting this fault [6].
Noise-based diagnosis algorithms based on fast Fourier transform (FFT) and other spectral methods that rely on subspace vectors were considered in [5,6,7,8,9,10,11,12]. However, the FFT has a drawback: it is not immune to noise since the spectrum of a noisy signal also includes the noise spectrum. To overcome this constraint, a few researchers have utilized high-resolution spectral algorithms, with the impediment of not knowing a priori the number of subspaces designated to the noise [7,8].
Recently, a filter based on the windowed Fourier transforms (WFT) [13] has also been considered, a strategy that lies in a choice of amplitudes: multiexpanded in the spectrum [14], or an algorithm based on calculations on spectral vector subspaces such as MUSIC and ESPRIT [15]. Furthermore, wavelet-based strategies [11,16,17,18,19,20,21,22] or empirical mode decomposition (EMD) [23] have also been considered.
The application of higher-order cumulants or bispectrum, or its one-dimensional component, has been employed for fault diagnosis in [24,25,26,27]. However, the use of all the data within the bispectrum lies in two-dimensional Fourier transforms that may increase computational cost.
Other methods different from the examination of sound signals allow the number of broken bars to be distinguished and the deficiencies in a motor to be analyzed, such as artificial intelligence algorithms [12,28,29,30], thermal images processing [6], and chaos theory methods [31].
Nevertheless, none of them have demonstrated being substantially sufficient for the case of non-adjacent broken bar diagnosis. Subsequently, we propose a method based on calculations that imply second-order statistics, convolution, and spectral subtractions for the failure detection of bar breakages, using the noise of an induction motor. These calculations are used not only as it were to identify adjacent bar breakages, but also to examine the plausibility of identifying non-adjacent broken bars and hence improve the outcomes of classical methods.
As commented, one of the cornerstones of the condition monitoring area is the detection of non-adjacent broken bars. Diagnosis tools like the conventional motor current signature analysis (MCSA) may lead to false-positive detection of non-adjacent breakages [32]. Recent efforts have been addressed to detect rotor bar failures, regardless of if the bars were consecutive or not [33,34]. Here, we propose a new acoustic approach that enables us to detect failures. The method also works for the detection of non-adjacent broken bars.
In Section 2, we present the foundations of the analyzed fault and of the tools considered in our work. In Section 3, we show that the convolution of a signal motor with its autocovariance permits diminishing the noise. We present the proposed design and the results in Section 4, and the conclusions in Section 5.

2. Materials and Methods

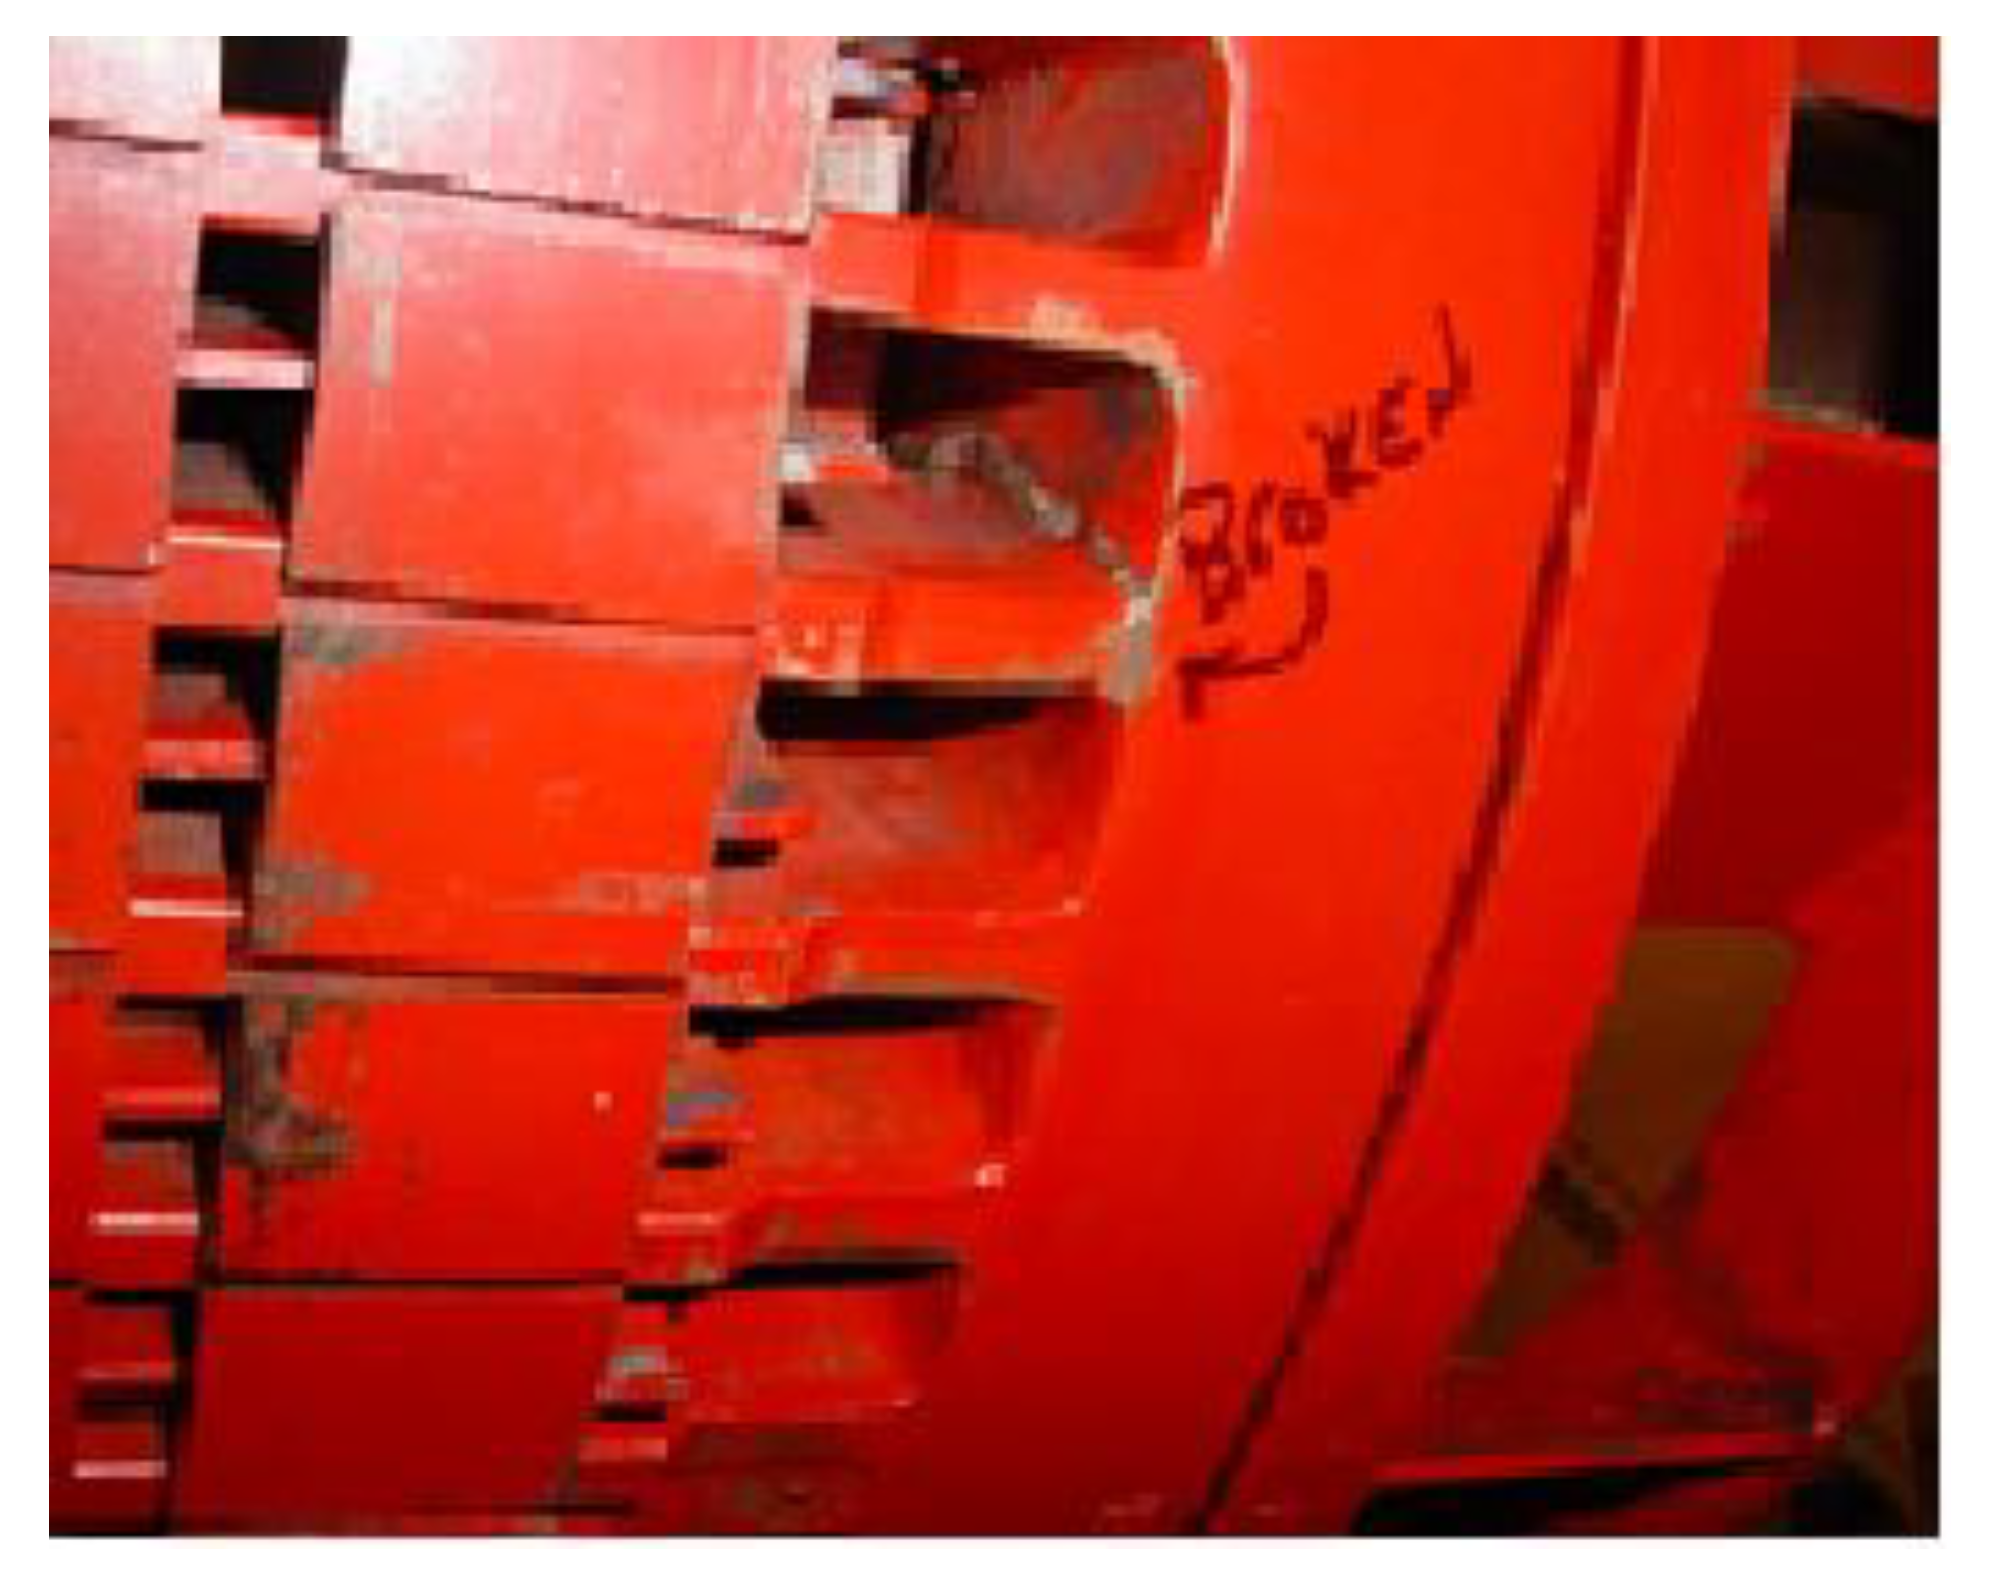
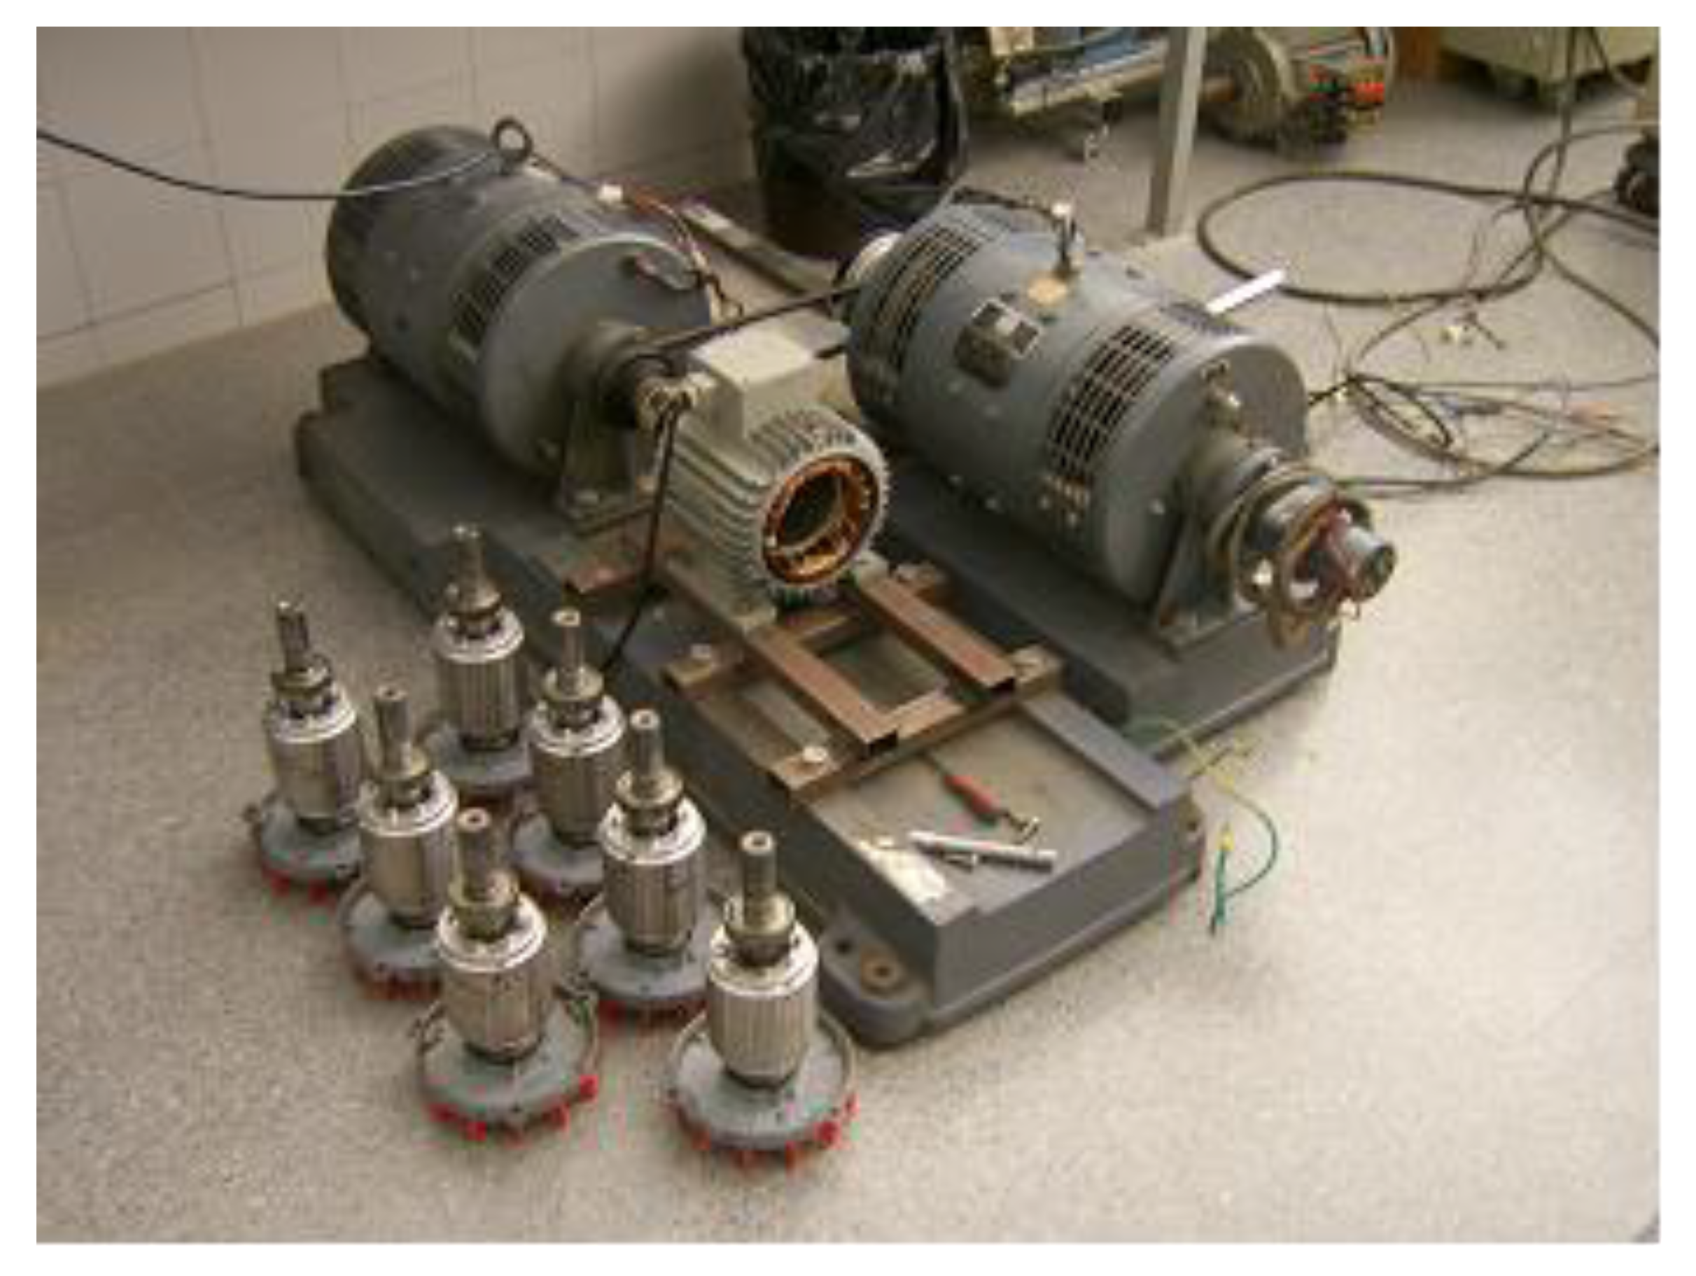
2.1. Faults Analyzed: Broken Rotor Bars (BRB)

It is already known that a broken bar in a motor leads to a mechanical distortion in the air gap magnetic field. This distortion yields certain harmonics in the stator phase current. The foremost one is the lower sideband harmonic (also known as left sideband harmonic), with frequency given by ( 1 2 s ) f , where f stands for the line supply frequency, s   for the slip defined in (1), n s for the synchronous speed of the machine (in r.p.m., equivalent to 60 f / p , with p numbers of poles), and n for the motor speed.
s = n s n n s ,
We know that the lower sideband harmonic is linked to a torque oscillation, and it yields another harmonic that appears in the stator current spectrum: the upper sideband harmonic (or right sideband harmonic), given by ( 1 + 2 s ) f .
Moreover, the speed oscillation caused by the presence of broken rotor bars generates a frequency modulation in the rotational frequency, yielding two sidebands in the vibration spectrum and, hence, in the noise spectrum, with frequencies given by (2) [23].
F B B = F R ± 2 k s f   , k     0

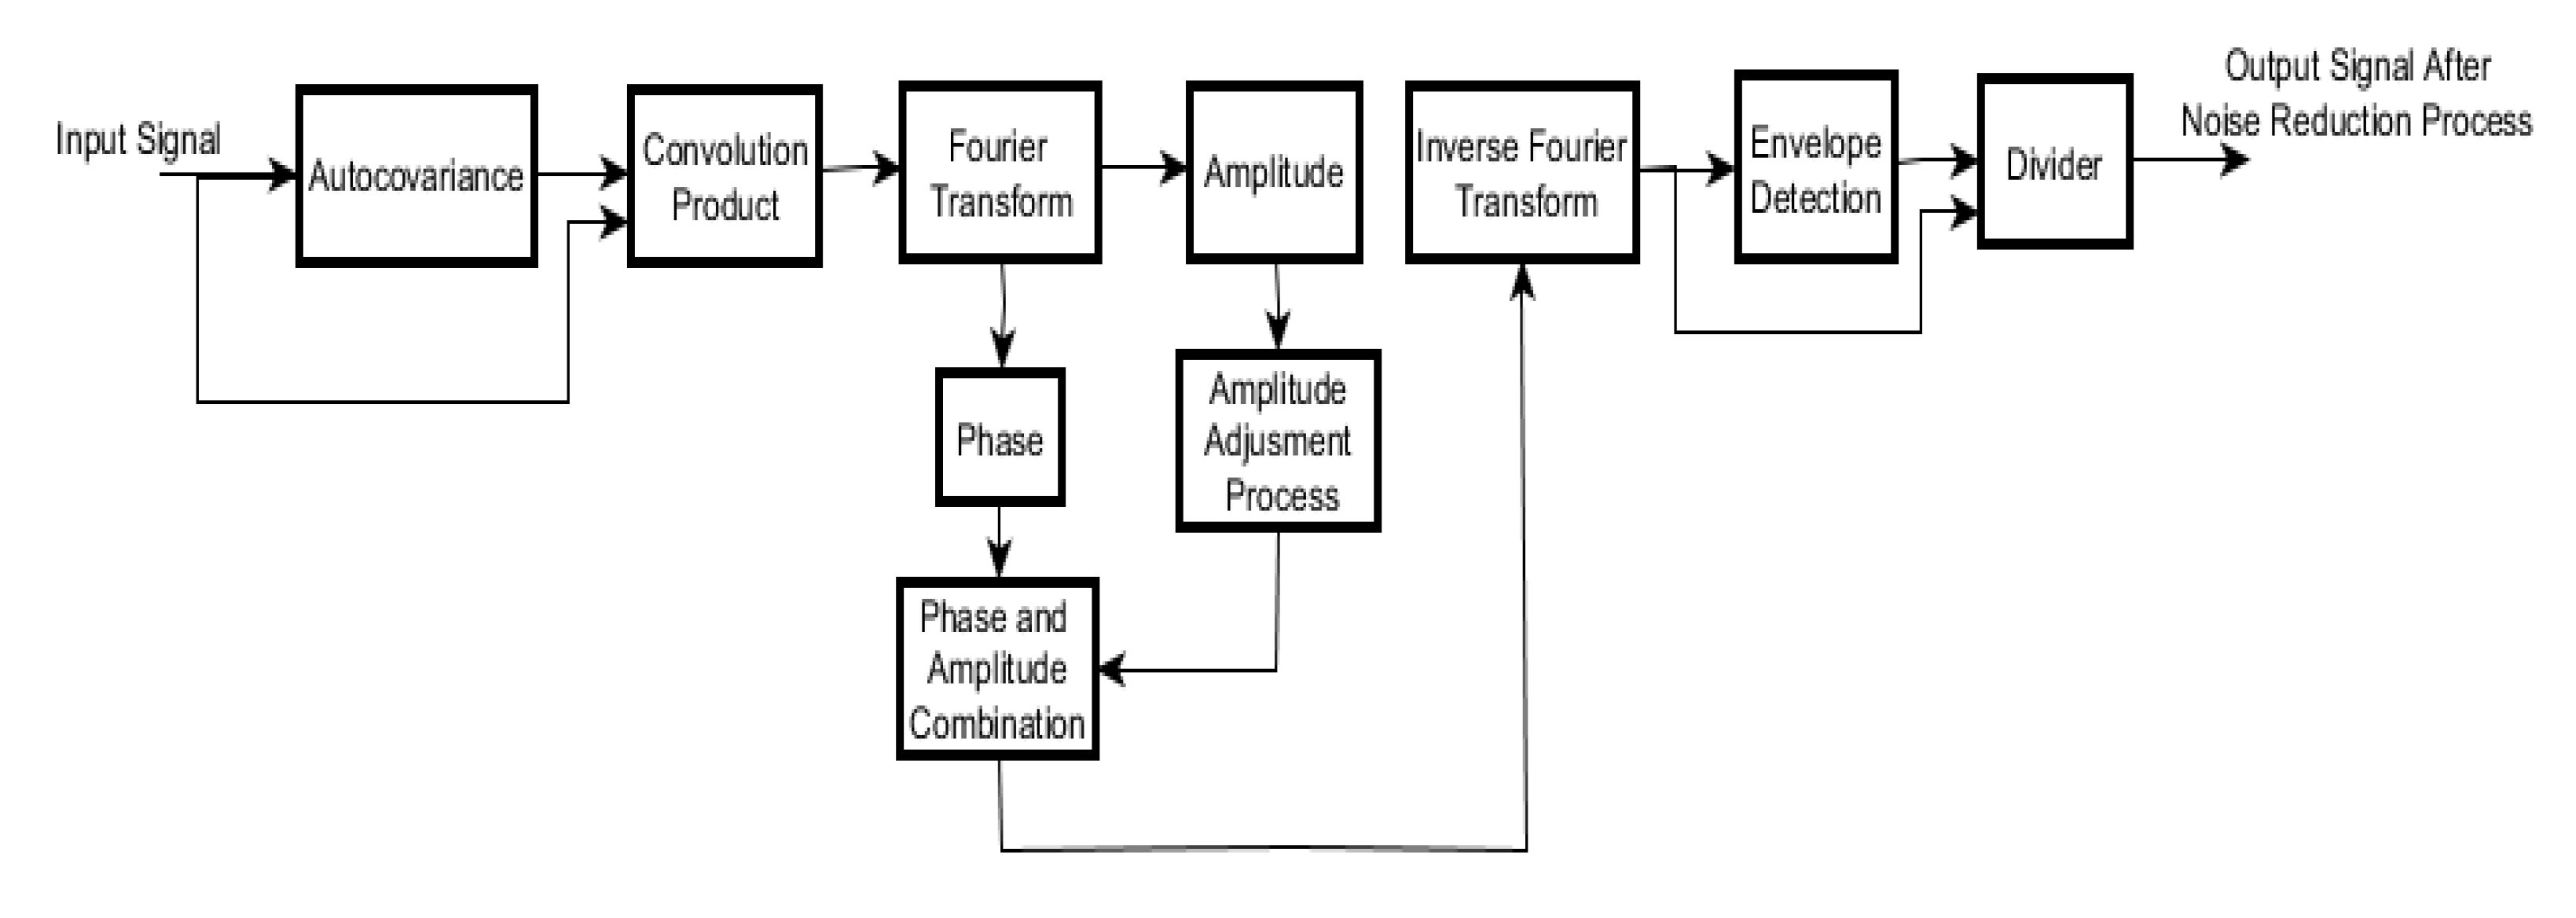
2.2. The Noise-Reduction Algorithm

Concerning the processing of signals for noise reduction, different works have been carried out. These works can be classified according to various criteria. However, according to the number of signals at the input of the noise-reduction system, they can be classified into methods that use two or more input signals, and methods that use only one input signal [22]. A classification proposal can then be provided; it tries to group different techniques according to their characteristics and requirements:
  • Classical FIR (Finite Impulse Response) filtering methods [35,36,37].
  • Adaptive noise reduction methods [38,39,40].
  • Artificial intelligence methods. Neural Networks [41,42].
  • Wavelet-based methods [43,44,45].
  • Statistical signal processing methods [46,47].
From previous works, classical filtering techniques limit their use to reduce noise only in the frequency band to which the filter is limited. On the other hand, although adaptive filtering algorithms have the ability to adapt, most of them need a reference sample for obtaining tangible results. Similarly, artificial intelligence and wavelet-based methods need a reference to adjust the desired output and a comparison threshold, which depends on the noise power, respectively. The proposed noise reduction algorithm is intended to simplify the signal and keep only the information relative to the motor behavior that leads to identifying the broken bars. It distinguishes and separates the spectral components of the acoustics that do not inform about them. These components are considered as random interferences from the environment. We consider them part of a Gaussian noise. We split the propose method into the following steps:
  • We set a filter from the convolution of the signal with its autocovariance. More details about these operations will be shown below and in the recent survey paper of the authors [34].
  • The result of the convolution is rescaled in amplitude by a non-linear factor:
A k = 4 ( A k ) 1 / 3 ,     with   k     0  
where A k is the signal amplitude obtained from the convolution-autocovariance calculation and A k   is the amplitude of the original signal.
3.
We apply an envelope detector to the outcome of the IFT (inverse Fourier transform) from the previous step. This demodulates the signal thanks to the loss of symmetry after the amplitude and phase rescaling.
4.
Finally, the filtered signal is recovered after a division of the result of the envelope detector.
To summarize, we represent the whole in Figure 2, where the input signal is the acoustic signal obtained directly from the induction motor.
For the sake of completeness, we give more details about using second-order statistics to explain the result of the convolution of a signal with its autocovariance. The autocovariance measures the scattering of the signal around the mean value [33,34,48,49]. If y = { y ( t ) } t 0 is the signal, then:
C 2 y ( t 1 , t 2 ) = E [ ( y ( t 1 ) u y ( t 1 ) ) ( y ( t 2 ) u y ( t 2 ) ) ] = R 2 y ( t 1 , t 2 )     u y ( t 1 ) u y ( t 2 ) .
where u y ( t ) is the mean and R 2 y is the autocorrelation of y ( t ) . If u y ( t ) is zero then the autocorrelation matches the autocovariance. For ergodic stationary data, we may assume u y ( t ) to be constant for all t 0 . Then, the autocovariance function of (3) becomes:
C 2 y ( t 1 , t 2 ) = R 2 y ( t 1 , t 2 )     u y ( t ) 2

2.3. Convolution-Autocovariance Calculation

When acquiring a periodic signal x ( t ) , the noisy observed signal a ( t ) is described as:
a ( t ) = x ( t ) + n ( t ) =   k = 1 N A k   cos ( w k t + ϕ k ) + n ( t )
where and n ( t ) are the input signal and an additive stationary noise. Furthermore, A k , f k , and ϕ k for k = 1 , ,   N , are the amplitude, frequency, and phase for every single harmony component. Using this representation, we obtain:
C 2 a ( t ) = C 2 x ( t ) + C 2 n ( t ) = E ( x ( t s ) x ( s + t ) ) + E ( ( n ( s ) n ( s + t ) )
The autocorrelation of a white noise n ( t ) with zero mean and variance σ n 2   is a Dirac distribution δ 0 ( t ) . If the signal is harmonic, it returns a harmonic signal with null phase. Then from (4) and (6), we obtain:
C 2 a ( t ) = k = 1 N A k 2 2   cos ( w k t ) + σ n 2 δ 0 ( t )
From (7), it is noted that the phase information of the original data is missed. For retrieving the phase information we can convolve a ( t ) C 2 a ( t ) . The calculation process is described below:
a C 2 a ( t ) = lim T T 2 T 2 a ( t s ) C 2 a ( t s ) d s = lim T T 2 T 2 ( k = 1 N A k cos ( w k s + ϕ k ) + n ( s ) ) ( k = 1 N A k 2 2   cos ( w k ( t s ) ) + σ n 2 δ 0 ( t s ) ) d s = lim T T 2 T 2 ( k = 1 N A k cos ( w k s + ϕ k ) ) ( k = 1 N A k 2 2   cos ( w k ( t s ) ) ) d s + lim T T 2 T 2 n ( s ) ( k = 1 N A k 2 2   cos ( w k ( t s ) ) ) d s   + lim T T 2 T 2 ( k = 1 N A k cos ( w k s + ϕ k ) ) σ n 2 δ 0 ( t s ) d s +   lim T T 2 T 2 n ( s ) σ n 2 δ 0 ( t s ) d s
If the number of data samples tends to infinity, a C 2 a ( t ) , then we recover the phase information:
a C 2 a ( t ) = k = 1 N A k 3 4   cos ( w k t + ϕ k )

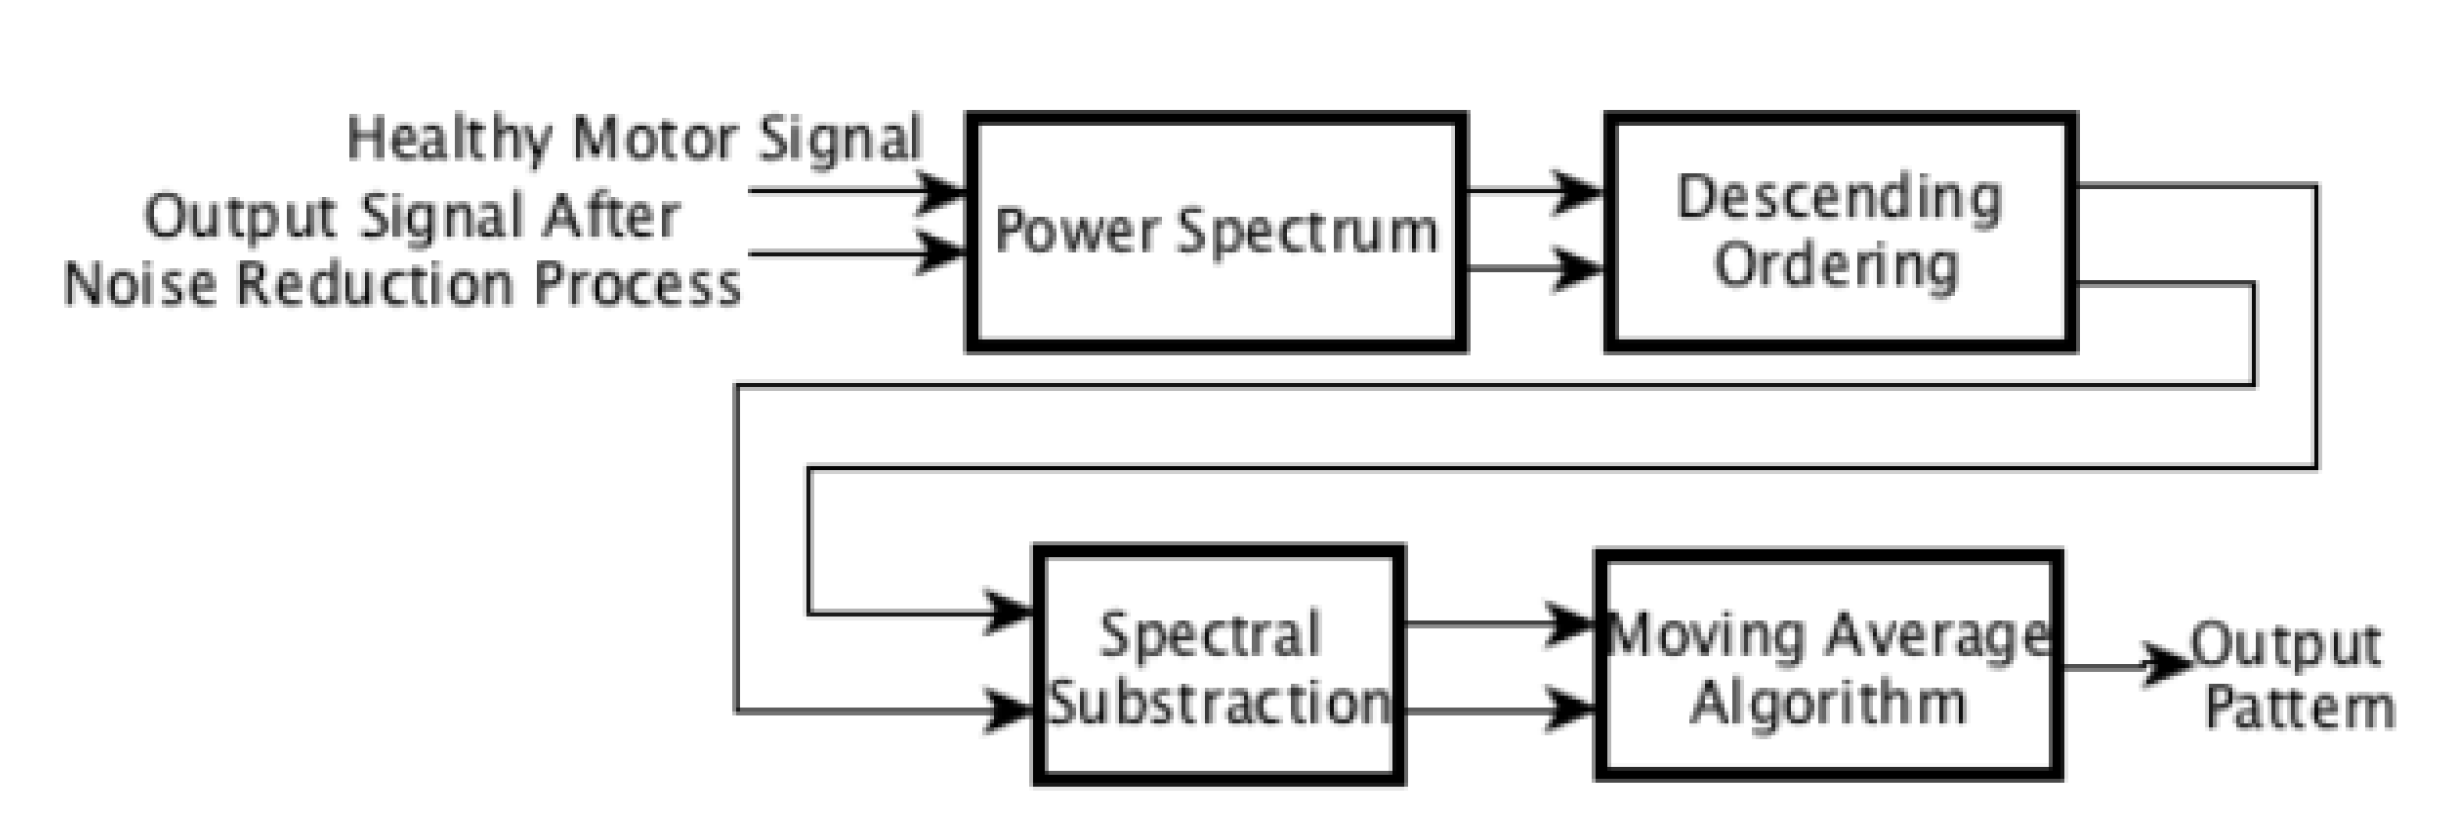
2.4. Spectral Pattern Recognition for Broken Bar Detection

For the sake of clarity, we set a method that enables us to classify damages failures, see Figure 3. It is based on the descending order spectrum applied to the signal obtained after noise reduction. Then, we apply spectral subtraction respect to the healthy motor signal. Finally, we apply a moving average block to smooth the signal by impulsive components of the spectral subtraction. We point out that the pattern recognition algorithm requires the use, as a basic pattern, of the healthy motor signal. This is not a major constraint since this signal can be obtained easily during motor commissioning. At any moment of the posterior motor operation, actual motor samples can be obtained and compared with the healthy one, analogous to what is done in adaptive systems schemes.

3. Results

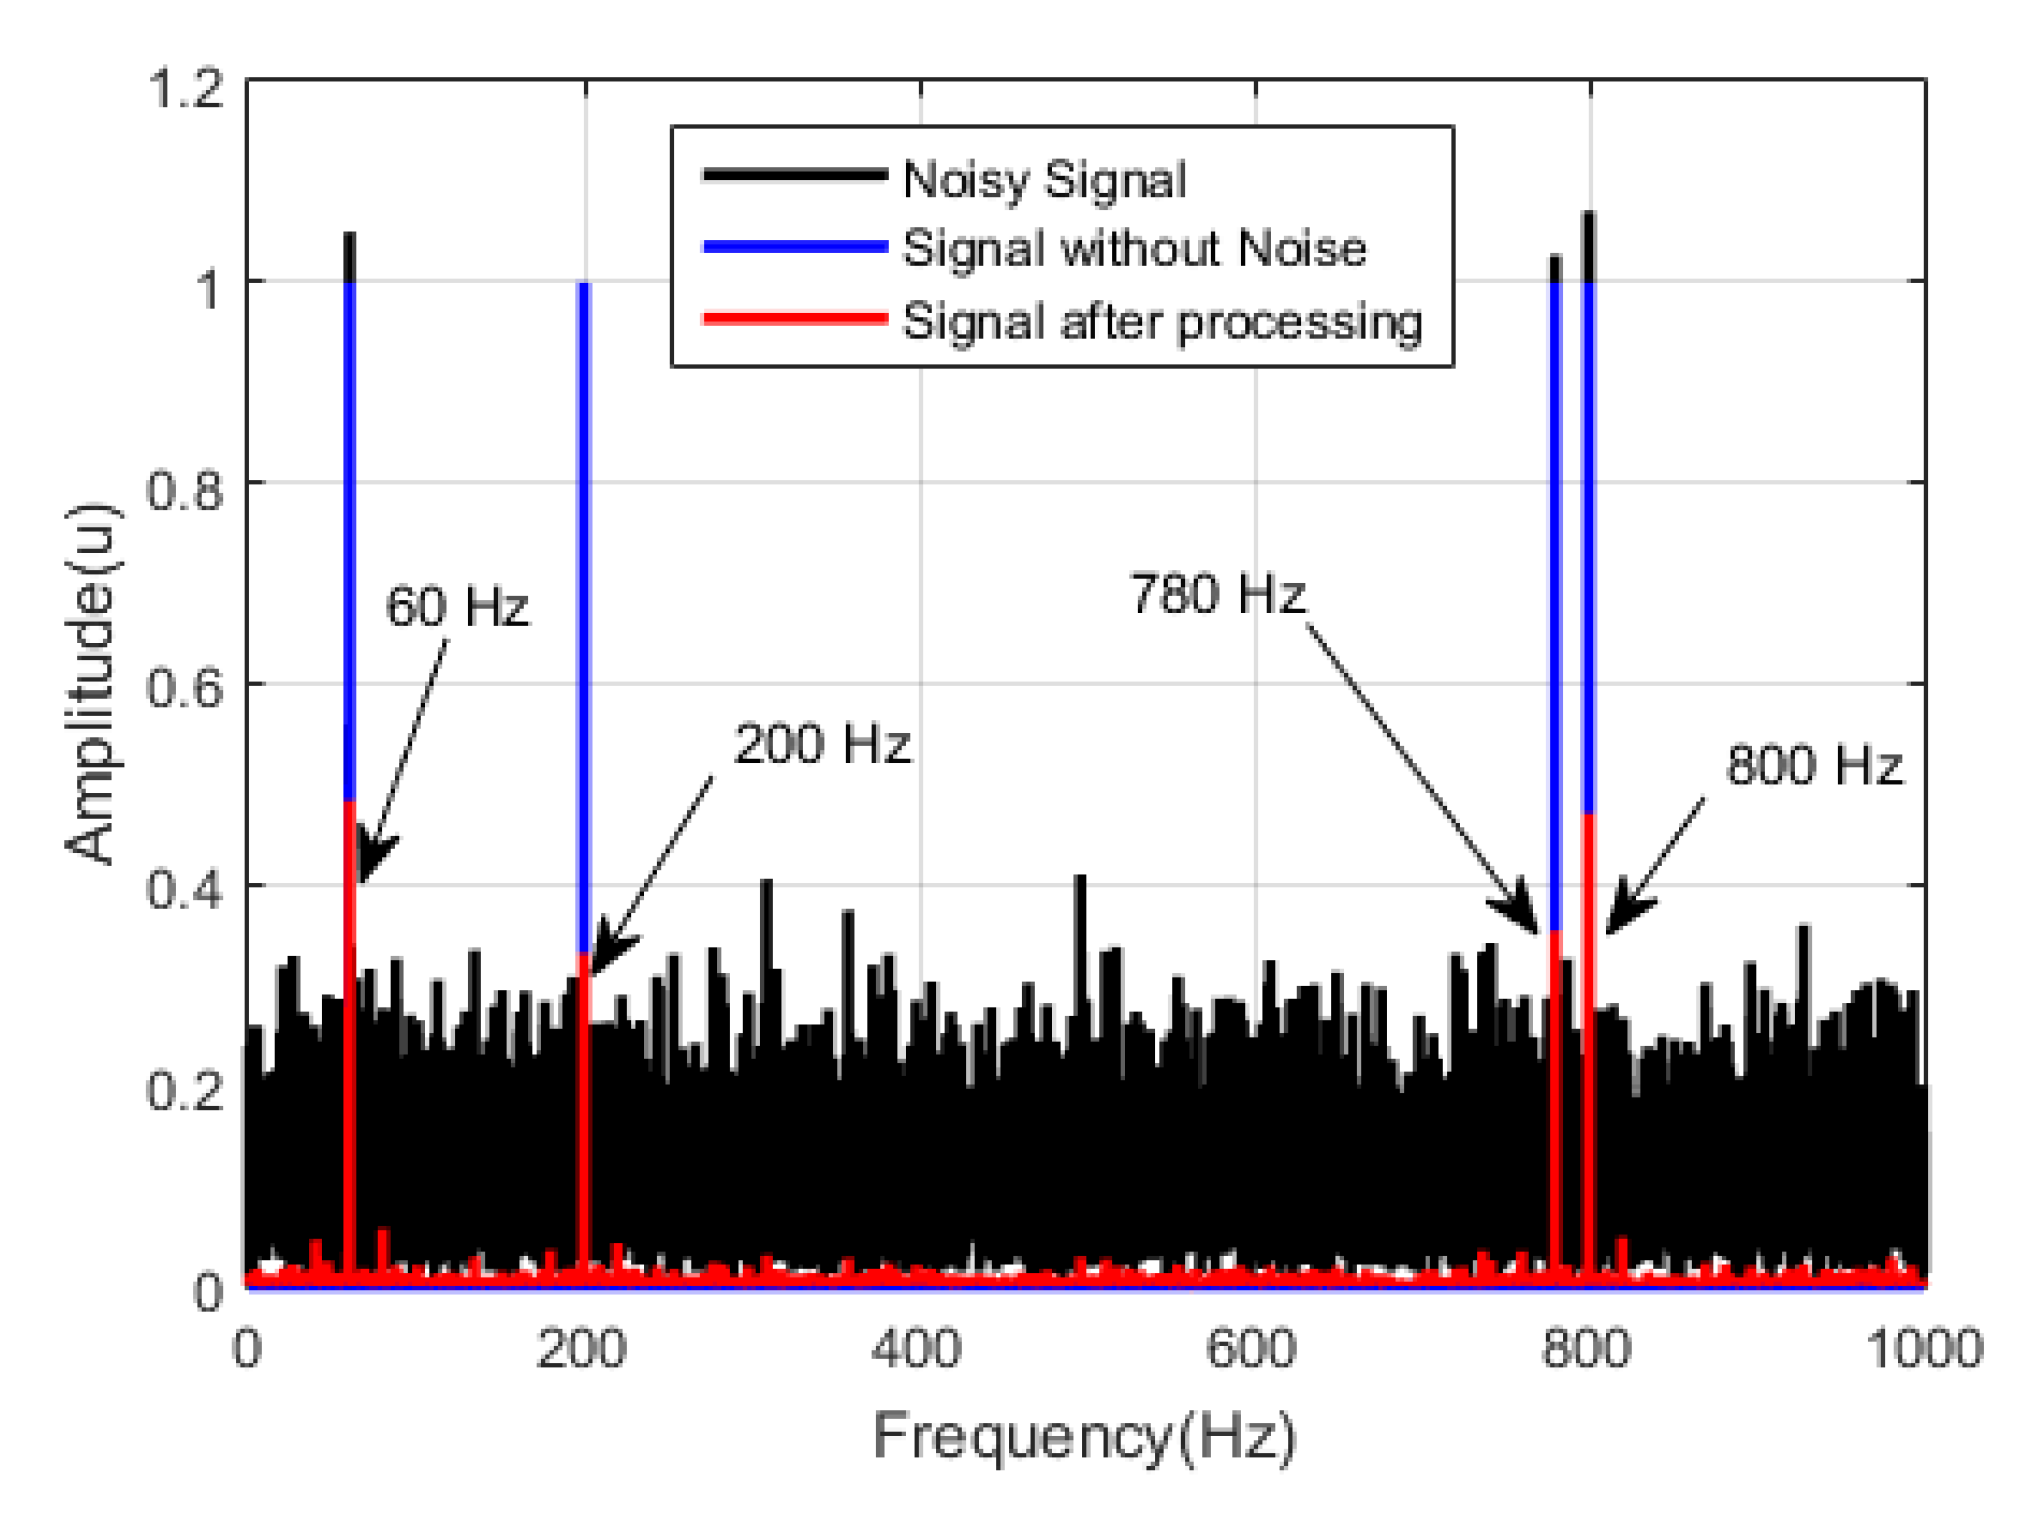
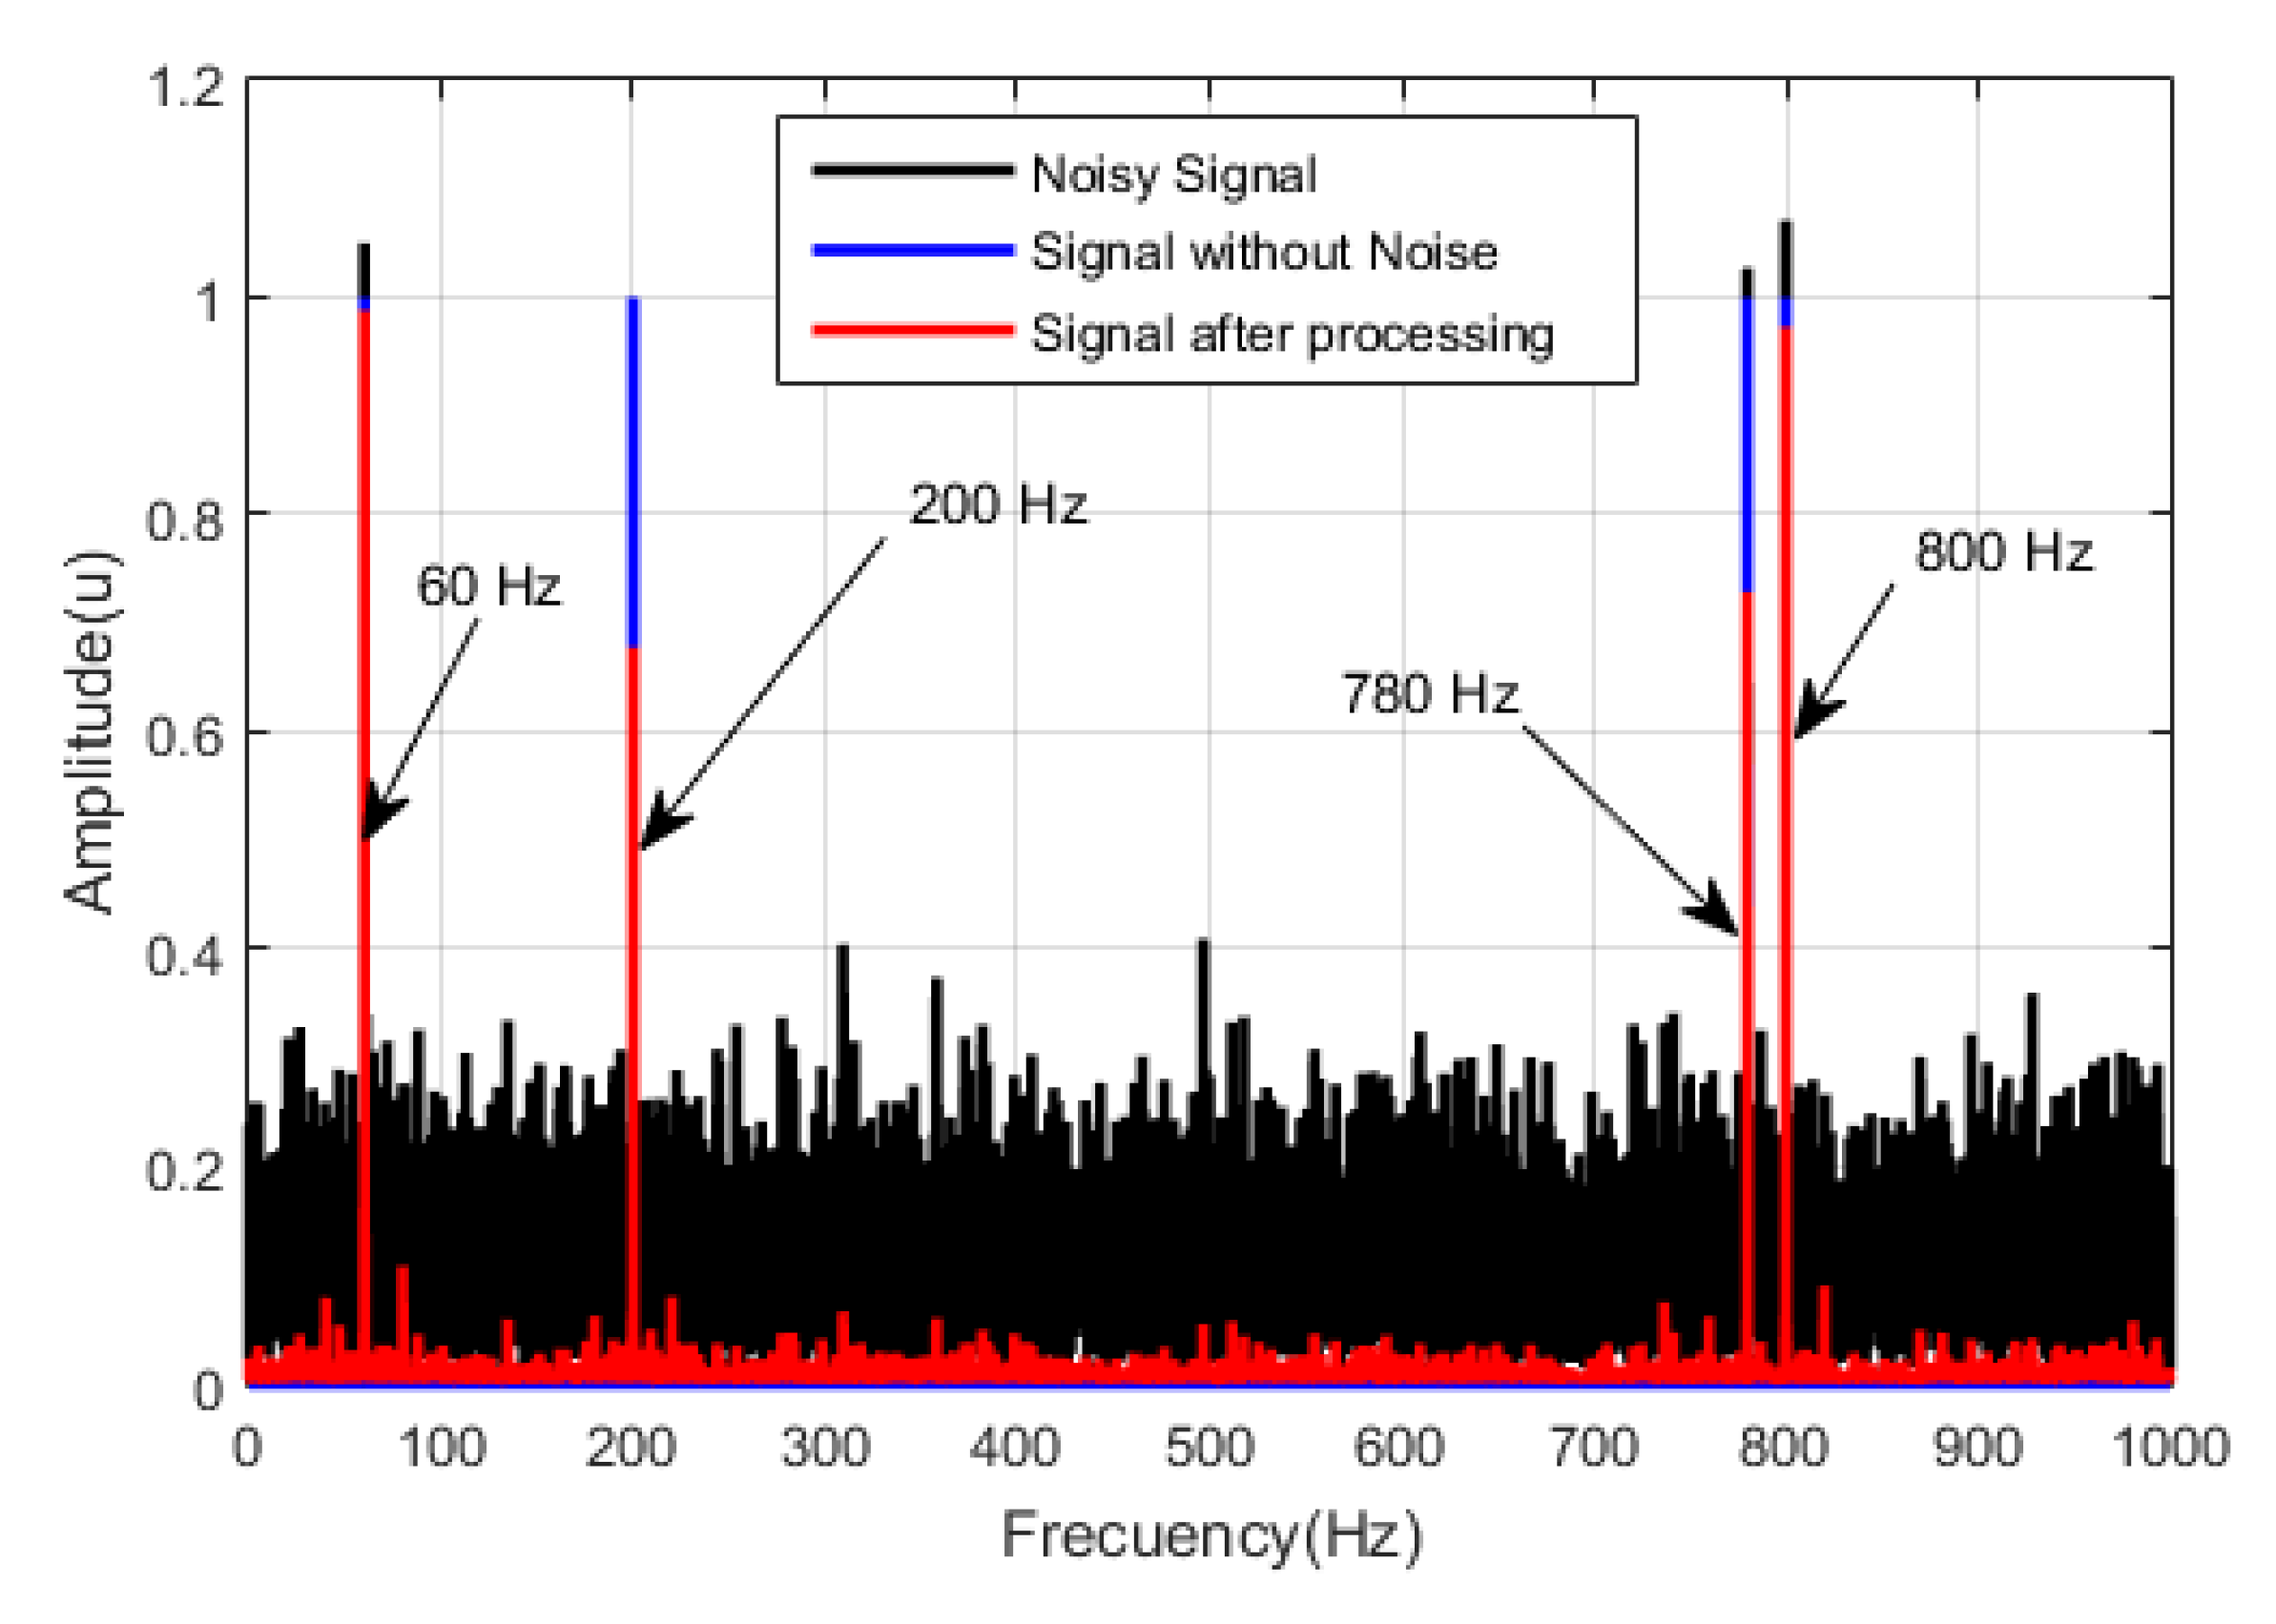
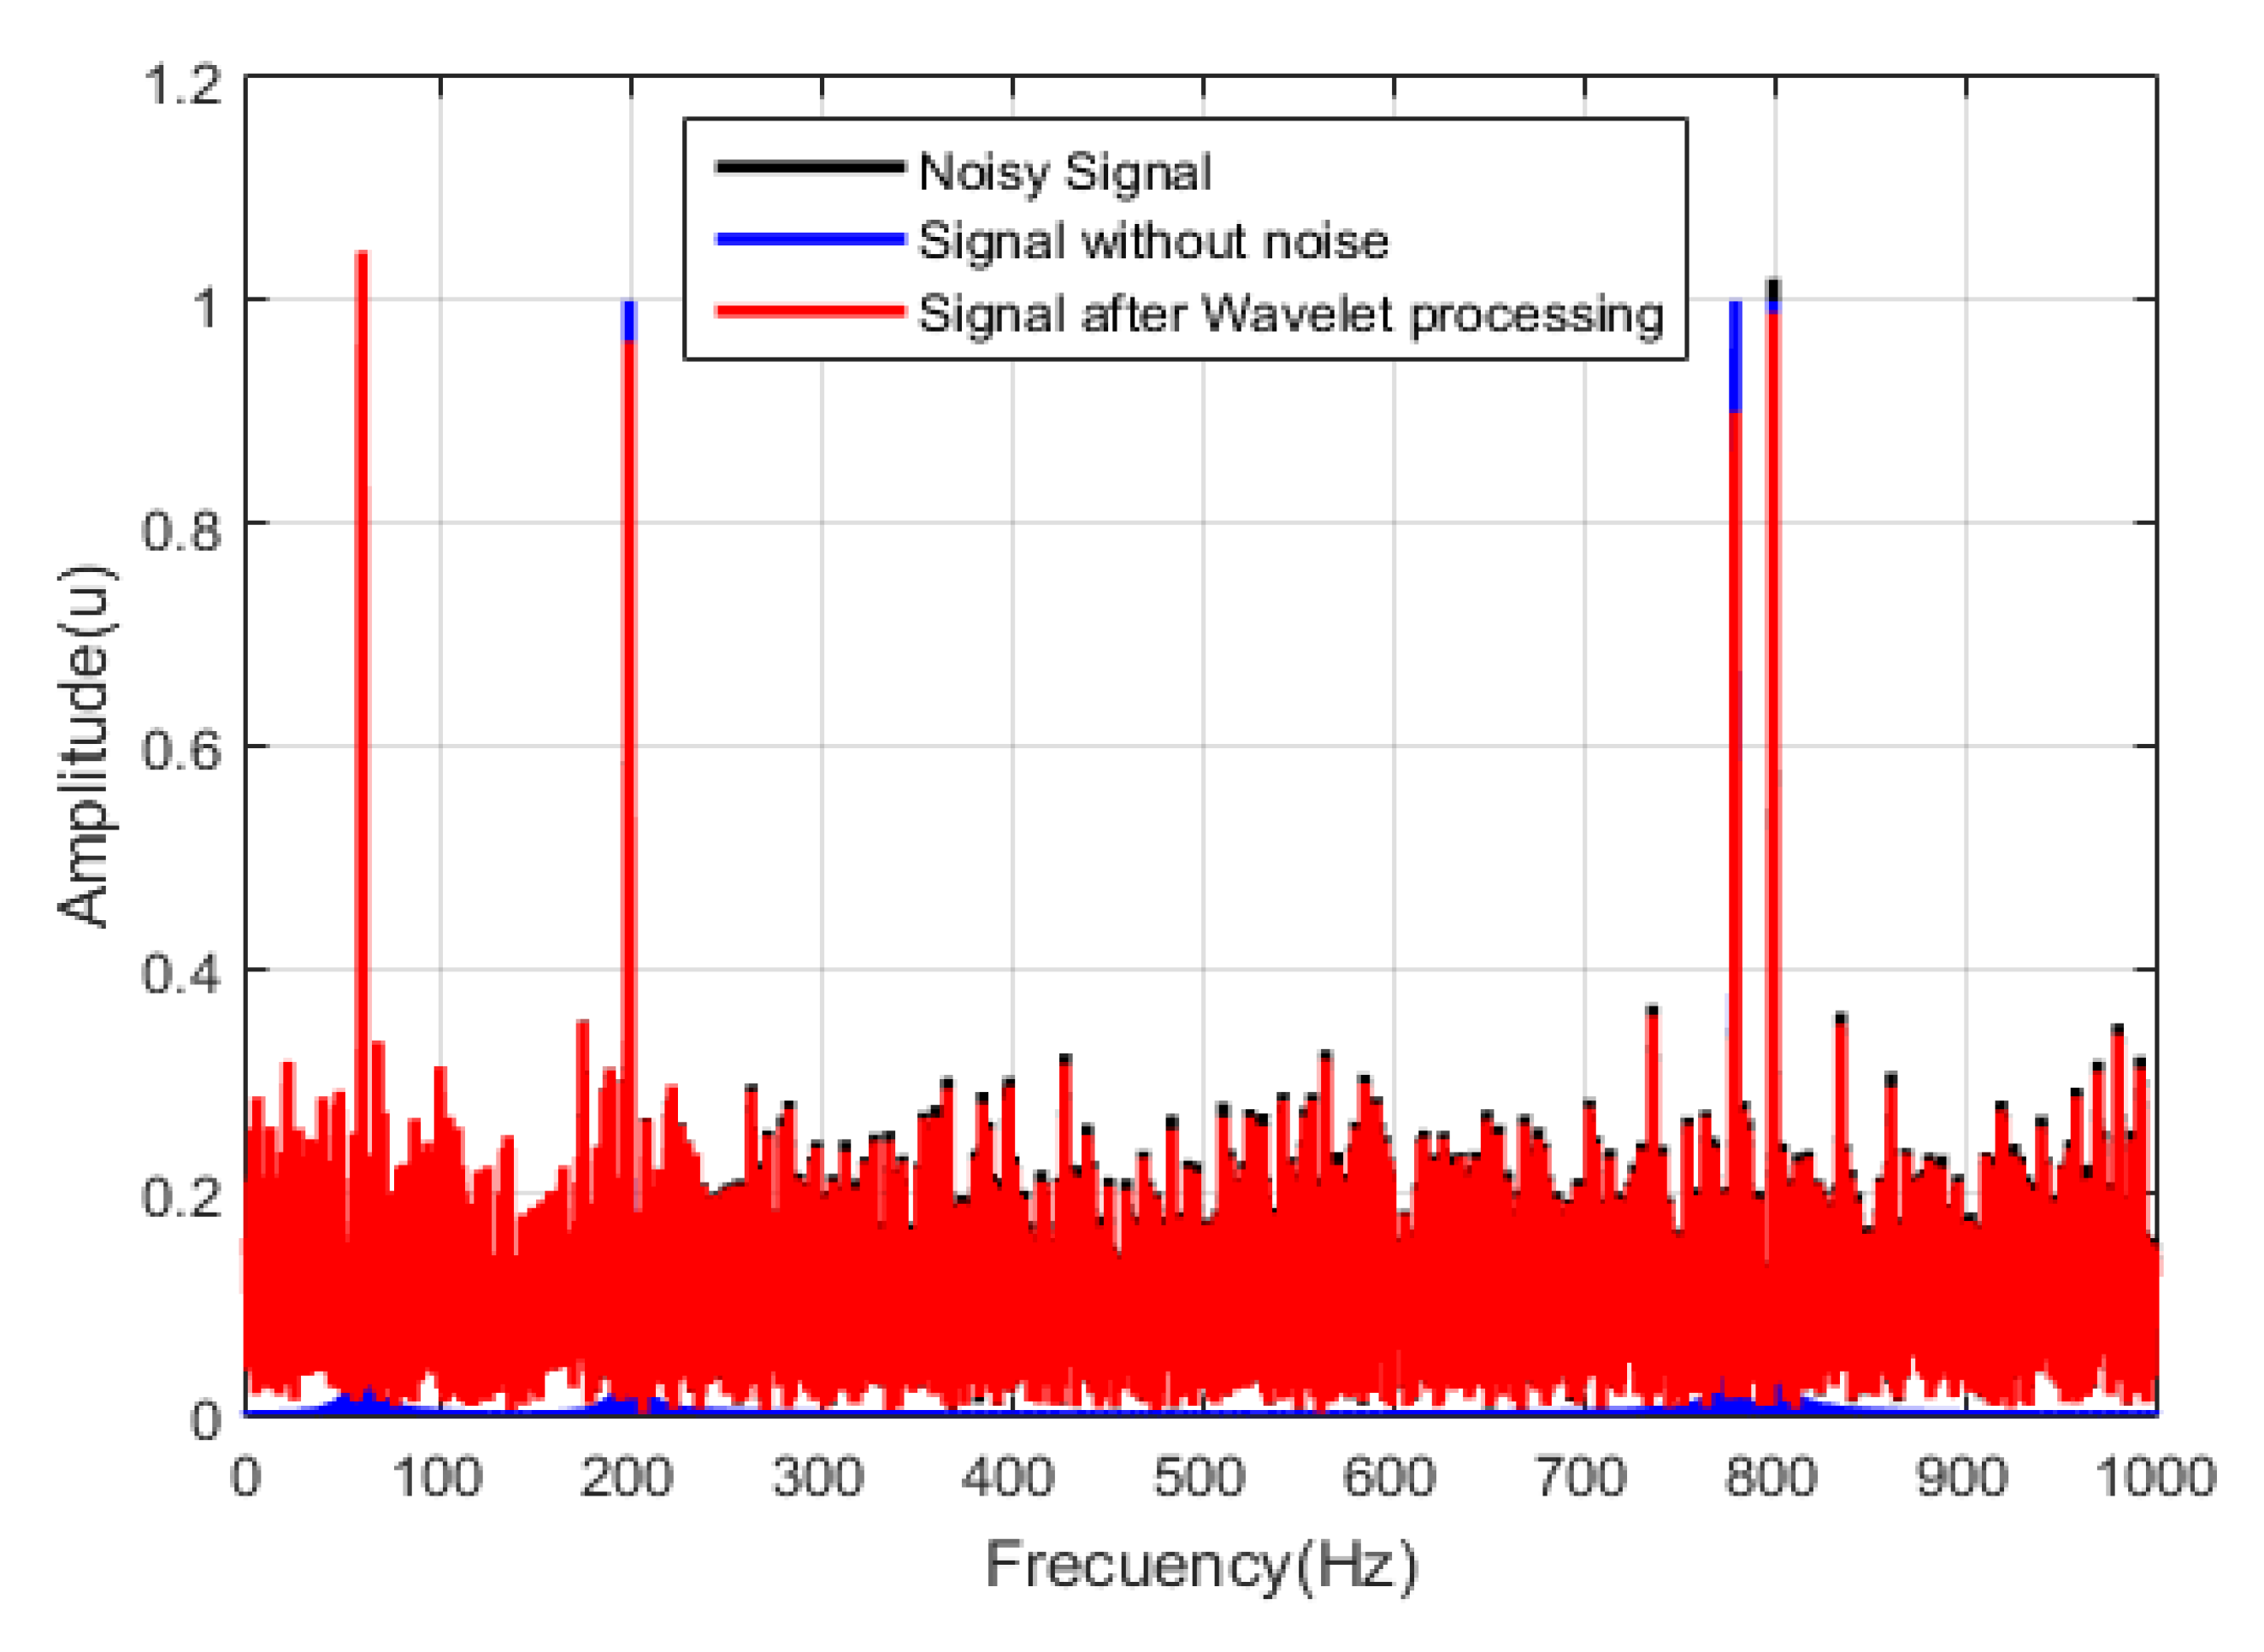
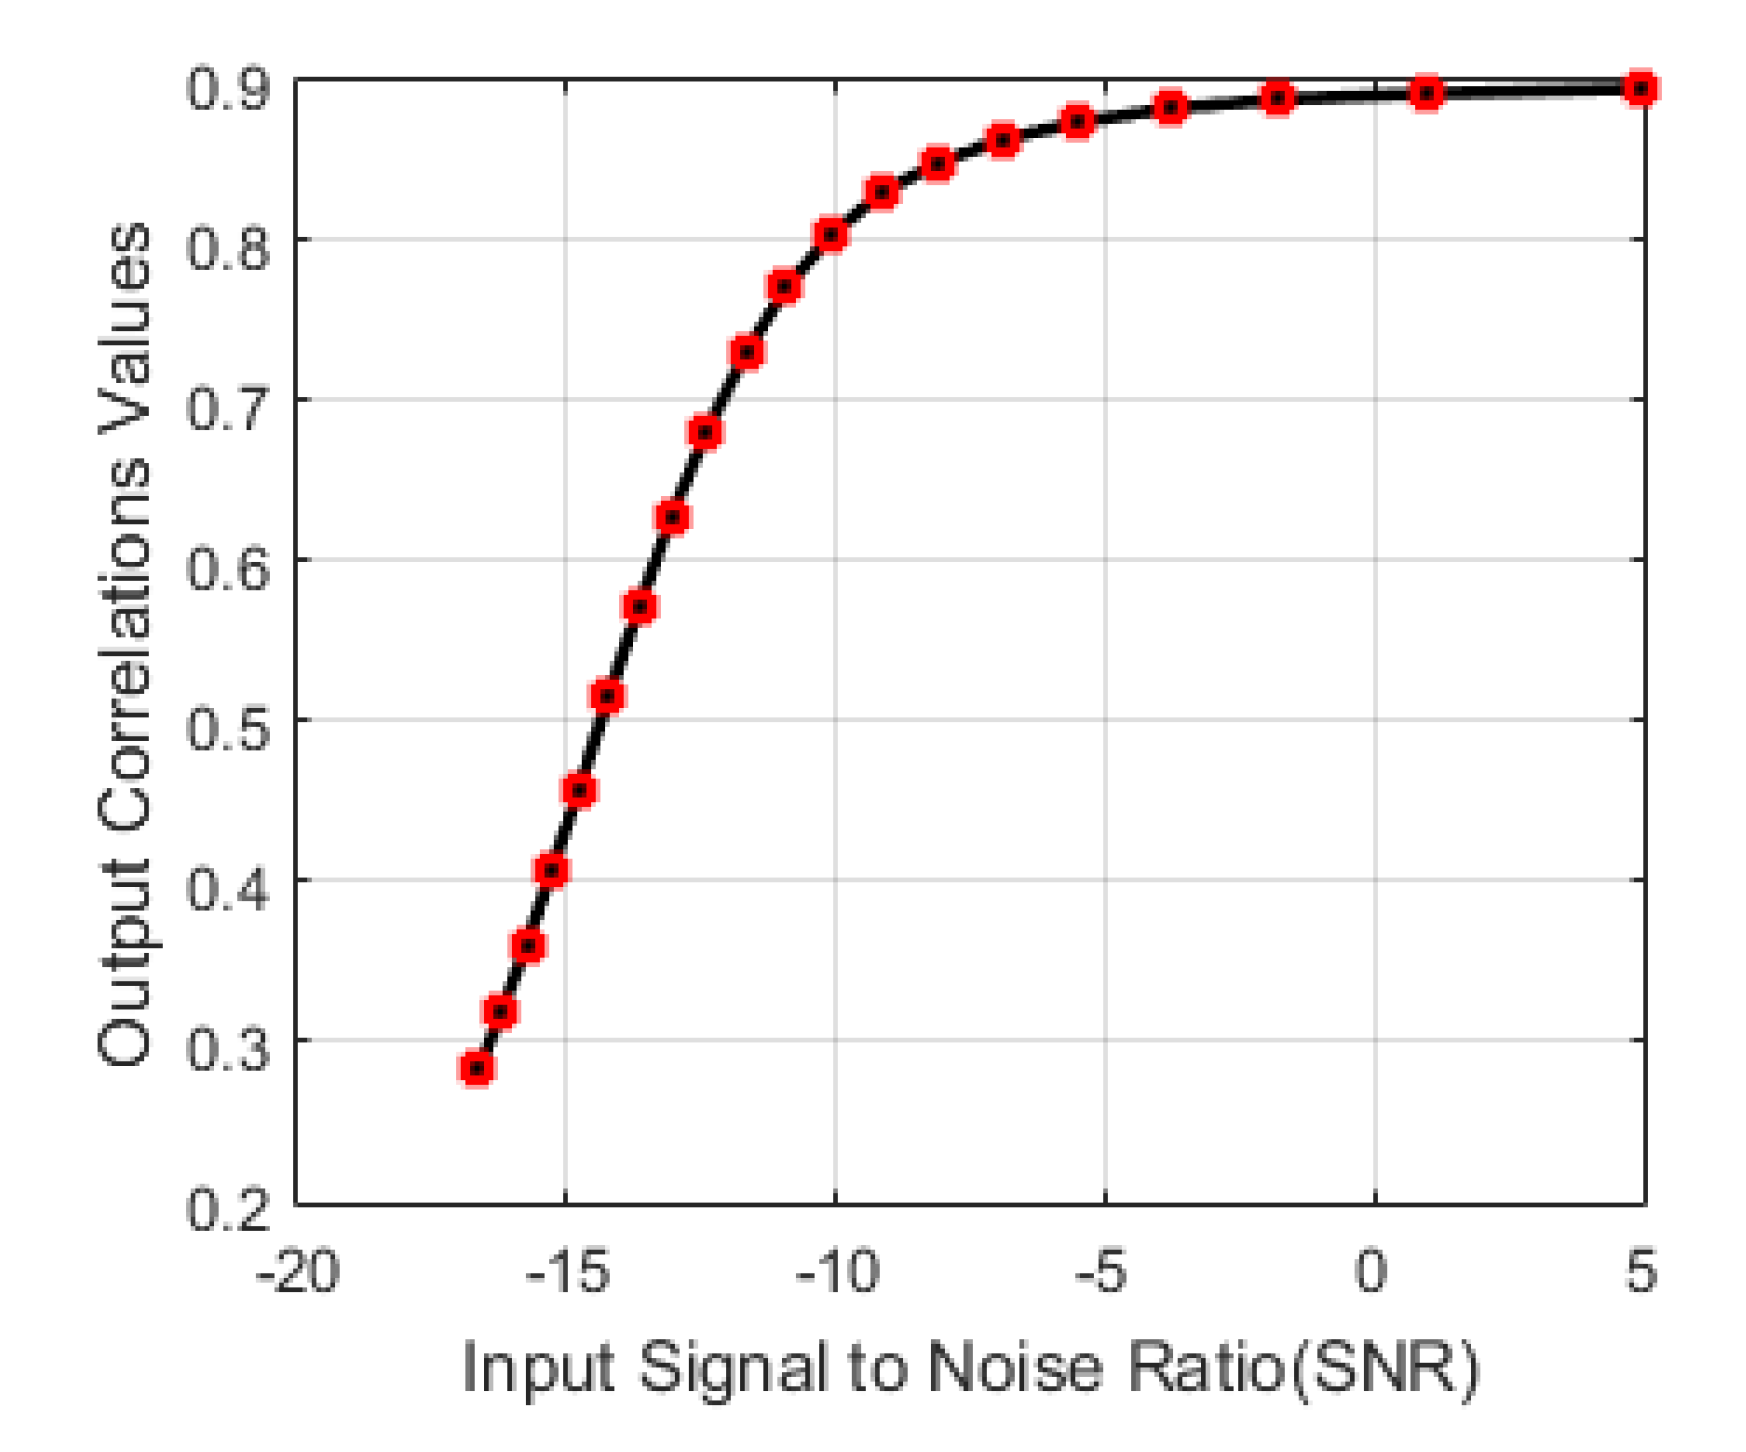
3.1. Comparison and Assessment of the Proposed Noise Reduction Algorithm: Signal-To-Noise Ratio

We first check the robustness of the proposed algorithm in environments with a variable signal-to-noise ratio. To this end, we compare it with the algorithm proposed in [5]. This works it is based on EMD, which is a non-stationary and non-linear time series analysis method. The method decomposes the series into vectors or intrinsic functions, which are obtained, by decomposing the main function [50,51].
Several decomposition modes were used to obtain the desired spectral components, as shown in [5], see Figure 1 and Table 1. The component at 60 Hz was obtained there with the fifth decomposition mode IMF 5. In the experiments carried out here, we use similar signals (a signal based on four harmonics with frequencies of 60 Hz, 200 Hz, 780 Hz, and 800 Hz, respectively) and similar values of signal-to-noise ratio (−10.9172 dB). The initial correlation value with respect to the harmonic signal without noise was 0.1756, and the final correlation value after processing using the proposed noise reduction algorithm was of 0.7717.
A signal decomposition can bring disadvantages with respect to a method based only on the extraction of statistical characteristics from the signal, since a priori we do not know how many levels of decomposition a deterministic harmonic signal immersed in a random signal can have and neither do we know if each harmonic will have the same decomposition levels.
In the case of the method proposed in [23], various levels of decomposition were used for each harmonic contained in the useful signal. However, the algorithm proposed in our work processes the harmonic signal in its entirety independent of its noise content. Figure 4 and Figure 5 show the signal without noise and the spectrum of the signal contaminated with noise.
In turn, Figure 6 shows a comparison of the result once the harmonic signal taken as a sample has been processed. This permits us to test the influence of the signal–to-noise ratio in the proposed algorithm.
In Figure 6, it can be observed that after processing, the desired spectral components are visible and the noise was reduced. Moreover, with our proposed algorithm, the use of a signal decomposition mode is not necessary, unlike the algorithm proposed in [23]. It only needs the amplitude, frequency, and phase of the input signal.
As can be seen in Figure 6, the amplitude of the signal at the output is affected during the noise-reduction process, and even more if it has a low SNR ratio at the input. However, the amplitude adjustment process can be improved by applying the result shown in Equation (3) as a non-linear amplitude adjustment factor.
Since the statistical characteristics are based on the expected value operator (continuous model), and in practice a finite value of samples is used, the results will be more similar in amplitude if the number of samples to be processed increases (see Figure 7). In addition, the SNR ratio at the input also influences since the method significantly reduces noise, but at the output there are always samples of residual noise that is not eliminated and influence the amplitude of the signal.
In relation to other classic noise reduction methods for the same experimental case and using the same harmonic signal, a wavelet-based method was used. This method uses soft heuristic Stein’s unbiased risk estimate (SURE) thresholding to obtain the actual threshold, to reduce noise. Table 2 summarizes the results obtained in comparing the proposed method with that based on wavelets.
As can be seen in Table 2, one of the most significant disadvantages of wavelet-based methods is a priori ignorance of the calculation of the noise threshold to be eliminated. This calculation is based on knowing the noise power to reduce the random signal, but in real situations, this parameter is generally unknown An example of application is provided in Figure 8.
In general, the choice of one method or another to reduce noise depends mainly on the experimental situation required to process the information to reduce the random signal. There are different methods, each of which has specific characteristics. The effectiveness of one or the other depends on the characteristics of the process. A combination of methods based on statistical characteristics, as in our case, has the advantage of basing their analysis on the analytical foundations of the random process itself.

3.2. Computational Cost

Likewise, the computational cost is related to the number of samples to be processed, that is, the length of the data window, as well as the number of basic operations, quantified in multiplications and accumulations. Figure 9 shows an estimate of the execution time curve of the entire proposed algorithm, in general, including the noise-reduction process and the fault pattern recognition stage. The execution time increases exponentially as the number of samples to be processed increases. This is mainly due to the multiplication and accumulation processes found in the covariance and convolution operations markedly in the noise-reduction and power spectrum calculation processes.

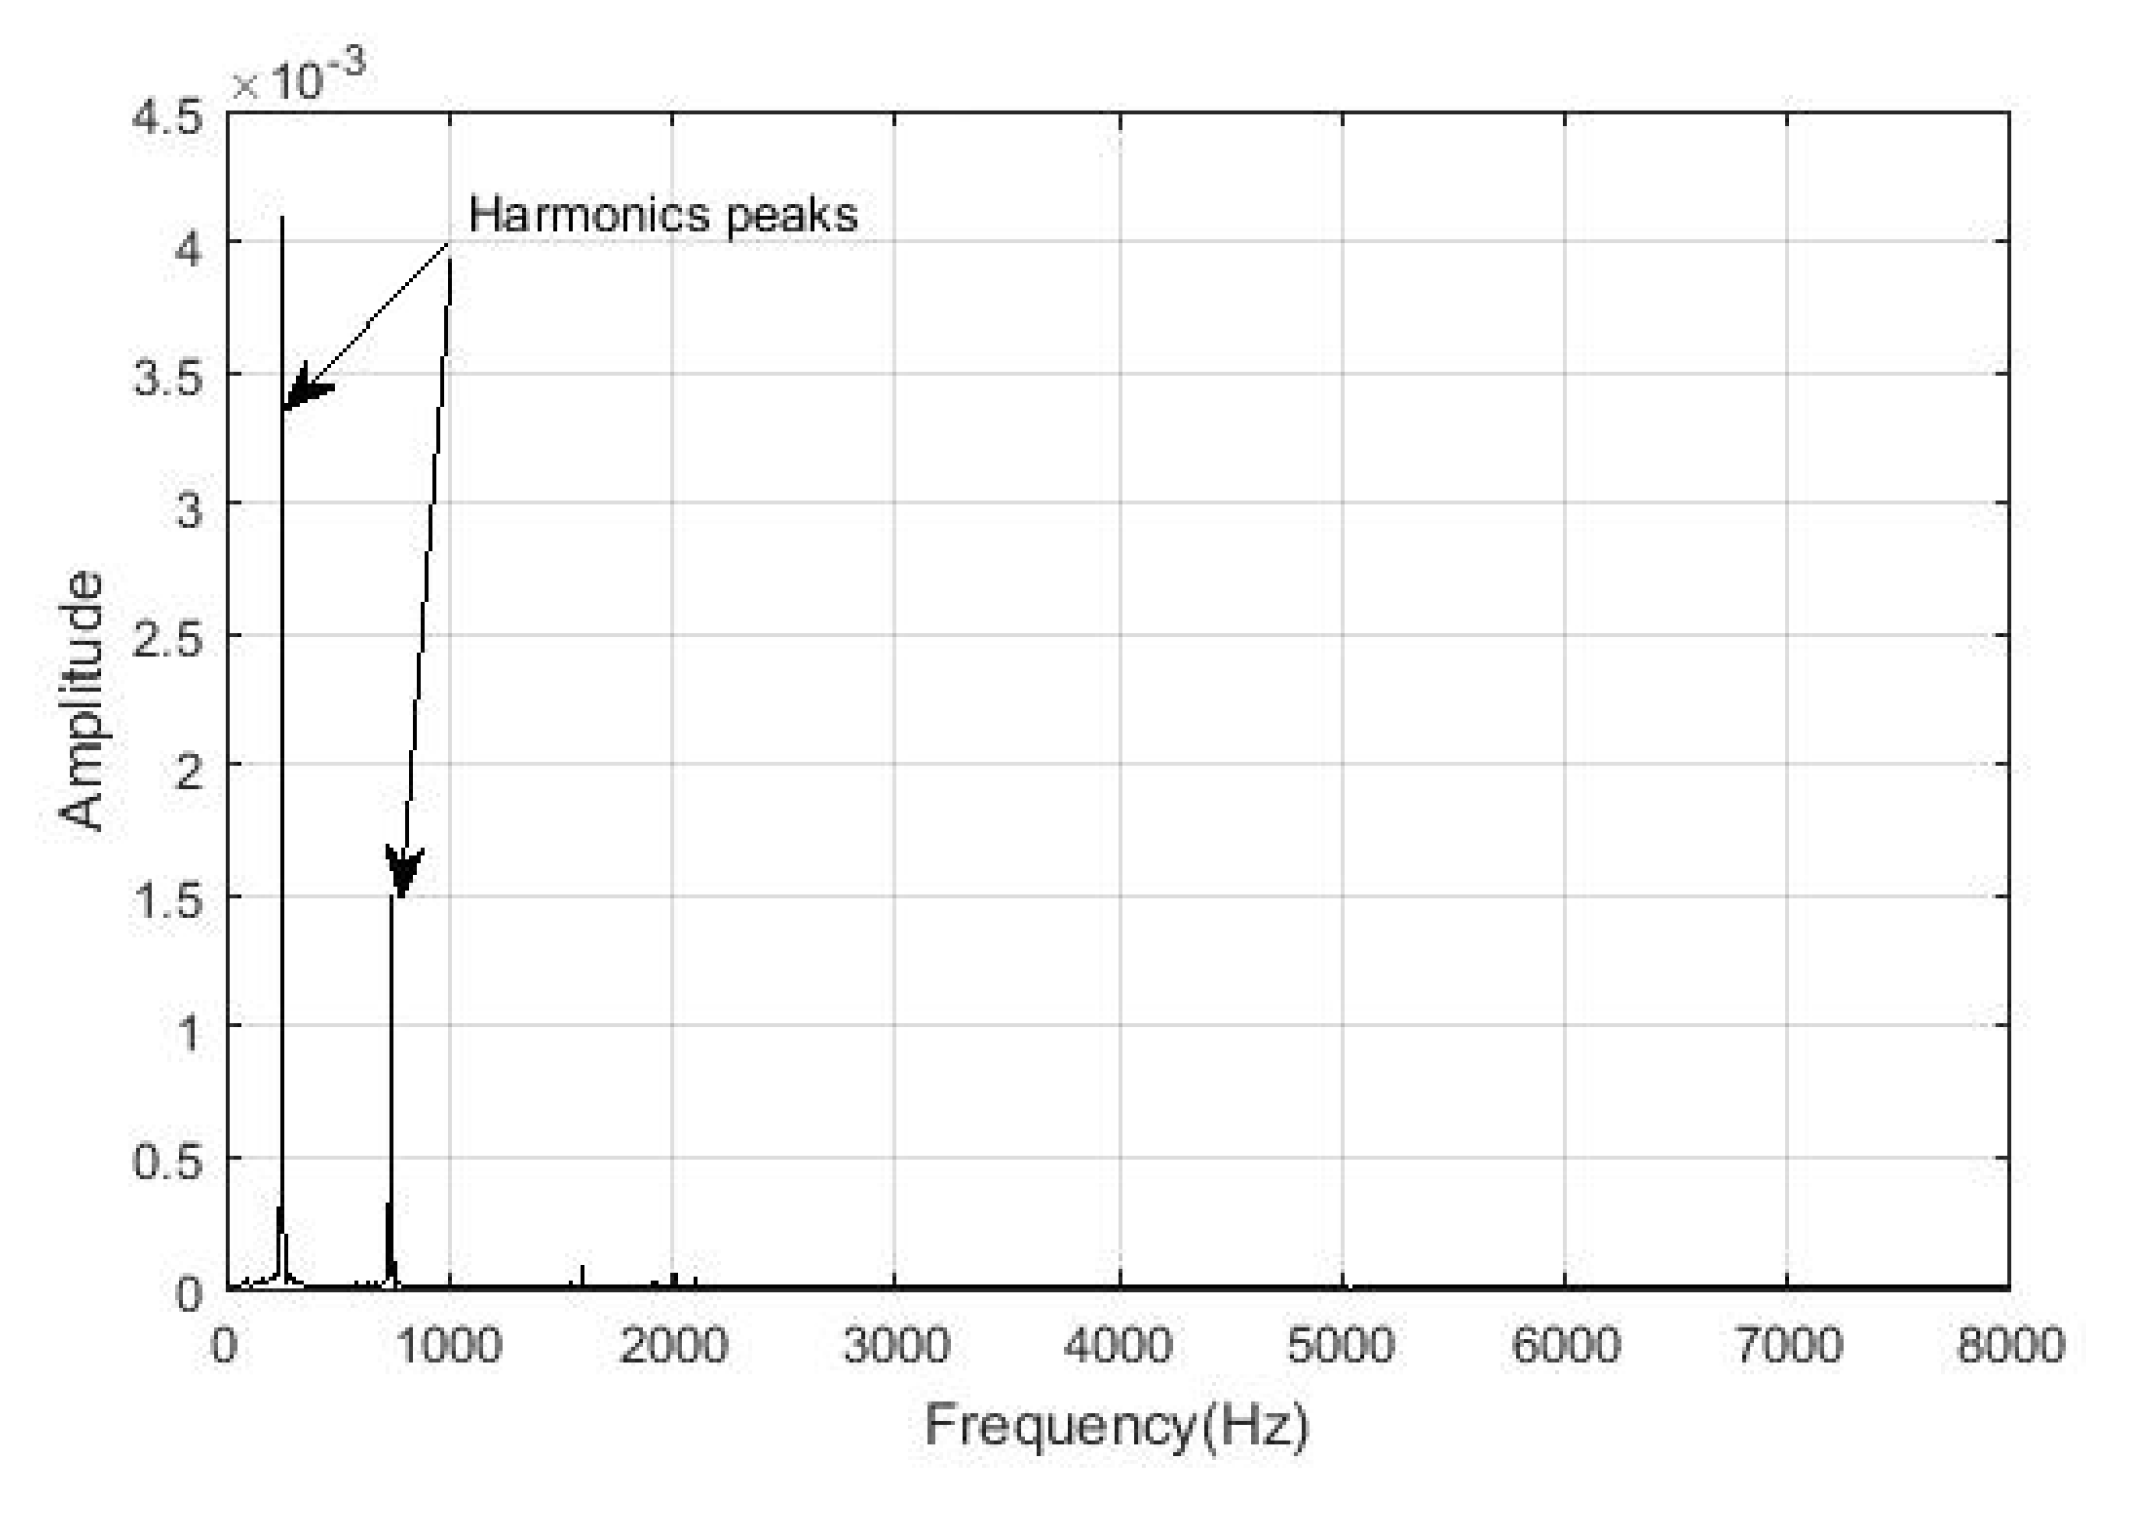
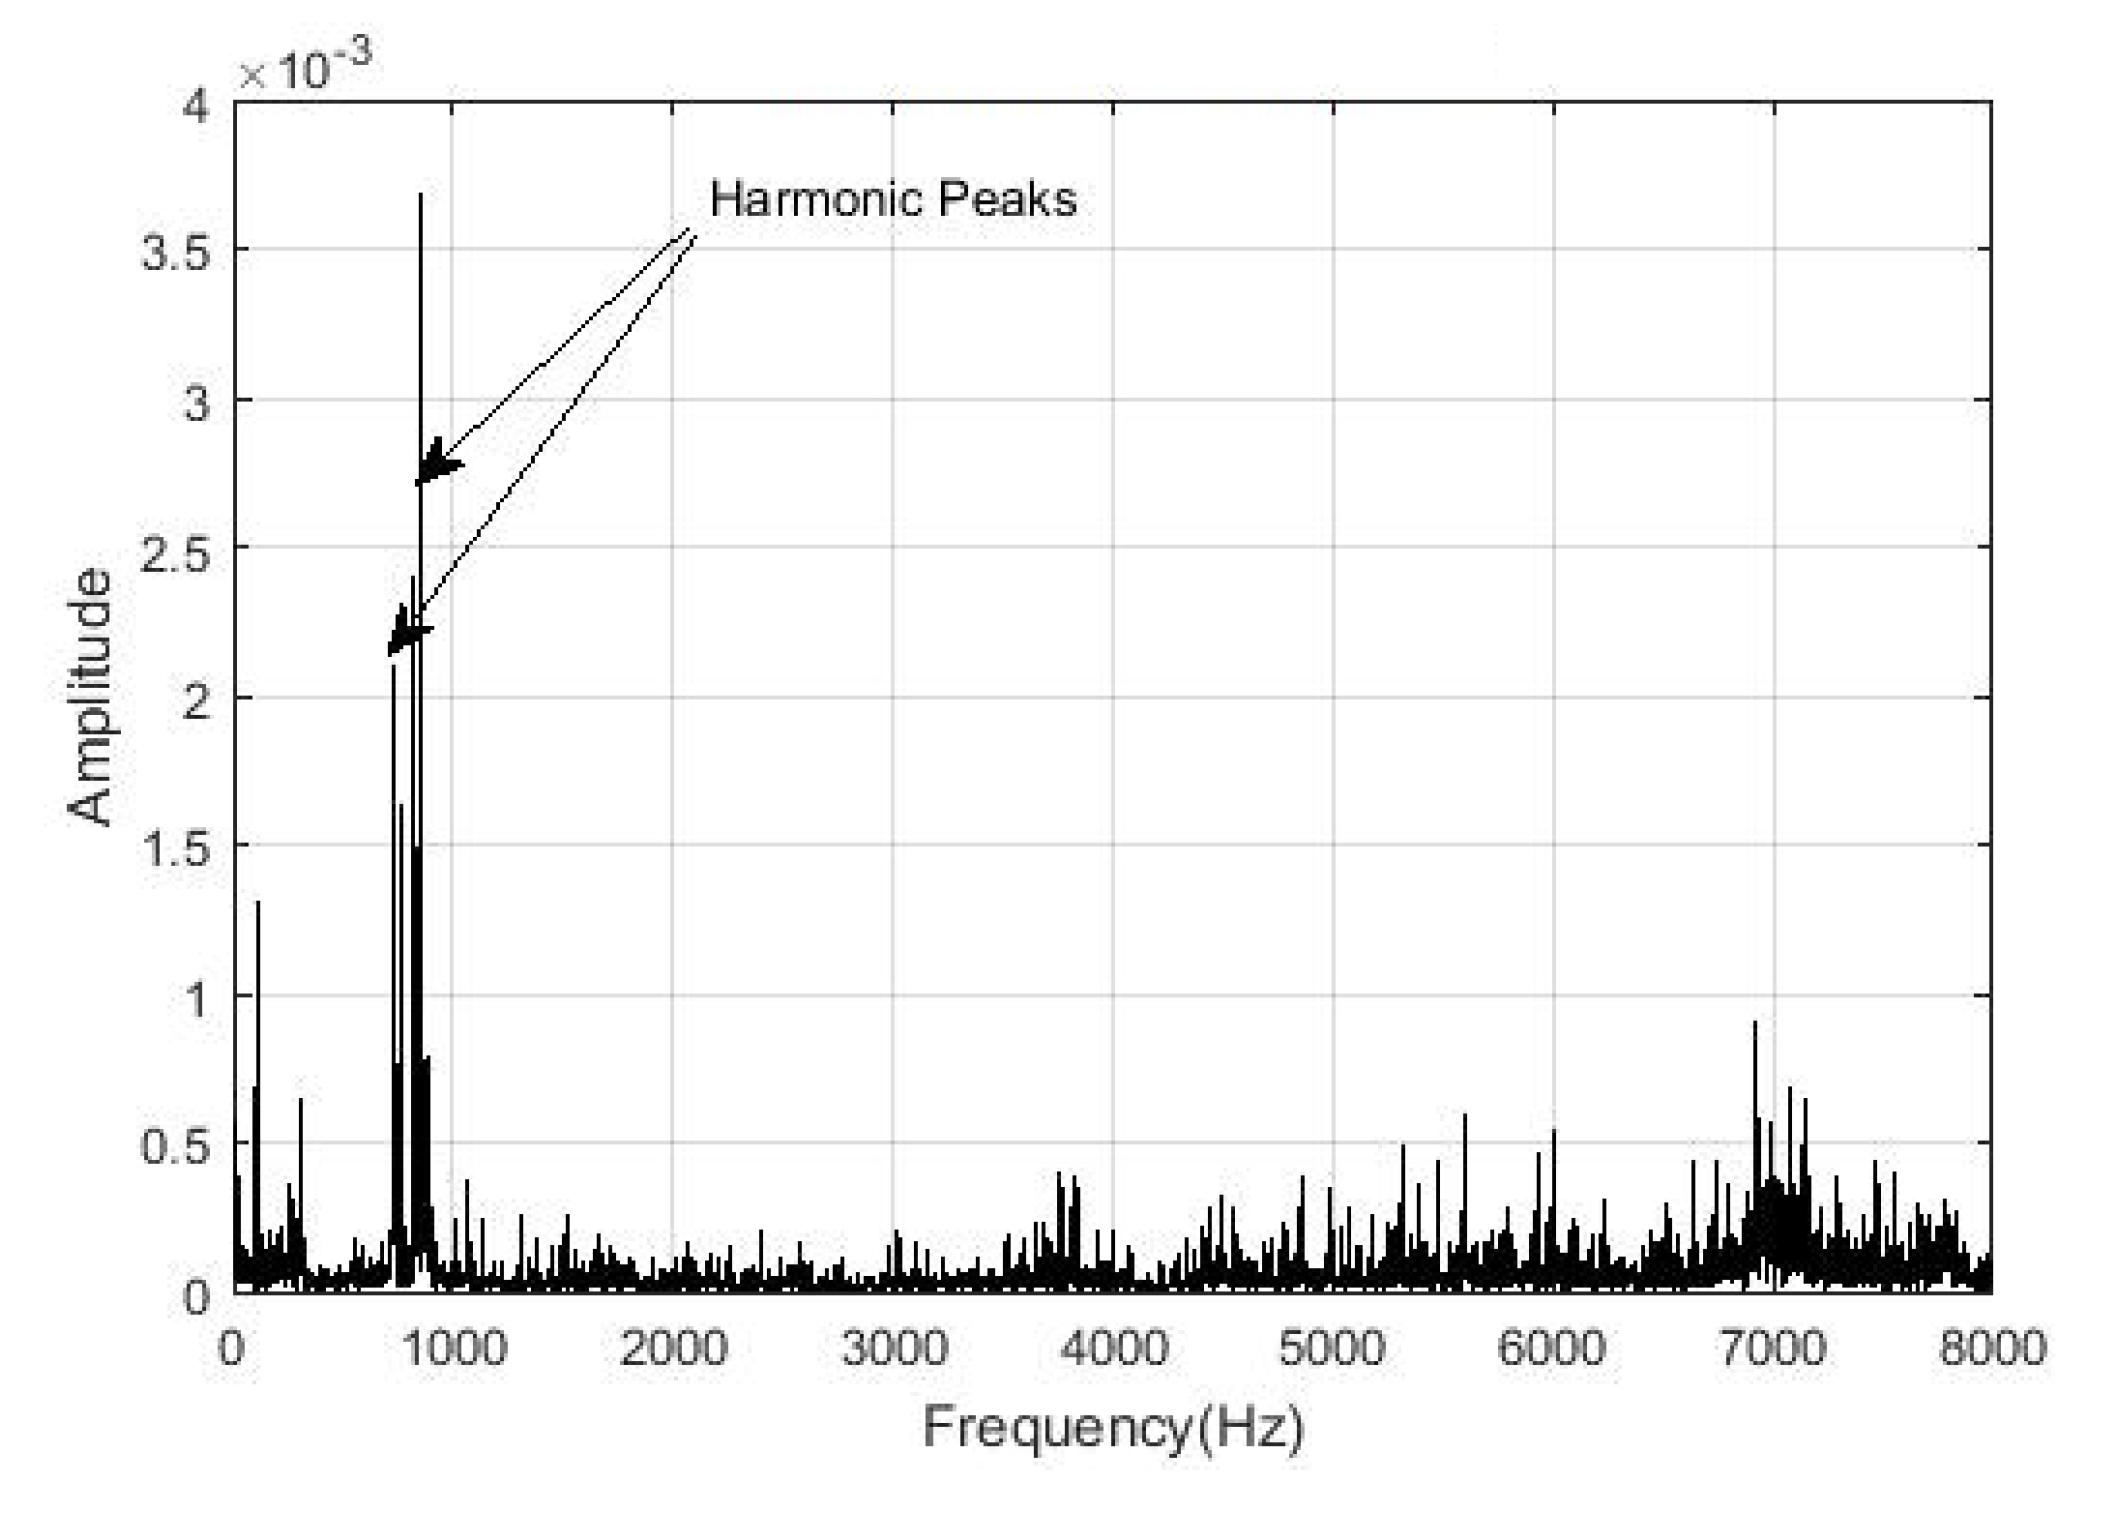
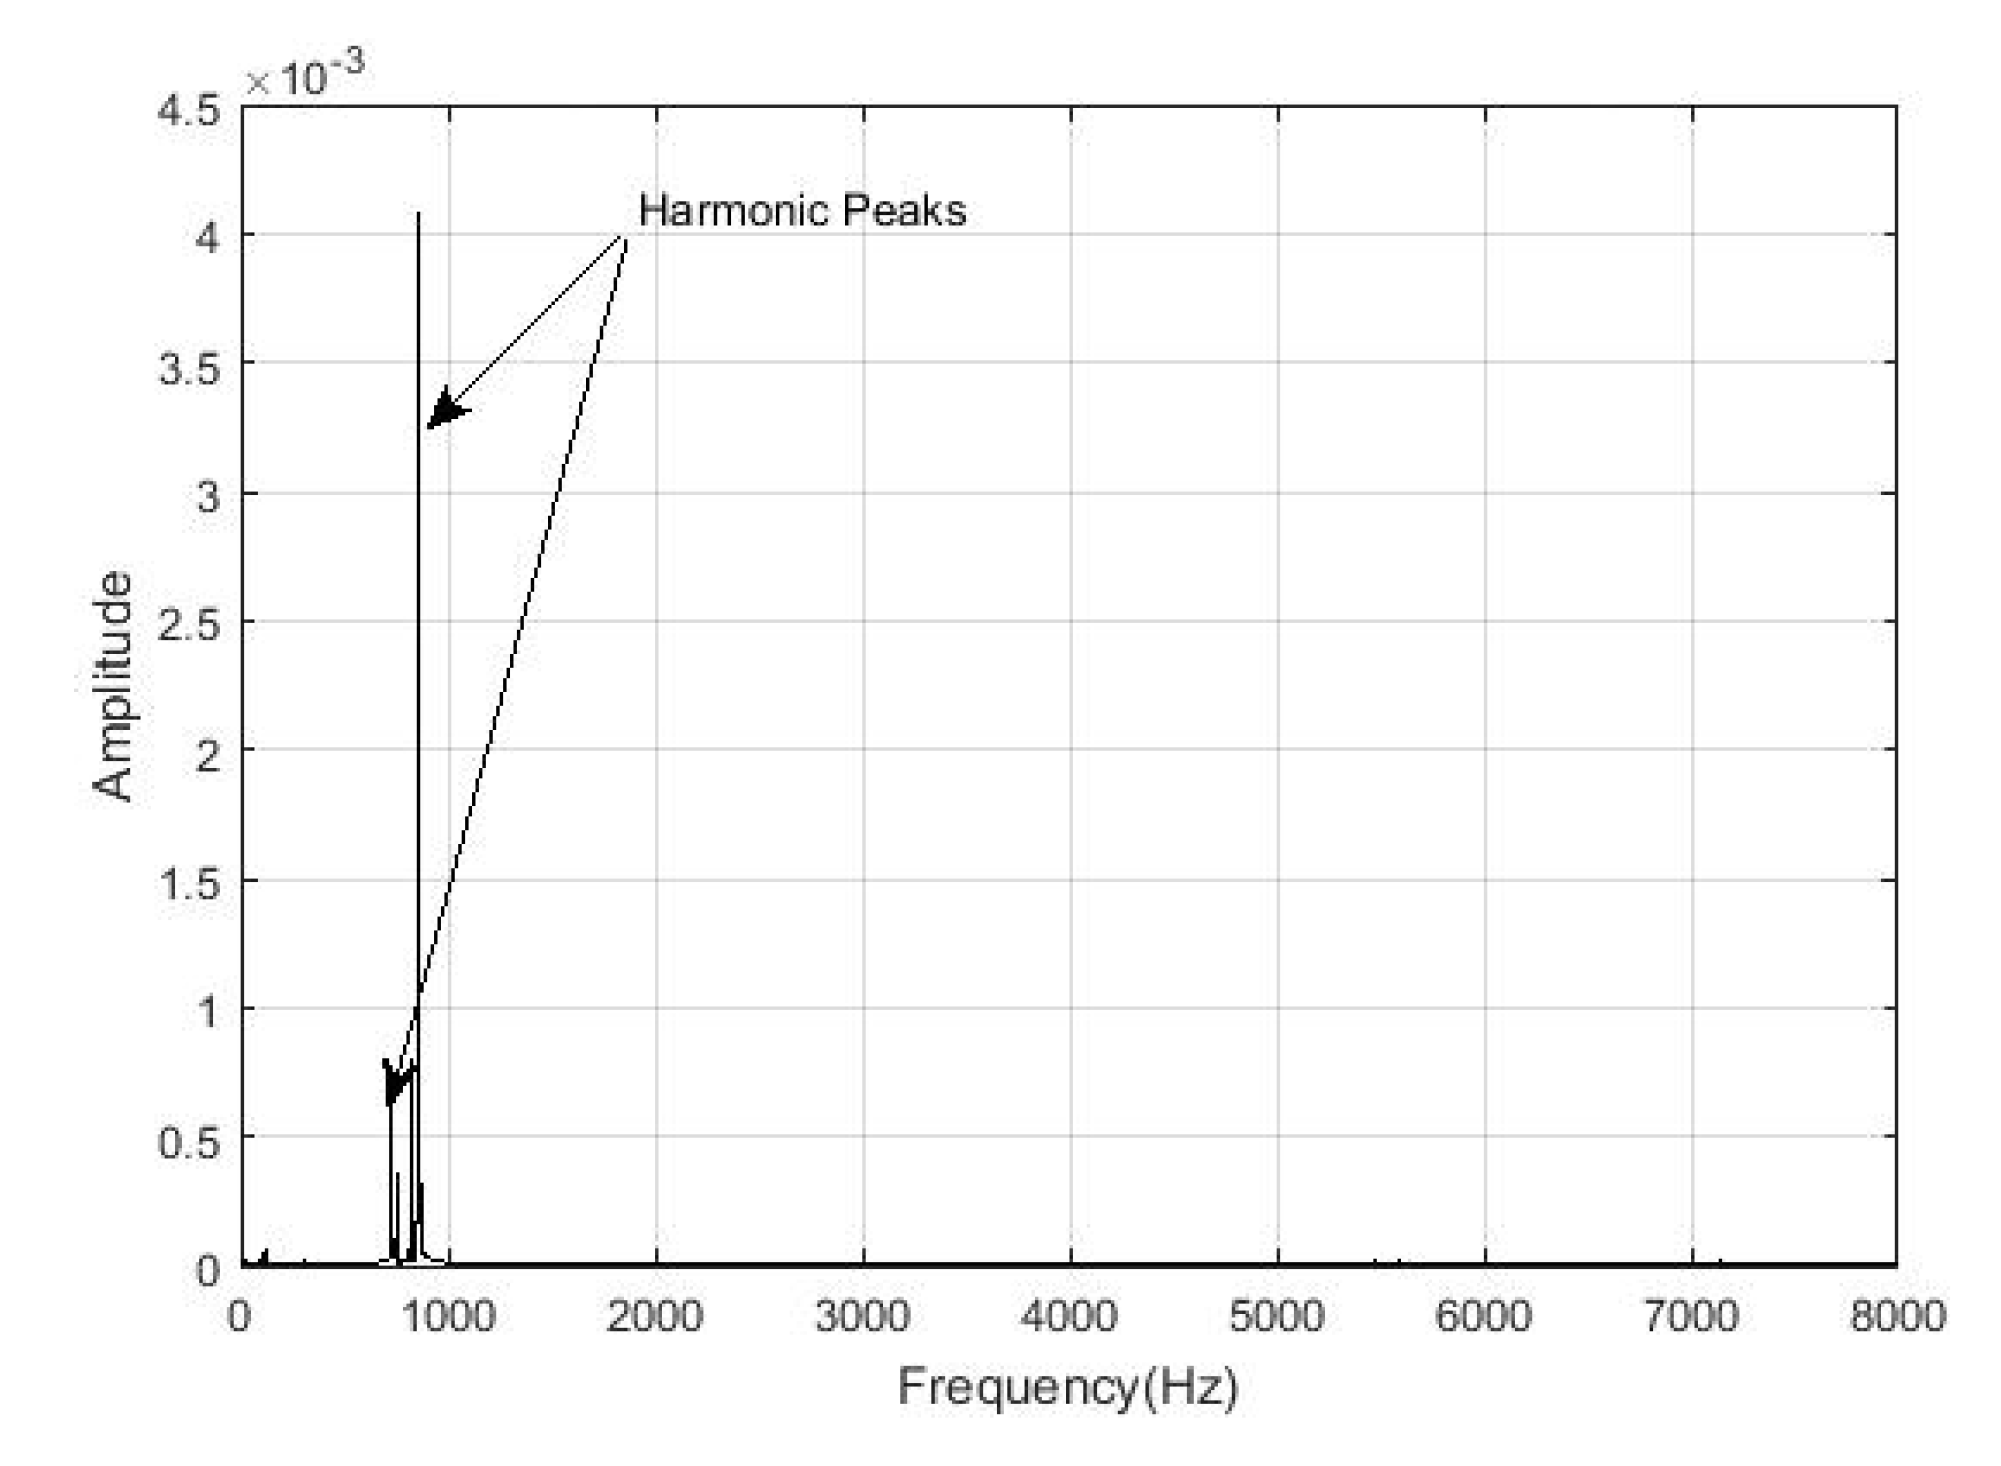
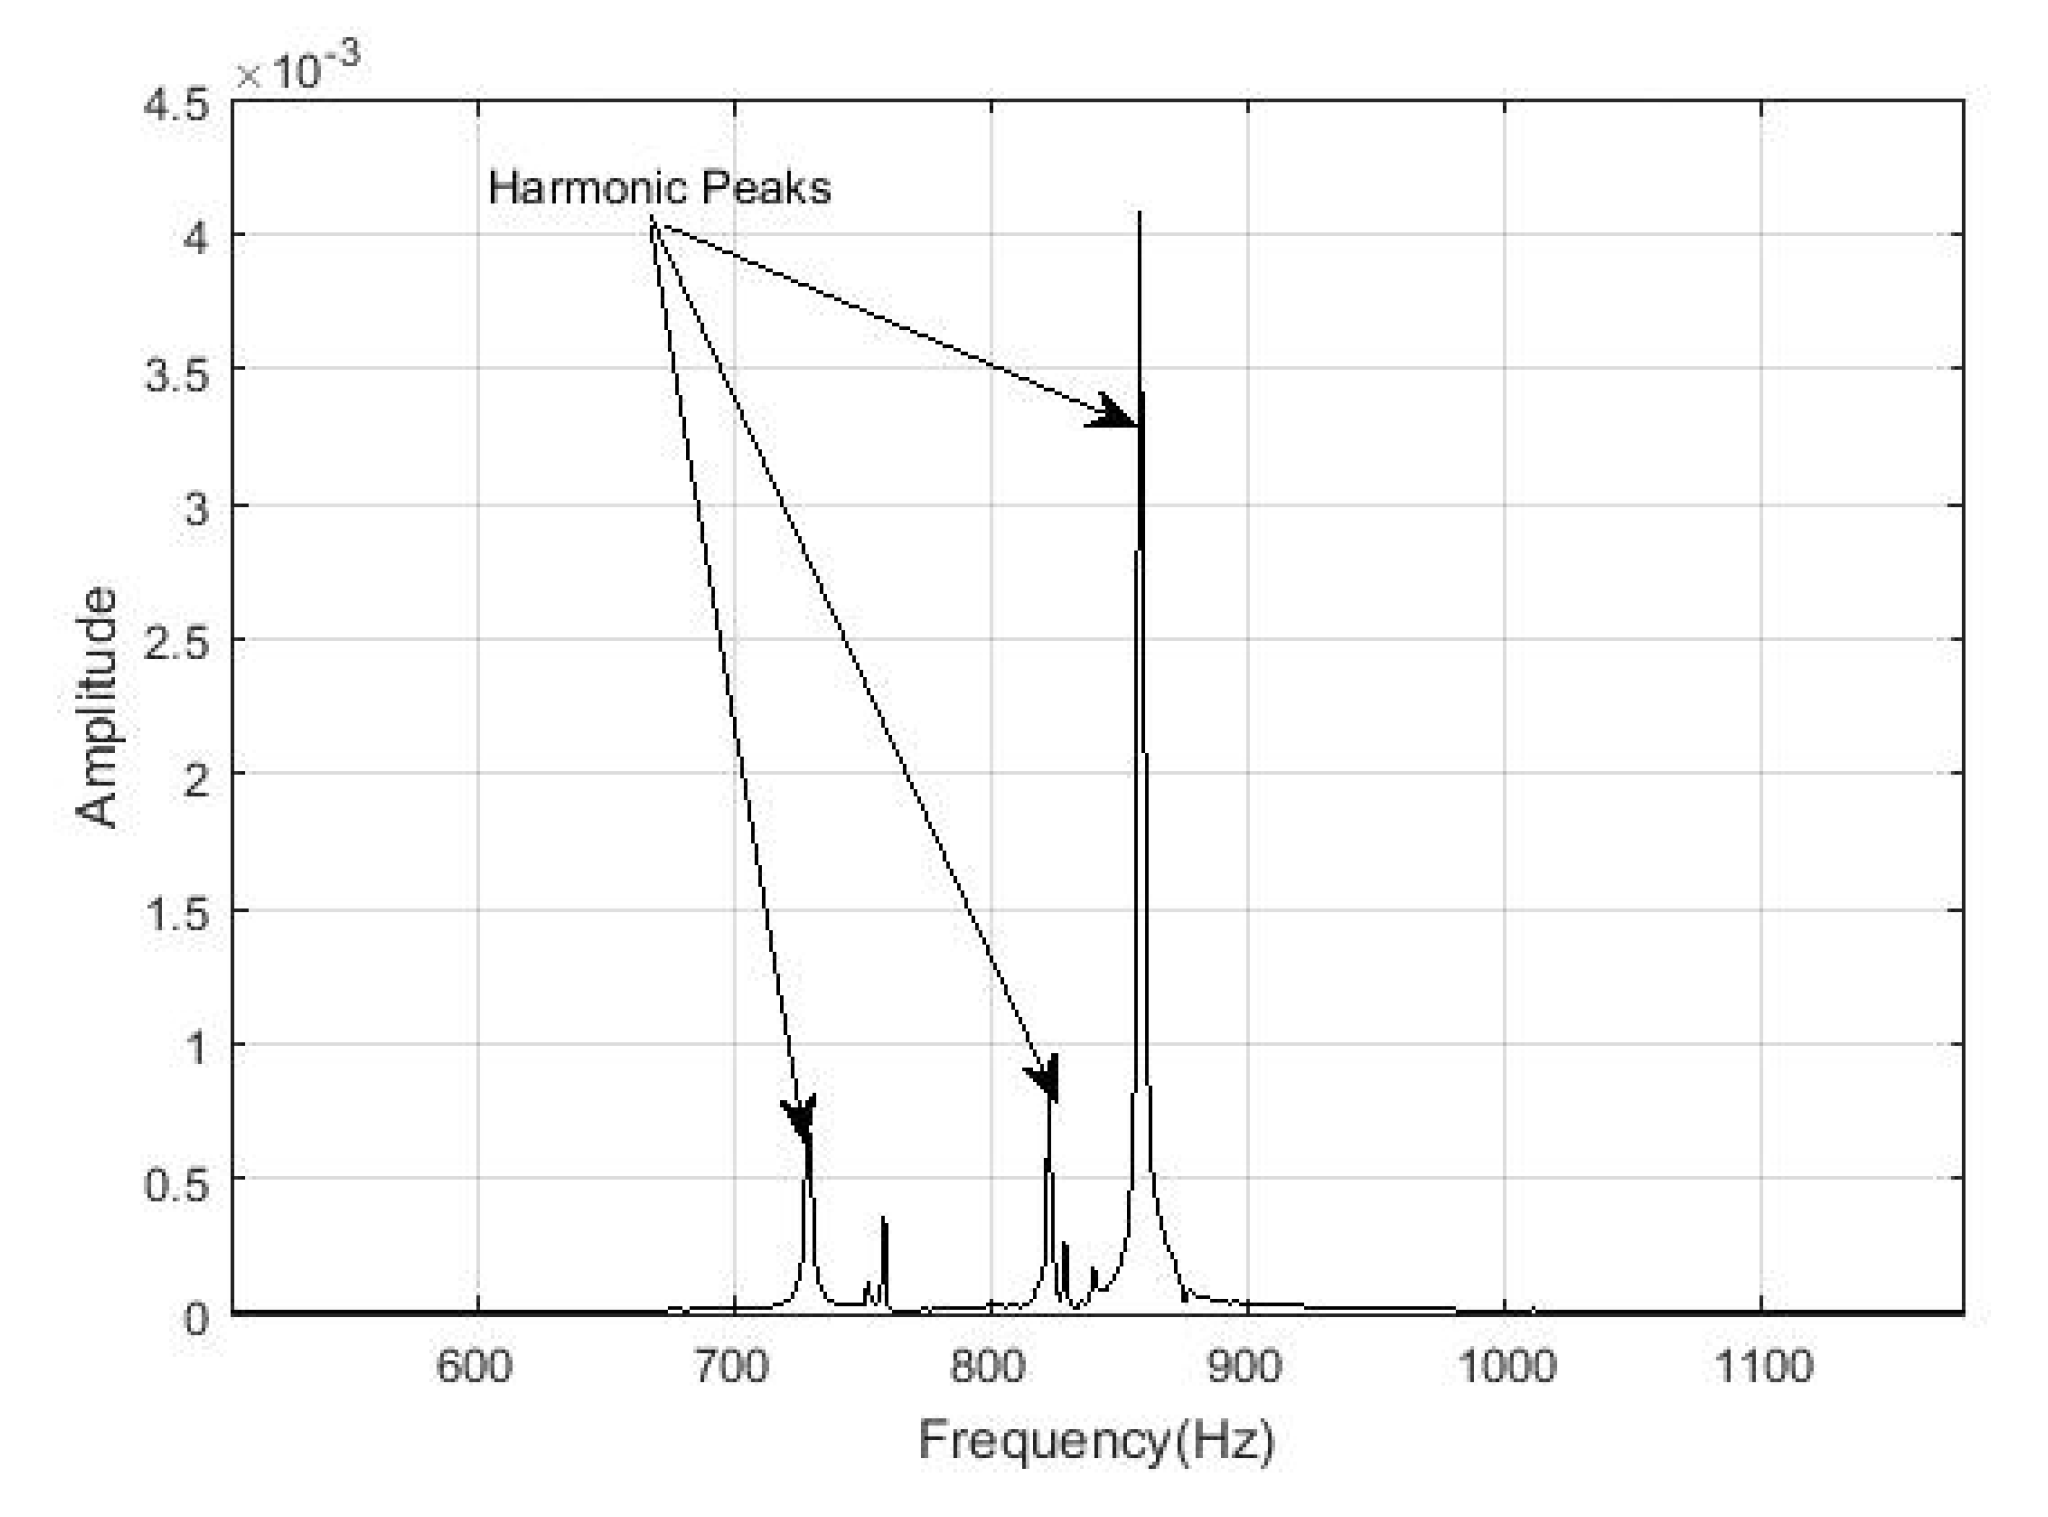
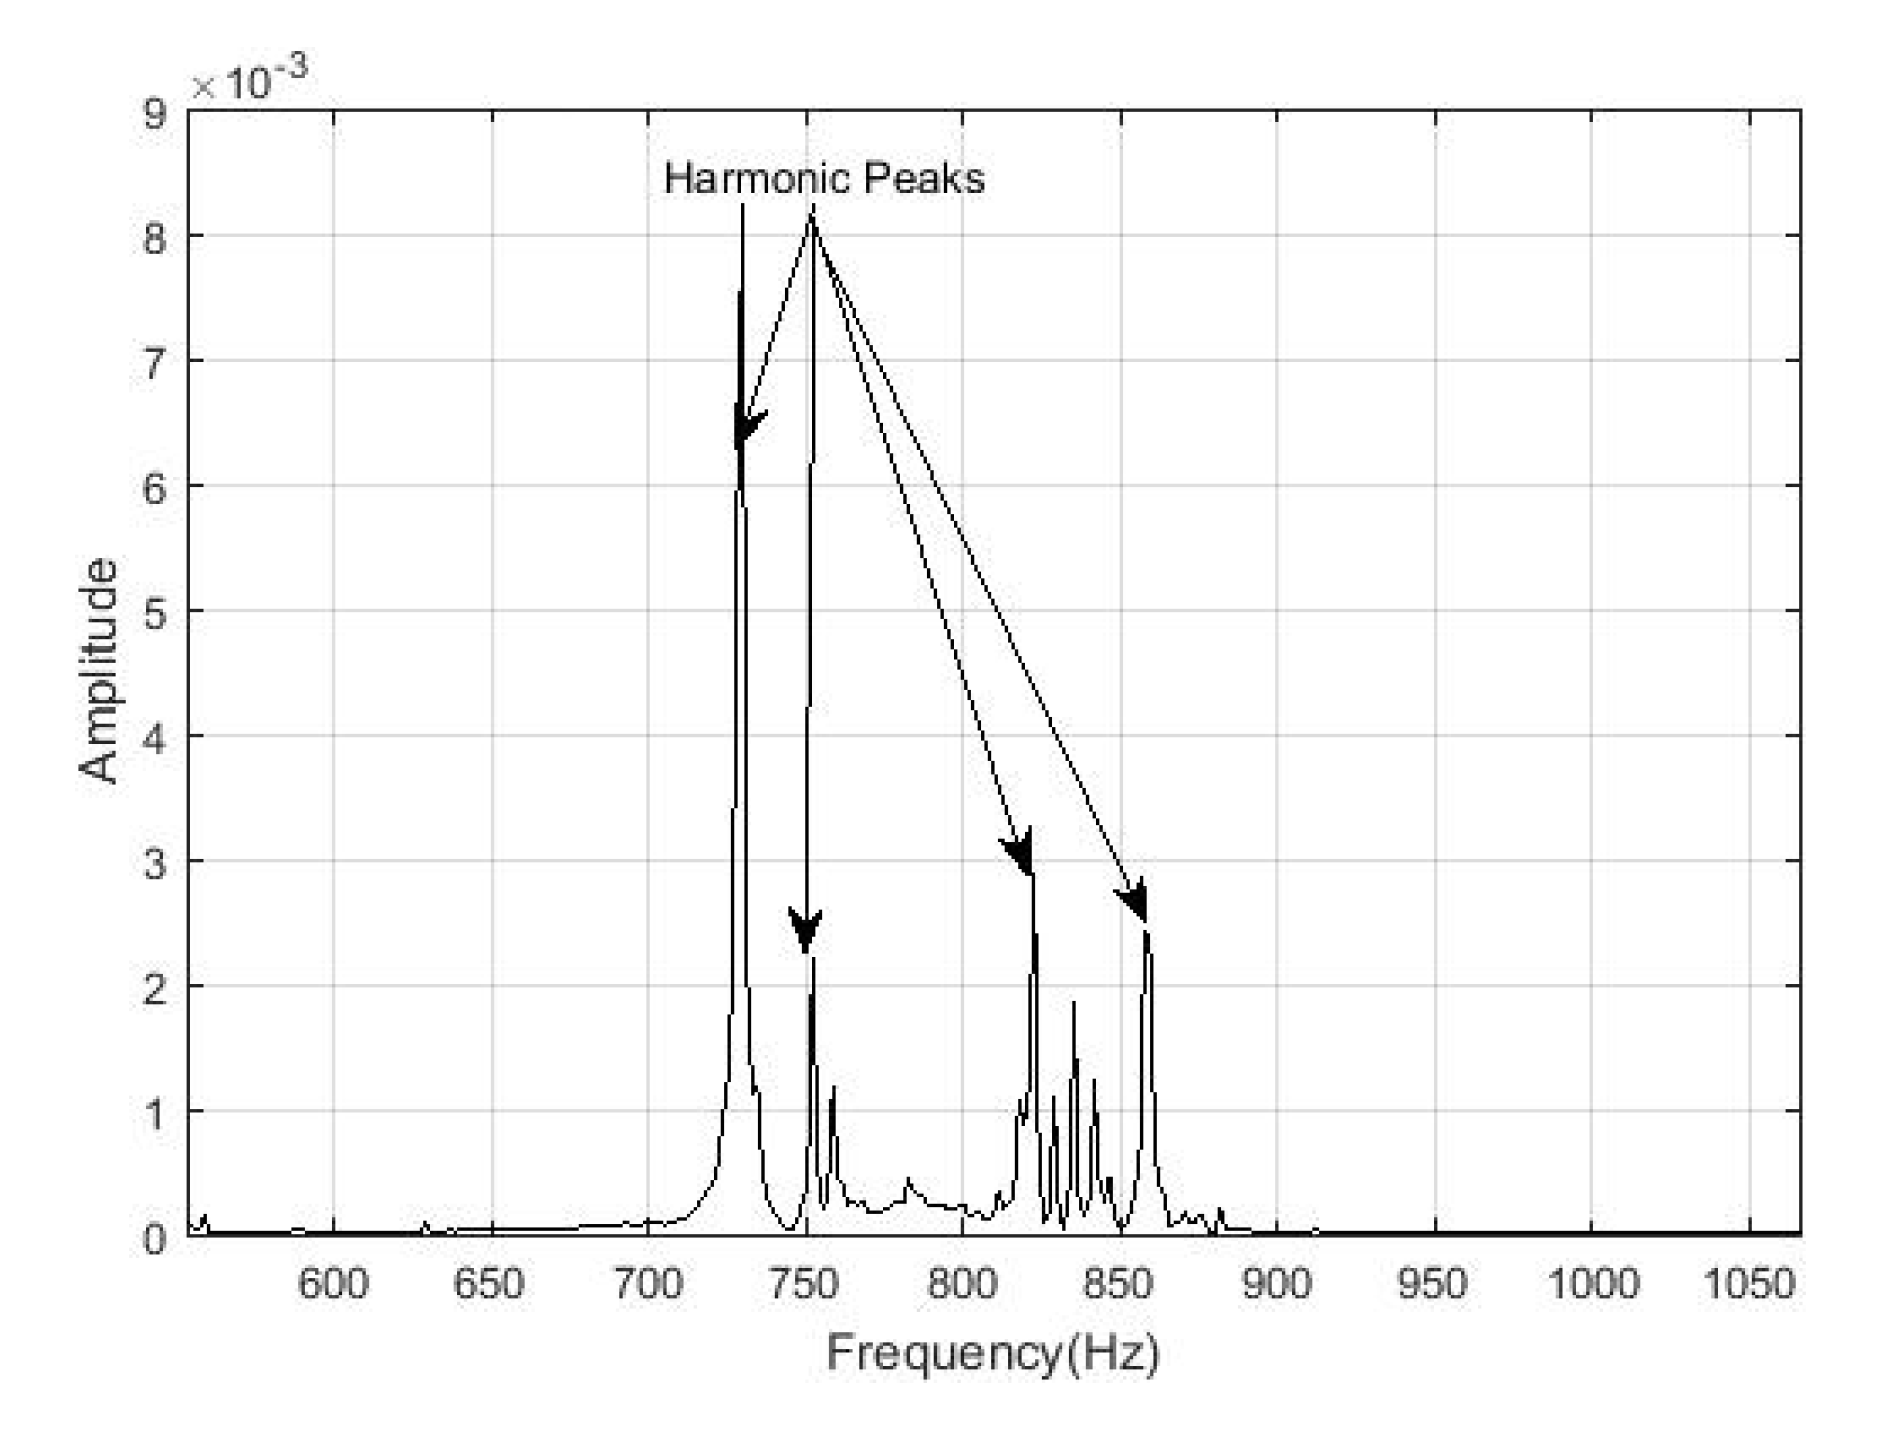
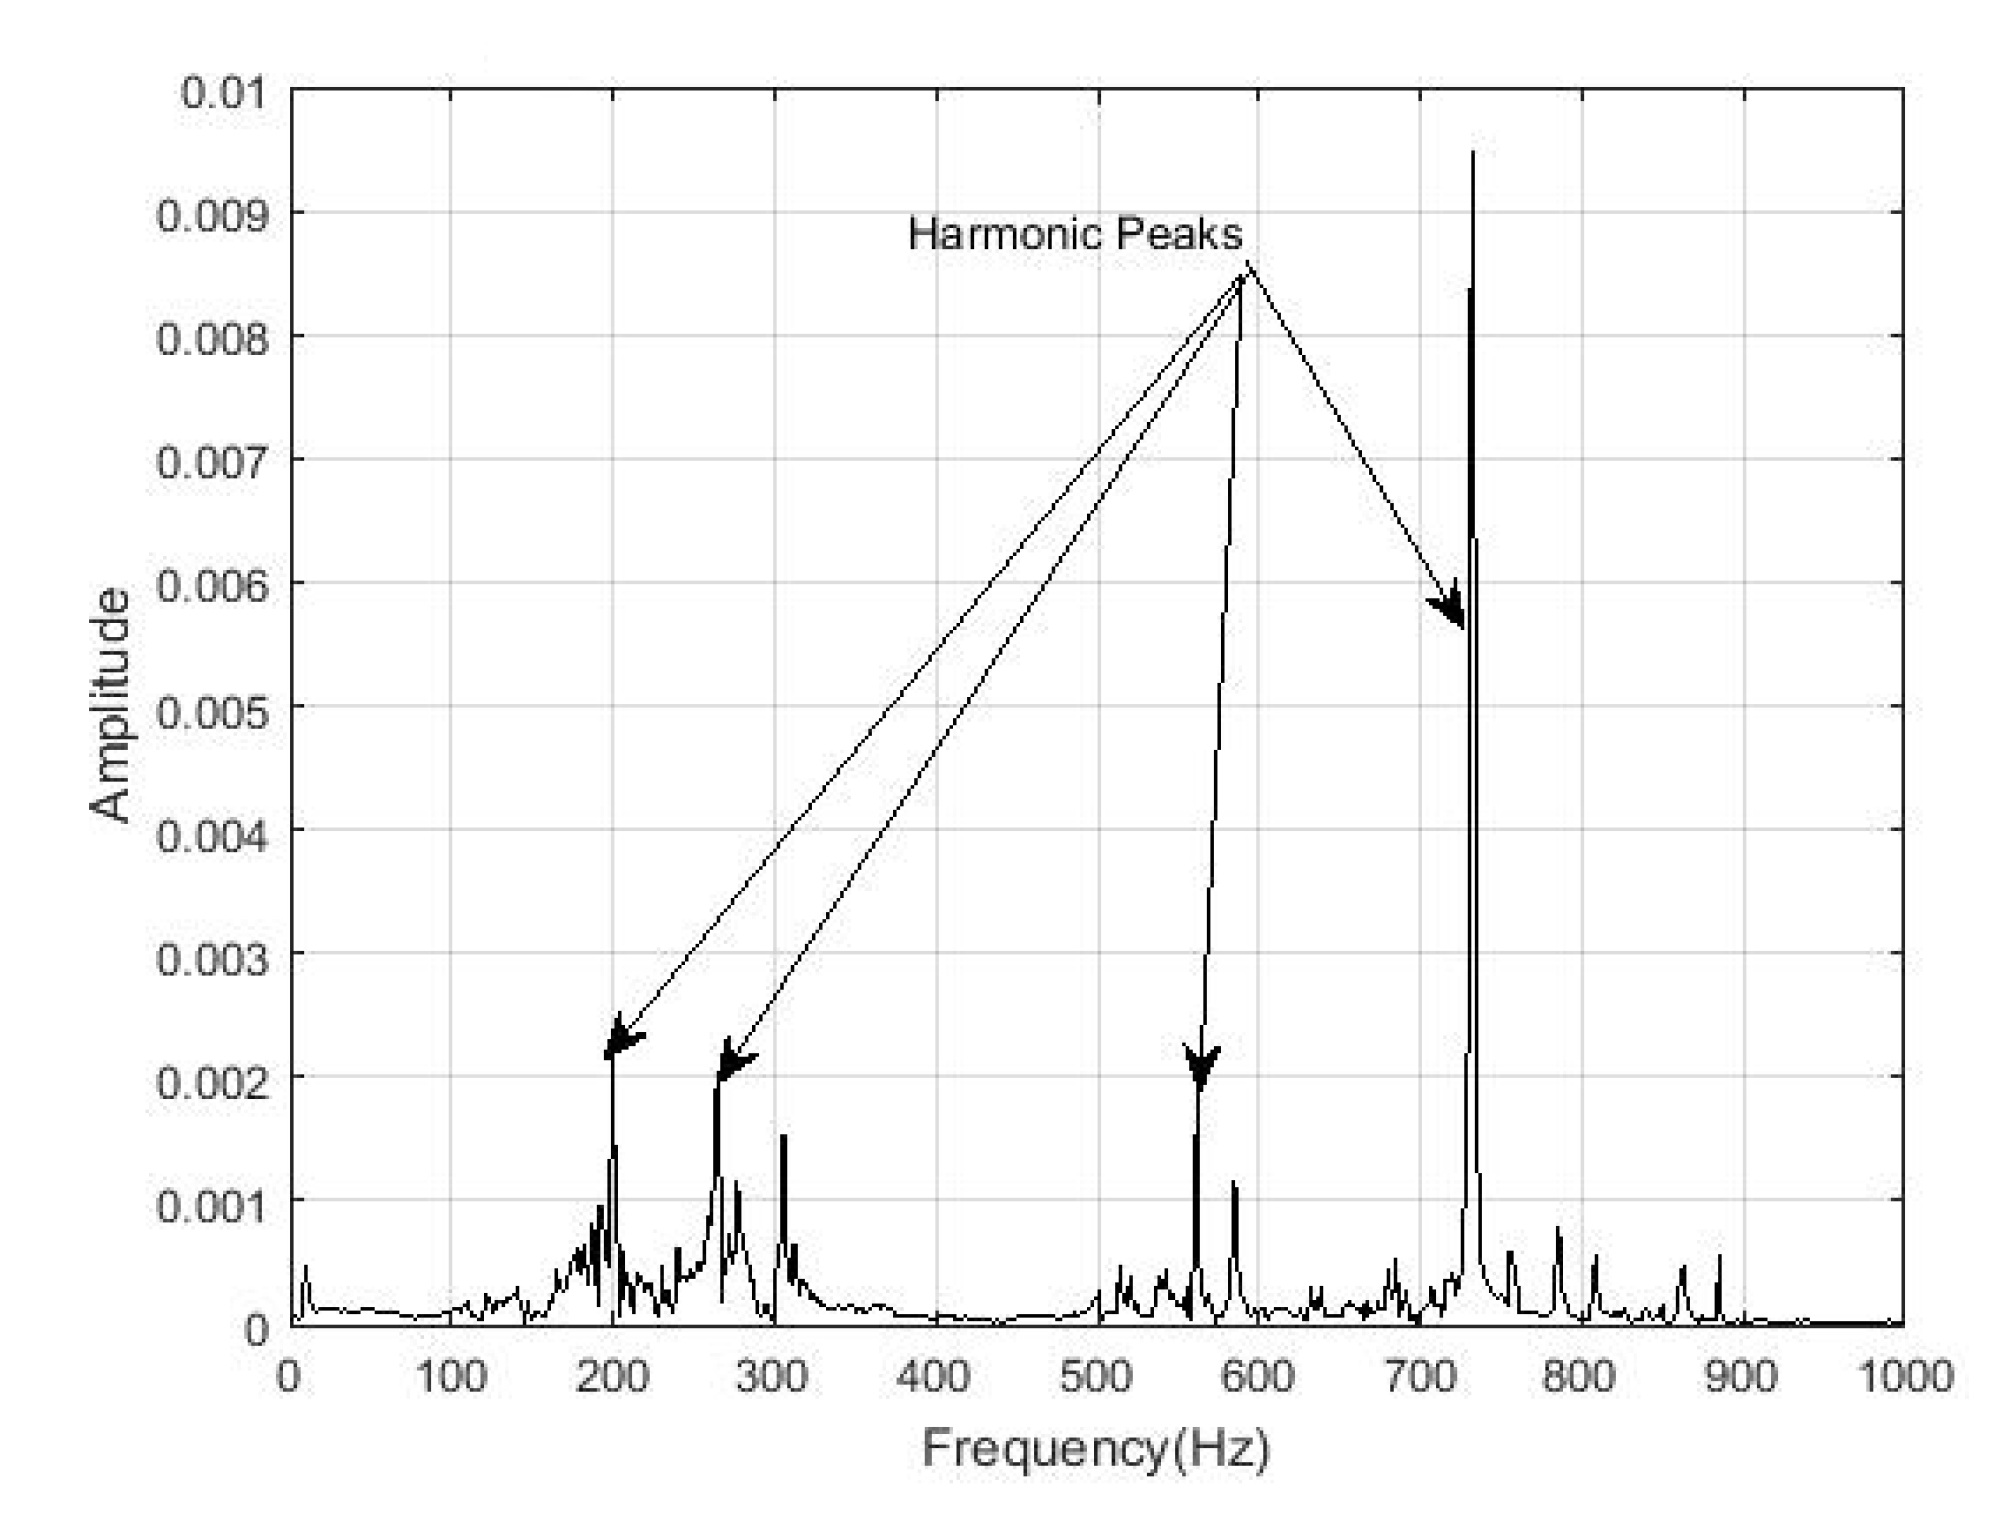
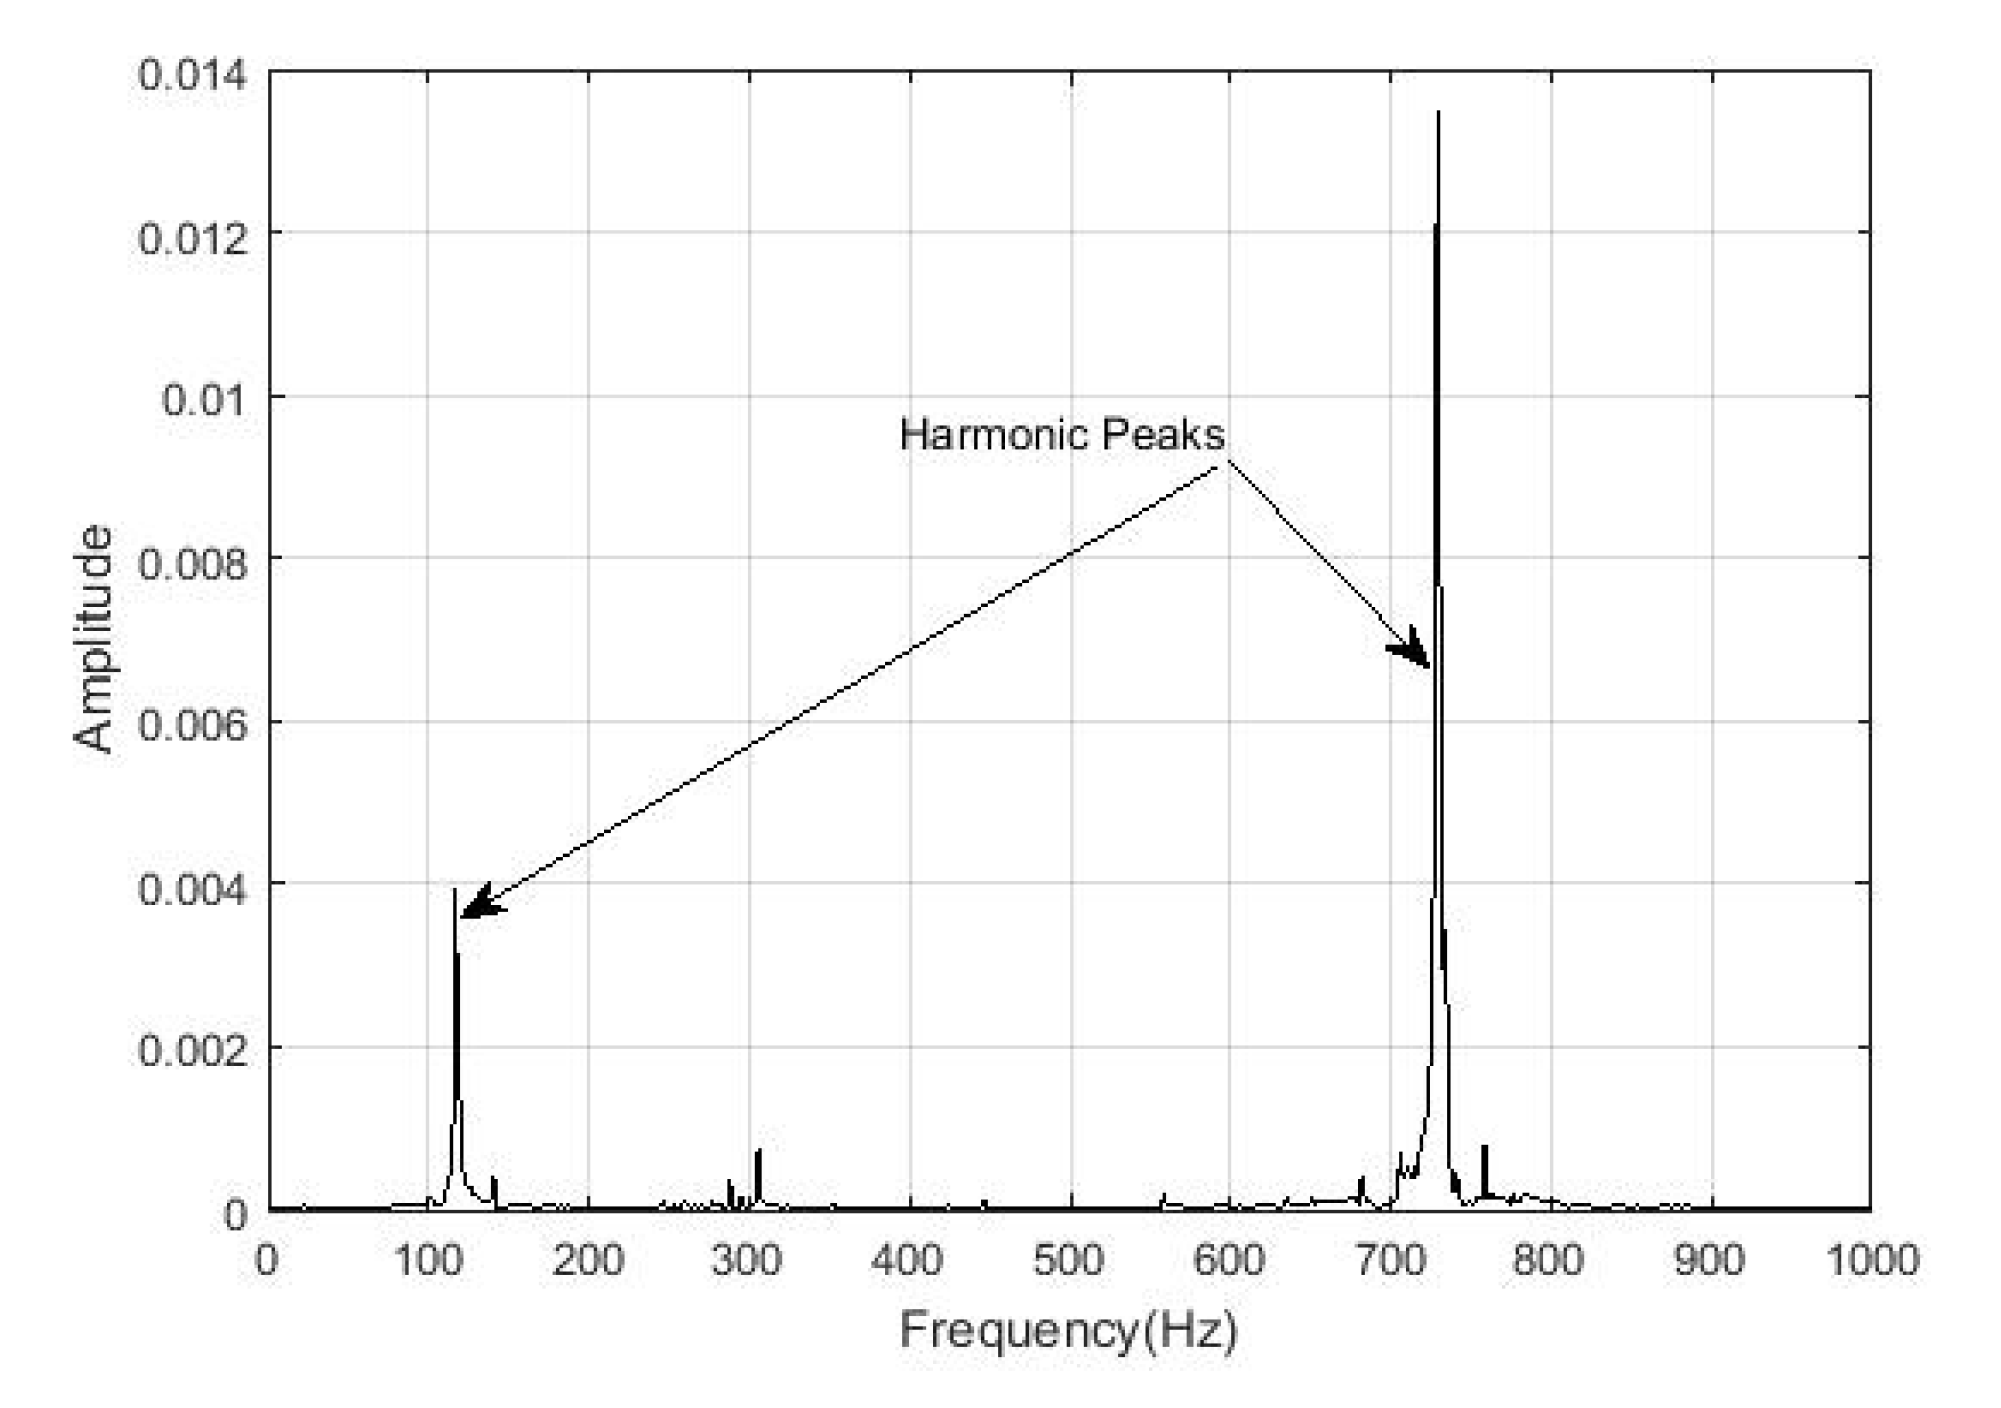
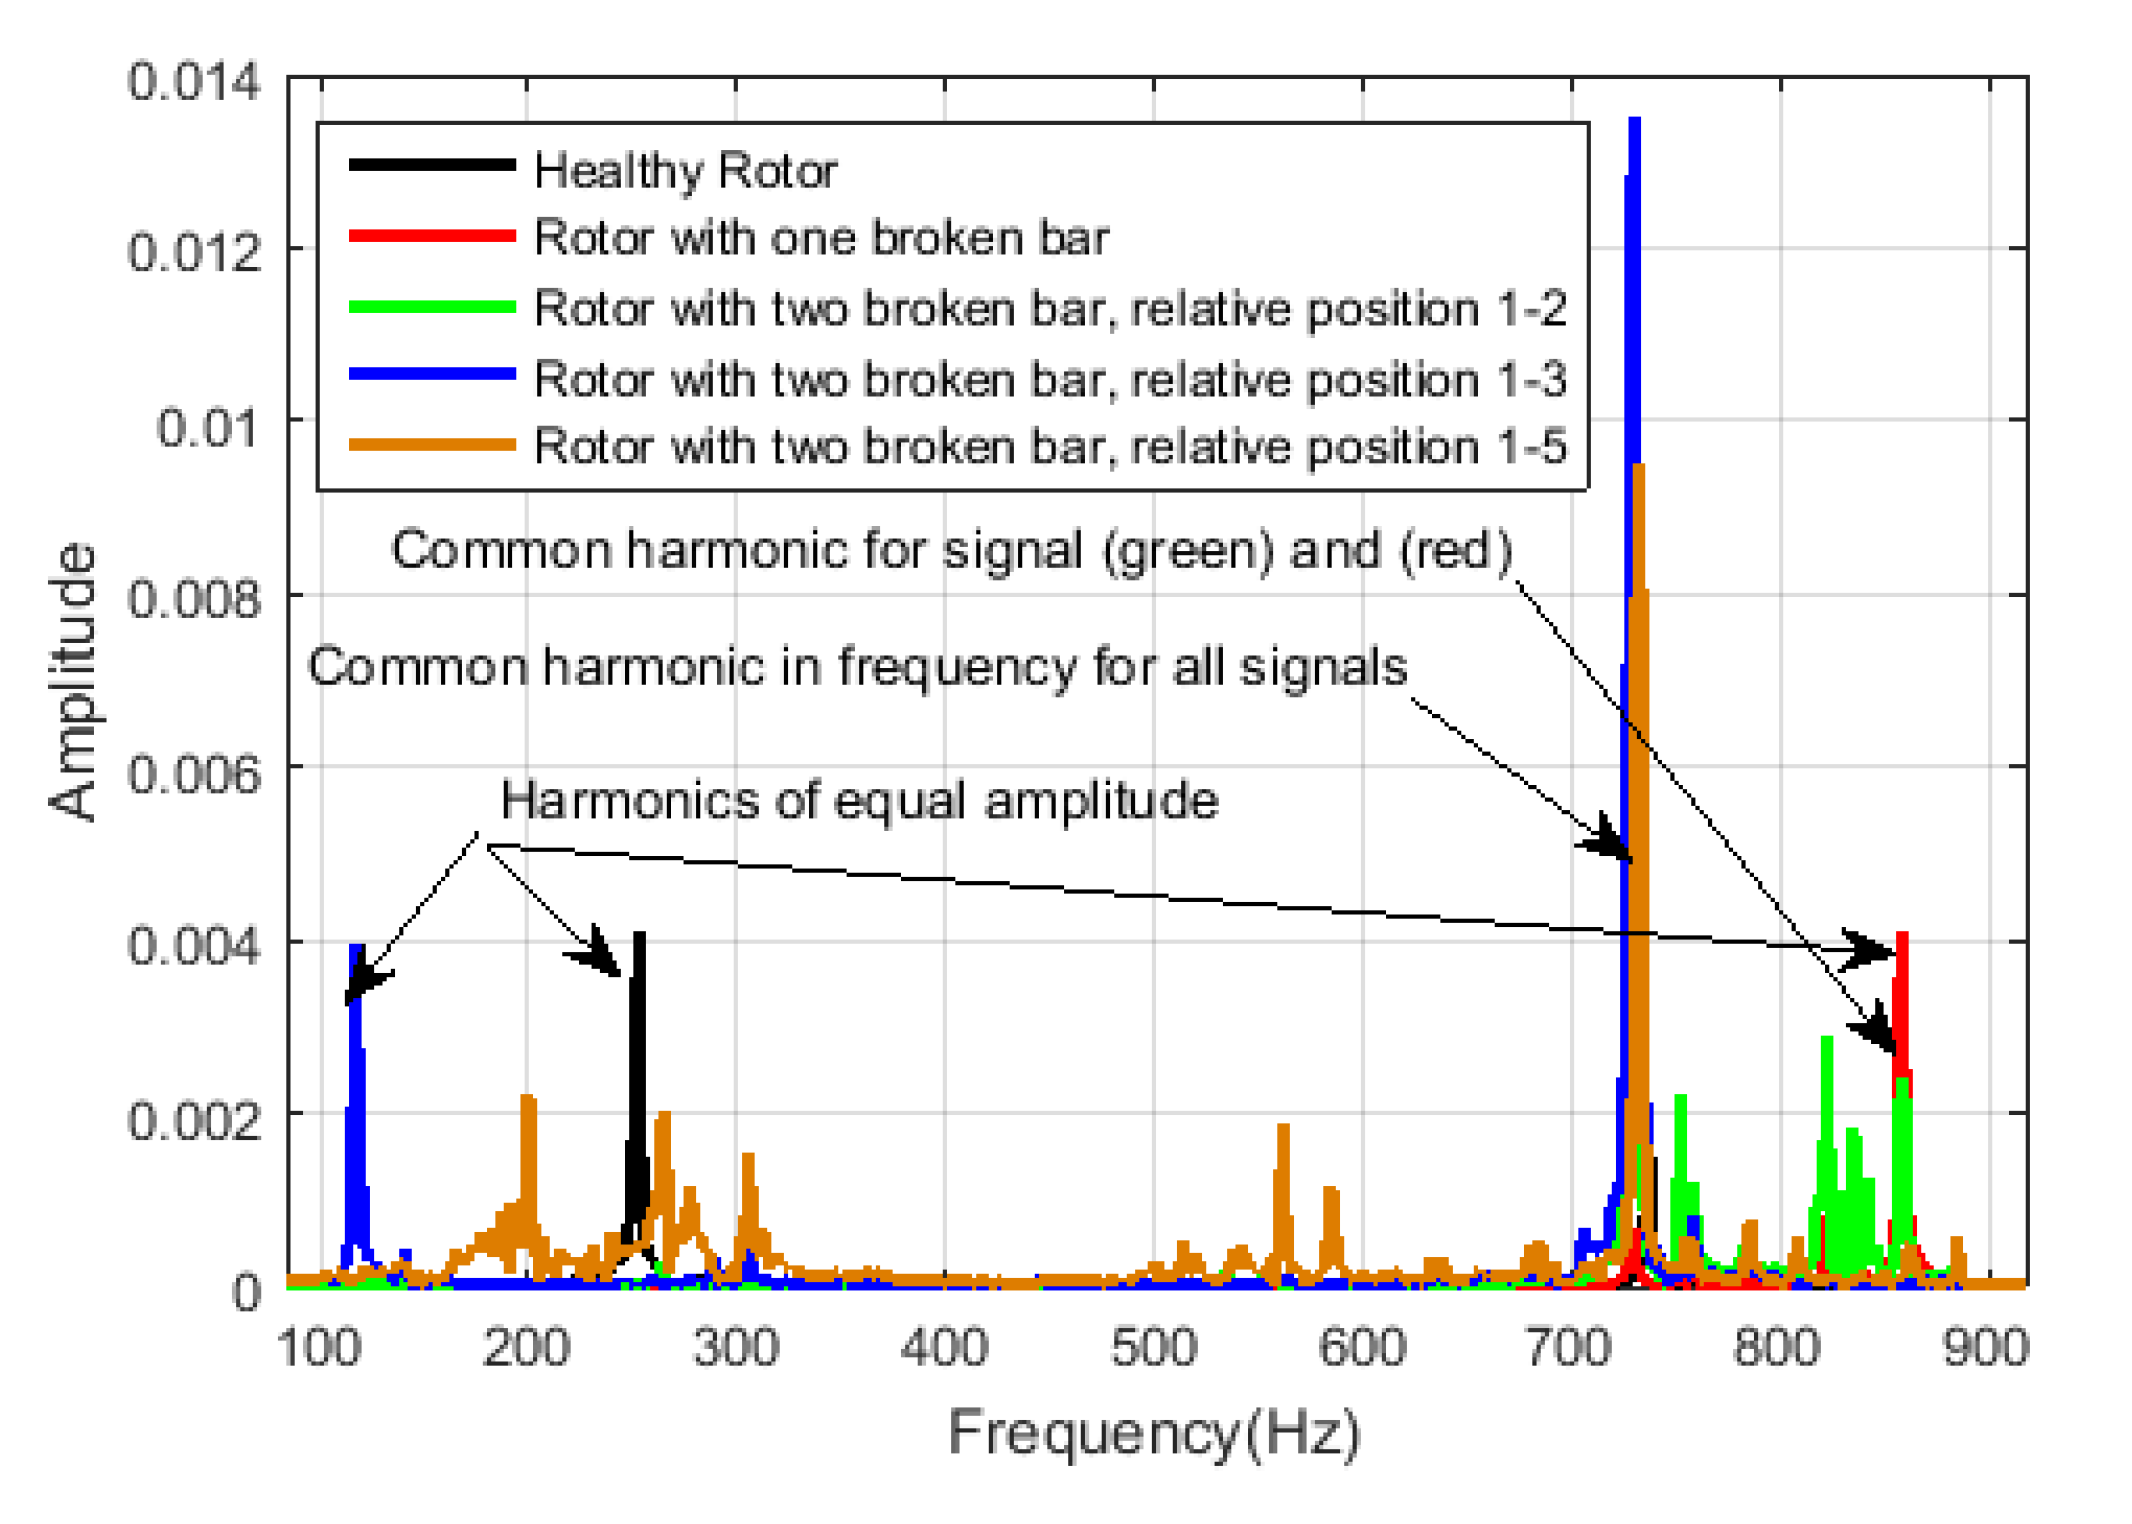
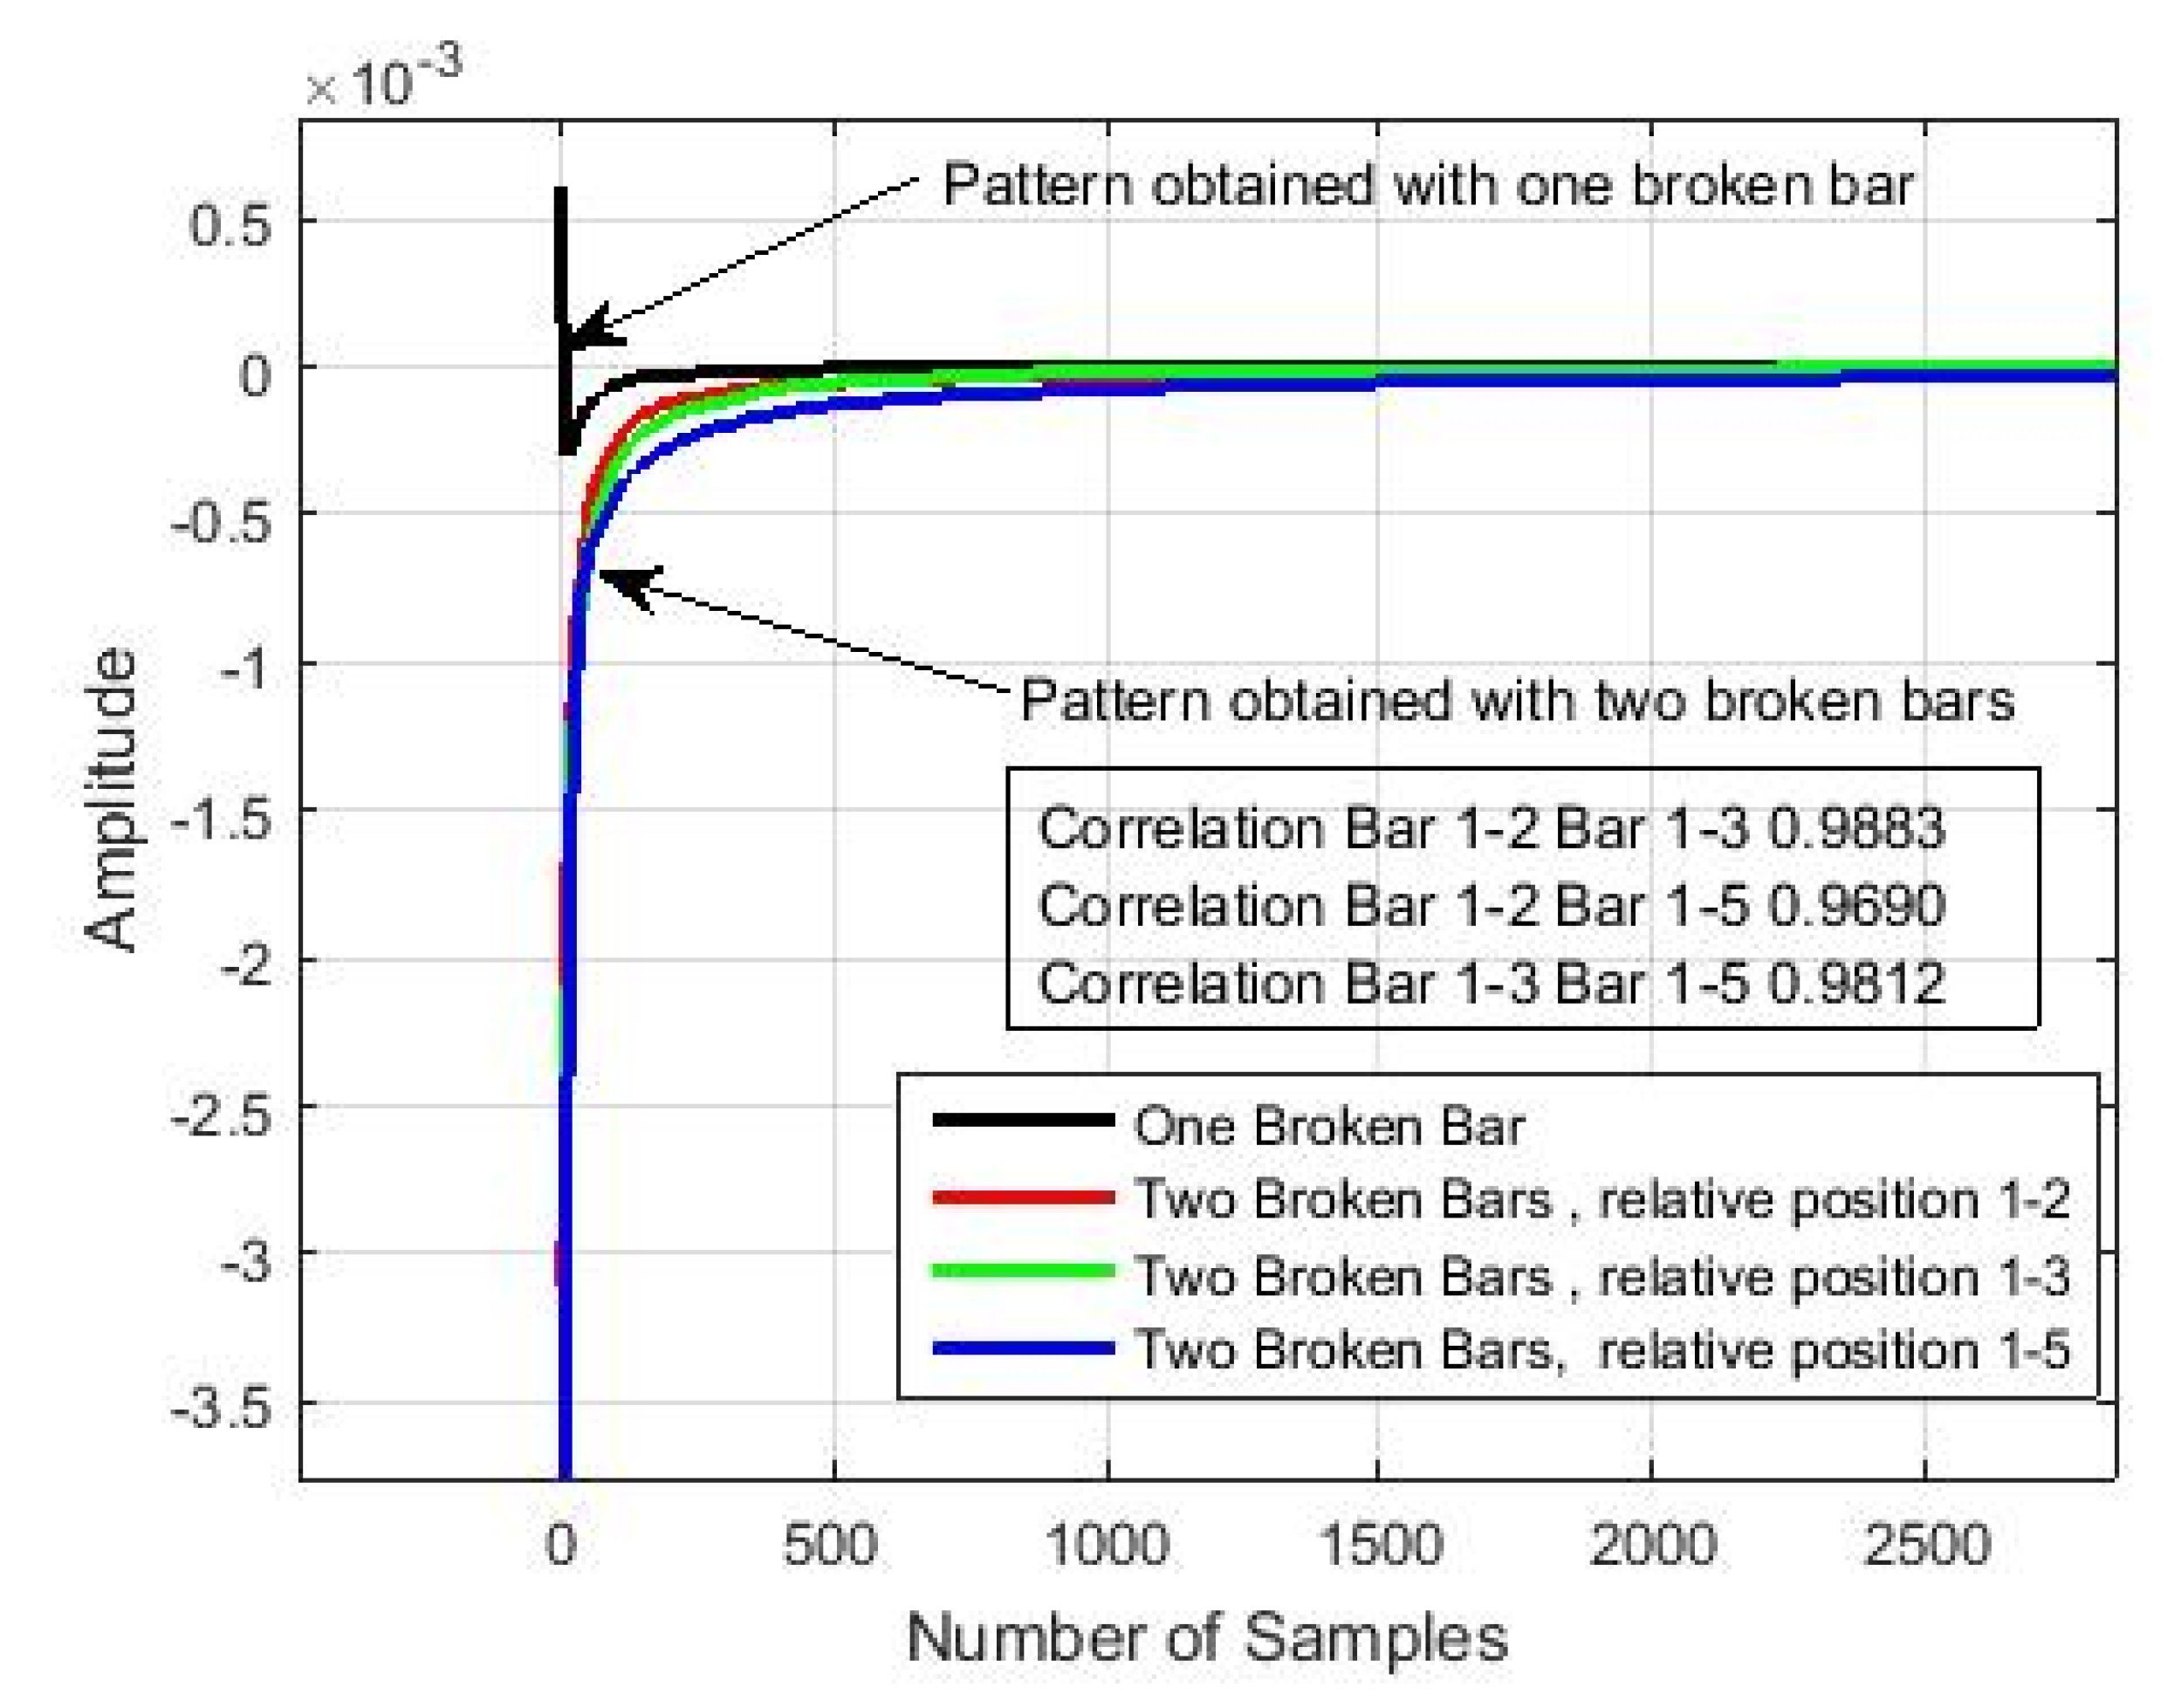
3.3. Failure Detection

To distinguish among the different types of failure, we have taken acoustic samples of a 1.1 kW motor working at full load. The electric motor was a 4-pole machine coupled to a direct current (D.C.) machine acting like a load. In Figure 10, a test-bench and set of tested rotors are shown.
The processed signals of a rotor with 28 bars present the following characteristics: (1) healthy, (2) one broken bar, two broken bars in the relative positions 1 and 2, (3) two broken bars in the relative positions 1 and 3, and (4) two broken bars in the relative positions 1 and 5. See Figure 10 for the T-bench of the tested rotors.
In each test, we recorded the acoustic noise signal with a conventional smartphone equipped with an internal microphone (type omnidirectional condenser) that enabled us to capture the required signals at a sampling rate of 16 kHz. The sampling window consists of 80,000 data measurements. The sampling window consists of 80,000 data measurements. To prevent any vibration influence in the recording, we have located the microphone was at the same place in all the tests. [23]. We removed the undesired components of the spectrum through the noise-reduction algorithm. Figure 11 and Figure 12 show the signal of the healthy rotor before and after the noise reduction with the harmonic peaks.
We show the results of the one broken bar signal. In Figure 13, Figure 14 and Figure 15, we show the signal spectrum before and after the noise reduction. With zoom in the range of 500–1200 Hz we see a third harmonic that has not appeared in the healthy signal in Figure 11. To solidify the finding of the increment of harmonic peaks on the broken bar signals, we have also looked for it in the rest of the two broken bar signals.
We show the spectrum results for the two broken bars signals in Figure 16, Figure 17 and Figure 18. Regarding the spectrum of the signal with two broken bars in the relative position 1–2, we note four harmonic peaks, with different frequencies with respect to the healthy motor spectrum. Here, the most prominent harmonic amplitude is twice the highest of the previous signal (healthy and with one broken bar). The four harmonic pattern is also present in the signal corresponding to the two broken bars signals in relative positions 1–5, see Figure 16. However, in the spectrum of the two broken bars signals in relative positions 1–3, we only appreciate two peaks, see Figure 17.
We note a characteristic component swaying on 750 Hz frequency in all signals. However, we show the differences in the spectrum of the noise-reduced signals. We show a comparison of all signals spectrum after the noise-reduction process in Figure 19. We show the characteristics peaks of the different signals together.
The novelty of the proposed calculation is that it does not require the frequency component to identify the fault. It is based on the stationary or cycle stationary nature of the acoustic signal and only needs to process the amplitude, frequency, and phase parameters. The obtained bar recognition patterns allow us to recognize between the faulty and the healthy motors. They will let us conclude if the rotor is healthy or if it has one or two broken bars, regardless of their relative position, as we will see in the next section.

4. Discussion

To check the findings from the proposed noise-reduction algorithm, we conduct a correlation analysis between the signal without noise and the signal after being processed to reduce the noise. This also lets us know that we only have noise and interferences that do not provide information.
Figure 20 shows the correlation values’ behavior to the output of the proposed noise reduction algorithm as a function of the signal-to-noise ratio (SNR) input values. We see that the correlation values decrease exponentially as the SNR ratio at the input decreases.
With a threshold correlation value of 0.5, we have a linear intrinsic relationship between the input and the output. The algorithm emits correlation values above 0.5 for an input SNR of −15dB (low or ambient with high noise concentration), which is relevant since it does not require additional information apart from the frequency, amplitude, and phase components in the signal to be processed.
In Figure 21 and Figure 22, respectively, we show the spectral pattern and another graphic making zoom, that identifies the number of broken bars shown within the motor. We point out that there is a unique pattern when the motor presents one broken bar and another unique pattern when it has two broken bars that do not depend on the relative position of the bars.
The procedure is based on the spectral subtraction between the healthy motor’s power spectrum and the power spectrum of the damaged motor. The spectral patterns obtained from subtraction converge to zero since the proposed algorithm is based only on highlighting the differences in the power spectrum according to the fault treated and with respect to the spectrum of the healthy motor. We also see that the result is not influenced by the number of samples to be processed, which is 80,000 in this case.
To prove that there is a relation between the spectral patterns with two broken bar, we compute the Pearson relationship coefficients of the vectors (red, green, blue) inferred from the output appeared in Figure 18. The results are presented in Table 3. We see that the Pearson correlation coefficients are close to one, which yields that we are in the presence of a common pattern when the engine has two broken bars independently of the relative of the bars.

5. Conclusions

We have shown that there are common characteristics within the amplitudes and frequencies of signals compared to different kinds of motor with broken bars. We have presented how the acoustic signal of an induction motor is processed. In the first analysis, a noise-reduction process is proposed based on convolving the signal with its covariance function. The adjustment amplitude process in the spectral domain is used to retrieve the original signal without noise.
On the other hand, another algorithm for the identification of broken bars independent of the relative position was proposed. The method was based on the spectral subtraction of every processed signal’s descent-sorted power spectrum. With this algorithm, a common spectral pattern was obtained when the motor presents two broken bars and a unique pattern when the motor has one broken bar.
Results are highly satisfactory, given by the significant signal-to-noise ratio achieved in the noise reduction process and the identification spectral pattern obtained from the broken bars.

Author Contributions

Conceptualization, M.E.I.M., J.A.A.-D., P.F.d.C., and J.A.C.; Methodology, M.E.I.M.; Software, M.E.I.M.; Validation, M.E.I.M., J.A.A.-D., P.F.d.C. and J.A.C.; Formal Analysis, M.E.I.M.; Investigation, M.E.I.M., J.A.A.-D., P.F.d.C. and J.A.C.; Resources, M.E.I.M., J.A.A.-D., P.F.d.C. and J.A.C.; Data Curation, M.E.I.M. and J.A.A.-D.; Writing—Original Draft Preparation, M.E.I.M., J.A.A.-D., P.F.d.C. and J.A.C.; Writing—Review and Editing, M.E.I.M., J.A.A.-D., P.F.d.C. and J.A.C.; Visualization, M.E.I.M.; Supervision, J.A.A.-D., J.A.C. All authors have read and agreed to the published version of the manuscript.

Funding

This research was funded by MEC, grant number MTM 2016-7963-P; Spanish ‘Ministerio de Ciencia Innovación y Universidades’ and FEDER program in the framework of the ‘Proyectos de I+D de Generación de Conocimiento del Programa Estatal de Generación de Conocimiento y Fortalecimiento Científico y Tecnológico del Sistema de I+D+i, Subprograma Estatal de Generación de Conocimiento’ (ref: PGC2018-095747-B-I00); and Generalitat Valenciana, Conselleria de Innovacion, Universidades, Ciencia y Sociedad Digital, (project AICO/019/224).

Conflicts of Interest

The authors declare no conflict of interest. The funders had no role in the design of the study; in the collection, analyses, or interpretation of data; in the writing of the manuscript; or in the decision to publish the results.

References

  1. Alsaedi, M.A. Fault diagnosis of three-phase induction motor: A review. Opt. Spec. Issue Appl. Opt. Signal Process. 2015, 4, 1–8. [Google Scholar] [CrossRef] [Green Version]
  2. Cusidó, J.; Romeral, L.; Ortega, J.A.; Garcia, A.; Riba, J. Signal injection as a fault detection technique. Sensors 2011, 11, 3356–3380. [Google Scholar] [CrossRef] [PubMed] [Green Version]
  3. Ghorbanian, V.; Faiz, J. A survey on time and frequency characteristics of induction motors with broken rotor bars in line-start and inverter-fed modes. Mech. Syst. Signal Process. 2015, 54–55, 427–456. [Google Scholar] [CrossRef]
  4. Riera-Guasp, M.; Cabanas, M.F.; Antonino-Daviu, J.A.; Pineda-Sánchez, M.; García, C.H.R. Influence of nonconsecutive bar breakages in motor current signature analysis for the diagnosis of rotor faults in induction motors. IEEE Trans. Energy Convers. 2010, 25, 80–89. [Google Scholar] [CrossRef]
  5. GüÇlü, S.; Ünsal, A.; Ebeoglu, M.A. Vibration analysis of induction motors with unbalanced loads. Environment 2017, 2, 3. [Google Scholar]
  6. Glowacz, A.; Glowacz, Z. Diagnosis of the three-phase induction motor using termal imaging. Infrared Phys. Technol. 2017, 81, 7–16. [Google Scholar] [CrossRef]
  7. Akçay, H.; Germen, E. Subspace-based identification of acoustic noise spectra in induction motors. IEEE Trans. Energy Convers. 2015, 30, 32–40. [Google Scholar] [CrossRef]
  8. Garcia-Perez, A.; Romero-Troncoso, R.J.; Cabal-Yepez, E.; Osornio-Rios, R.A.; Lucio Martinez, J.A. Application of high-resolution spectral analysis for identifying faults in induction motors by means of sound. J. Vib. Control. 2012, 18, 1585–1594. [Google Scholar] [CrossRef]
  9. Glowacz, A.; Glowacz, W.; Glowacz, Z.; Kozik, J.; Gutten, M.; Korenciak, D.; Khan, Z.; Irfan, M.; Carletti, E. Fault diagnosis of three phase induction motor using current signal, MSAFRatio15 and selected classifiers. Arch. Metall. Mater. 2017, 62, 2413–2419. [Google Scholar] [CrossRef]
  10. Guezmil, A.; Berriri, H.; Pusca, R.; Sakly, A.; Romary, R.; Mimouni, M.F. Detecting Inter-Turn Short-Circuit Fault in Induction Machine Using High-Order Sliding Mode Observer: Simulation and Experimental Verification. J. Control. Autom. Electr. Syst. 2017, 28, 532–540. [Google Scholar] [CrossRef]
  11. Panigrahy, P.S.; Konar, P.; Chattopadhyay, P. Broken bar fault detection using fused dwt-fft in fpga platform. In Proceedings of the 2014 International Conference on Power, Control and Embedded Systems (ICPCES), Allahabad, India, 26–28 December 2014; pp. 1–6. [Google Scholar]
  12. Zhong, J.-H.; Wong, P.K.; Yang, Z.-X. Simultaneous-fault diagnosis of gearboxes using probabilistic committee machine. Sensors 2016, 16, 185. [Google Scholar] [CrossRef] [PubMed] [Green Version]
  13. Iglesias-Martínez, M.; Antonino-Daviu, J.; Fernández de Córdoba, P.; Conejero, J. Rotor Fault Detection in Induction Motors Based on Time-Frequency Analysis Using the Bispectrum and the Autocovariance of Stray Flux Signals. Energies 2019, 12, 597. [Google Scholar] [CrossRef] [Green Version]
  14. Glowacz, A.; Glowacz, W.; Glowacz, Z.; Kozik, J. Early fault diagnosis of bearing and stator faults of the single-phase induction motor using acoustic signals. Measurement 2018, 113, 1–9. [Google Scholar] [CrossRef]
  15. Samanta, A.K.; Naha, A.; Routray, A.; Deb, A.K. Fast and accurate spectral estimation for online detection of partial broken bar in induction motors. Mech. Syst. Signal Process. 2018, 98, 63–77. [Google Scholar] [CrossRef]
  16. Akçay, H.; Germen, E. Identification of acoustic spectra for fault detection in induction motors. In 2013 AFRICON; IEEE: Piscataway, NJ, USA, 2013; pp. 1–5. [Google Scholar]
  17. Antonino-Daviu, J.; Riera-Guasp, M.; Roger-Folch, J.; Martínez-Giménez, F.; Peris, A. Application and optimization of the discrete wavelet transform for the detection of broken rotor bars in induction machines. Appl. Comput. Harmon. Anal. 2006, 21, 268–279. [Google Scholar] [CrossRef] [Green Version]
  18. Bazhenov, V.A.; Pogorelova, O.S.; Postnikova, T.G. Intermittent transition to chaos in vibro impact system. Appl. Math. Nonlinear Sci. 2018, 3, 475–486. [Google Scholar] [CrossRef] [Green Version]
  19. Gaeid, K.S.; Ping, H.W.; Khalid, M.; Masaoud, A. Sensor and sensorless fault tolerant control for induction motors using a wavelet index. Sensors 2012, 12, 4031–4050. [Google Scholar] [CrossRef]
  20. Hernandez, J.C.; Antonino-Daviu, J.; Martinez-Gimenez, F.; Peris, A. Comparison of different wavelet families for broken bar detection in induction motors. In Proceedings of the 2015 IEEE International Conference on Industrial Technology (ICIT), Seville, Spain, 17–19 March 2015; pp. 3220–3225. [Google Scholar]
  21. Yahia, K.; Cardoso, A.; Ghoggal, A.; Zouzou, S. Induction motors airgap-eccentricity detection through the discrete wavelet transform of the apparent power signal under non-stationary operating conditions. ISA Trans. 2014, 53, 603–611. [Google Scholar] [CrossRef]
  22. Obukhova, N.; Motyko, A.; Pozdeev, A.; Timofeev, B. Review of noise reduction methods and estimation of their effectiveness for medical endoscopic images processing. In Proceedings of the 2018 22nd Conference of Open Innovations Association (FRUCT), Jyvaskyla, Finland, 15–18 May 2018; pp. 204–210. [Google Scholar]
  23. Delgado-Arredondo, P.A.; Morinigo-Sotelo, D.; Osornio-Rios, R.A.; Avina-Cervantes, J.G.; Rostro-Gonzalez, H.; de Jesus Romero-Troncoso, R. Methodology for fault detection in induction motors via sound and vibration signals. Mech. Syst. Signal Process. 2017, 83, 568–589. [Google Scholar] [CrossRef]
  24. Alwodai, A. Motor Fault Diagnosis Using Higher Order Statistical Analysis of Motor Power Supply Parameters. Ph.D. Thesis, University of Huddersfield, Huddersfield, UK, 2015. [Google Scholar]
  25. Gu, F.; Wang, T.; Alwodai, A.; Tian, X.; Shao, Y.; Ball, A. A new method of accurate broken rotor bar diagnosis based on modulation signal bispectrum analysis of motor current signals. Mech. Syst. Signal Process. 2015, 50, 400–413. [Google Scholar] [CrossRef] [Green Version]
  26. Saidi, L.; Fnaiech, F.; Capolino, G.; Henao, H. Stator current bi-spectrum patterns for induction machines multiple-faults detection. In Proceedings of the 38th Annual Conference on IEEE Industrial Electronics Society, Montreal, QC, Canada, 25–28 October 2012; pp. 5132–5137. [Google Scholar]
  27. Saidi, L.; Fnaiech, F.; Henao, H.; Capolino, G.; Cirrincione, G. Diagnosis of broken-bars fault in induction machines using higher order spectral analysis. Isa Trans. 2013, 52, 140–148. [Google Scholar] [CrossRef] [PubMed]
  28. Glowacz, A.; Glowacz, Z. Recognition of rotor damages in a dc motor using acoustic signals. Bull. Pol. Acad. Sci. Tech. Sci. 2017, 65, 187–194. [Google Scholar] [CrossRef] [Green Version]
  29. Ondel, O.; Boutleux, E.; Clerc, G. A method to detect broken bars in induction machine using pattern recognition techniques. IEEE Trans. Ind. Appl. 2006, 42, 916–923. [Google Scholar] [CrossRef]
  30. Júnior, A.M.; Silva, V.V.; Baccarini, L.M.; Mendes, L.F. The design of multiple linear regression models using a genetic algorithm to diagnose initial short-circuit faults in 3-phase induction motors. Appl. Soft Comput. 2018, 63, 50–58. [Google Scholar] [CrossRef]
  31. Perez-Ramirez, C.A.; Amezquita-Sanchez, J.P.; Valtierra-Rodriguez, M.; DominguezGonzalez, A.; Camarena-Martinez, D.; Romero-Troncoso, R.J. Fractal dimension theory-based approach for bearing fault detection in induction motors. In Proceedings of the 2016 IEEE International Autumn Meeting on Power, Electronics Computing (ROPEC), Ixtapa, Mexico, 9–11 November 2016; pp. 1–6. [Google Scholar]
  32. Rezazadeh Mehrjou, M.; Mariun, N.; Misron, N.; Radzi, M.A.M.; Musa, S. Broken rotor bar detection in LS-PMSM based on startup current analysis using wavelet entropy features. Appl. Sci. 2017, 7, 845. [Google Scholar] [CrossRef] [Green Version]
  33. Iglesias-Martinez, M.E.; Fernandez de Cordoba, P.; Antonino-Daviu, J.A.; Conejero, J.A. Detection of Nonadjacent Rotor Faults in Induction Motors via Spectral Subtraction and Autocorrelation of Stray Flux Signals. IEEE Trans. Ind. Appl. 2019, 55, 4585–4594. [Google Scholar] [CrossRef]
  34. Iglesias Martínez, M.E.; Antonino-Daviu, J.A.; de Córdoba, P.F.; Conejero, J.A. Higher-Order Spectral Analysis of Stray Flux Signals for Faults Detection in Induction Motors. Appl. Math. Nonlinear Sci. 2020, 5, 1–14. [Google Scholar] [CrossRef] [Green Version]
  35. Dhabu, S.; Ambede, A.; Agrawal, N.; Smitha, K.G.; Darak, S.; Vinod, A.P. Variable cutoff frequency FIR filters: A survey. SN Appl. Sci. 2020, 2, 343. [Google Scholar] [CrossRef] [Green Version]
  36. Dinesh, P.S.; Manikandan, M. Survey on reconfigurable fir filter architecture. In Proceedings of the 2017 Fourth International Conference on Signal Processing, Communication and Networking (ICSCN), Chennai, India, 16–18 March 2017; pp. 1–3. [Google Scholar]
  37. Salazar-Villanueva, F.; Ibarra-Manzano, O.G. Spectral analysis for identifying faults in induction motors by means of sound. In Proceedings of the International Conference on Electronics, Communications and Computing (CONIELECOMP), Cholula, Mexico, 11–13 March 2013; pp. 149–153. [Google Scholar]
  38. Benesty, J.; Chen, J.; Huang, Y.; Cohen, I. Noise Reduction in Speech Processing; Springer Science & Business Media: Berlin/Heidelberg, Germany, 2009; Volume 2. [Google Scholar]
  39. Shraddha, C.; Chayadevi, M.L.; Anusuya, M.A. Noise cancellation and noise reduction techniques: A review. In Proceedings of the 1st International Conference on Advances in Information Technology (ICAIT), Chikmagalur, India, 25–27 July 2019; pp. 159–166. [Google Scholar]
  40. Ono, Y.; Onishi, Y.; Koshinaka, T.; Takata, S.; Hoshuyama, O. Anomaly detection of motors with feature emphasis using only normal sounds. In Proceedings of the IEEE International Conference on Acoustics, Speech and Signal Processing (ICASSP), Vancouver, BC, Canada, 26–31 May 2013; pp. 2800–2804. [Google Scholar]
  41. Isogawa, K.; Ida, T.; Shiodera, T.; Takeguchi, T. Deep shrinkage convolutional neural network for adaptive noise reduction. IEEE Signal Process. Lett. 2017, 25, 224–228. [Google Scholar] [CrossRef]
  42. Xiu, C.; Su, X. Composite convolutional neural network for noise deduction. IEEE Access 2019, 7, 117814–117828. [Google Scholar] [CrossRef]
  43. Crouse, M.S.; Nowak, R.D.; Baraniuk, R.G. Wavelet-based statistical signal processing using hidden Markov models. IEEE Trans. Signal. Process. 1998, 46, 886–902. [Google Scholar] [CrossRef] [Green Version]
  44. Granda, D.; Aguilar, W.G.; Arcos-Aviles, D.; Sotomayor, D. Broken bar diagnosis for squirrel cage induction motors using frequency analysis based on MCSA and continuous wavelet transform. Math. Comput. Appl. 2017, 22, 30. [Google Scholar]
  45. Jansen, M. Noise Reduction by Wavelet Thresholding; Springer Science & Business Media: Berlin/Heidelberg, Germany, 2012; Volume 161. [Google Scholar]
  46. Kimlyk, M.; Umnyashkin, S. Image denoising using discrete wavelet transform and edge information. In Proceedings of the IEEE Conference of Russian Young Researchers in Electrical and Electronic Engineering (2018 EIConRus), Moscow, Russia, 29 January–1 February 2018; pp. 1823–1825. [Google Scholar]
  47. Candy, J.V. Bayesian Signal. Processing: Classical, Modern, and Particle Filtering Methods; John Wiley & Sons: Hoboken, NJ, USA, 2016; Volume 54. [Google Scholar]
  48. Khang, H.; Puche-Panadero, R.; Senanayaka, J.L.; Robbersmyr, K. Bearing fault detection of gear-box drive train using active filters. In Proceedings of the 19th International Conference on Electrical Machines and Systems (ICEMS), Chiba, Japan, 13–16 November 2016; pp. 1–6. [Google Scholar]
  49. Vaseghi, S.V. Advanced Digital Signal Processing and Noise Reduction; John Wiley & Sons: Hoboken, NJ, USA, 2008. [Google Scholar]
  50. Spagnolini, U. Statistical Signal Processing in Engineering; John Wiley & Sons: Hoboken, NJ, USA, 2018. [Google Scholar]
  51. Ge, H.; Chen, G.; Yu, H.; Chen, H.; An, F. Theoretical analysis of empirical mode decomposition. Symmetry 2018, 10, 623. [Google Scholar] [CrossRef] [Green Version]
Figure 1. Illustration of: An example of industrial motor (2000 H.P) with broken rotor bars.
Applsci 10 06641 g001
Figure 2. Representation of the noise-reduction algorithm workflow.
Applsci 10 06641 g002
Figure 3. Block diagram of the spectral pattern recognition algorithm for identifying broken bars.
Applsci 10 06641 g003
Figure 4. Harmonic signal without noise used to compare our method with that described in [5].
Applsci 10 06641 g004
Figure 5. Spectrum of the noisy signal used to compare our method with that described in [5].
Applsci 10 06641 g005
Figure 6. The spectrum of the original signal (blue), the spectrum of the noisy signal (black), and the spectrum obtained after applying our algorithm for noise reduction without additional information of the input signal (red); 16,000 processed samples.
Applsci 10 06641 g006
Figure 7. The spectrum of the original signal (blue), the spectrum of the noisy signal (black), and the spectrum obtained after applying our algorithm for noise reduction without additional information of the input signal (red); 64,000 processed samples.
Applsci 10 06641 g007
Figure 8. The spectrum of the original signal (blue), the spectrum of the noisy signal (black), and the spectrum obtained after applying the wavelet algorithm for noise reduction.
Applsci 10 06641 g008
Figure 9. Execution time in terms of the number of samples. The execution time was calculated using the Matlab tictoc function and on a computer with an i5 processor and 4Gb of RAM.
Applsci 10 06641 g009
Figure 10. T-bench of the tested rotors.
Applsci 10 06641 g010
Figure 11. Healthy rotor spectrum before the noise reduction with the harmonic peaks.
Applsci 10 06641 g011
Figure 12. Healthy rotor spectrum after the noise reduction with the harmonic peaks.
Applsci 10 06641 g012
Figure 13. One broken bar signal spectrum before the noise reduction with the harmonic peaks.
Applsci 10 06641 g013
Figure 14. One broken bar signal spectrum after the noise reduction with the harmonic peaks.
Applsci 10 06641 g014
Figure 15. One broken bar signal spectrum before the noise reduction with zoom in the range of 500–1200 Hz.
Applsci 10 06641 g015
Figure 16. Spectrum of the two broken bars, in relative position 1–2, signal after the noise reduction with the harmonic peaks.
Applsci 10 06641 g016
Figure 17. Spectrum of the two broken bars, in relative position 1–5, signal after the noise reduction with the harmonic peaks.
Applsci 10 06641 g017
Figure 18. Spectrum of the two broken bars, in relative position 1–3, signal after the noise reduction with the harmonic peaks.
Applsci 10 06641 g018
Figure 19. A comparison for all signals spectra after the noise-reduction process.
Applsci 10 06641 g019
Figure 20. Output correlations values in terms of the input signal to noise ratio (SNR).
Applsci 10 06641 g020
Figure 21. Spectral pattern obtained from the application of the proposed pattern recognition algorithm showed in Figure 3, to identify broken bars.
Applsci 10 06641 g021
Figure 22. Zoom of the spectral pattern obtained from the application of the proposed pattern recognition algorithm showed in Figure 3, to identify broken bars.
Applsci 10 06641 g022
Table 1. Comparison of our proposed algorithm with the competing method proposed in [23].
Proposed AlgorithmCompeting Method Ref. [23]
System characteristicOne Input/One OutputOne Input/One Output
Signal to Noise Ratio Input−10.9172−10.9172
Input SignalHarmonic Signal with component (60 Hz, 200 Hz, 780 Hz, and 800 Hz,)Harmonic Signal with component (60 Hz, 200 Hz, 780 Hz, and 800 Hz,)
Signal DecompositionNOYes
Table 2. Summary of the characteristic for the comparison with the method using wavelet function.
Proposed AlgorithmCompeting Method Based on Wavelet
System characteristicOne Input/One OutputOne Input/One Output
Signal to Noise Ratio Input−10.9172−10.9172
Input SignalHarmonic Signal with component (60 Hz, 200 Hz, 780 Hz, and 800 Hz,)Harmonic Signal with component (60 Hz, 200 Hz, 780 Hz, and 800 Hz,)
Signal DecompositionNONO
Thresholding CalculationNOYes
Obtained Correlation0.7717.0.3303
Table 3. Pearson correlation coefficient values between output signals with two broken bars.
SignalCorrelation Value
Bar 1–2 vs. Bar 1–30.9883
Bar 1–2 vs. Bar 1–50.9690
Bar 1–2 vs. Bar 1–50.9812

