1. Introduction
The mobile casual game with a simple gameplay feature (called casual game shortly) contributes 15~25% of the total sales volume of the game industry [
1]. A gameplay is a series of actions in which players interact with a game, such a jump to dodge attacks. The design of the casual game targets casual players by reducing demands on time and learned gameplay skills, in contrast to complex hardcore games, such as Starcraft/Diablo-like games. This is because casual players only play games in short bursts for relaxing their brain or social purposes, and 70% of people spend only six months to play a game [
2]. This leads that the lifespan of the casual game is getting shorter. A game company will be squeezed out of the game market share if its game development fails to effectively renew and shorten a new game in six months.
The company has to shorten the casual game development cycle and then encounter a huge challenge in the game quality assurance process [
3]. That is, evaluating a game design is not a pure software testing process. An unplayable game design lets a player experience disproportionate fairness towards the goal of the game, causing confusion, idling, boring, and finally, the player leaves the game. An unplayable game design is not a software bug and therefore cannot be detected by conventional automated testing technology, such as unit testing. Bad game design/experience is usually discovered by manual testing.
Manual testing is not only a costly and time-consuming process, but also hardly evaluates the reasonability of leveling designs in a short testing period. The reason is that game tester will spontaneously acquire higher gameplay skills, and their skill is getting better in-game testing procedures. This leads that a high-skilled tester, from a beginner’s viewpoint, hardly objectively evaluates the reasonability of leveling from easy to hard. The second reason is the game tester may feel paralyzed about the game leveling after numbers of game testing, leading that tester becoming bored and think the leveling is indifferent.
Many studies propose several automated testing methods to replace manual testing. Several works [
3,
4,
5,
6] apply a heuristic methodology to evaluate the overall leveling difficulty. These methods cannot quantitatively analyze game designs, including the difficulties between game levels and the reasonability of the leveling path. Some artificial intelligence (AI) assisted testing methods related to software testing in the video game industry are proposed [
7]. However, their AI testing system is usually designed to find out problems/bugs of a game, instead of comparing the reasonability of game designs (e.g., reasonable leveling or reasonable maze design). To our best knowledge, there is no sufficient quantitative testing method to validate the game levels design.
This study, therefore, proposes a Long/Short-Term Memory based automated testing model (called LSTM-Testing) to provide quantitative testing data. These data help the game designer to objectively evaluate the game design. LSTM-Testing emulates real player learning behaviors and iteratively plays the game through end-to-end functionality (Input: game image frame; Output: game action) without any manual feature extraction and intervention. Four phases of LSTM-Testing are adopted. First, LSTM-Testing keep taking screenshots from the game video as the samples in one game session. A game session means the period of time between a player initiates a game and this player reaches a save point or the end of a game. Second, LSTM-Testing applies deep neural network (DNN) to transform the gameplay image to linear equations, and interactively plays it to solve the linear equations. Third, LSTM-Testing adopts long/short-term memory to emulate gamer behaviors, including (a) how to play a game based on long-term memory and (b) how to relearn it based on short-term memory when a gamer forgets how to play it. Finally, LSTM-Testing decides the gameplay strategy by pressing the corresponding keyboard/mouse action and then generates “learning time” to complete a game as the dependent variable, “game design” as the control variable. Therefore, the game designer can control the game design and observe the dependent variable “learning time” to (1) quantitatively evaluate the difficulty of different game design, (2) to ensure reasonable leveling path design, and (3) to validate the game difficulty is proportional to level scales. For example, a game designer can argue that a large maze is twice harder than a median maze, if LSTM-testing requires 2000 iterative trainings to solve a median maze design with 128 × 128 in size, and on the other hand, LSTM-testing requires 4000 iterative trainings to solve a large maze design with 512 × 512 in size.
LSTM-Testing intends to help the game project manager to address the disputes when staffs keep debating over which features to include and which to leave for later in the game design process. LSTM-Testing can also predict outcomes of testing without even performing the actual tests. This helps the game designer only focus on those which could be problematic. As state above, the contributions of LSTM-Testing are (1) providing an objective and quantitative testing indicator to evaluate game experience including unreasonable traps in a game, calculate the average time to defend difference scales of enemy attacks, and keep proportional fairness of different game levels, (2) demonstrating the possibility of rapidly AI-assisted prototyping which enables game project manager with less technical domain experts to develop a suitable game design and visual interfaces, and (3) presenting an AI-driven strategic decision-making framework to assess the performance of existing applications and help both business sponsors and engineering teams identify efforts that would maximize impact and minimize risk.
This study is organized as follows:
Section 2 reviews the game testing procedure.
Section 3 provides the details of LSTM-Testing.
Section 4 and
Section 5 demonstrate the experiment results and the implications. Several cases are provided to present the ability of LSTM-testing, including (1) evaluating different scales of enemy attack based on maze designs in
Section 4, (2) evaluating proportional fairness of different game leveling in
Section 5.1,
Section 5.2 and
Section 5.3, and (3) ensuring there might be some unreasonable traps in a game in
Section 5.4. Finally,
Section 6 describes conclusions.
2. Background: Game Development Life Cycle
Several methodologies are proposed for the game development life cycle and can be characterized as a six-step process [
8].
Step (1): Pitch.
Pitch means making the basic design, and there are a few people involves in this phase, mostly senior game designers and artists. Pitch happens while negotiating with the investigator and major stockholders on the budget, the schedule and any specifically required features. At this stage, there will only be a few people on the team, mostly senior game designers and artists.
Step (2): Pre-Production.
Pre-production concretize the game design and create a prototype, once the contract has been signed. This prototype is sent to the main investigators and stockholders, so they can see what progress has been made and evaluate the feasibility of the game design.
Step (3): Main Production.
The realization of the game design is done through the main production. In this phase, the software engineering testing including unit testing, integration testing and compatibility testing, is conducted for quality assurance.
Step (4): Alpha Test.
Alpha Test is performed to explore all possible issues before releasing the game to the public. It simulates real users and carries out actions that a typical user might perform in a lab environment, and usually the testers are internal employees of the organization.
Step (5): Beta Test.
Beta testing is performed by “real users” of the game in a real environment to reduces product failure risks and provide increased quality of the product through customer validation.
Step (6): Master.
The game is launched in the master phase.
This study focuses on the game design testing in Step (3): Main Production.
Many studies propose automated game testing methods to replace manual testing. Several works [
3,
4,
5] apply Petri-net based methodology that offers a graphical analysis for stepwise processes including choice, iteration, and concurrent execution. On the other hand, Dynamic Difficulty Adjustment (DDA) based on genetic algorithm [
6] is proposed to heuristically search possible gameplay model and evaluate the overall leveling difficulty. These methods are still a process-based methodology that iteratively checks each design matches the man-made criteria. They therefore cannot quantitatively analyze game designs, including the difficulties between game levels and the reasonability of the leveling path. They also cannot validate that the game level design is proportional to the game’s difficulty levels. It should be noted that game testing is a crucial procedure to ensure game quality through the development cycle. The major challenge of game testing is creating a comprehensive list of testing cases which consumes enormous labor cost.
Some AI assisted testing methods are proposed [
7]. The difference between the previous works and this study is twofold. First, from the perspective of testing approach design, they mainly use reinforcement learning with Q-algorithm to learn to complete a game rather than focusing on the learning strategy of a gamer. This study extends reinforcement learning by adding long/short term memory functionality to emulate gamer behaviors, including (a) how to play a game based on long-term memory and (b) how to relearn it based on short-term memory when a gamer forgets how to play it. Second, from the perspective of the testing objective, their AI testing system is usually designed to find out problems/bugs of a game. This study’s AI testing system is designed to compare the reasonability of game designs (e.g., reasonable leveling or reasonable maze design) by playing it iteratively.
3. Proposed Framework: LSTM-Testing
This study, therefore, proposes a Long/Short-Term Memory based automated testing model (called LSTM-Testing) to provide quantitative testing data. These data help the game designer to objectively evaluate the game design. LSTM-Testing emulates real player learning behaviors and iteratively plays the game through end-to-end functionality (Input: game image frame; Output: game action) without any manual feature extraction and intervention. The architecture of LSTM-Testing shown in
Figure 1 is developed based on [
9] and involves five logic gates and 2 memory pools including an input gate, convolutional gate, forget gate, training gate, output gate. Furthermore, short-term memory pool, and long-term memory pool are added to emulate gamer behaviors, including (a) how to play a game based on long-term memory and (b) how to relearn it based on short-term memory when a gamer forgets how to play it.
Four phases of 11 steps of LSTM-Testing, as shown in
Figure 1, are adopted: (1) Acquire Sample, (2) Extract Feature by Deep Neural Network, (3) Review by LSTM, and (4) Action and Summarize the Testing. Furthermore,
Figure 1 demonstrates three working flow: action decision flow, learning flow, and memorizing flow. The action decision flow (red flow) is an iterative flow consisting of steps 1, 2, 3, 4, 5, 6, 10, 11, and then back to step 1. The action decision flow decides what gameplay has the highest possibility to complete a game. The learning flow (blue flow) is also in iterative flow consisting of step 9.1 and step 9.2. The learning flow is an independent background thread that decides what gameplay decisions are picked up for reviewing periodically. One training cycle means a game session (e.g., playing until win or loss), and a cycle owns several times of reviewing. The memorizing flow is a sequential flow consisting of steps 7 and 8 to decide which sample should be stored in and drop from the short-term memory.
The detailed operations of each phase are as follows.
3.1. Phase 1: Acquiring Sample
In the first phase, LSTM-Testing screenshots video frame as an input image to the input gate as shown in the top-left side of
Figure 1.
Figure 2 presents the hardware settings: first to prepare a suitable testing room, projector, and project screen, then to set up a webcam and computer with LSTM-Testing installed, finally to run the game, project the game video frame on the project screen, and take a screenshot of the frame by the webcam. The software platform used by LSTM-Testing is developed by Python 3.8.3, and TensorFlow GPU 2.2.0 on Windows 10 platform.
3.2. Phase 2: Extracting Feature by Deep Neural Network
In the second phase, LSTM-Testing extracts features from the screenshot image by deep neural network. The second phase consists of steps 2~6 as shown in the top-right corner of
Figure 1.
Steps 2 and 3 use input gate to aggregate continuous pictures as a sample. The input gate owns a screenshot queue to store
k screenshots. After one screenshot taken in Step 1, the input gate pops the oldest frame and pushes the new one into its queue, then the input gate combines the screenshots in the queue as a sample of a gameplay, and then it normalizes this sample to standard input (three-dimensional array) for the convolution gate, i.e.,
. For example, in order to store the action of a gameplay moving right-ward, the input gate pops the oldest screenshot at time
t-4 from the queue and pushes the current screenshot at time
t into the queue, and then the input gate combines the screenshots in the queue at time (
t-3)~
t to form a gameplay sample of moving left-ward (
Figure 3a). The input gate then converts these images to two-dimensional (2D) arrays of pixel values (
Figure 3b), and finally aggregates these 2D arrays to a 3D array as a sample to demonstrate moving right-ward action (
Figure 3c). It should be noted that the LSTM-Testing does not collect all video frames of a game but only collects the frames based on the game testing scenario (e.g., eye strain or different hardware requirements). For example, LSTM-Testing may only collect 20 frames per second (one frame per 50 milliseconds) to emulate the game experience of a gamer with high eye strain, given that this game can support 120 frames per second for better flicker fusion experience.
In steps 4~6, LSTM-Testing applies the convolutional gate to reduce the sample size, which can lower the computational complexity during the training process. The convolution gate consists of convolution, pooling, and fully-connected operations.
The convolution operation in step 4 attempts to extract targeted features from the origination sample and filter out unnecessary noise by calculating the input sample
with multiple vectors of weight
and bias
. The vector of weights and the bias are called a filter, and this filter represents feature extraction of the input sample. As shown in
Figure 4,
K filters are first selected in this convolutional operation, and each filter
k contains a weight
(
matrix) and bias
(
matrix). Then, the sample
is convolutional calculated with each filter by equation (1), extracting a convoluted sample
(
matrix):
where
d is the sliding distance (called stride) that a filter attempts to decrease the overlay extracting cells process.
Figure 5 demonstrates an example of different strides with
(
matrix) and
(
matrix). The number of overlay cell in the feature extraction process with a stride of one is two, and the extracted
will be a
matrix. On the other hand, the number of overlay cells in the feature extraction process with a stride of one is one, and the extracted
will be a
matrix. The
therefore shrinks when the stride is set to two from one. The game tester can choose to decrease the size of
and lower the computational complexity with the trade-off of learning speed.
Figure 6 shows an example of a convolution operation to transform a 7 × 7 array to a 3 × 3 array by 5 × 5 filter and stride = 2. At first, the 5 × 5 array in the top-left corner of the original array is picked up, multiply the filter (element by element), and fill it in the top-left corner of the new array (
Figure 6a).
Figure 6b follows the same principle to fill the new array.
The Pooling operation in step 4 reduces the scale of
by combining the data clusters into one single cluster.
Figure 7 shows the pooling operation that first splits the
into U samples, then divides each sample into different clusters, and finally combining the cluster into one value. Two combination methods, max-pooling and average-pooling, are usually adopted. The max-pooling picks up the biggest value from the cluster, and the average-pooling calculates the average value of the cluster.
Figure 8 demonstrates an example of a pooling operation to transform a 4 × 4 array to a 2 × 2 array by using max-pooling principle with 22 filter and stride = 2. At first, the biggest one in the top-left corner is picked up, which is 9, and filled it in the top-left corner of the new array (
Figure 8a).
Figure 9b–d follows the same principle to fill the new array.
The fully-connected operation in step 6 aggregates information from
that matters the most and then generates a short-term memory at time
t, namely
, as the input for step 7.
Figure 9 presents the fully-connected operation that first flattens the
to a one-dimensional array
, and then executes the fully-connected calculation by Equation (2):
where
is the short-term memory converted from this sample,
is the weight vector,
is the bias vector.
3.3. Phase 3: Review by LSTM
In Phase 3, LSTM-Testing adopts long/short-term memory to emulate gamer learning behaviors. As steps 7~10 shown in the center part of
Figure 1, LSTM-Testing stores the short-term memory
into the short-term memory pool
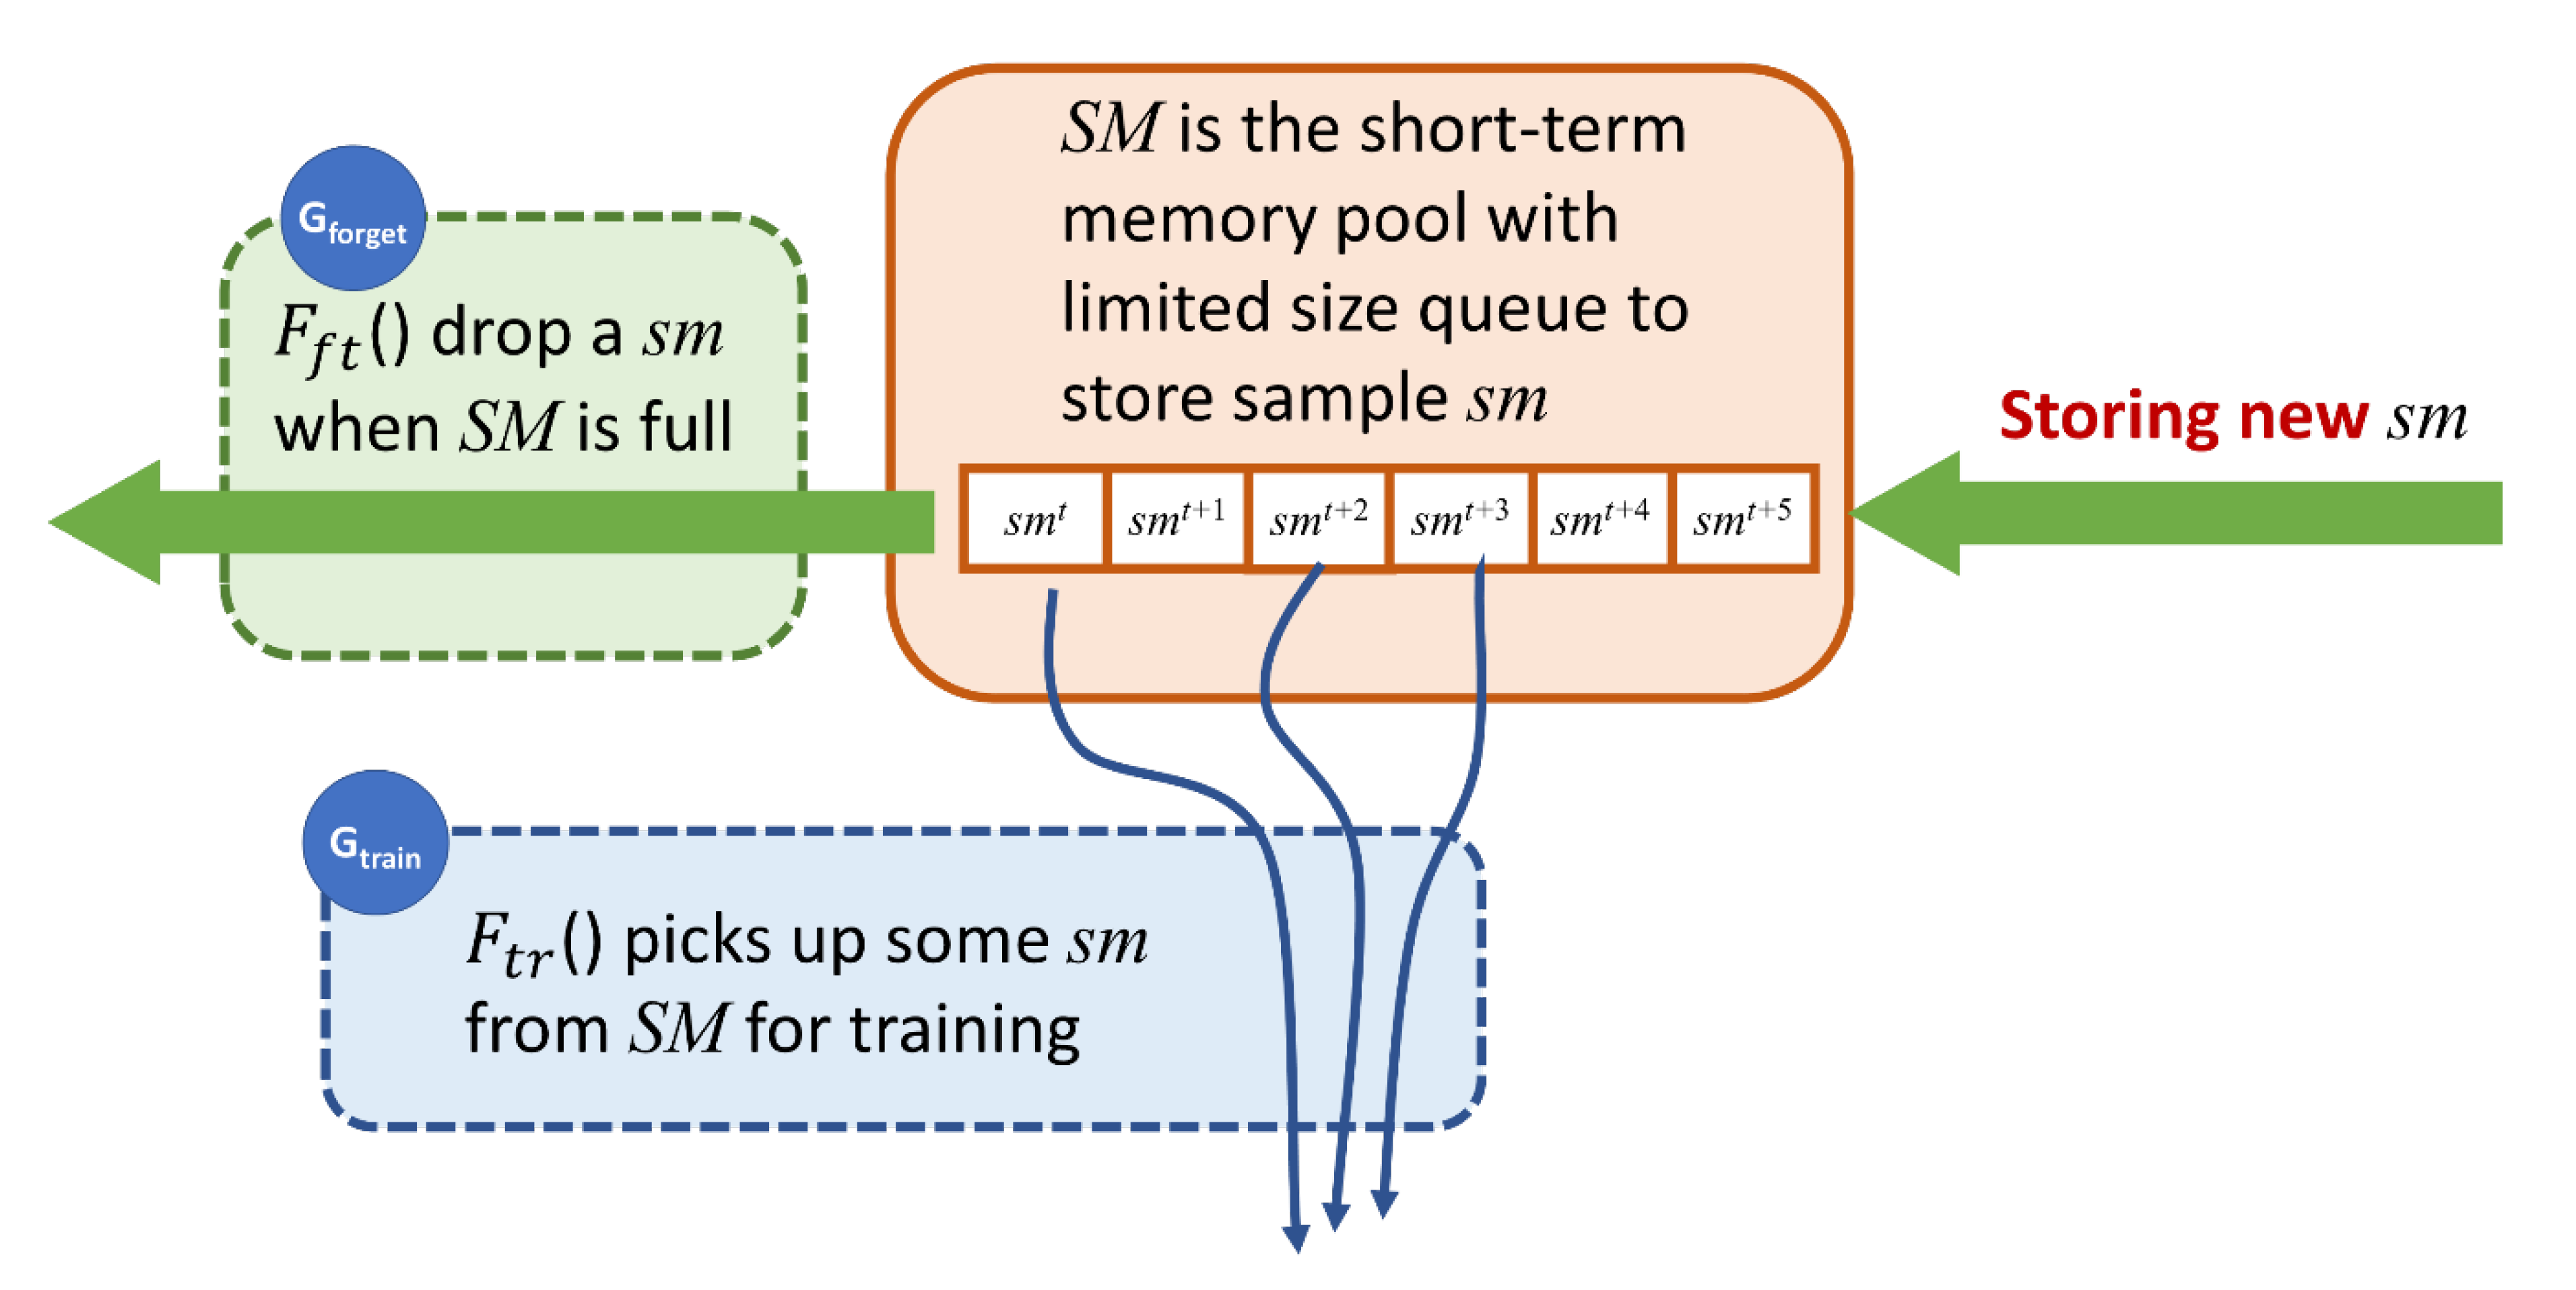
for the following training. The training strategy is the learning strategy that what gameplay decisions are kept in the short memory queue for periodical reviewing and, on the other hand, what gameplay decisions are unnecessary and dropped from the short memory queue. The learning strategy designed in this study is reviewing the newest decision and drop the older ones. That is, the decisions made are kept in the short memory queue and pick up periodically for training, and the oldest decision will be dropped when the short memory queue is full. As shown in
Figure 10, the former is controlled by the forget gate
, and the latter is controlled by the training gate
.
The forget gate manages samples in the short-term memory pool. That is, the forget gate determines which sample is valuable and should stay in the pool for training gate, and drops the sample when it is no longer usable, according to
as shown in
Figure 11.
The training gate applies a stochastic approximation method, which interactively loads samples in the short-term memory and then updates the long-term memory
by optimizing a differentiable objective according to
. As shown in
Figure 12, in this study,
applies Adaptive Moment Estimation [
10] that evaluates averages of both the gradients and the second moments of the gradients to iteratively optimizing the objective function.
Then, step 10 calculates the probability array
to demonstrate the probability of z possible gameplays to complete the game. The calculation is defined by:
where
is the bias vector.
3.4. Phase 4: Action and Summarize the Testing
Step 11 picks up the action with the highest probability from the result A of the output gate. LSTM-Testing then triggers the corresponding keyboard/mouse event and go back to step 1 iteratively. After acquiring sufficient testing results according to the testing plan, LSTM-Testing then summarizes “learning time to complete a game” as the dependent variable, “game design” as the control variable.
3.5. The LSTM-Testing Parameter Setting in This Study
The design of these logic gates can be adjusted according to the complexity of games. The more complex the gates, the better performance it achieves. However, the training time and computation time is getting higher for a deeper network, the game tester management has to gauge the trade-off between performance and computation-cost.
The LSTM-Testing settings for the following testing case in this study are presented in
Figure 13. LSTM-Testing first screenshots each gameplay as the input, and it uses 4 continuous screenshots as a sample of combination gameplays. The standard input size is a 3D array (80
80
4) for the following steps. LSTM-Testing adopts two combinations of convolution and subsampling for feature extraction. The Adaptive Moment Estimation then calculates the probabilities of possible gameplay actions. Then LSTM-Testing chooses the action with the highest probability to complete the game. The size of short-term memory is 50,000, the training gate
randomly selects 128 samples from the short-term memory for training, and the forgetting gate
drops the oldest sample in the short-term memory when the queue of short-term memory is full.
4. LSTM-Testing Evaluation: Pacman Game Testing
4.1. Environment Settings
This section uses a classic and popular casual game, i.e., Pacman [
11], as a case study to ensure that LSTM-Testing can replace manual testing to a certain extent. Pacman is a classic and popular casual game developed by Namco Bandai Games Inc. in 1980. Three different difficulties of mazes shown in
Figure 14 are applied in this evaluation. The testing results between LSTM-Testing and manual testing are compared by using learning time as the control variable, game design as the independent variable, and time to complete game as the dependent variable.
The feedback setting is (1)-1 point when Pacman does not eat a bean in a gameplay, (2)-10 points when Pacman eats a bean, and (3)-10 points when Pacman is hunt by a monster. Each maze is tested by LSTM-Testing for 150,000 games including the games that eating all beans or failing to eat all beans.
Regarding the manual testing, each maze is tested by three testers who never play Pacman, and each tester has to finish 150 games including the games that eating all beans or failing to eat all beans.
4.2. Experiment Results
Figure 15 demonstrates the results of LSTM-Testing and Manual-Testing regarding different difficulties of mazes.
First, considering the order of difficulty of three maze types, as shown in
Figure 15a, On the other hand, manual-testing enters the steady-state to eat all beans at about 80, 100, 120 games for the “maze with 2 holes”, “maze with 1 hole”, and “maze with no hole”. The order of the maze difficulty is, from easy to difficult: “maze with 2 holes”, “maze with 1 hole”, and “maze with no hole”.
Figure 15b demonstrates that LSTM-Testing enters the steady-state to eat all beans at about 40,000, 60,000, 80,000 games for the “maze with 2 holes”, “maze with 1 hole”, and “maze with no hole”. This means that LSTM-Testing suggests that the order of the maze difficulty is, from easy to difficult: “maze with 2 holes”, “maze with 1 hole”, and “maze with no hole”. Therefore, the result of LSTM-testing shows the order of the maze difficulty matches that of manual-testing.
On the other hand, considering the learning rate of the casual player to the different mazes, we design a Game Learning Rate Similarity algorithm (GLRS) to evaluate the similarity between the results of manual-testing and that of LSTM-Testing.
Figure 16 shows that GLRS consists of three steps. First, GLRS normalizes the testing time index of Manual-Testing and LSTM-Testing data sets to the range 0 to 1, since their testing times are quite different. Second, GLRS selects k time-series samples with the same interval from Manual-Testing and LSTM-Testing, respectively, and to build corresponding vectors to calculate similarity. In step 3, GLRS applies cosine similarity method [
12] to compare the testing result between Manual-Testing and LSTM-Testing. Cosine similarity is widely applied to estimate the similarity between two non-zero vectors by measuring the cosine of the angle between the two vectors. The cosine of 0° means the similarity is 100% of the two vectors, and it is less than 100% for any angle in the interval (0, π] radians. As the result calculated by GLRS, the game learning rate similarity of Manual-Testing and LSTM-Testing is 97.60%.
From the above evaluation, the experiment results support the argument that LSTM-Testing can replace manual testing to a certain extent.
5. Implications of LSTM-Testing
Game leveling provides new challenges and difficulty to keep player’s interest high in a game. However, manually testing different leveling designs is difficult due to two reasons. First, we cannot stop game testers spontaneously learning higher gameplay skills, and their skill is getting better in-game testing procedures. This leads that a high-skilled tester, from a beginner’s viewpoint, hardly objectively evaluates the reasonability of leveling from easy to hard. The second reason is the game tester may feel paralyzed about the game leveling after numbers of game testing. This causes the tester may think the leveling is indifferent and boring.
In order to overcome the problem of manual-testing mentioned above, LSTM-Test can evaluate different game leveling design by using the trained model in different levels as the control variable, game design as the independent variable, and time to complete game as the dependent variable. This means LSTM-Testing can force the AI to stop learning how to play the game in order to acquire objective and quantitative testing data between different levels. LSTM-Testing can also emulate the game players with varying game skills to acquire corresponding testing data in different game leveling path. Therefore, the game designer can construct a reasonable leveling path and guide the player towards the goal of the level and preventing confusion, idling, and boring, which may cause the player to leave the game.
We also provide a case study to show how LSTM-Testing to explore an unnecessary trap of a game design.
Four case studies in the following subsections demonstrate how to apply LSTM-Testing to evaluate the reasonability of the game leveling.
5.1. Ensure Reasonable Leveling Path Design
This subsection described how LSTM-Testing evaluates the reasonability of leveling between mazes with a different number of holes.
As
Section 4 shows that order of the maze difficulty, LSTM-Testing then explores the reasonable leveling path from one maze to another maze by using a trained model in the different maze as a control variable, game design as an independent variable, and time to complete game as a dependent variable. Therefore, the test cases are:
- →
Leveling Path A: from “maze with 2 holes” to “maze with 1 hole”. LSTM-Testing first load the trained model which can eat all beans in “maze with 2 holes”. Then, LSTM-Testing applies this trained model to play the “maze with 1 hole” and observes the training time to eat all beans.
- →
Leveling Path B: from “maze with 2 holes” to “maze with no hole”. LSTM-Testing first load the trained model which can eat all beans in “maze with 2 holes”. Then, LSTM-Testing applies this trained model to play the “maze with no hole” and observes the training time to eat all beans.
- →
Leveling Path C: from “maze with 1 hole” to “maze with no hole”. LSTM-Testing first load the trained model which can eat all beans in “maze with 1 hole”. Then, LSTM-Testing applies this trained model to play the “maze with no hole” and observes the training time to eat all beans.
The evaluation result is shown in
Figure 17. The training time of leveling path A (orange line), B (blue line), and C (green line) are about 2000 games, 7000 games, and 5000 games, respectively. It should be noted that the leveling path A and C own high percent, 60% and 80% respectively, to eat all beans at the beginning of the training, compared to path B cannot eat most beans at the beginning of the training. These phenomena indicate that:
First, the leveling path C might be a good leveling design that provides new challenges and difficulty to keep player’s interest high in this maze and also guides the gamer to develop a higher skill to eat all beans.
Second, the leveling path A and C might be too easy and unnecessary for the gamer, since LSTM-Testing can acquire a high percent to eat all beans at the beginning of the training.
Third, path C requires fewer games than paths A and B is due to that the player can apply his learned skill, i.e., not using “hole” to dodge ghosts, to complete the game without hole of next level. However, the player of the path B and C confronts difficulties to complete the game with one or no hole because he/she needs a hole to doge ghost that is learned from the previous level. Furthermore, path A requires fewer games than path B is because the player of the path A can still use the hole to dodge the ghost and the player of the path B cannot use the hole to doge the ghost.
5.2. Validate Game Difficulty Is Proportional to Level Scales
This subsection described how LSTM-Testing validates the argument that the maze difficulty is proportional to the maze size for the first-time gamer. The argument origins from that some game testers suggest that the bigger the size the maze is, the more beans this maze has, and the higher difficulty for the beginner to eat all beans. On the other hand, some game testers argue that the bigger size the maze is, the easier the beginner can dodge the chasing of the monster. However, there is still no sufficient quantitative testing results, to the best of our knowledge, to validate this argument.
The testing result is demonstrated in
Figure 18, where three different maze sizes, i.e., small maze (3 rows with 9 columns), median maze (5 rows with 11 columns), and large maze median maze (7 rows with 11 columns), are applied in this testing as shown in
Figure 19. The training time of small maze, median maze, and large maze to eat all beans are about 4000 games, 5000 games, and 16,000 games, respectively. This result supports the argument that the bigger maze size is, the more difficult the maze has. It also shows that the maze difficulty might be proportional to the maze size to a certain extent for the Pacman game. However, it should be noted that the difficulty of a game depends on the game design itself and may not be the proportional to the size of other games’ playground.
5.3. The Leveling of the Snake Game
In this experiment, we evaluate the leveling of the Snake Game [
13]. The basic Snake game is that a sole player attempts to eat beans by running into them with the head of the snake, as shown in
Figure 20. Each bean eaten makes the snake longer, so controlling is progressively more difficult. The increasing difficulty of eating one more bean is evaluated by LSTM-Testing in this subsection.
LSTM-Testing uses AI learning time as a dependent variable to quantitatively evaluate the Snake Game leveling design. That is, we attempt to observe how many games when the LSTM-Testing has learned to eat one bean, two beans, and three beans, respectively.
Figure 21 demonstrates that LSTM-Testing needs about 10,000 games to learn how to eat the first bean, given that success rate for 80% means LSTM-Testing has learned the skill. Then, LSTM-Testing needs about 20,000 games to learn to eat two beans, and that about 50,000 games to eat three beans. Therefore, this evaluation result can make a hypothesis that each leveling of the Snake Game is two times of difficulty comparing the previous level.
5.4. The Impact of Picture Background on the Game Difficulty: Encounter Unnecessary Trap
We design an experiment to observe the impact of picture background on game difficulty. The motive is that using pictures as the game background will increase the game difficulty because the object of the game will be obscured by the background and cause mistake of gameplay. However, there is no sufficient quantitative analysis to evaluate how much game difficulty a picture background increases. This experiment, therefore, uses the ping-pong game as a case study to observe the scale of rising difficulty of a picture background by using LSTM-Testing.
The experiment, as shown in
Figure 22, uses a simple Ping-pong game without a picture background as the control group (as shown in
Figure 22a), and uses a simple ping-pong game with a picture background as the experiment group (as shown in
Figure 22b). Then, we observe how many balls coming down when the LSTM-Testing has learned to return the ball.
Figure 23 demonstrates that the game without picture background needs about 35,000 balls to learn how to return the ball, given that the LSTM-Testing reaches 90% percent to successfully return the balls. However, the game with picture background needs about 43,000 balls to learn how to return the ball, which means the picture used in this test increases by 15% (43,000/35,000) difficulty. This is because the LSTM-Testing encounter an unnecessary trap that LSTM-testing cannot identify the white ball when this ball passes the playground with light color, as shown the position of ball near the nose of the dog. Therefore, this evaluation result can make a hypothesis that a game with a picture background does increase the game difficulty.
This experiment further evaluates the effect of learning strategy on returning a ball. The learning strategy means what gameplay decisions are kept in the short memory queue for periodical reviewing and, on the other hand, what gameplay decisions are dropped from the short memory queue. Three review strategies are evaluated in this experiment including (1) reviewing the newest decision which is the default setting, (2) reviewing the wrong decision, and (3) reviewing the correct decision. Reviewing the newest decision means the decisions made are kept in the short memory queue, and the oldest decision will be dropped when the short memory queue is full. Reviewing the wrong decision means the keeps the wrong decisions, which LSTM-testing makes, in the short-term memory queue, and drops the right decisions to return the ball when the queue is full. In contrast to reviewing the wrong decisions, reviewing the correct decision is to keep the right decisions in the queue and drop the wrong decisions.
The effect of learning strategy to return the ball, as shown in
Table 1, shows that reviewing the wrong decision is the most effective strategy than other strategies for the ping-pong game. The strategy of reviewing the wrong decision requires 33,000 times of trainings, which is the fewest training iterations to have 90% successfully return the ball. This is because, for the ping-pong game, the width of the bar to return the ball is shorter than the width of the bottom of the gameplay ground. This leading that, in a random fresh, the opportunities to make the correct decision to move the bar and catch/return the ball is fewer than that to lose the ball. The LSTM-testing then does not have sufficient learning opportunities since the short-term memory does not have enough samples of correct decisions.
6. Conclusions
The proposed LSTM-Testing is capable to objectively and quantitatively evaluate the reasonability of casual game design. The experiment result shows that the game learning rate similarity of Manual-Testing and LSTM-Testing is 97.60%, which supports that LSTM-Testing can replace manual testing to a certain extent. As the experiment demonstrated in
Section 4,
Section 5 and
Section 6, the most advantages of LSTM-Testing compared to the manual testing are: (1) to quantitatively evaluate the difficulty of different game design, (2) to ensure reasonable leveling path design, and (3) to validate the game difficulty is proportional to level scales.
Currently, LSTM-Testing is only applied to test the casual games. This study will extend the proposed LSTM-Testing to hard-core game testing and strategy training for Decision Makings of Project Management [
13]. On the other hand, however, the effectiveness of AI Software Testing procedure for the multiplayer game is still required.


