Article

Experimental and Kinetic Investigation on NO Reduction by Rice Husk Char and Catalytically with CO

College of Materials Science and Engineering, Beijing University of Technology, Beijing 100124, China
*
Author to whom correspondence should be addressed.
Appl. Sci. 2020, 10(19), 6715; https://doi.org/10.3390/app10196715
Submission received: 23 August 2020 / Revised: 16 September 2020 / Accepted: 22 September 2020 / Published: 25 September 2020

Abstract

:
Biomass char is accepted as an environmentally friendly energy resource, and is promising for NO removal in industrial furnaces. NO reduction with biomass char (rice husk) was investigated in a fixed-bed quartz reactor. The influence of CO concentration, reaction temperature, initial NO concentration, and char loading on the NO reduction were evaluated. The results showed that the overall NO reduction reaction was dominated by the direct reaction of NO with char without CO. Increasing CO concentration resulted in an enhanced catalytic reaction between NO and CO over the char surface and a decreased carbon consumption of char. With decreasing temperature, the influence of CO concentration on NO reduction was strengthened. Over the test temperature range, char provided a surface to catalyze the NO–CO reaction at excess CO/NO ratio. Increasing the initial NO concentration led to an increasingly significant influence on NO reduction with the enhanced CO/NO ratio. With increased char loading, the enhancement of NO reduction became unobservable for excess CO/NO ratio. Reaction orders of NO and activation energy for NO reduction by char were 0.71 and 60.21 kJ·mol−1, respectively, against 0.82 and 34.60 kJ·mol−1, respectively, for NO reduction by CO, catalyzed by char.
Keywords:
NO; biomass char; CO; kinetics

1. Introduction

Nitrogen oxides (NOx), one of the major air pollutants, contribute to the formation of photochemical smog and the depletion of ozone [1,2,3]. Selective catalytic reduction (SCR) and selective non-catalytic reduction (SNCR) by ammonia are the two typical methods for NOx removal [4,5]. However, ammonia is also classified as a major air pollutant. Ammonia slip from the denitration process can cause secondary pollution [6,7].
In recent years, it is found that biomass char, a major renewable energy source [8,9,10], can be effective in removing NO without ammonia [11,12]. The most likely mechanism of NO reduction using char can be described by the direct gasification reaction between NO and char [13,14,15,16,17] in:
C + NO → CO + 1/2N2
C + 2NO → CO2 + N2
and a catalytic reaction between NO and CO over the char surface [18,19,20]:
CO + NO → CO2 + 1/2N2
The heterogeneous NO reduction of char can be influenced by many factors, such as CO concentration, temperature, and initial NO concentration. These parameters have a strong effect on the carbon-consuming reduction and catalytic reduction mechanisms and on determining which mechanism dominates. Cheng et al. [21] thought that the presence of CO enhanced the NO conversion over char. However, Wang et al. [22,23] noted that the influence of CO was bidirectional, and excessive CO did not have any further appreciable effect on the NO reduction. Furusawa et al. [24] investigated the coal char–NO interaction and found that, at low temperatures (<800 °C), the overall reaction scheme could be dominated by catalytic reaction (3). At higher temperatures, the direct gasification reactions (1) and (2) became obvious. Wang et al. [25] reported that at high temperature, the catalytic reaction over coal char was the dominant mechanism when the concentration of NO was reasonably lower than that of CO (i.e., CO/NO ratio >> 1). There are still inconsistencies among these research works. Furthermore, fewer studies systematically report the influence of these reaction parameters on heterogeneous NO reduction using biomass char with and without CO, which can vary in a wide concentration range.
Kinetics studies of the reaction between char and NO without CO present in the gas have been extensively carried out. The reaction of NO with char can be of first order [26,27,28] or fractional order [23,29,30] with respect to NO. The apparent activation energy of 23 kJ·mol−1 was reported by Chen et al. [31] and a higher value of 120 kJ·mol−1 was reported by Schonenbeck et al. [32], which mainly depends on the fuel type and the test conditions [33]. Compared with the sufficient kinetics studies of NO reduction by char, research on the kinetics of the char–NO–CO reaction is limited, especially for NO reduction with biomass char. Among the scarce kinetics studies, Zevenhoven and Hupa [34] pointed out that when wood char was used for NO reduction, the activation energy for char–NO–CO reaction was in a slightly higher range compared with the char–NO reaction.
In this work, rice husk biomass char—a byproduct in the pyrolysis of rice husk, which is the most common agricultural waste in China [35]—is used for investigation, considering that it is cost-effective and easily available [36]. Both experimental and kinetics studies of NO reduction with rice husk char were conducted, in the absence and presence of CO. The effects of CO concentration, reaction temperature, initial NO concentration, and char loading on the NO reduction using rice husk char were performed in a fixed-bed quartz reactor. In addition, the kinetic parameters, reaction order, and activation energy were also determined. Overall, through this paper, a reference that is expected to promote the industrial application of NO reduction using biomass char can be provided.

2. Materials and Methods

2.1. Materials

Rice husk char (from Jilin Province) was used in the experiment. Char samples were dried at 105 °C overnight and then were stored in a drier after being ground into an average particle size of 150 μm.
Table 1 shows the proximate and ultimate analyses (GB/T 212 and GB/T 476 National Standard, China) of biomass char. The specific surface area, pore volume, and pore size of rice husk were measured through the method of nitrogen Brunauer−Emmett−Teller (N2-BET) (TriStarII 3020, made by Micromeritics, Norcross, GA, USA). All samples were degassed at 350 °C for 4 h under vacuum prior to the measurement. Table 2 gives the results of BET analysis.

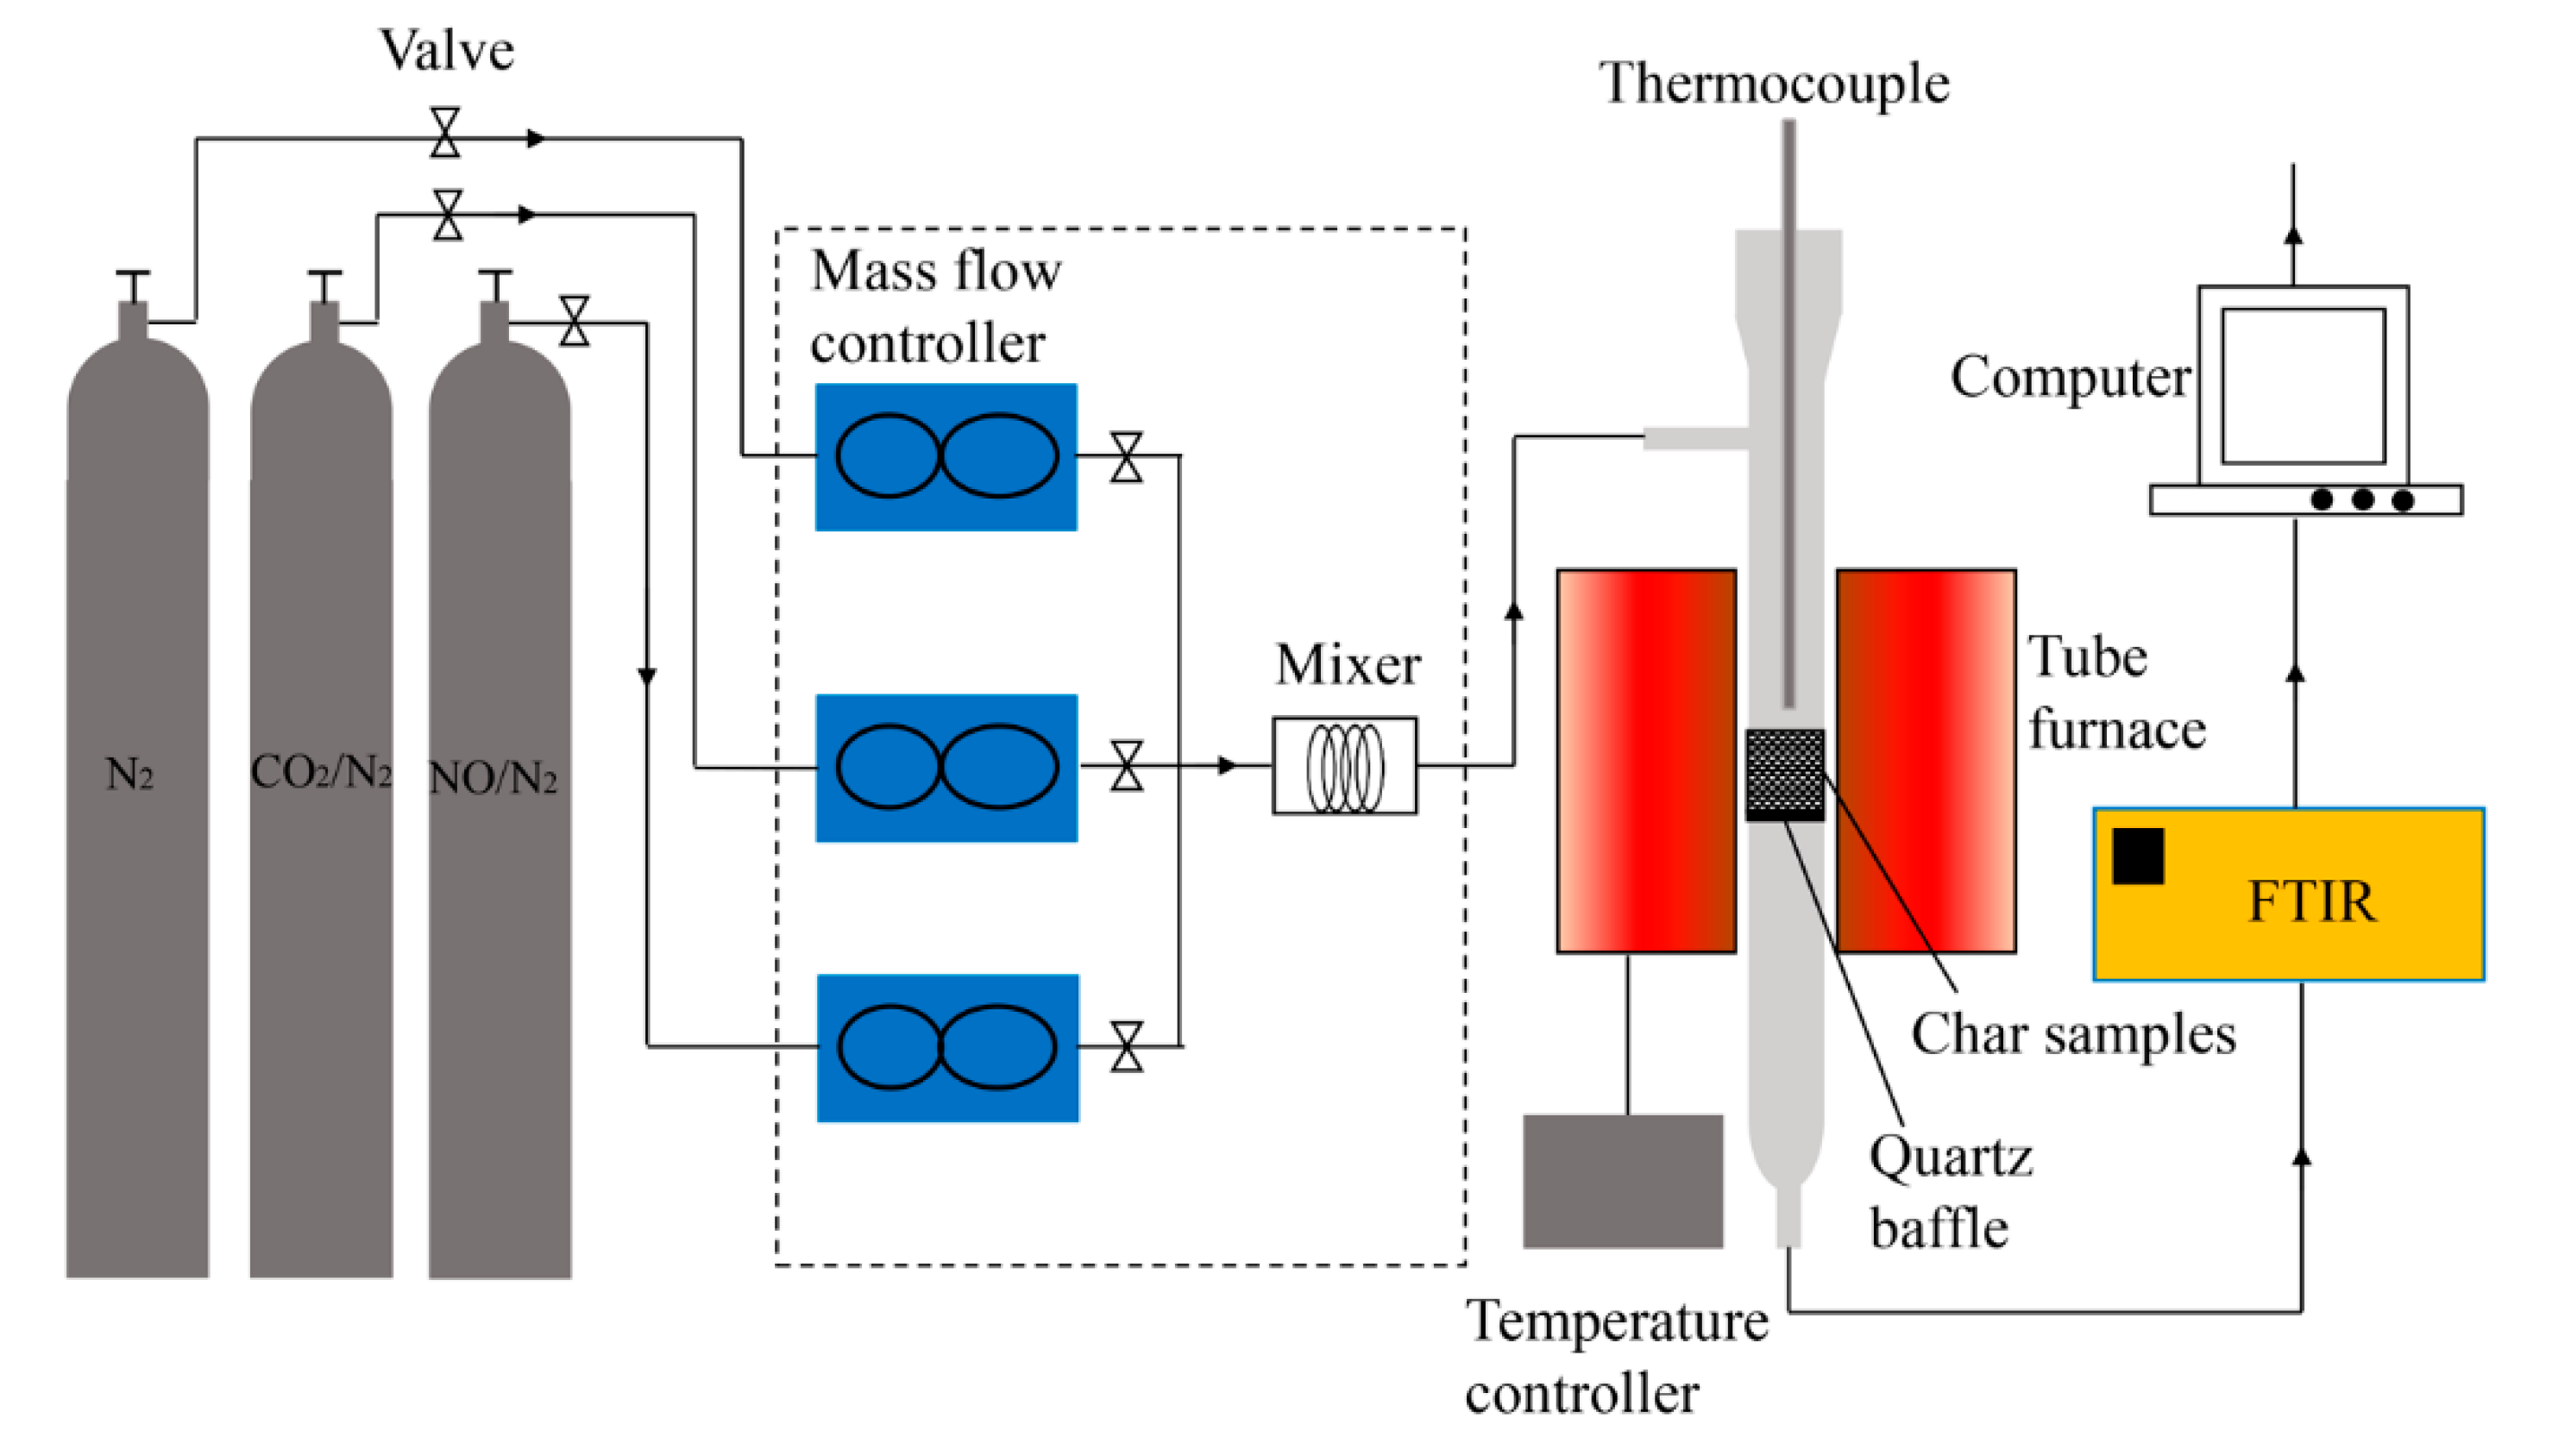
2.2. Experimental Set-Up and Procedure

The experiment was performed in a fixed-bed reactor system, as shown in Figure 1. The quartz reactor tube was inserted in the tubular furnace, with a porous sintered quartz plate in the middle of the reactor. During experiments, char samples (0.02 or 0.2 g) were previously mixed with 5 g quartz sand of the same size as the char. The main purpose of the sand was to prevent the aggregation of char particles. A shallow layer of quartz wool tiled on the porous quartz plate was used to hold the mixture. Once the desired temperature was reached, the inert flow of N2 was switched to the reactant gas mixture (NO/N2 or NO/CO/N2) passing through the char samples. For each experiment, the total flow rate was 450 mL/min. An infrared analyzer (BRUKER, Nasdaq, GA, USA) was used to measure both the inlet and the outlet concentration of gas species (CO, CO2, and NO).
For studying the effect of the CO concentration, experiments were carried out at 900 °C, with CO concentration varying from 400 to 4000 ppm. In order to evaluate the influence of reaction temperature, experiments were conducted in the range of 750 to 900 °C at the same NO concentration (400 ppm). The influences of both the initial NO concentration and the char loading on the NO reduction of char were also examined with the concentration ratio of CO and NO (CCO/CNO) ranging from 0 to 10.
The reduction ratio of NO was calculated as
XNO = (CNO,in − CNO,out)/CNO,in
where CNO,in (ppm) and CNO,out (ppm) are the inlet and outlet concentration of NO, respectively.
A blank test without char sample was conducted with a high concentration of CO (1000 ppm NO, 6% CO) at 900 °C. No detectable reduction of NO was found, indicating that the quartz reactor, quartz wool and silica sand were all inert under the present conditions. This agreed with the experimental results obtained from previous investigation [19].

3. Results

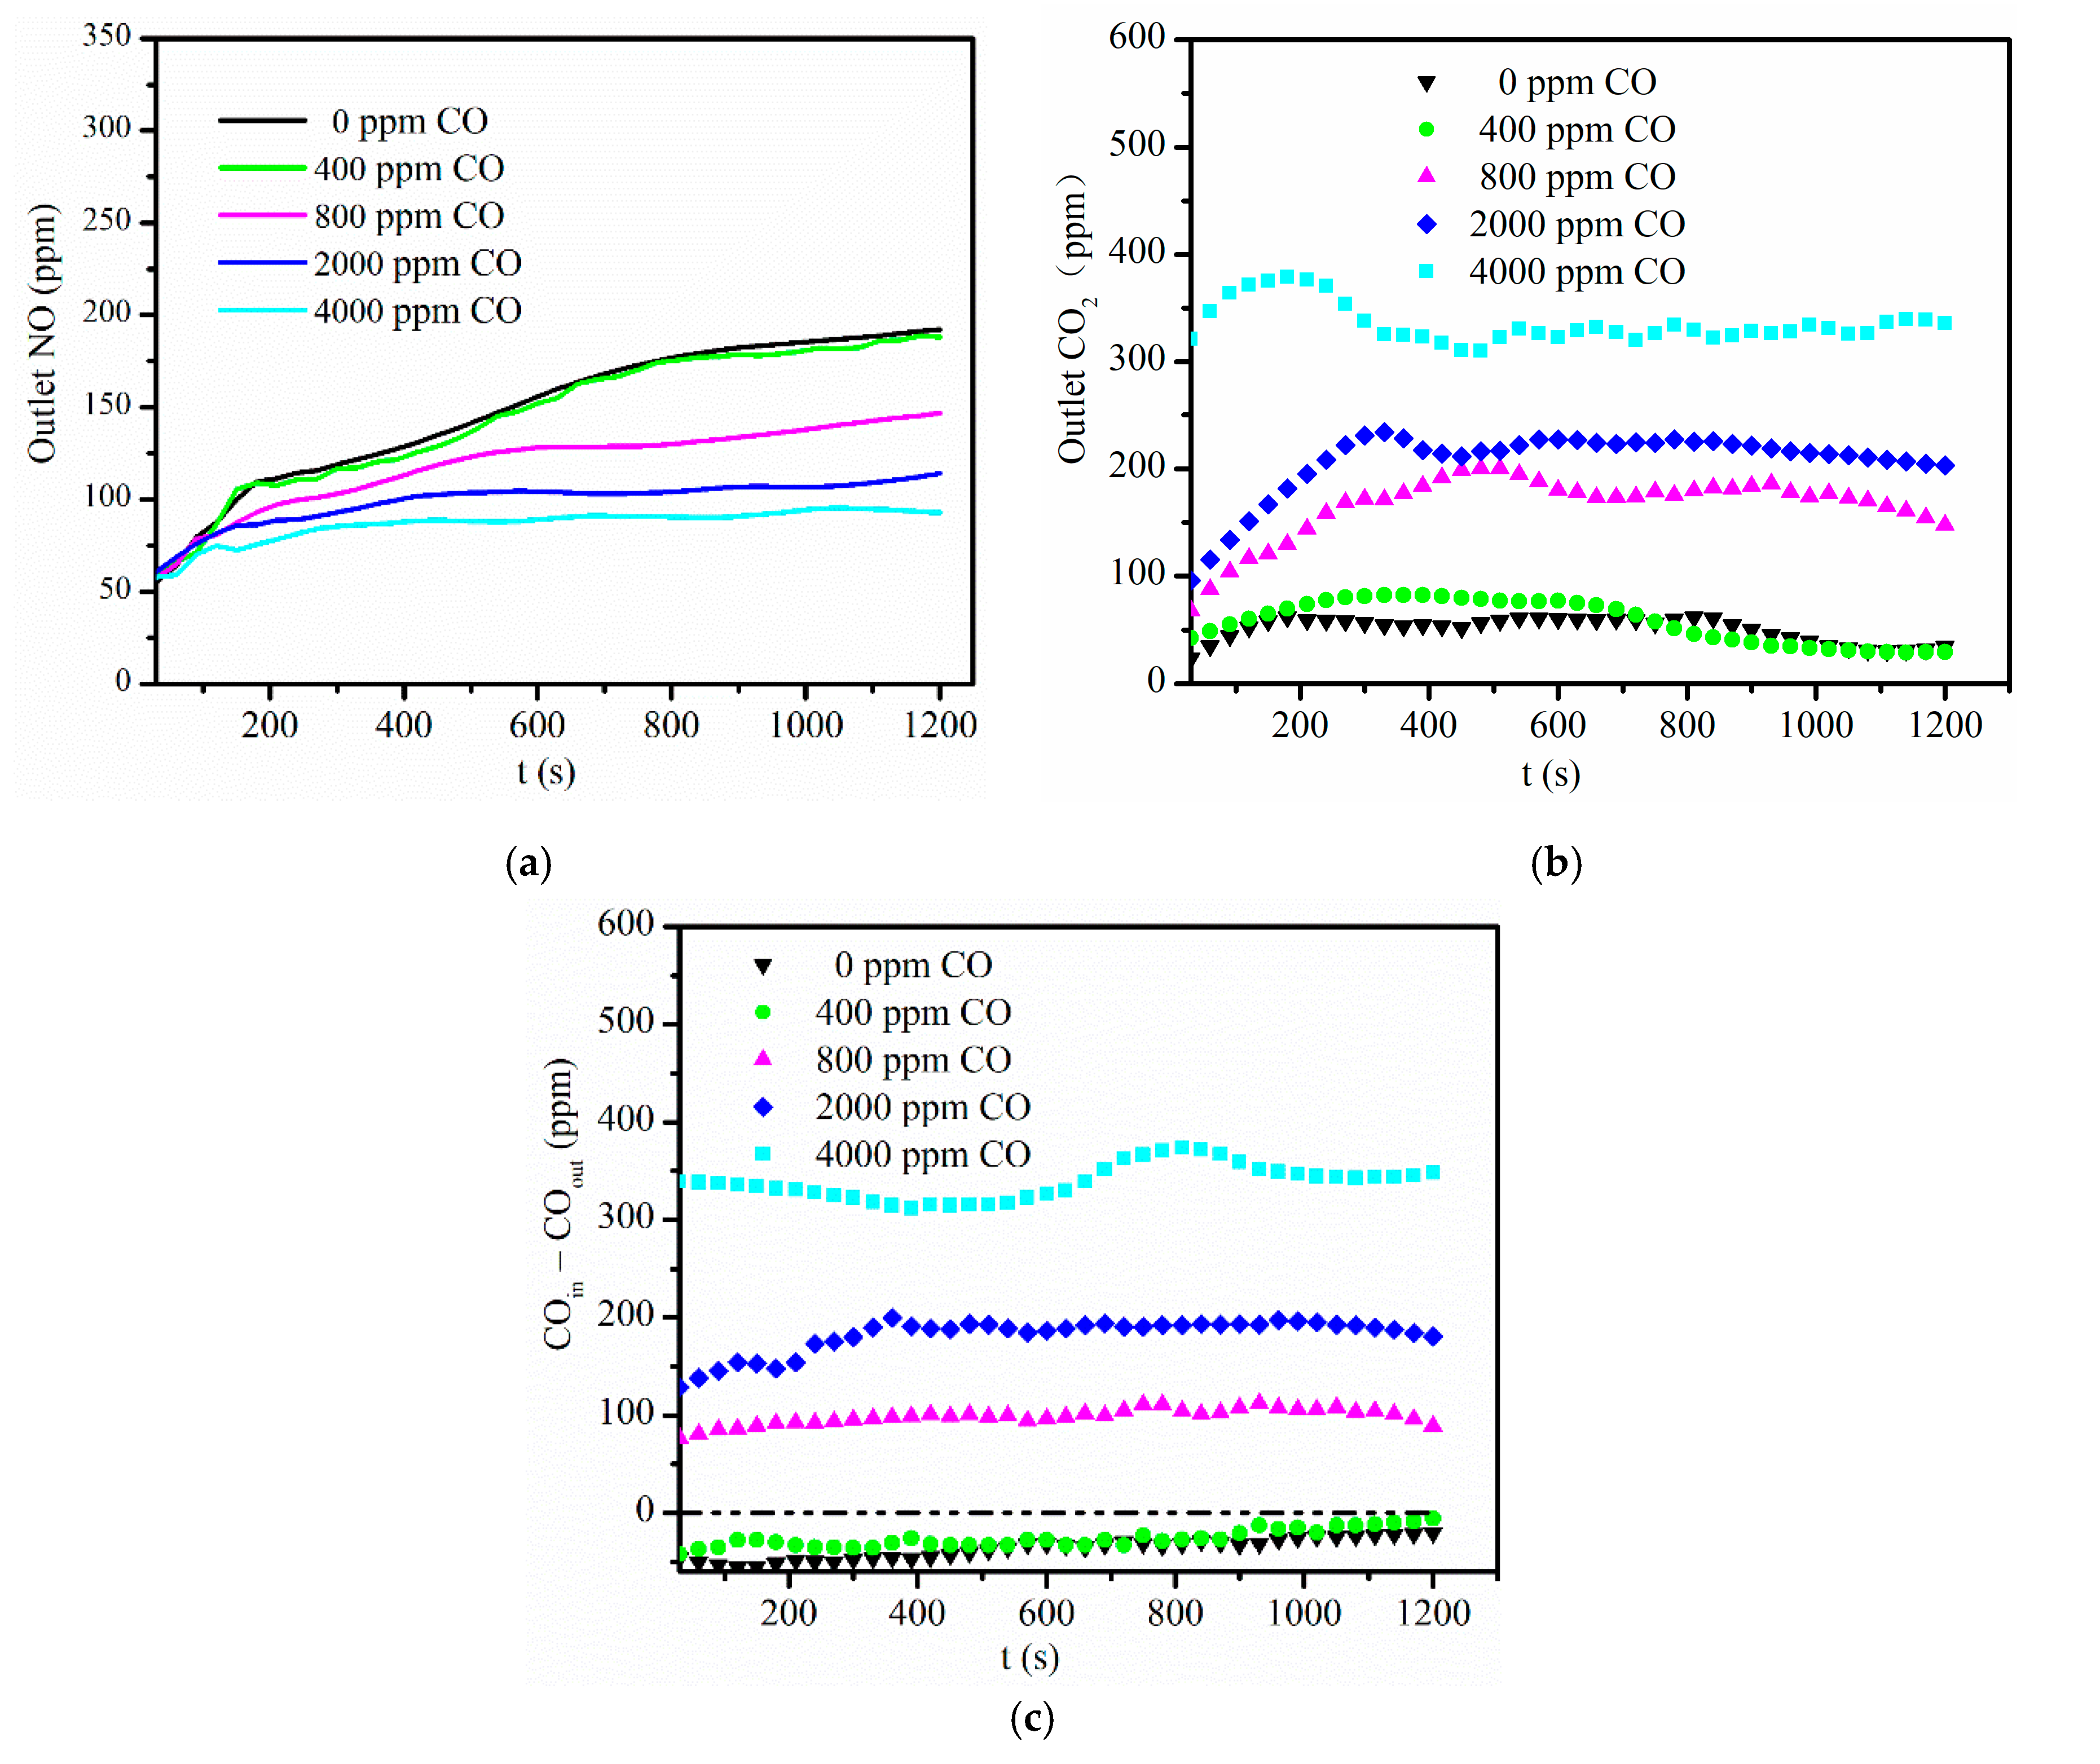
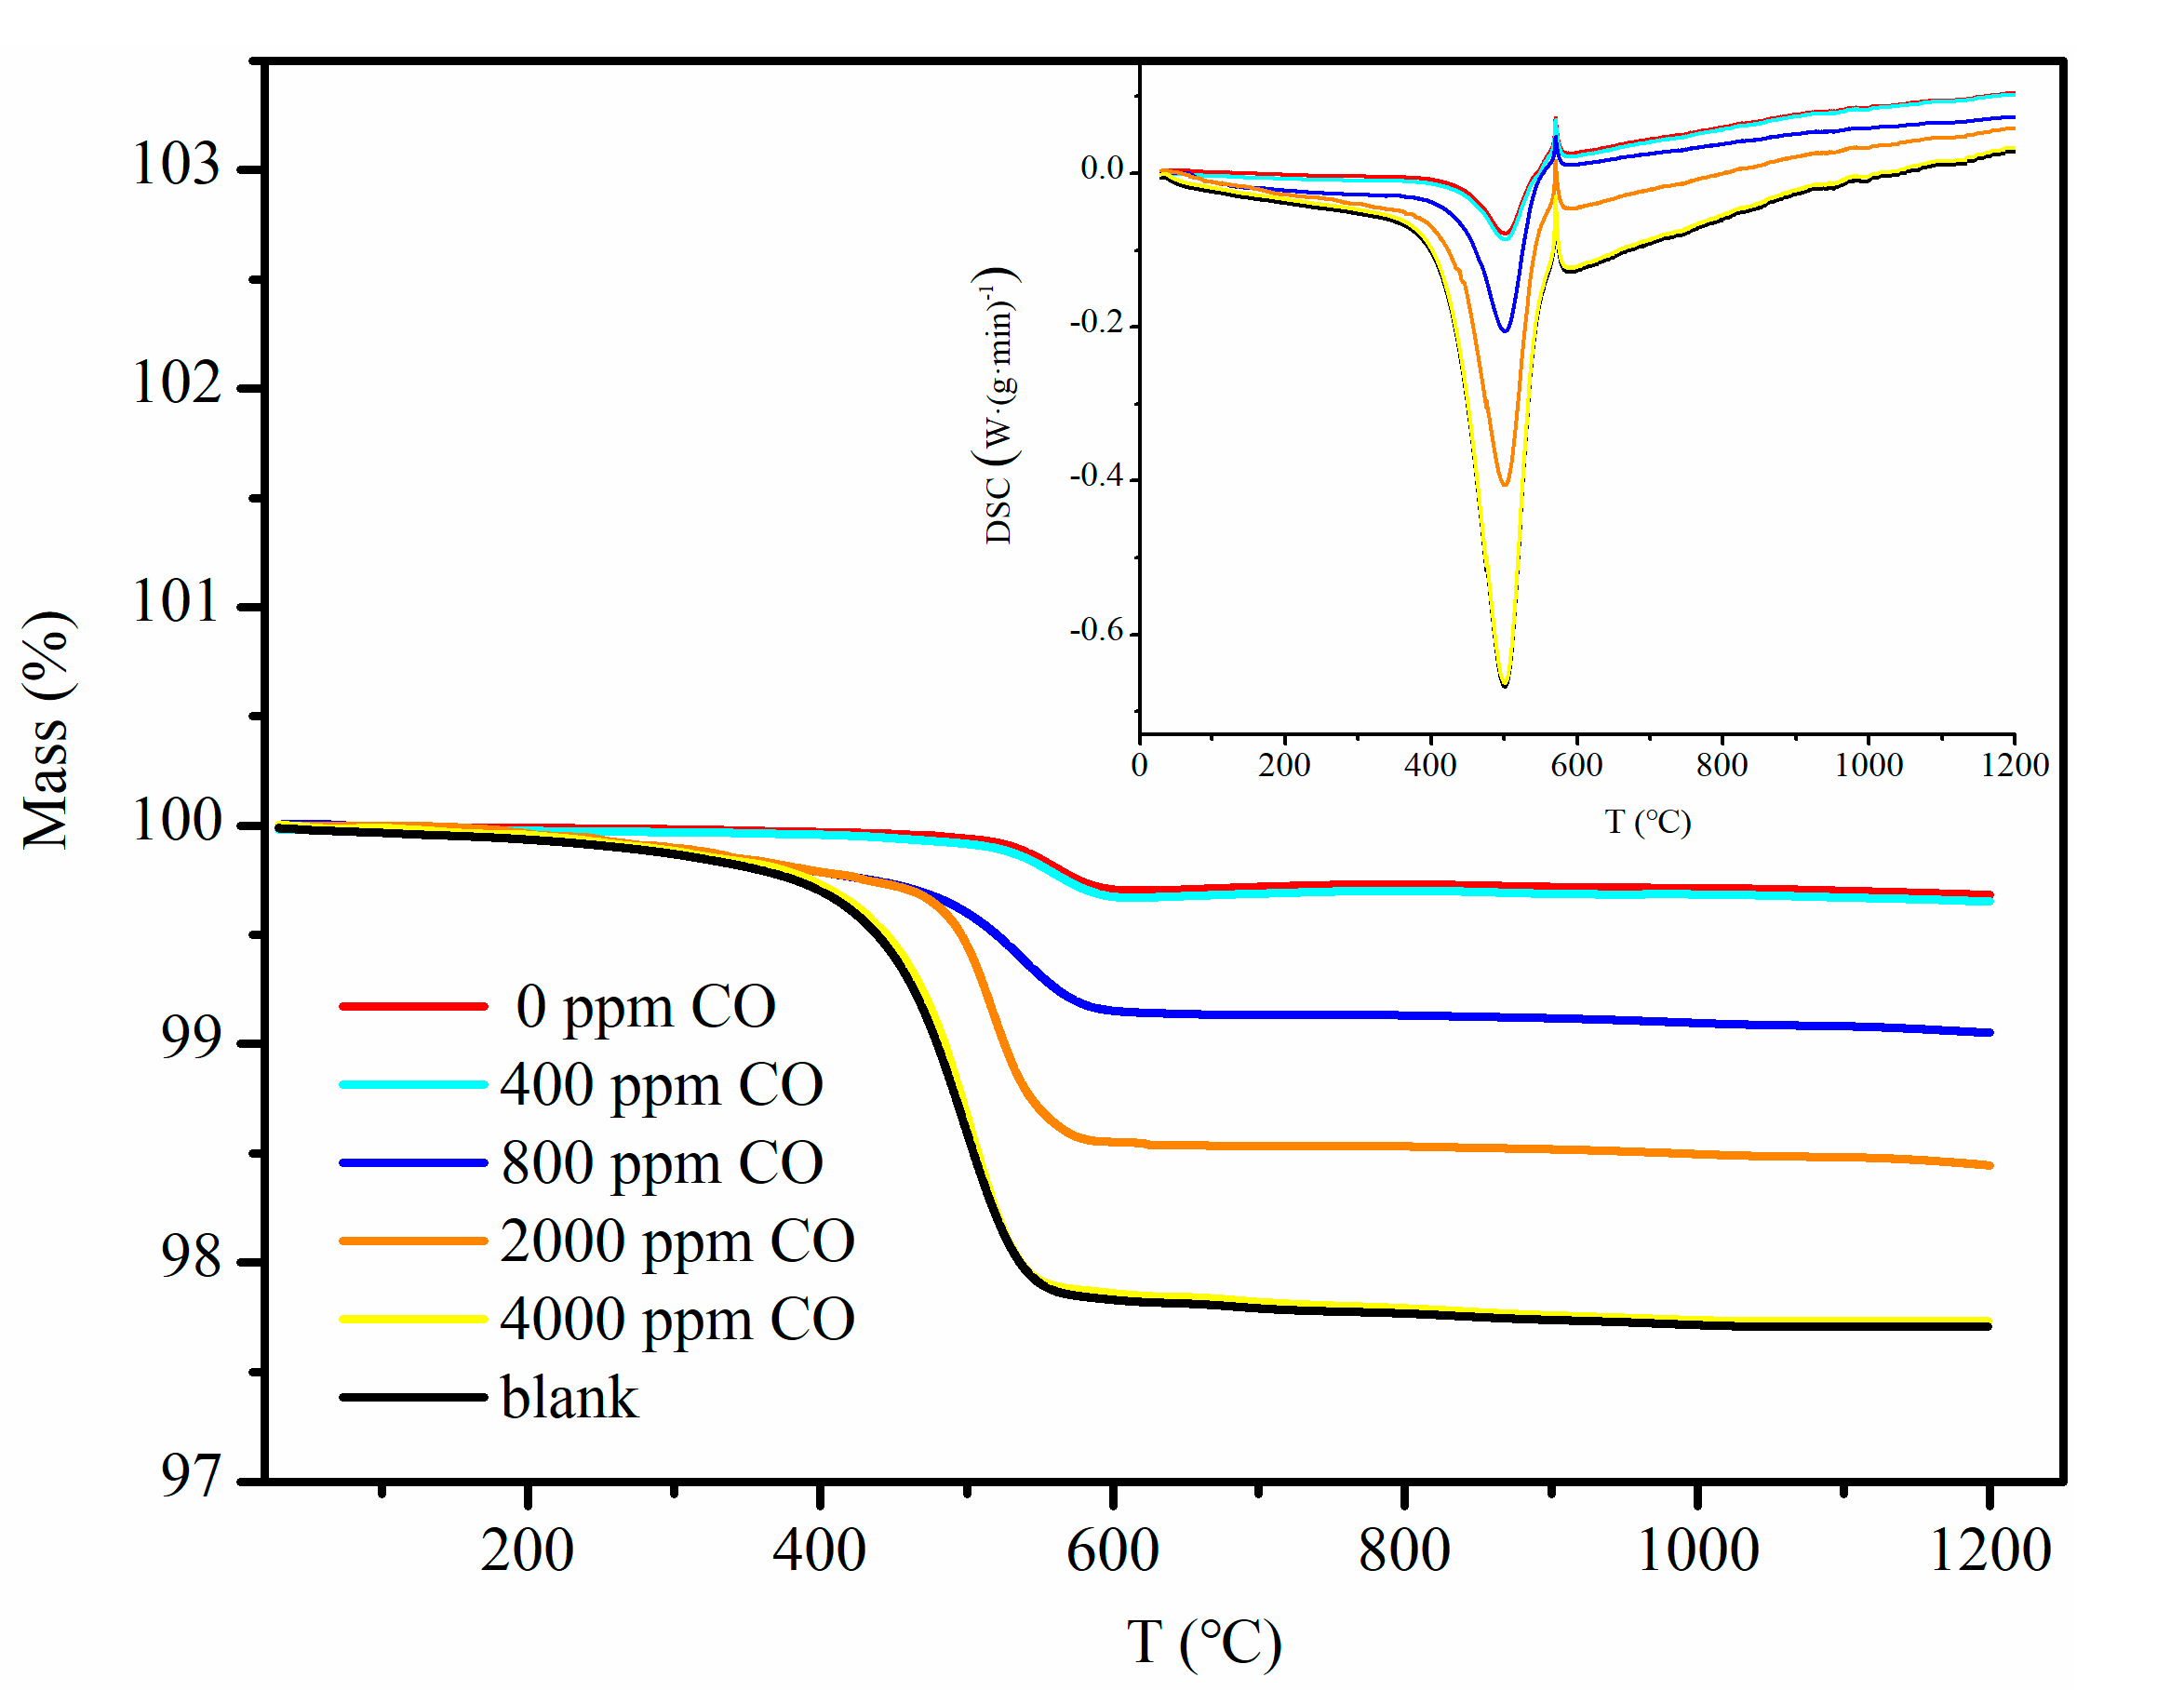
3.1. Effect of CO Concentration

Figure 2 presents the influence of CO on the evolution of outlet NO concentration and the amounts of CO consumed and CO2 formed with time, for 400 ppm NO at 900 °C. As shown in Figure 2, a decrease in the outlet NO concentration and an increase in the amount of CO2 formed and CO consumed could be found when increasing the CO concentration. The additional CO enhanced NO conversion, mainly due to the reaction between CO and the surface complexes C(NO), C(N-NO), and C(O) [37]:
C(NO) + CO → C(N) + CO2
C(N-NO) + CO → C(N-N) + CO2
and the creation of more free carbon sites C* via reaction (7) [38,39].
C(O) + CO → aC* + CO2
It should be noted that no obvious variations were observed with a low concentration of CO (400 ppm), compared to the case without CO. This indicates that the catalytic reaction (3) would be ignored if CO was only present as the product of the gasification reaction (1) under the present experimental condition. Still, the NO–CO reaction over char was insignificant when the concentration of additional CO was lower than that of NO. A consistent result was also found for other chars [24,40].
To examine the effect of CO concentration on carbon consumption, combustion tests of char residues after reduction reaction were performed by thermogravimetric (TG) analysis with a heating ramp of 10 °C min−1. The equipment used was the STA Instruments model 490C. In this way, carbon mass (%) could be analyzed qualitatively against the effects of ash and quartz sand. The same amounts of residues after the experiments of NO reduction with different CO concentrations were weighed for TG analysis. A maximum temperature of 1200 °C was set to ensure the complete combustion of char. A blank test, using fresh mixtures of char and sand that were well-mixed, was carried out as well. Figure 3 shows the TG curves for the char residues, as well as the differential scanning calorimetry (DSC) curves that could be used for analyzing the exothermic heat of char samples. It could be seen that both the mass loss of char and exothermic heat were increased with the enhancement of the CO concentration, indicating the higher carbon content remaining in char residues. The reaction between CO and the oxygen in the C(NO), C(N-NO), and C(O) complexes was accelerated by increasing the CO concentration, leading to a diminished effect of gasification reactions (C(O) → CO + bC*, C(O2) → CO2 + dC*). The gasification reactions were also carbon-consuming reactions considering that new active sites were produced by gasifying carbon atoms. Thus, the presence of CO could make the carbon consumption slower [41]. In addition, the detailed values of mass loss of chars are given in Table 3. It can be seen that the mass loss of char with the maximum CO concentration (4000 ppm) was about the same as that of fresh one. This reveals that the carbon consumption was nearly zero under the present condition (CO = 4000 ppm, NO = 400 ppm), and char just provided a catalytic surface for NO–CO reaction. This was consistent with the findings obtained by Wu et al. [42]. These authors noted that the overall reaction became the catalytic reduction of NO by CO over a black liquor char at CO/NO = 6.1.

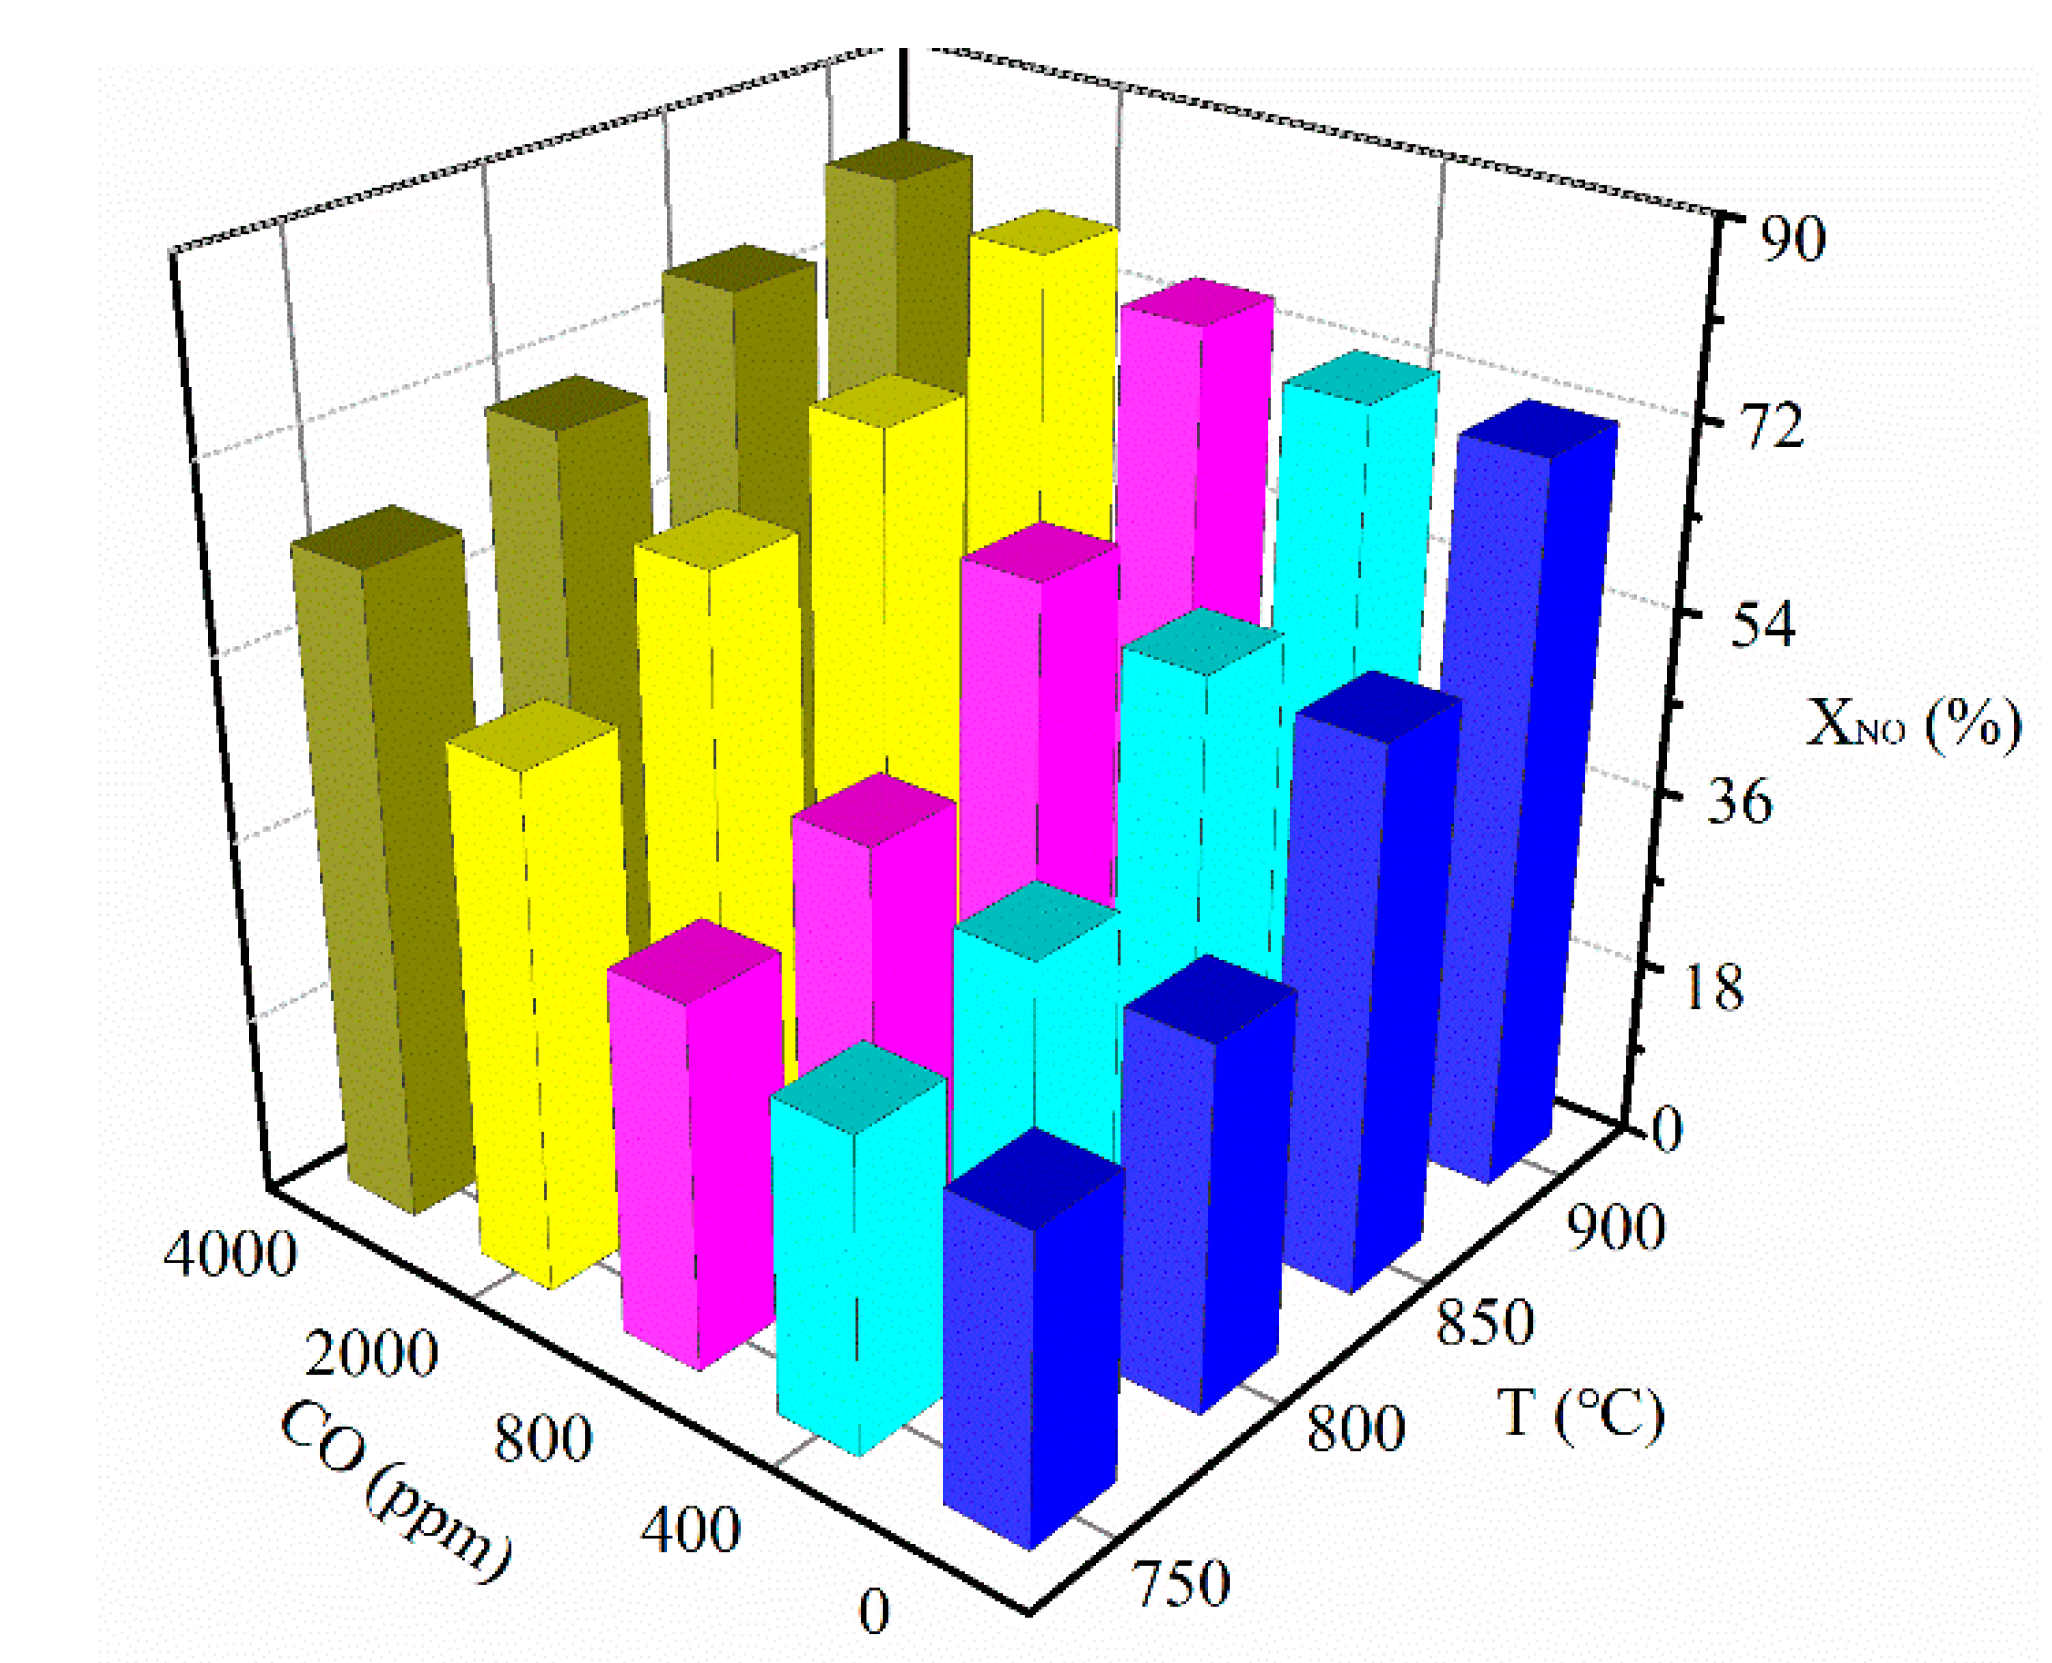
3.2. Effect of Reaction Temperature

Temperature is an important factor for homogeneous NO reduction. As presented in Figure 4, in the CO concentration range 0–4000 ppm, the increment of temperature led to a significant improvement of the NO reduction ratio. The elevated temperature could increase the desorption rate of the carbon surface complexes [43] and, subsequently, the rate of forming active sites, C*. This permitted the char surface to be more active toward the adsorption and dissociation of NO than the original one. A similar trend was also reported in the literature [44,45]. Additionally, an enhanced effect of CO concentration on NO reduction rate was observed with decreased reaction temperature. At low temperature, the carbon surface was less active, the transfer of oxygen to active site C* was slow [37], and the reaction between surface species and CO became significant.
To quantify the reaction products of char–NO–CO reaction at different temperatures, a further test was conducted at 400 ppm NO and 4000 ppm CO, as given in Table 4. At 750–900 °C, the amounts of both CO and NO consumed were nearly the same as the amount of CO2 formed. Combining the abovementioned TG analysis (seen in Section 3.1), it could therefore be determined that the char–NO–CO reaction dominated the overall reaction with such a high CO/NO ratio. This dominant role of the catalytic reaction was independent of temperature (750–900 °C).

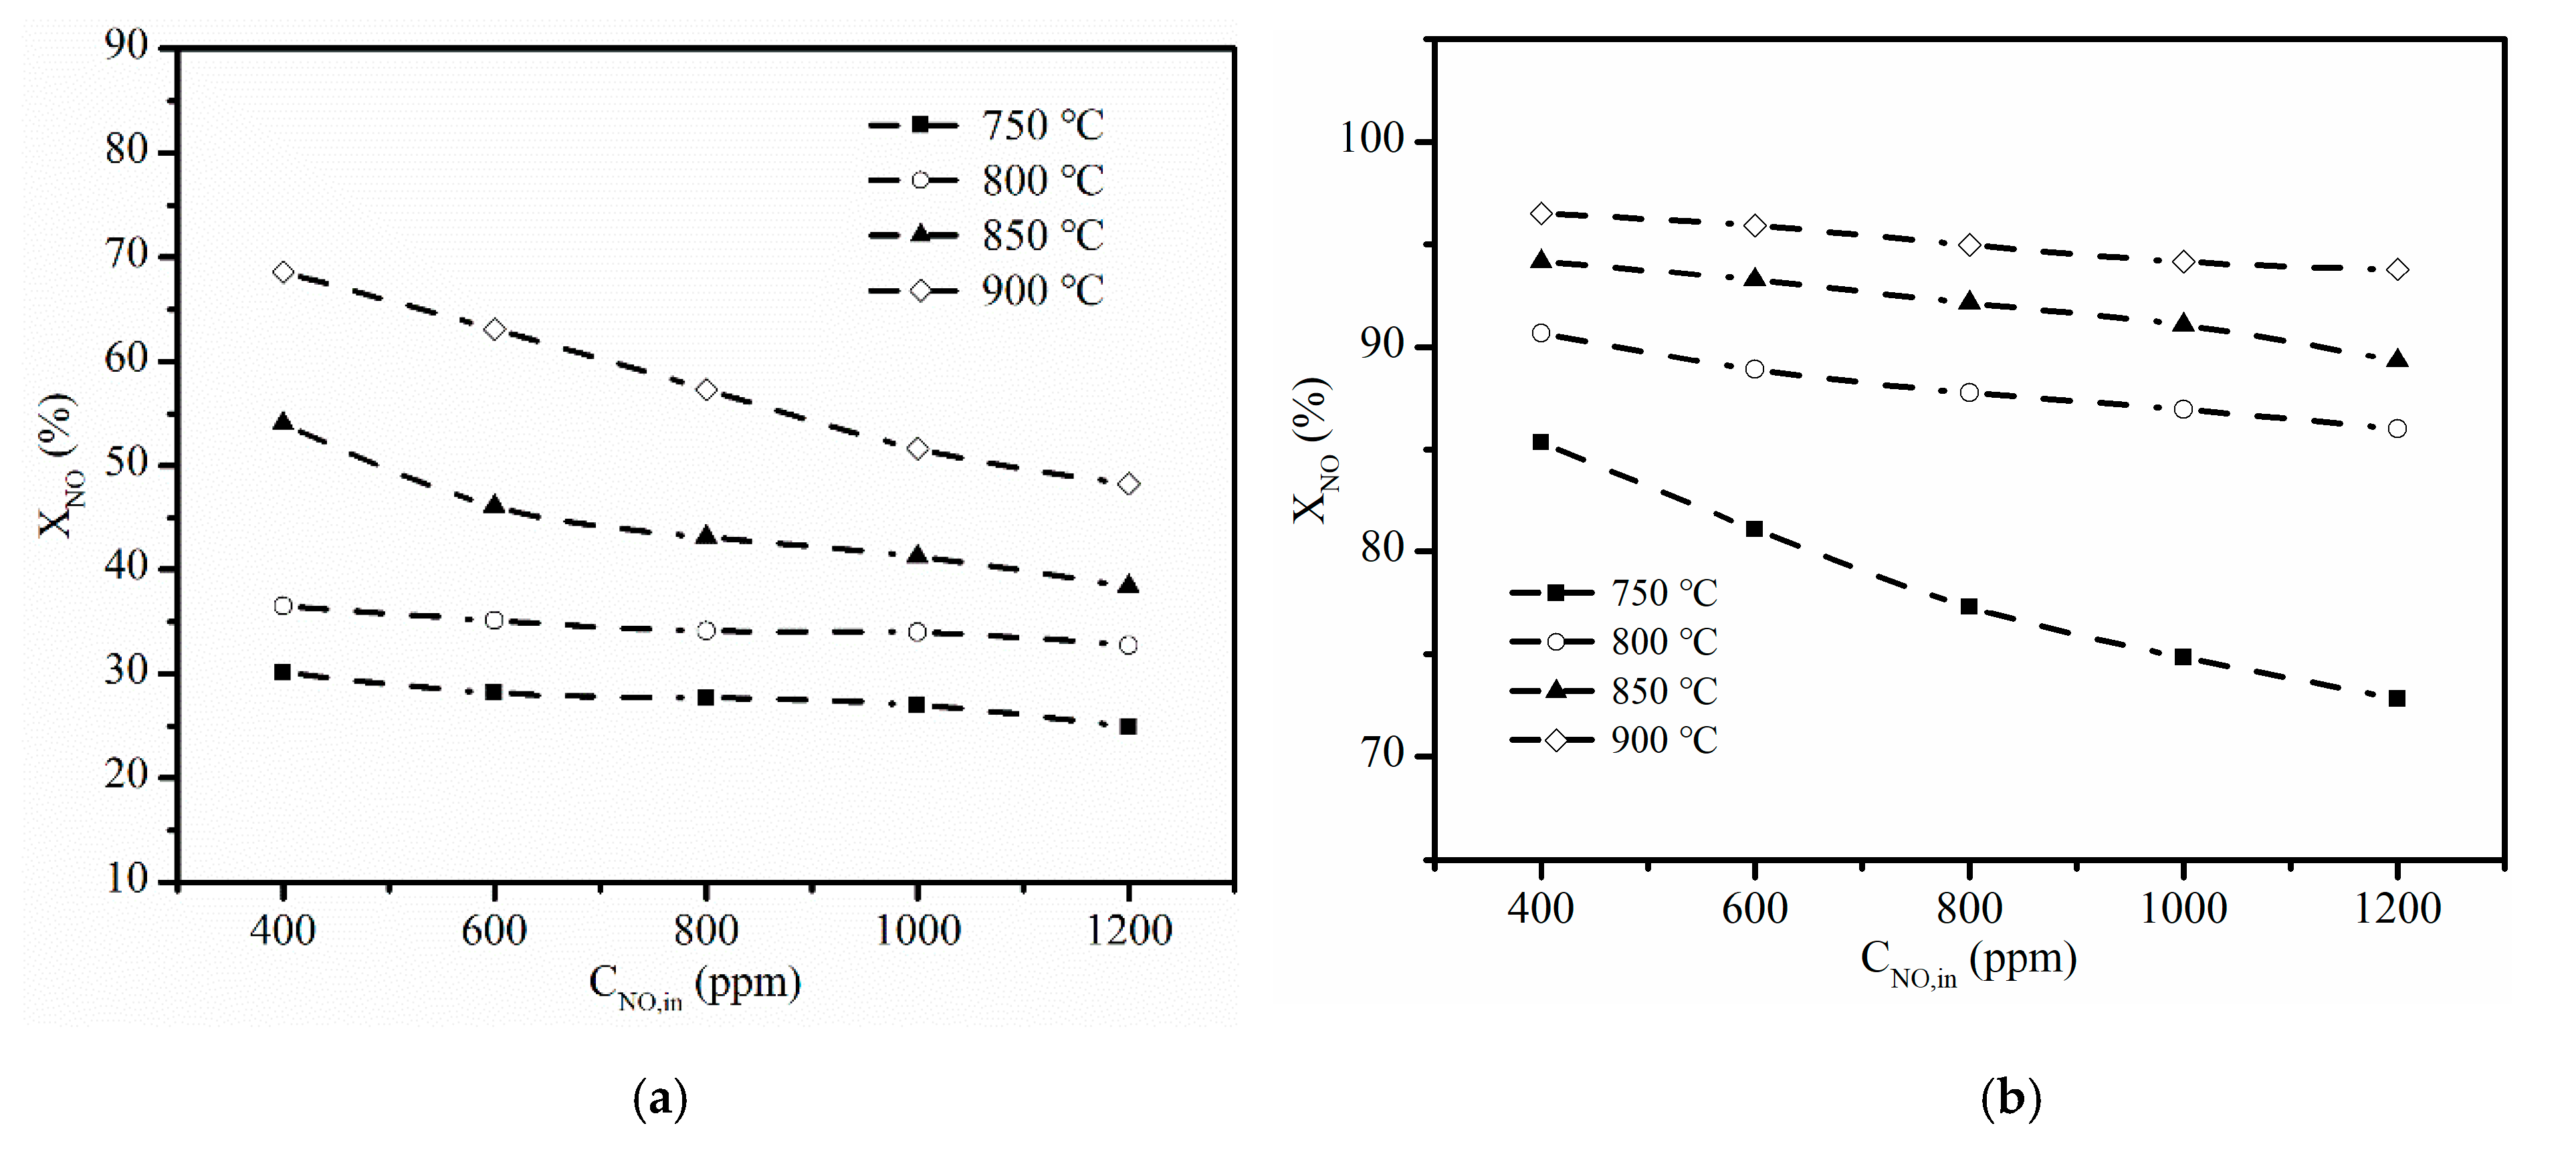
3.3. Effect of Initial NO Concentration

Figure 5 shows the effect of initial NO concentration on the reduction rate of NO as a function of CO/NO ratio at 900 °C. It could be seen that at the two levels of NO (400 ppm, 1000 ppm), the NO reduction rate could be enhanced by increasing the CO/NO ratio. Moreover, the NO reduction ratio showed an increase for a fixed CO/NO ratio when the initial NO concentration rose to 1000 ppm after CO was introduced, and this increased trend became increasingly significant with increasing CO/NO ratio. This could be attributed to the widening differences in CO concentration with increasing NO concentration. However, these results were slightly different from the study of Wang et al. [25]. In their study, when the initial NO concentration was raised to 964 mg·m−3, a small decrease of the reduction ratio was found at a higher CO/NO ratio. This divergence might result from the different types of char (they used coal char).

3.4. Effect of Char Loading

As shown in Figure 6, the increased char loading exerted a subtle influence on the NO reduction rate with increasing CO/NO ratio. It was found that the difference between the reduction ratio with 0.02 g and 0.2 g char was gradually decreased as the CO/NO ratio increased in the range of 0–10. This difference between them even became unobservable when the CO/NO ratio increased up to 10. At a low concentration of CO, the enhanced NO reduction with increasing char mass mainly contributed to the strengthened carbon-consuming reactions (1) and (2). However, at higher CO concentration (CO/NO = 10), carbon could not be consumed, and enough carbon sites could be provided by 0.02 g char for the catalytic reduction reaction. Therefore, under this condition, it is not suggested that NO reduction can be improved simply by increasing the amount of char.

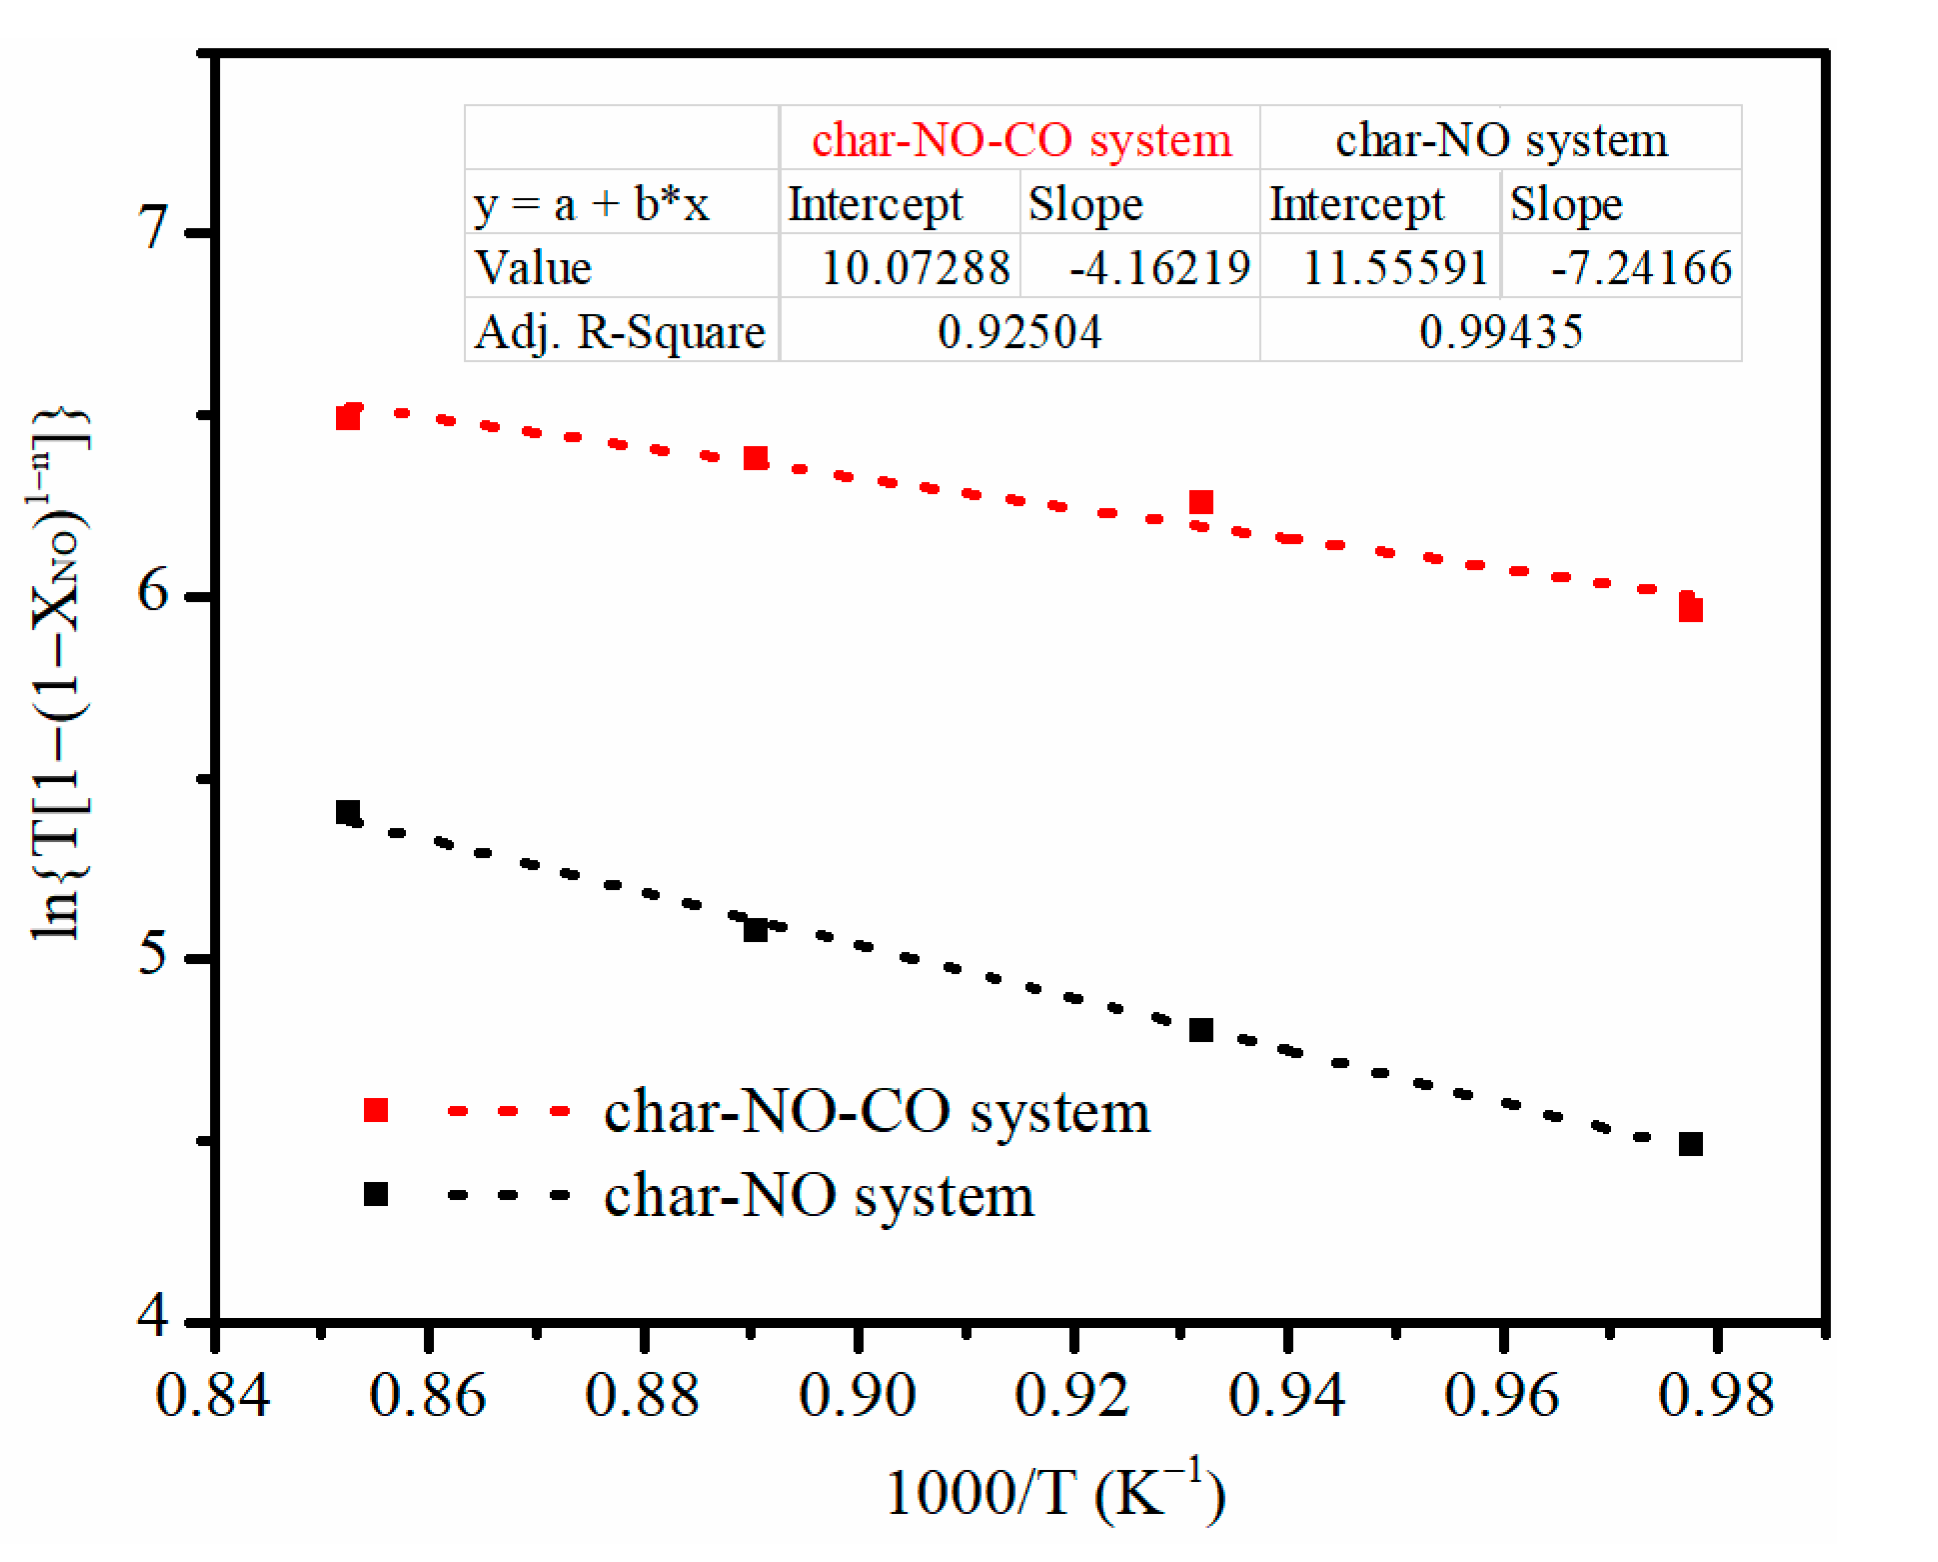
3.5. Determination of Reaction Order and Activation Energy

The reaction rate for the heterogeneous NO reaction in the fixed bed can be expressed as follows [46,47,48,49]:
γ NO   =   dC NO dt   =   kC NO n
where CNO is the NO concentration, t is the residence time of gas in the sample layer, k is the reaction rate constant, and n is the apparent reaction order.
Based on the analysis of the above experiments, the NO reduction reaction was the direct reaction between char and NO without additional CO. However, the overall reaction became the catalytic reaction over the char with a high concentration of CO (CO/NO = 10) present. According to this, γ in the char–NO system represented the reaction rate for NO reduction by char, whereas γ in the char–NO–CO system indicated the reaction rate for NO reduction with CO, catalyzed by char. During the NO–CO reduction experiment, an excess concentration of CO (60,000 ppm) was set to assume a constant CO concentration.
As shown in Figure 7a,b, the NO reduction ratio decreased with increasing inlet NO concentration, whether in the char–NO system or in the char–NO–CO system. This indicates that the reaction order of NO should be fractional (α < 1) for NO reduction by char in the temperature range studied. Similarly, NO reduction by CO over char was a pseudo-fractional-order reaction with respect to NO. Thus, Equation (8) could be integrated as follows:
C NO ( 1     n )     C NO , in ( 1     n ) =     ( 1     n ) kt   =     ( 1     n )   kk * / T
where T is the reaction temperature and k* can be estimated with Equation (10):
k* = HAT0/(εν)
where H is the bed height, A is the cross-sectional area of the reactor, ε is the bed porosity, ν is the total gas flow rate, and T0 is the ambient temperature.
Taking the expression CNO = (1 − XNO)CNO,in into account allows Equation (9) to be further expressed as Equation (11):
( 1     X NO ) ( 1     n )   =   1     C NO , in ( n     1 ) ( 1     n ) kk * / T
A trial-and-error method [33] was used to determine the reaction order n. The calculated k is constant for each reaction temperature and variational inlet NO concentration. Accordingly, the reaction order n could be determined by varying the value of n (0–1). The reaction orders for all the test temperatures (750–900 °C) were determined, and an average order was allowed for the following calculation of apparent activation energies.
In order to determine the activation energies, Equation (8) could be expressed as
γ NO   =     dC NO dt   =   kC NO n   =   k 0   exp (   E α / RT )   C NO n
where k0 is the pre-exponential factor, Eα is the apparent activation energy, and R is the gas constant. Based on Equation (12), the calculated Equation (11) could be further transformed as Equation (13):
ln { T   [ 1     ( 1     X NO ) 1     n ] }   =   ln [ k 0   k * ( 1     n ) C NO ,   in n     1 ] E α R 1 T
Therefore, the activation energy could be calculated according to the slope of a straight line resulting from a plot of ln { T   [ 1     ( 1     X NO ) 1     n ] } vs. 1/T.
Figure 8 presents the Arrhenius plots for char–NO and char–NO–CO reaction systems. It can be seen that the lines fit well to the experimental data.
The calculated reaction order and activation energy are listed in Table 5. The reaction order and activation energy of char–NO reaction were 0.71 and 60.21 kJ·mol−1, respectively. This reaction order fall within the range of 0.66–0.76 proposed by Li et al. [29] but was higher than the 0.2–0.5 suggested by Garijo et al. [28]. The reaction order and activation energy were calculated as 0.82 and 34.60 kJ·mol−1, respectively, for the char–NO–CO reaction. It is clear that this activation energy was obviously less than that without CO. This finding agrees with the report of Wang et al. [25]. However, Wu et al. [42] reported that the activation energies of both the catalytic and the carbon-consuming reactions were all within the same range. It is likely that the activation energy for NO reduction with CO over chars depends on fuel types [34].

4. Conclusions

Experiments and kinetics of NO reductions of rice husk char were investigated in a fixed-bed reactor. The effects of CO concentration, reaction temperature, initial NO concentration, and char loading on the heterogeneous NO reduction were analyzed. Based on this study, the conclusions can be drawn as follows.
In the absence of CO, the NO reduction reaction could be represented by the direct reaction of NO with char. An enhanced NO reduction by CO over char and a decreased carbon consumption were found with increasing CO concentration. At higher levels of CO (CO/NO = 10), the consumption of carbon was nearly zero and the char–NO–CO reaction dominated the overall reaction.
NO reduction was increased with increasing temperature for a given CO concentration. The influence of CO concentration on NO reduction was strengthened with decreasing temperature, and this could be due to a low reactivity of char at low temperature. Char just provided a surface to catalyze the NO–CO reaction with CO/NO = 10, which was independent of temperature (750–900 °C).
The enhancement of NO reduction caused by increasing the initial NO concentration was increasingly significant with increasing CO/NO ratio. Increasing the char loading led to a gradually decreased influence on NO reduction with increasing CO/NO ratio. It is not suggested that NO reduction can be enhanced simply by increasing the amount of char at excess CO/NO ratio.
Reaction orders in the NO concentration were found to be 0.71 and 0.82 for the char–NO reaction and char–NO–CO reaction, respectively. The activation energy was 60.21 kJ·mol−1 for NO reduction by char, against 34.60 kJ·mol−1 for NO reduction by CO over char.

Author Contributions

Conceptualization, N.L. and S.C.; methodology, S.C.; formal analysis, N.L., Y.W., and X.J.; investigation, N.L., Y.W., and S.C.; writing—original draft preparation, N.L.; writing—review and editing, S.C.; supervision, X.J.; and funding acquisition, Y.W. All authors have read and agreed to the published version of the manuscript.

Funding

This work was funded by the National Natural Science Foundation of China (No. 51702007) and Foundation for Innovative Research Groups of the National Natural Science Foundation of China (No. 51621003).

Acknowledgments

The authors would be very grateful to the anonymous reviewers for their suggestions and comments on improving the quality of the paper.

Conflicts of Interest

The authors declare no conflict of interest.

References

  1. Cui, S.; Hao, R.; Fu, D. Integrated method of non-thermal plasma combined with catalytical oxidation for simultaneous removal of SO2 and NO. Fuel 2019, 246, 365–374. [Google Scholar] [CrossRef]
  2. Gong, Z.; Shao, Y.; Pang, L.; Zhong, W.; Chen, C. Study on the emission characteristics of nitrogen oxides with coal combustion in pressurized fluidized bed. Chin. J. Chem. Eng. 2019, 27, 1177–1183. [Google Scholar] [CrossRef]
  3. Xu, M.; Li, S.; Wu, Y.; Jia, L. Reduction of recycled NO over char during oxy-fuel fluidized bed combustion: Effects of operating parameters. Appl. Energy 2017, 199, 310–322. [Google Scholar] [CrossRef]
  4. Chen, J.; Chen, Y.; Hrynsphan, D.; Mei, Y.; Pan, H.; Wu, J.; Chen, J.-M.; Yao, J. FeII(EDTA)–NO Reduction by Mn Powder in Wet Flue Gas Denitrification Technology Coupled with Mn2+ Recycling: Performance, Kinetics, and Mechanism. Energy Fuels 2020, 34, 2590–2598. [Google Scholar] [CrossRef]
  5. Zheng, C.; Xiao, L.; Qu, R.; Liu, S.; Xin, Q.; Ji, P.; Song, H.; Wu, W.; Gao, X. Numerical simulation of selective catalytic reduction of NO and SO2 oxidation in monolith catalyst. Chem. Eng. J. 2019, 361, 874–884. [Google Scholar] [CrossRef]
  6. Cheng, X.; Cheng, Y.; Wang, Z.; Ma, C. Comparative study of coal based catalysts for NO adsorption and NO reduction by CO. Fuel 2018, 214, 230–241. [Google Scholar] [CrossRef]
  7. Wang, L.; Cheng, X.; Wang, Z.; Ma, C.; Qin, Y. Investigation on Fe-Co binary metal oxides supported on activated semi-coke for NO reduction by CO. Appl. Catal. B Environ. 2017, 201, 636–651. [Google Scholar] [CrossRef]
  8. Shen, Q.; Liaw, S.B.; Costa, M.; Wu, H. Rapid Pyrolysis of Pulverized Biomass at a High Temperature: The Effect of Particle Size on Char Yield, Retentions of Alkali and Alkaline Earth Metallic Species, and Char Particle Shape. Energy Fuels 2020, 34, 7140–7148. [Google Scholar] [CrossRef]
  9. Wei, J.; Gong, Y.; Guo, Q.; Chen, X.; Ding, L.; Yu, G. A mechanism investigation of synergy behaviour variations during blended char co-gasification of biomass and different rank coals. Renew. Energy 2019, 131, 597–605. [Google Scholar] [CrossRef]
  10. Ding, L.; Zhang, Y.; Wang, Z.; Huang, J.; Fang, Y. Interaction and its induced inhibiting or synergistic effects during co-gasification of coal char and biomass char. Bioresour. Technol. 2014, 173, 11–20. [Google Scholar] [CrossRef]
  11. Harding, N.; Adams, B.R. Biomass as a reburning fuel: A specialized cofiring application. Biomass Bioenergy 2000, 19, 429–445. [Google Scholar] [CrossRef]
  12. Wu, X.Y.; Song, Q.; Zhao, H.; Zhang, Z.H.; Yao, Q. Kinetic Modeling of Inherent Mineral Catalyzed NO Reduction by Biomass Char. Environ. Sci. Technol. 2014, 48, 4184–4190. [Google Scholar] [CrossRef] [PubMed]
  13. Aarna, I.; Suuberg, E.M. A review of the kinetics of the nitric oxide-carbon reaction. Fuel 1997, 76, 475–491. [Google Scholar] [CrossRef]
  14. Liu, J.; Tan, L.; Huang, L.; Wang, Q.; Liu, Y. Kinetic Monte Carlo Modeling for the NO–CO Reaction Mechanism on Rh(100) and Rh(111). Langmuir 2020, 36, 3127–3140. [Google Scholar] [CrossRef] [PubMed]
  15. Stanmore, B.; Tschamber, V.; Brilhac, J.-F. Oxidation of carbon by NOx, with particular reference to NO2 and N2O. Fuel 2008, 87, 131–146. [Google Scholar] [CrossRef]
  16. Fan, W.; Li, Y.; Xiao, M. Effect of Preoxidation O2 Concentration on the Reduction Reaction of NO by Char at High Temperature. Ind. Eng. Chem. Res. 2013, 52, 6101–6111. [Google Scholar] [CrossRef]
  17. Shu, Y.; Wang, H.; Zhu, J.; Tian, G.; Huang, J.; Zhang, F. An experimental study of heterogeneous NO reduction by biomass reburning. Fuel Process. Technol. 2015, 132, 111–117. [Google Scholar] [CrossRef]
  18. Wang, X.; Li, Y.; Zhang, W.; Zhao, J.; Wang, Z. Simultaneous SO2 and NO removal by pellets made of carbide slag and coal char in a bubbling fluidized-bed reactor. Process. Saf. Environ. Prot. 2020, 134, 83–94. [Google Scholar] [CrossRef]
  19. Aarna, I.; Suuberg, E.M. The Role of Carbon Monoxide in the NO−Carbon Reaction. Energy Fuels 1999, 13, 1145–1153. [Google Scholar] [CrossRef]
  20. Allen, D.; Hayhurst, A.N. The chemical reactions of nitric oxide with solid carbon and catalytically with gaseous carbon monoxide. Fuel 2015, 142, 260–267. [Google Scholar] [CrossRef]
  21. Cheng, X.; Wang, X.; Wang, Z.; Ma, C.; Wang, M. Investigation on NO reduction and CO formation over coal char and mixed iron powder. Fuel 2019, 245, 52–64. [Google Scholar] [CrossRef]
  22. Wang, B.; Sheng, S.; Sun, L.S.; Hu, S.; Fei, H.; Lu, T.F.; Xiang, J. Investigation on Effect of CO on NO Heterogeneous Reduction with Char in O2/CO2 Atmosphere. J. Eng. Thermophys. 2012, 33, 336–338. [Google Scholar]
  23. López, D.; Calo, J. The NO−Carbon Reaction: The Influence of Potassium and CO on Reactivity and Populations of Oxygen Surface Complexes. Energy Fuels 2007, 21, 1872–1877. [Google Scholar] [CrossRef]
  24. Furusawa, T.; Tsunoda, M.; Tsujimura, M.; Adschiri, T. Nitric oxide reduction by char and carbon monoxide. Fuel 1985, 64, 1306–1309. [Google Scholar] [CrossRef]
  25. Wang, C.; Du, Y.; Che, D. Investigation on the NO Reduction with Coal Char and High Concentration CO during Oxy-fuel Combustion. Energy Fuels 2012, 26, 7367–7377. [Google Scholar] [CrossRef]
  26. Song, Y.H.; Beér, J.M.; Sarofim, A.F. Reduction of Nitric Oxide by Coal Char at Temperatures of 1250–1750 K. Combust. Sci. Technol. 1981, 25, 237–240. [Google Scholar] [CrossRef]
  27. Li, Y.; Radovic, L.; Lu, G.; Rudolph, V. A new kinetic model for the NO–carbon reaction. Chem. Eng. Sci. 1999, 54, 4125–4136. [Google Scholar] [CrossRef]
  28. Garijo, E.G.; Jensen, A.D.; Glarborg, P. Kinetic Study of NO Reduction over Biomass Char under Dynamic Conditions. Energy Fuels 2003, 17, 1429–1436. [Google Scholar] [CrossRef]
  29. Dong, L.; Gao, S.; Song, W.; Xu, G. Experimental study of NO reduction over biomass char. Fuel Process. Technol. 2007, 88, 707–715. [Google Scholar] [CrossRef]
  30. Dong, L.; Gao, S.; Xu, G. NO Reduction over Biomass Char in the Combustion Process. Energy Fuels 2010, 24, 446–450. [Google Scholar] [CrossRef]
  31. Chen, L.; Liu, L.; Geng, K.; Zhao, Y.; Wu, J.; Sun, R.; Sun, S.; Qiu, P. Investigation of Heterogeneous NO Reduction by Biomass Char and Coal Char Blends in a Microfluidized Bed Reaction Analyzer. Energy Fuels 2020, 34, 6317–6325. [Google Scholar] [CrossRef]
  32. Schönenbeck, C.; Gadiou, R.; Schwartz, D. A kinetic study of the high temperature NO–char reaction. Fuel 2004, 83, 443–450. [Google Scholar] [CrossRef]
  33. Wang, X.; Si, J.; Tan, H.; Zhao, Q.; Xu, T. Kinetics investigation on the reduction of NO using straw char based on physicochemical characterization. Bioresour. Technol. 2011, 102, 7401–7406. [Google Scholar] [CrossRef] [PubMed]
  34. Zevenhoven, R.; Hupa, M. The reactivity of chars from coal, peat and wood towards NO, with and without CO. Fuel 1998, 77, 1169–1176. [Google Scholar] [CrossRef]
  35. Liu, D.; Li, C.; Wu, J.; Liu, Y. Novel carbon-based sorbents for elemental mercury removal from gas streams: A review. Chem. Eng. J. 2020, 391, 123514. [Google Scholar] [CrossRef]
  36. Fan, X.-D.; Wu, Y.-J.; Tu, R.; Sun, Y.; Jiang, E.-C.; Xu, X.-W. Hydrodeoxygenation of guaiacol via rice husk char supported Ni based catalysts: The influence of char supports. Renew. Energy 2020, 157, 1035–1045. [Google Scholar] [CrossRef]
  37. Sørensen, C.O.; Johnsson, J.E.; Jensen, A.D. Reduction of NO over Wheat Straw Char. Energy Fuels 2001, 15, 1359–1368. [Google Scholar] [CrossRef]
  38. Chan, L.; Sarofim, A.; Beér, J. Kinetics of the NO carbon reaction at fluidized bed combustor conditions. Combust. Flame 1983, 52, 37–45. [Google Scholar] [CrossRef]
  39. Chambrion, P.; Orikasa, H.; Suzuki, T.; Kyotani, T.; Tomita, A. A study of the C–NO reaction by using isotopically labelled C and NO. Fuel 1997, 76, 493–498. [Google Scholar] [CrossRef]
  40. Guerrero, M.; Millera, A.; Alzueta, M.; Bilbao, R. Experimental and Kinetic Study at High Temperatures of the NO Reduction over Eucalyptus Char Produced at Different Heating Rates. Energy Fuels 2011, 25, 1024–1033. [Google Scholar] [CrossRef]
  41. Kapteijn, F.; Mierop, A.J.C.; Abbel, G.; Moulijn, J.A. Reduction of NOxover alkali metal–carbon systems. J. Chem. Soc. Chem. Commun. 1984, 16, 1085–1086. [Google Scholar] [CrossRef]
  42. Wu, S.L.; Iisa, K. Kinetics of NO Reduction by Black Liquor Char. Energy Fuels 1998, 12, 457–463. [Google Scholar] [CrossRef]
  43. Aarna, I.; Suuberg, E.M. A study of the reaction order of the NO-carbon gasification reaction. Symp. Combust. 1998, 27, 3061–3068. [Google Scholar] [CrossRef]
  44. Suzuki, T.; Kyotani, T.; Tomita, A. Study on the Carbon-Nitric Oxide Reaction in the Presence of Oxygen. Ind. Eng. Chem. Res. 1994, 33, 2840–2845. [Google Scholar] [CrossRef]
  45. Chen, W.-Y.; Gathitu, B.B. Design of mixed fuel for heterogeneous reburning. Fuel 2006, 85, 1781–1793. [Google Scholar] [CrossRef]
  46. Jensen, L.S.; Jannerup, H.E.; Glarborg, P.; Jensen, A.D.; Dam-Johansen, K. Experimental investigation of no from pulverized char combustion. Proc. Combust. Inst. 2000, 28, 2271–2278. [Google Scholar] [CrossRef]
  47. He, J.; Song, W.; Gao, S.; Dong, L.; Barz, M.; Li, J.; Lin, W. Experimental study of the reduction mechanisms of NO emission in decoupling combustion of coal. Fuel Process. Technol. 2006, 87, 803–810. [Google Scholar] [CrossRef]
  48. Wang, X.; Xiong, Y.; Tan, H.; Liu, Y.; Niu, Y.; Xu, T. Influences of CO and O2 on the Reduction of N2O by Biomass Char. Energy Fuels 2012, 26, 3125–3131. [Google Scholar] [CrossRef]
  49. Garijo, E.; Jensen, A.D.; Glarborg, P. Reactivity of coal char in reducing NO. Combust. Flame 2004, 136, 249–253. [Google Scholar] [CrossRef]
Figure 1. Experimental setup for NO reduction.
Applsci 10 06715 g001
Figure 2. Influence of CO on the evolution of (a) outlet NO concentration and the amounts of (b) CO2 formed and (c) CO consumed with time.
Applsci 10 06715 g002
Figure 3. TG–DSC curves for the char residues.
Applsci 10 06715 g003
Figure 4. Effect of reaction temperature on NO reduction with rice husk char.
Applsci 10 06715 g004
Figure 5. Effect of the initial NO concentration on NO reduction with rice husk char.
Applsci 10 06715 g005
Figure 6. Effect of char loading on NO reduction with rice husk char.
Applsci 10 06715 g006
Figure 7. NO reduction rate of rice husk char at different inlet NO concentrations, for the (a) char–NO system and (b) char–NO–CO system.
Applsci 10 06715 g007
Figure 8. Arrhenius plots for NO reduction with rice husk char.
Applsci 10 06715 g008
Table 1. Proximate and ultimate analyses of rice husk char.
Proximate Analysis (ad, %)Ultimate Analysis (%)
Fixed CarbonAshVolatile MatterMoistureCHNOS
48.6042.794.224.3948.850.560.442.940.03
ad: air dry.
Table 2. Specific surface areas, pore volume, and pore size of rice husk char.
Surface Areas (m2·g−1)Pore Volume (cm3·g−1)Pore Size (nm)
135.830.0316.382
Table 3. Mass loss of rice husk char residues.
CO (ppm)Blank040080020004000
Mass loss (%)2.290.320.350.951.552.27
Table 4. Reaction products for char–NO–CO reaction (400 ppm NO, 4000 ppm CO).
Temp
(°C)
CNO,in − CNO,out
(ppm)
CCO,in − CCO,out
(ppm)
CCO2,out
(ppm)
750260239246
800283247254
850298310315
900313329335
Table 5. Reaction orders and activation energies for NO reduction of rice husk char.
Char–NOChar–NO–CO
n0.710.82
Eα (kJ·mol−1)60.2134.60

