Article

Role of Surface-Treated Silica Nanoparticles on the Thermo-Mechanical Behavior of Poly(Lactide)

Department Industrial Engineering and INSTM Unit, University of Trento, 38123 Trento, Italy
*
Author to whom correspondence should be addressed.
Appl. Sci. 2020, 10(19), 6731; https://doi.org/10.3390/app10196731
Submission received: 4 September 2020 / Revised: 22 September 2020 / Accepted: 23 September 2020 / Published: 25 September 2020
(This article belongs to the Special Issue Room above the Bottom: Materials between the Nano and Micro Scale)

Abstract

:
Surface-treated fumed silica nanoparticles were added at various concentrations (from 1 to 24 vol%) to a commercial poly(lactide) or poly(lactic acid) (PLA) matrix specifically designed for packaging applications. Thermo-mechanical behavior of the resulting nanocomposites was investigated. Field Emission Scanning Electron Microscopy (FESEM) micrographs revealed how a homogeneous nanofiller dispersion was obtained even at elevated filler amounts, with a positive influence of the thermal degradation stability of the materials. Modelization of Differential Scanning Calorimetry (DSC) curves through the Avrami–Ozawa model demonstrated that fumed silica nanoparticles did not substantially affect the crystallization behavior of the material. On the other hand, nanosilica addition was responsible for significant improvements of the storage modulus (E′) above the glass transition temperature and of the Vicat grade. Multifrequency DMTA tests showed that the stabilizing effect due to nanosilica introduction could be effective over the whole range of testing frequencies. Sumita model was used to evaluate the level of filler dispersion. The obtained results demonstrated the potential of functionalized silica nanoparticles in improving the thermo-mechanical stability of biodegradable matrices for packaging applications, especially at elevated service temperatures.

1. Introduction

Starting from the synthesis in the 1960s [1], poly-lactide or polylactic acid (PLA) began to gain successful attention from researchers and industry for the first interesting applications in the biomedical field [2,3], because PLA is a biocompatible and a biodegradable polymer. In the last two decades, the attention for PLA-based materials has been further increased due to the recent problems of waste management, especially for packaging materials. Many papers and studies have been published on biodegradable polyesters and mainly on poly(lactide), as summarized and reviewed in selected literature [4,5,6,7]. PLA represents the denomination of a family of polymers derived from lactic-acid or from various lactides; it could be a homopolymer or a copolymer of L-lactic acid and/or D-lactic acid monomers at different degrees of enantiomeric purity, derived both from oil and from renewable resources [8]. For instance, P-L-LA, poly(L-lactic acid), and P-D-LA, poly(D-lactic acid), or poly-L-lactide and poly-D-lactide, are enantiomerically pure semicrystalline polymers, with melting temperatures of about 180 °C and a high crystallinity degree [9]. On the other hand, P-D,L-LA, poly(D,L-lactic acid) or poly-D,L-lactide is a statistical copolymer, completely amorphous with a glass transition temperature of about 50–60 °C, which is obtained from a equimolar mixture of L-lactic acid and D-lactic acid enantiomers. PLA possesses a good balance of performances and degradation kinetics in dependence on the enantiomeric composition, showing particularly higher thermal, mechanical, and optical properties with respect to other biodegradable polyesters [4,10]. From a mechanical point of view, PLA-based polymers have a relatively brittle behavior with properties dependent on the molecular weight, the enantiomeric purity, the crystallinity content and the processing conditions [5,6]. Usually a tensile modulus of 2–4 GPa, tensile strength of 30–50 MPa, and deformation at break in the range of 1% and 7% are obtained [10,11]. For the packaging industry, relatively low enantiomeric purity PLAs found a wide diffusion, and those polymers are typically processed by injection molding, extrusion, and thermoforming [6,12]. These materials are characterized by excellent transparency and good mechanical properties, but they evidence a certain brittleness and a low creep and thermal stability with respect to the traditional polymers for packaging applications [13].
The addition of cellulose or inorganic micro- and nanofillers represents an interesting way to increase its stiffness and thermal stability. For instance, natural fibers [14], micro- and nanocellulose [15], micrometric fillers such as talc, hydroxy apatite calcium phosphate, barium sulphate, calcium carbonate, and calcium sulfate at concentrations between 5 and 40 wt% were considered and properly added to various PLAs with some positive results in a wide range of physical properties [16]. On the one hand, various inorganic nanoparticles have been more efficiently dispersed in different PLA matrices to improve their toughness and strength, to increase their thermal stability and to enhance their barrier properties [17], and/or to reduce their electrical resistivity by using carbonaceous fillers [16]. In particular, lamellar silicates (clays) [18,19,20] and hydroxy apatite have been the most utilized nanofillers [21,22]. On the other hand, in the last years some more attention has been devoted to the introduction of iso-dimensional nanofillers, such as fumed silica nanoparticles, for the production of PLA-nanocomposites.
Fumed silica (FS) nanoparticles are available in a wide range of specific surface area (ranging from 50 to 400 m2·g−1) and with a variety of surface treatments. Due to its morphological properties, this nanofiller is able to self-aggregate when dispersed in polymer matrices, forming an interconnected network of interacting particles. The role played by silica nanoparticles with different thermoplastic matrices and the consequent thermo-mechanical behavior of nanocomposites produced firstly by melt-compounding and then either by compression molding [23,24,25,26,27,28,29,30] or by fiber spinning [31,32] was extensively investigated by our group in the last years. It was demonstrated how nanosilica addition leads to a strong stiffening effect on the polymer matrices, without impairing their failure properties, improving also the dimensional and thermal degradation stability.
For the production of PLA-silica nanocomposites, different approaches were studied for improving the quality of dispersion and the resulting properties. In situ polymerization of lactide in the presence of dispersed silica was studied by various authors, in order to optimize and control the filler distribution in the resulting nanocomposites [33,34,35]. To overcome the problem of nanosilica aggregation, various other methods were proposed to modify the silica particles with lactic acid oligomers, with a surfactant, with silane-coupling agents or other compatibilizers. Yan et al. [36], Zhang et al. [37], and Sepulveda et al. [38] reported interesting improvements in the physical properties of PLA-silica nanocomposites after direct grafting of L-lactic acid oligomer onto the surface silanol groups of the silica nanoparticles. Zhu et al. [39] melt mixed poly(lactic acid)-based nanocomposites prepared by adding oleic acid-treated fumed silica nanoparticles. The flexibility of the PLA matrix was improved through the addition of limited amounts (i.e., less than 1 wt%) of organomodified nanoparticles. It is also interesting to note that many processing studies have been dedicated to solution casting [36,40,41,42,43,44] and only few papers have dealt with direct melt-processing of PLA-silica nanocomposites [45,46,47,48,49]. In addition, the biodegradation of PLA-fumed silica nanocomposites has been studied by Fukushima et al. [40], and a certain protection action of silica towards PLA degradation was observed. Enzymatic, in vitro, burial, and composting degradation was properly considered for practical potential applications and waste management [41,49,50,51,52]. Different authors started to use hydrophilic fumed silica nanoparticles, having a surface area of about 200 m2·g−1, as an additive in PLA compounds [37,41,45,51,53,54]. In a paper of Zhang et al., the thermal properties of poly(lactic acid)-fumed silica nanocomposites were also investigated through molecular dynamics (MD) simulations, and the increase of Tg observed in nanofilled samples was qualitatively consistent between the experimental result and the MD predictions [55]. In a previous work of our group, various kinds of fumed silica nanoparticles, differing for the surface area and the presence of a surface functionalization, were melt-compounded with a poly(lactic acid) biodegradable matrix to be utilized for industrial packaging applications, and the mechanical and optical properties of the resulting materials were investigated [46]. Untreated nanoparticles at an elevated surface area resulted as effective in increasing elastic modulus, because of the extended filler–matrix interaction, while the finer dispersion of silica aggregates at the nanoscale obtained with surface-treated nanoparticles led to noticeable improvements of the tensile properties at yield and at break, both under quasi-static and impact conditions. In addition, the fracture toughness and the creep stability were substantially enhanced by nanosilica addition, without impairing the original optical transparency of the matrix.
In the above cited papers, it can be seen that the investigation of the thermo-mechanical properties of PLA-silica nanocomposites has been substantially limited to differential scanning calorimetry (DSC), thermogravimetric analysis (TGA), and monofrequency dynamical mechanical thermal analysis (DMTA). In the authors’ opinion, more sophisticated and detailed approaches (for instance, multifrequency DMTA tests and the application of theoretical models) should be considered to have a satisfactory comprehension of the correlation between the microstructural features and the thermo-mechanical performances of these nanocomposites. Considering that surface-treated nanoparticles showed the best balance between mechanical properties and optical transparency, in the present paper, hydrophobic-fumed silica, namely Aerosil® r805, was added at different relative concentrations to the same commercial PLA matrix. Rheological, thermal, and dynamical mechanical properties of the resulting nanocomposites up to 24 vol% of fumed silica were systematically studied and compared. The crystallization behavior of the resulting samples was modeled through the Avrami model, while their dynamic behavior was interpreted through the application of Sumita and Arrhenius equations. In this way, a comprehensive study on the effect played by nanosilica addition of the thermal and viscoelastic properties of the prepared materials was provided.

2. Materials and Methods

2.1. Materials and Processing

2.1.1. Nanofiller and Polymer Matrix

Commercial fumed silica and polylactide were respectively selected as nanofiller and polymer matrix. In particular, Aerosil® r805 silica nanoparticles, a hydrophobic-fumed silica type (density of 1.99 g·cm−3 and a BET surface area of 150 ± 25 m2·g−1), obtained by treating natural fumed silica nanoparticles with octylsilane (–C8H17), was provided by Degussa (Hanau, Germany). Polylactide (PLA) granules were supplied by NaturePlast (Caen, France) under the trade name of PLE 005 (enantiomeric purity of L-lactide of about 94 wt% and D-lactide of about 6 wt%), MFI = 16 g·10 min−1 at 190 °C and 2.16 kg, intrinsic viscosity at 25 °C = 1.35 g∙dl−1, density = 1.25 g·cm−3. Both fumed silica and PLA chips were utilized as received.

2.1.2. Preparation of the Samples

Surface-treated fumed silica nanoparticles and the matrix were melt-compounded at different relative concentrations from 1 to 24 vol% in a Thermo Haake Rheomix® 600 internal mixer at 160 °C for 10 min and 90 rpm. Selected compositions for melt flow analysis were preliminary grinded by using an M20 Universal mill (IKA-Werke GmbH, Germany). Neat PLA and the compounded materials were then hot pressed through a Carver® laboratory press at 160 °C for 5 min at 0.9 MPa, and square sheets with a side of 200 mm and a thickness of 0.8 mm and 4.0 mm were prepared. The unfilled matrix was denoted as PLA, while nanocomposites were denoted indicating the matrix, the filler, and its amount. For instance, a sample filled with 8 vol% of Aerosil® r805 is indicated as PLA-Ar805-8.

2.2. Characterization Techniques

Field emission scanning electron microscopy (FESEM) observations were carried out on cryofractured specimens by using a Zeiss Supra 40 microscope, operating at an acceleration voltage of 10 kV.
Melt flow index (MFI) measurements were performed in accordance with the ASTM D1238 standard by using a Dynisco 4003DE plastometer. PLA and compounded materials were tested at three different temperatures (170, 190, 210 °C) under an applied load of 2.16 kg. At least 10 measurements were performed for each composition.
Thermogravimetric analyses (TGA) were carried out through a Mettler TG50 thermobalance (Schwerzenbach, Switzerland) in a temperature interval from 30 to 700 at 10 °C·min−1 under an air flow of 100 mL·min−1. In this way, the temperatures associated with a mass loss of 5% (T5%), the decomposition temperature (Td), taken as the temperature associated with the maximum mass loss rate, and the relative mass residue at 700 °C (m700) were determined.
Differential scanning calorimetry (DSC) tests were performed through a Mettler DSC30 calorimeter with a heating–cooling–heating cycle in the range 0–200 °C at ±10 °C·min−1 under a nitrogen flow of 100 mL·min−1. The glass transition temperature (Tg) was determined as the inflection point of the thermograms, whereas the crystallinity content (Wc) was computed from the melting enthalpy (ΔHm) normalized to the standard enthalpy of the fully crystalline poly(L-lactic acid), i.e., P-L-LA, (ΔH0), taken as 93.6 J·g−1 [56], according to Equation (1):
W c = Δ H m Δ H 0 ( 100 f )
where f is the weight percentage of the filler. Crystallization kinetics was investigated on neat PLA and on PLA-r805-8 nanocomposite sample (i.e., the composition that showed the best balance of the mechanical properties, as previously reported [46]), by using the same DSC equipment, 160 μL crucibles, and a nitrogen flow of 100 mL·min−1. Isothermal DSC tests were performed at different temperatures (80, 85, 90, 100, 110, 120, and 125 °C), and the evolution of the relative crystallinity (Wc) with the testing time was analyzed through the Avrami approach [57,58,59]. This model considers the evolution of the crystallization process of amorphous solids under isothermal conditions. Under the hypothesis of homogeneous nucleation on the material, the evolution of the relative crystallinity with the time Wc(t,T) can be expressed through a sigmoidal trend, as reported in Equation (2).
W c ( t , T ) W c = 1 e ( k ( T ) · t n )
where Wc∞ is the maximum crystallinity degree, k(T) is the kinetic constant, and n is the Avrami coefficient. The kinetic constant depends on the temperature, while the Avrami coefficient depends on the morphology of the crystallites during the isothermal process. In the literature, an n value comprised between 1 and 5 is generally reported.
Vicat softening temperature was determined in accordance with the ASTM D1525 standard through an ATS-FAAR mod. MP/3 machine (Milan, Italy). Rectangular samples 10 long, 5 wide and 4 mm thick were tested, imposing a load of 10 N at 2 °C·min−1 in the range 40–100 °C. The results represent the average of three specimens.
Dynamic mechanical thermal analysis (DMTA) tests were carried out in tensile mode with a MkII Polymer Laboratories (Loughborough, UK) analyzer, in the temperature range from 0 to 100 °C at a heating rate of 3 °C·min−1, by imposing a pre-stress of 0.2 MPa and a sinusoidal displacement with a peak-to-peak amplitude of 32 µm and a frequency of 1 Hz. Rectangular specimens 0.8 mm thick and 5 mm wide were tested, with a gage length of 17 mm. The trends of the storage modulus (E′), of the loss modulus (E″), and of the loss tangent (tanδ) with the testing temperature were determined. Moreover, the coefficient of linear expansion at temperatures below and above the glass transition temperature (Tg) was determined through the evaluation of the thermal strain data. Moreover, multifrequency tests were conducted at 0.3, 1, 5, 10, 30 Hz in a temperature range from 0 to 80 °C at a heating rate of 0.5 °C·min−1, with dynamic displacement of 32 µm and pre-stress of 0.2 MPa. According to a frequency–temperature superposition principle [60], storage modulus master curves (E′) at the reference temperature of 30 °C and correspondingly the shift factor values (logaT) as a function of the temperature were determined. The Arrhenius approach was used to evaluate (i) the activation energy of the shift factor below and above Tg, and (ii) the activation energy of the transition from the damping peak (see details in Section 3.3.2).

3. Results and Discussion

Various compositions were characterized and compared in terms of processability and morphological structure. The results of the thermal and viscoelastic characterization are reported and discussed in the following sections.

3.1. Microstructural Analysis and Processability of the Materials

It is well known that the thermo-mechanical behavior of particulate nanocomposite is strongly influenced by the aggregation state of the nanofiller within the polymer matrix. Therefore, a detailed morphological analysis could give important information about the influence of the nanofiller content on the silica dispersion behavior in PLA. In Figure 1, FESEM images of the fracture surface of PLA-based nanocomposites are reported. PLA-Ar805-1 and PLA-Ar805-2 samples were characterized by the presence of iso-dimensional-fumed silica aggregates having a mean dimension of less than 100 nm. This confirms that a good silica dispersion was obtained during the melt compounding process. As reported in our previous paper on the mechanical behavior of PLA nanocomposites [46], the presence of the organosilane on the surface of the nanoparticles leads to the formation of silica aggregates with lower size, and this microstructural feature positively affects the fracture behavior of the material. This interpretation is supported by the conclusions reported in a paper of Wichmann et al. [61], in which the influence of the surface treatment on mechanical behavior of fumed silica/epoxy resin nanocomposites was investigated. Additionally, in that work, the improvement of the dispersibility of functionalized silica nanoparticles was attributed to a weakening of the inter-particle attractive forces due to the presence of a surface compatibilizer. As the filler concentration increased, a higher surface corrugation and a marked aggregation tendency could be detected. Such aggregates explain the detrimental effects on the tensile behavior of the composites observed at elevated filler loadings in our previous paper on these systems [46].
An evaluation of the processability of the prepared samples is of fundamental importance from a technological point of view. Therefore, melt flow index (MFI) tests were performed. In Table 1, melt flow index (MFI) values of PLA-based nanocomposites at different temperatures, with an applied weight of 2.16 kg, are reported. It is interesting to note how the processability of the material was not affected until there was a silica amount of 2 vol%, regardless of the testing temperature. MFI values of the tested materials started to considerably decrease for silica contents higher than 4 vol%. For instance, MFI values at 170 °C passed from 5.7 to 2.3 g/10 min with a filler concentration of 8 vol%. As reported in rheological studies on PLA-grafted silica nanocomposites [37], the observed viscosity increase could be attributed to the formation of physical crosslinking points and a percolative network. In these conditions, the flow of the molten polymer was hindered by the silica network within the material, with a consequent melt viscosity increase. On the other hand, the fluidity of the material increased with the temperature, and the activation energy of the process, calculated according to Arrhenius plot [62], showed only minor variation with the composition, ranging from 89 for the PLA matrix to 82–94 kJ/mol for fumed silica nanocomposites, as shown in Table 1. These results were lower than those determined for PLA copolymer of a higher molecular weight (208 kJ/mol), as direct dependence on polymer chain length and mobility. From these findings, it is possible to conclude that PLA-FS nanocomposites could be rather easily processed by properly adjusting the temperature with the filler content. For instance, nanocomposite at 24 vol% exhibited at 210 °C the same melt flow of PLA matrix at 170 °C.

3.2. Thermal Properties

3.2.1. Thermogravimetric Analysis (TGA)

In addition, the thermal degradation behavior of the prepared materials could be of some technological importance. In the present paper, thermogravimetric analysis was thus performed under a nitrogen atmosphere on the prepared materials. In Figure 2, TGA thermograms of neat PLA and relative nanocomposites are reported, while in Table 2 the most important results are summarized. Nanosilica introduction determined a slight increase of the temperature associated with a mass loss of 5% (T5%), i.e., only 3 °C with a silica loading of 24 vol%.
Interestingly, the decomposition temperature (Td) was shifted towards higher temperatures, even at elevated filler amounts. For instance, a Td shift of 10 °C was registered with a silica amount of 8 vol%. According to the conclusions reported in our previous paper on the thermal stability of high-density polyethylene-fumed silica nanocomposites, the thermal degradation stabilization observed for nanosilica filled samples could be explained in terms of their ablative behavior [29]. In fact, during the thermal degradation of the specimen, silica aggregates tended to agglomerate on the surface of the molten polymer, creating a physical barrier that protected the rest of the polymer and hindered the volatilization of the oligomers generated during the combustion process. The ability to form this protective shield depended on the capability of silica aggregates to form a continuous barrier, as shown also by Chen et al. [44], in PLA nanocomposites up to 10% of silica. According to the FESEM images reported in Figure 1, the relatively fine dispersion of silica aggregates at all the considered concentrations permitted the creation of an efficient barrier even at limited filler contents. Increasing the silica concentration, the mean distance between the aggregates was considerably reduced, and the formation of a thicker and stronger protective shield was therefore favored. Interestingly, the residue left after the combustion of neat PLA in the air was nearly zero, as all the organic components decomposed into gaseous products, while the remaining mass at 700 °C (m700) of the nanofilled samples corresponded to the actual nanosilica mass percentage (i.e., very close to the theoretical one).

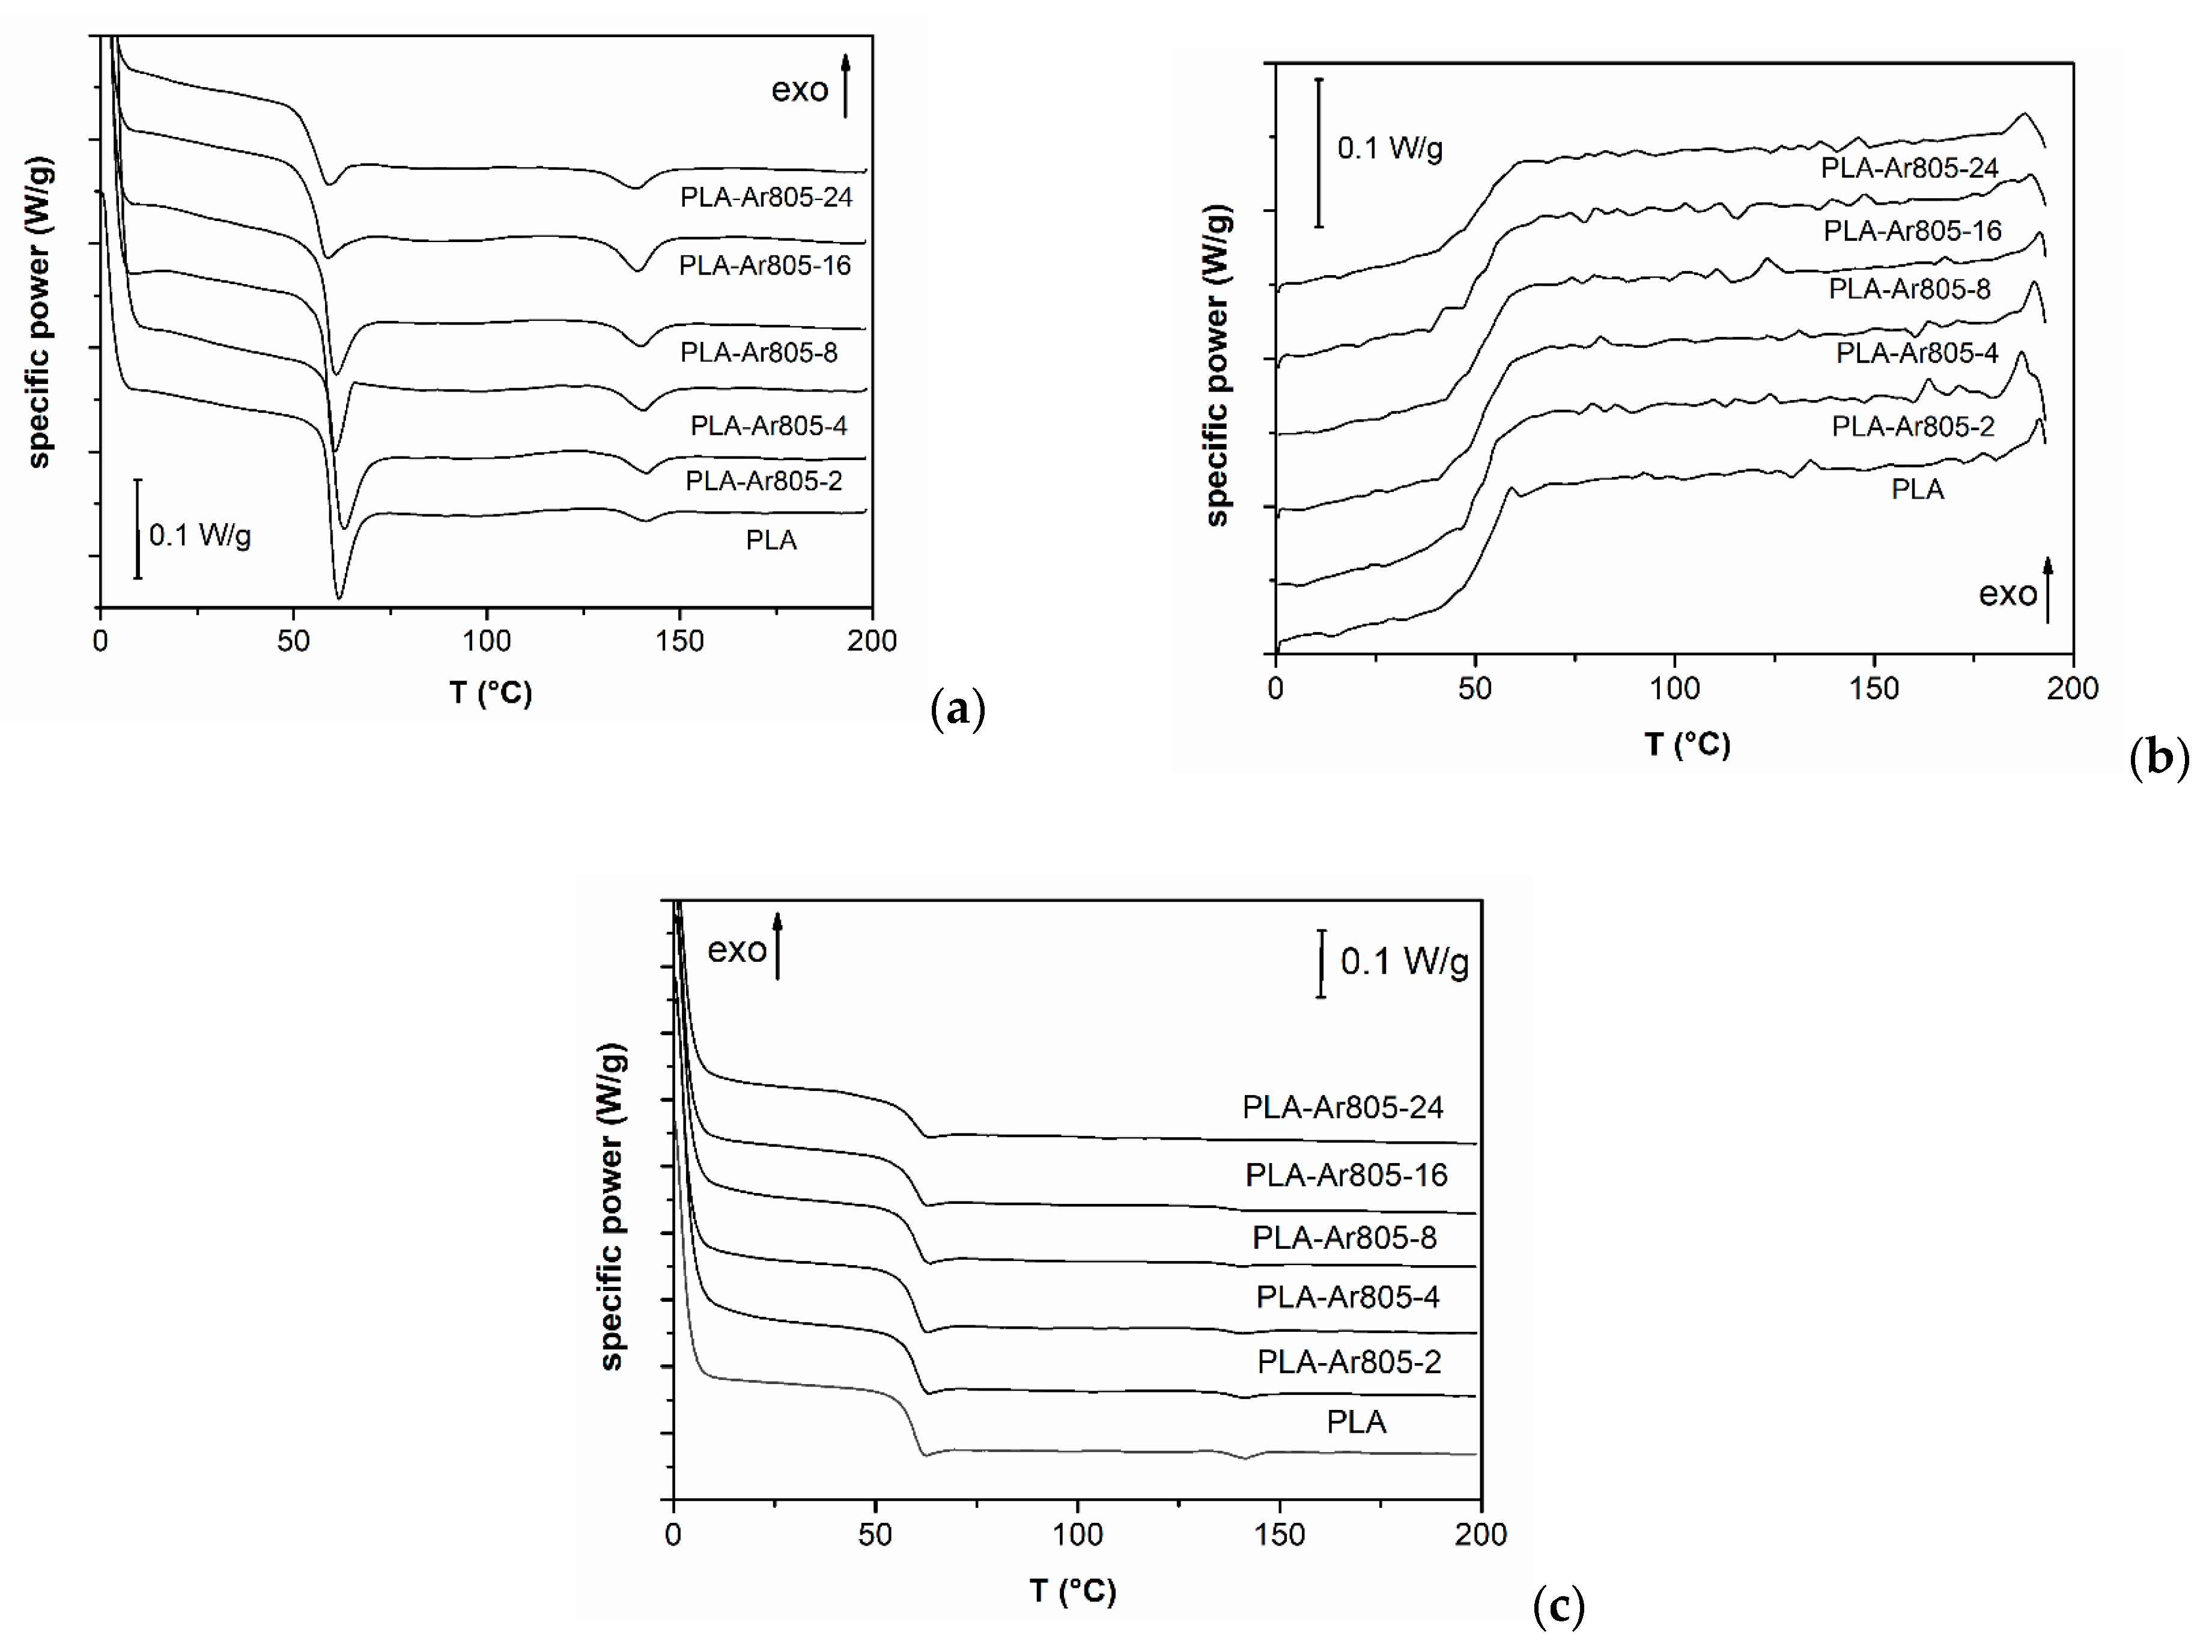
3.2.2. Calorimetric Characterization (DSC) and Kinetics Analysis of Crystallization

It has been widely demonstrated that the physical behavior of PLA is highly influenced by its thermal properties. In particular, both the glass transition temperature and the crystallinity degree profoundly affect the mechanical properties of the resulting materials [10,11]. In Figure 3a–c, DSC thermograms (first, heating–cooling; second, heating) on neat PLA and relative nanocomposites samples are reported, while in Table 3 the most significant results are summarized.
The main signal of PLA was the Tg centered at around 60 °C, and only a small melting peak could be detected at around 140 °C [9]. In the cooling step at −10 °C/min, it was interesting to note the delay in Tg signal of fumed silica filled nanocomposites, as a consequence of the reduced mobility of polymer chain determined by the filler, and the total absence of any crystallization. In addition, in the second heating scan, the signal associated with the melting peak was only partially detectable at 140 °C, and an average Tg of 59.9 ± 0.4 °C for FS nanocomposites could be determined. In our previous paper on cycloolefin copolymer (COC)-silica nanocomposites [28], a slight Tg increase was observed from DMTA analysis at elevated silica amounts. However, the observed Tg enhancement in that work was very limited (not more than 2 °C with a silica loading of 2 vol%). It is interesting to note how the Tg was not substantially affected by nanosilica introduction. Moreover, crystallizability, crystallinity degree (Wc), and melting temperature (Tm) did not seem to be affected by nanosilica addition. At a general level, it can be concluded that the thermal behavior of both neat PLA and of the relative nanocomposites samples is typical of an amorphous material.
It is also important to consider that PLA-based materials are prone to long-time crystallization under certain environmental conditions, and either crystallizability or an optimal crystallization temperature of commercial PLA are crucial for the significant influence on the physical properties of the resulting products [63]. Therefore, a detailed analysis on the crystallization kinetics on the prepared samples could give interesting information about the role played by silica nanoparticles on the crystallization capability of PLA. With this aim, isothermal DSC tests were performed at different temperatures. In Figure 4a–d, crystallization kinetics investigation of PLA and PLA-Ar805-8 nanocomposite samples are reported.
The PLA-Ar805-8 composition was selected because it represents the best compromise between processability of PLA nanocomposite systems and their mechanical properties (stiffness, toughness, and creep stability), as reported in our previous paper [46]. In Figure 4a,b, relative crystallinity values as a function of the testing time in a temperature interval between 80 and 125 °C are reported, while in Figure 4c,d the trends of the k and n coefficients of the Avrami model (see Equation (2)) at different temperatures are shown. Considering DSC thermograms reported in Figure 4a, it is interesting to note how, in the testing time of 10,000 s, the neat PLA sample was able to reach a plateau Wc value of about 25% for temperatures higher than 85 °C. The fastest crystallization rate can be detected for a temperature of 100 °C, while a further temperature increase determines a slowing of the crystallization process. This behavior can be explained considering that crystallization dynamics in semicrystalline polymers are governed by a balance between crystal nucleation and growth processes. At low temperatures, crystal nucleation is favored, but their growth is hindered by the limited molecular mobility. At higher temperatures, the opposite trend can be detected. From the thermograms of the PLA-Ar805-8 nanocomposite sample (Figure 4b), it is possible to notice that the plateau Wc value (i.e., 25%) could be reached at a temperature of 100 °C, and the maximum crystallization rate could be registered at 110 °C. Analyzing the trends of the kinetic constant of the Avrami equation (k), reported in Figure 4c, it is possible to notice that nanocomposite sample followed substantially the same behavior of the neat matrix, with a theoretical maximum crystallization rate located at about 105 °C. From the trends of the n coefficient, reported in Figure 4d, it is possible to conclude that for neat PLA, n assumed a value of 3.2 in correspondence with high crystallization rate temperatures (around 100 °C), while at 85 and 120 °C n was about 4.0. This trend could be tentatively explained considering that at lower crystallization rates a better crystallite order could be achieved, and n assumed thus a higher value. For the nanocomposite sample, the n coefficient seemed to be practically unaffected by the testing temperature and assumed a fairly constant value near to 4.0. In literature, it is generally reported that n values for PLLA between 2 and 3.5 could be associated with the formation of crystals with spherulitic morphology [64,65,66]. Therefore, it can be concluded that the presence of the nanosilica did not substantially affect the crystallization kinetics of the materials, nor the morphology of the crystals. The poor influence of fumed silica nanoparticles on the crystallization properties of polymer matrices was already detected in our previous paper on polyolefin-fumed silica nanocomposites [25]. In those papers, this behavior was explained considering that the amorphous nature of silica nanoparticles did not promote the nucleation of crystals around the nanofiller surface, as previously observed for PLA at high enantiomeric purity [67].

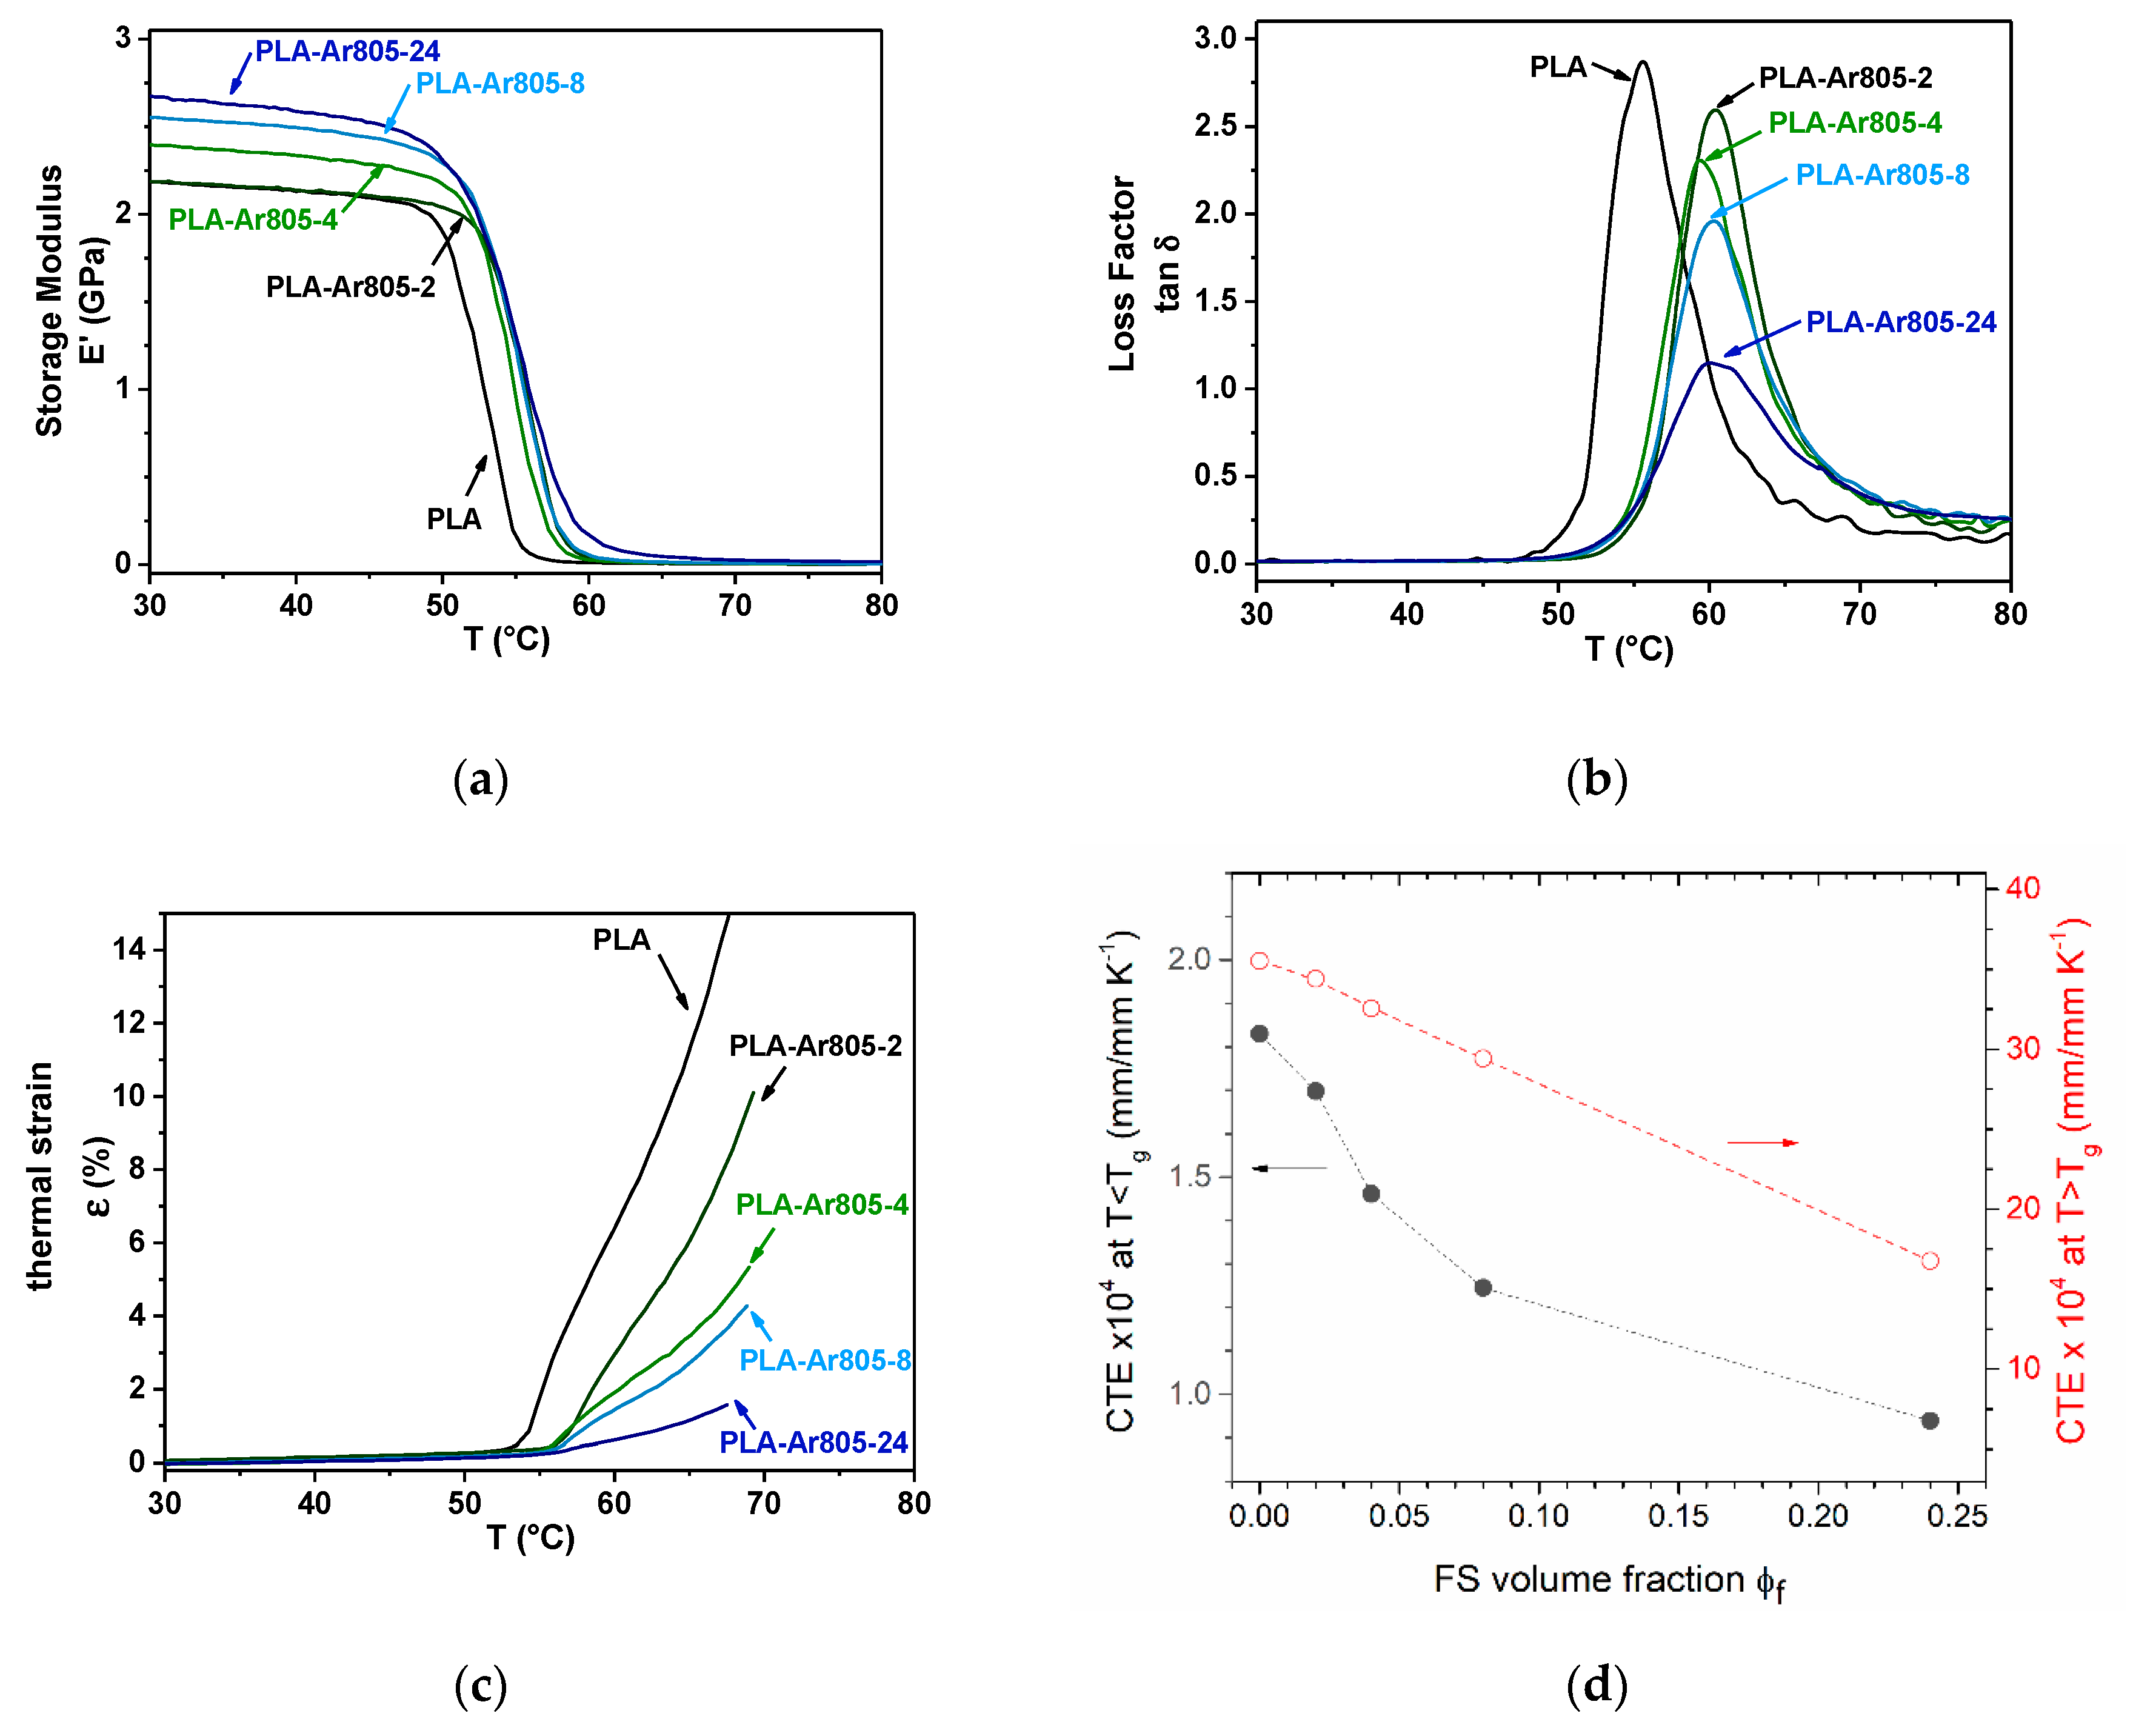
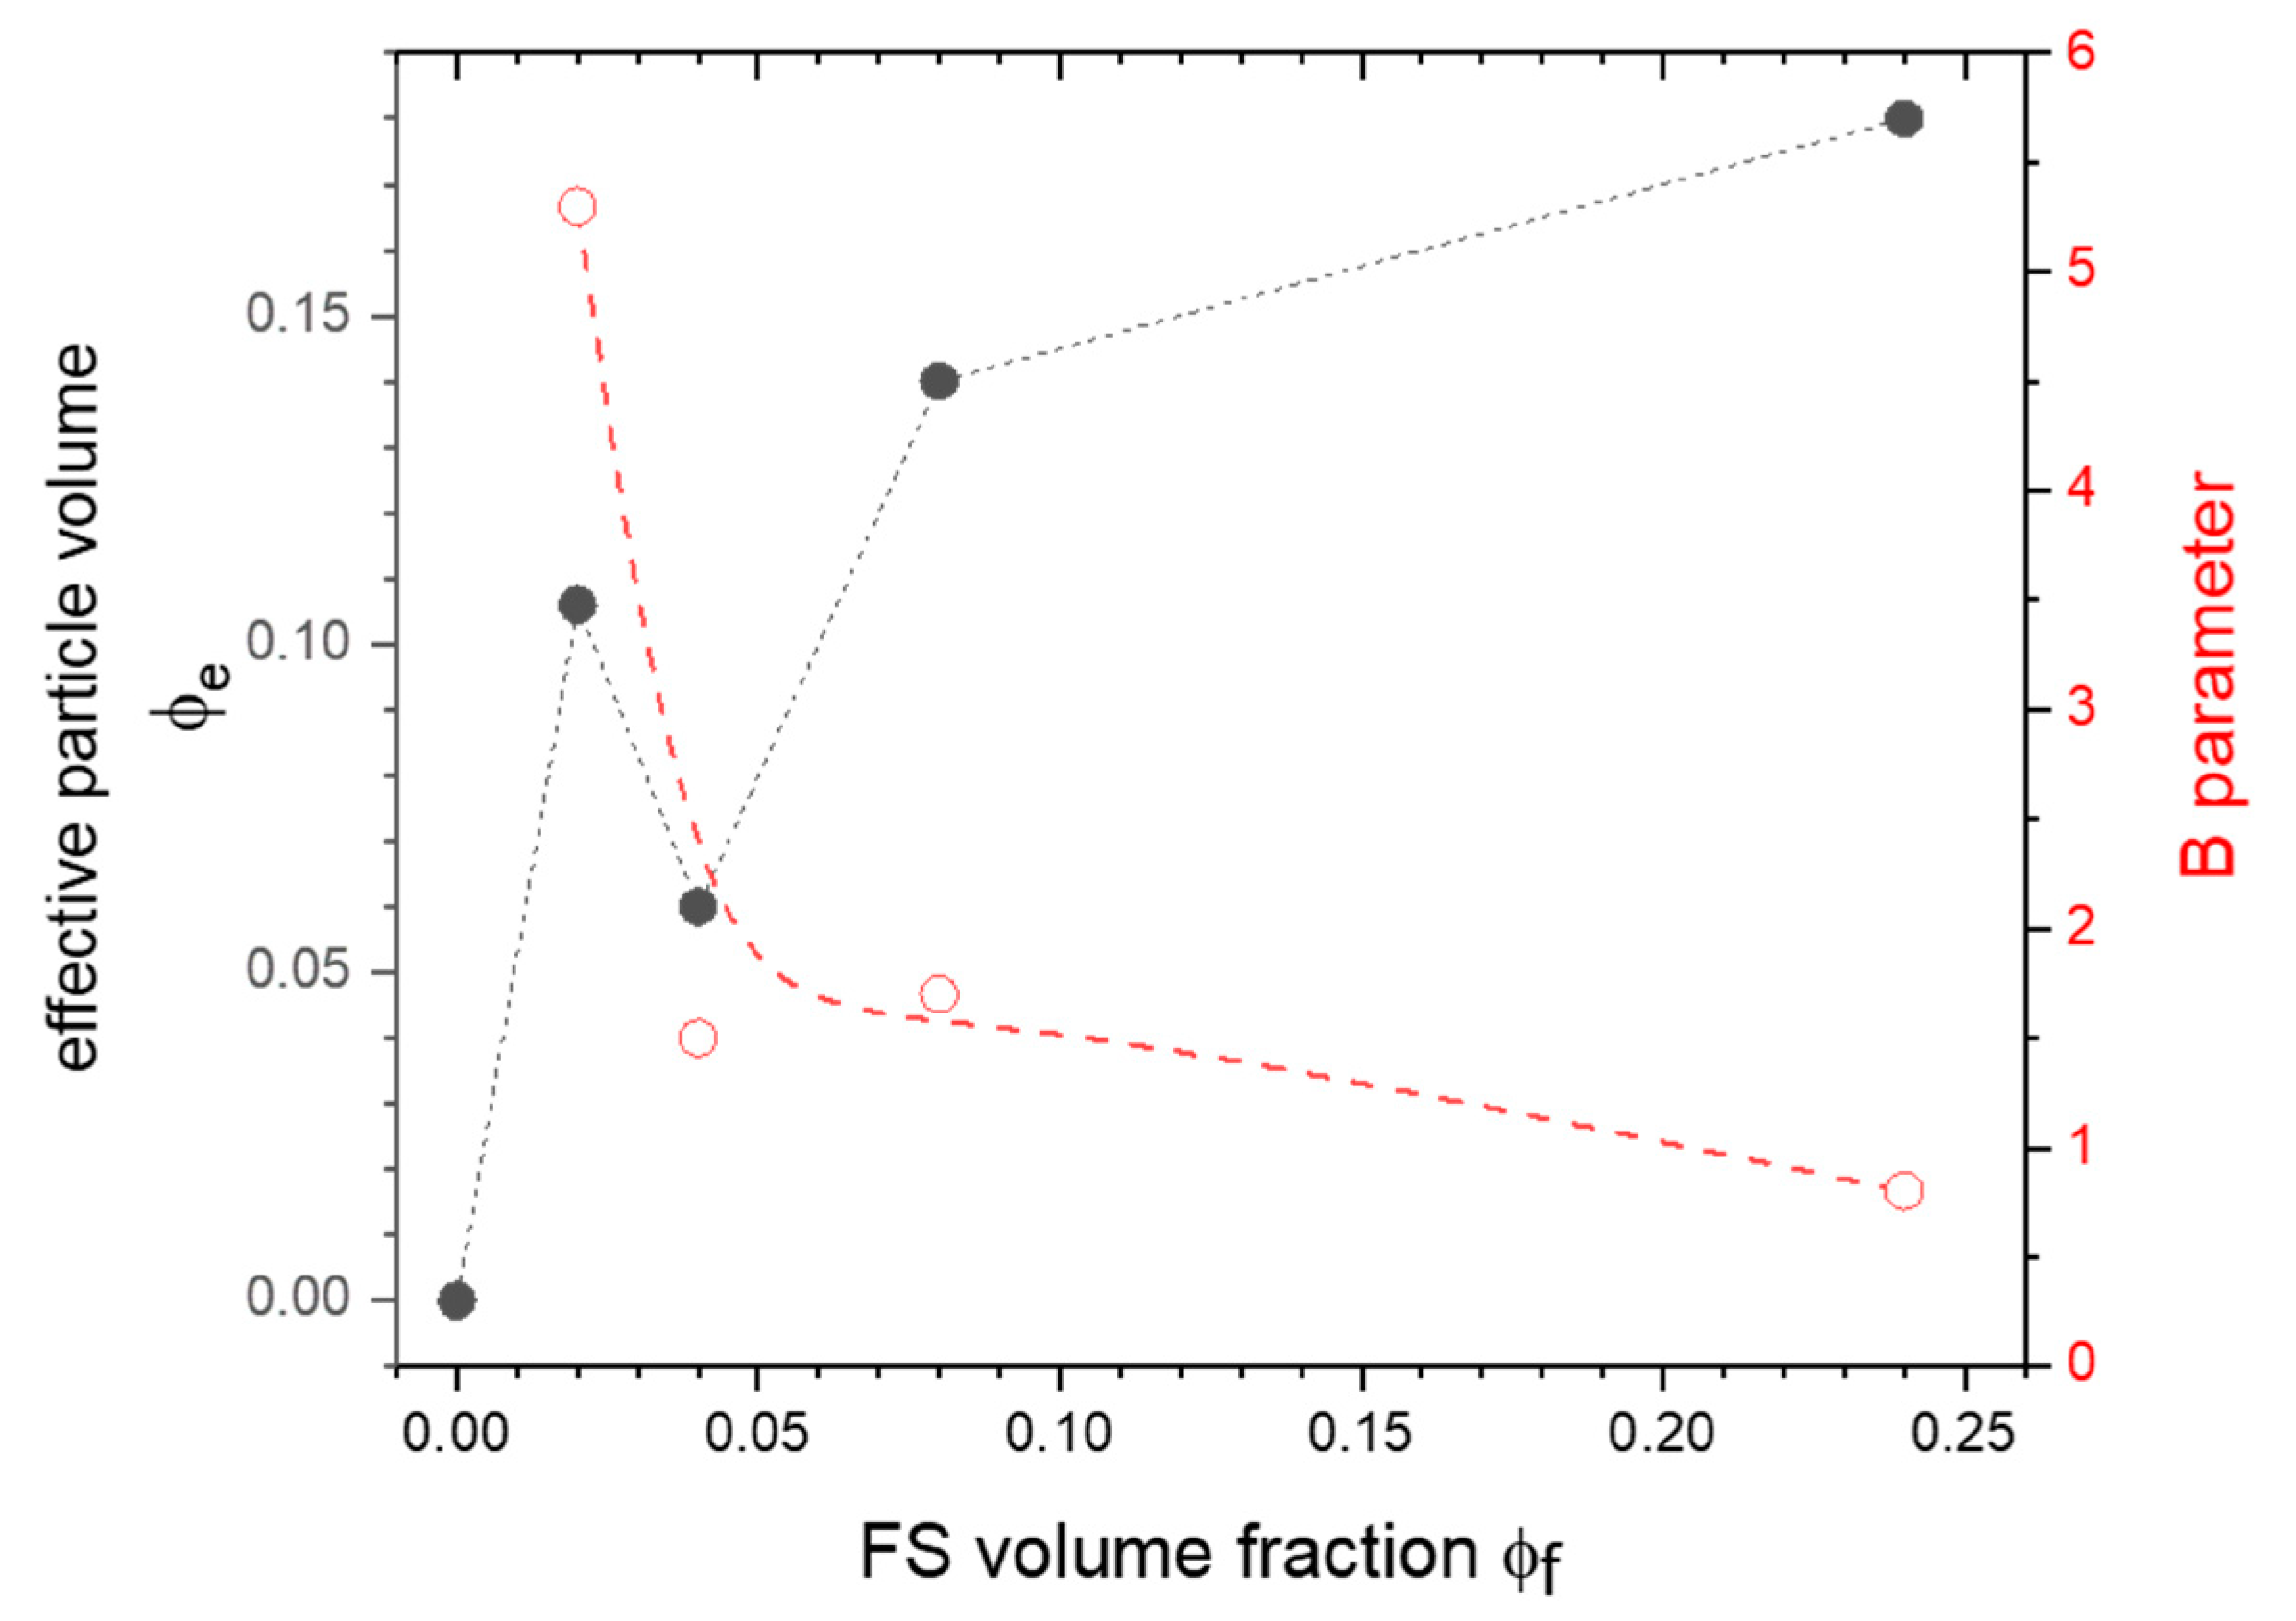
3.3. Dynamical Mechanical Analysis

3.3.1. Monofrequency DMTA Analysis and Vicat Grade

The dimensional stability and the dependency of the viscoelastic properties from the temperature is a key parameter in the design of engineering plastics for packaging applications. Therefore, DMTA analysis was carried out on PLA and the relative nanocomposites. In Figure 5a–d the trends of the dynamic moduli (E′, E″), of the loss tangent (tanδ), and of the thermal expansion coefficient (CTE) from DMTA tests performed at 1 Hz are reported. The most important results from DMTA analysis (E′ at different temperatures, Tg and thermal strain at 65 °C) are summarized in Table 4.
It is worth noting that nanosilica introduction determined an important increase of E′ with respect to the neat PLA. For instance, the E′ at 25 °C passed from 2180 MPa for the unfilled PLA to 2710 MPa (+24%) with a filler amount of 24 vol%. A similar stiffness increase was detected under quasi-static conditions in our previous paper on these systems [46]. As often happens with filled amorphous polymers, the stiffening effect above the Tg was even more pronounced, as previously observed in PLA/hydroxyapatite composites [21]. The relative E′ increase experienced at 60 °C for the 24 vol% filled samples was 1500%. This is due to the fact that the stiffening effect provided by silica nanoparticle was more evident when the difference between the elastic modulus of the filler and that of the matrix increased. The stabilizing effect due to nanosilica introduction could also be detected in the systematic lowering and shifting of damping peak (see Figure 5b and Table 4), reducing consequently the dissipation energy in the glass transition zone. In the present case, the E′ increase at 60 °C evidenced for nanofilled samples was partly related to the Tg shift due to silica introduction. In fact, a Tg increase of about 4 °C could be registered for all silica nanocomposite samples (see Figure 5b and Table 4). The Tg shift was also confirmed by the damping curves, as depicted in Figure 5c. The glass transition temperature increase observed in DMTA tests was in contrast with the conclusion reported in DSC tests (see Table 3). This discrepancy could be attributed to the different testing configuration of the two techniques, and to the different thermal processes to which the samples were subjected in these tests. A slight increase of the Tg due to nanosilica addition was also reported in other papers of our group on other amorphous systems [28]. In these works, the increase in the material stiffness and of Tg found for nanocomposites was generally attributed to the reduction of chain mobility due to physical filler/matrix interactions. The stiffening effect and the reduction of polymer chain mobility in the Tg zone due to nanofiller introduction were also confirmed by the trends of the width of the loss tangent curves, as reported in Table 4. The positive contribution played by silica nanoparticles on the stability of the prepared nanocomposites was also reflected in the progressive reduction of thermal strain (Figure 5c) and the consequent strong reduction of the thermal coefficient expansion (CTE) over the whole range of considered temperatures, as shown in Figure 5d. In particular, below Tg, nanosilica introduction at a concentration of 24 vol% determined a reduction of the CTE from 1.83 × 10 to 0.94 × 10⁴ K−1, i.e., more than 40%. It should be noted that the observed reduction was even more effective for lower filler contents (i.e., 2–8 vol%), because of the better nanofiller dispersion. Moreover, the effect was also evident above the glass transition temperature, where an almost linear decrease of CTE was observed, from 35.5 × 10 of PLA to 16.8 × 10⁴ K−1 of PLA-Ar805-24 sample.
The loss modulus peak (alpha transition) could also be properly used for the evaluation of the interphase in composite as a function of filler fraction ϕf according to the expression of the Sumita model, reported in Equation (3) [68]:
E P L A _ F S E P L A = ( 1 ϕ e ) 1 = ( 1 ϕ f B ) 1
where ϕe is the effective particle volume fraction, B parameter is the effective volume per single particle, and E″PLA-FS and E″PLA represent the maximum values of the loss modulus peak of the composites and the neat matrix, respectively. The results are shown in Figure 6. The effective particle volume fraction ϕe generally increased with the filler content, evidencing a relative minimum at 4 vol%. On the other hand, the large initial decrease of the B parameter suggested that the extent of the particle agglomeration increased, as previously determined also in nanocomposite polyolefin fibers with hydrotalcite [69] or fumed silica [32]. However, above 4 vol% the B parameter exhibited an almost constant value until 24 vol% of fumed silica, suggesting a relatively minimum level of aggregation in the tested composition range, in agreement with the results of morphological analysis (see Figure 1).
Correspondingly, Vicat tests also confirmed the positive effect played by nanosilica on the stability of the prepared materials. In Figure 7, Vicat penetration curves of PLA and relative nanocomposites are reported, while in Table 4 the numeric results are summarized. It is evident that nanosilica addition promoted an evident decrease of the slope of the penetration curves above the glass transition temperature. Therefore, a Vicat grade of PLA-Ar805-24 sample was 8 °C higher than that of the neat PLA. These results are of relevant importance in the design of PLA-based components for packaging applications.

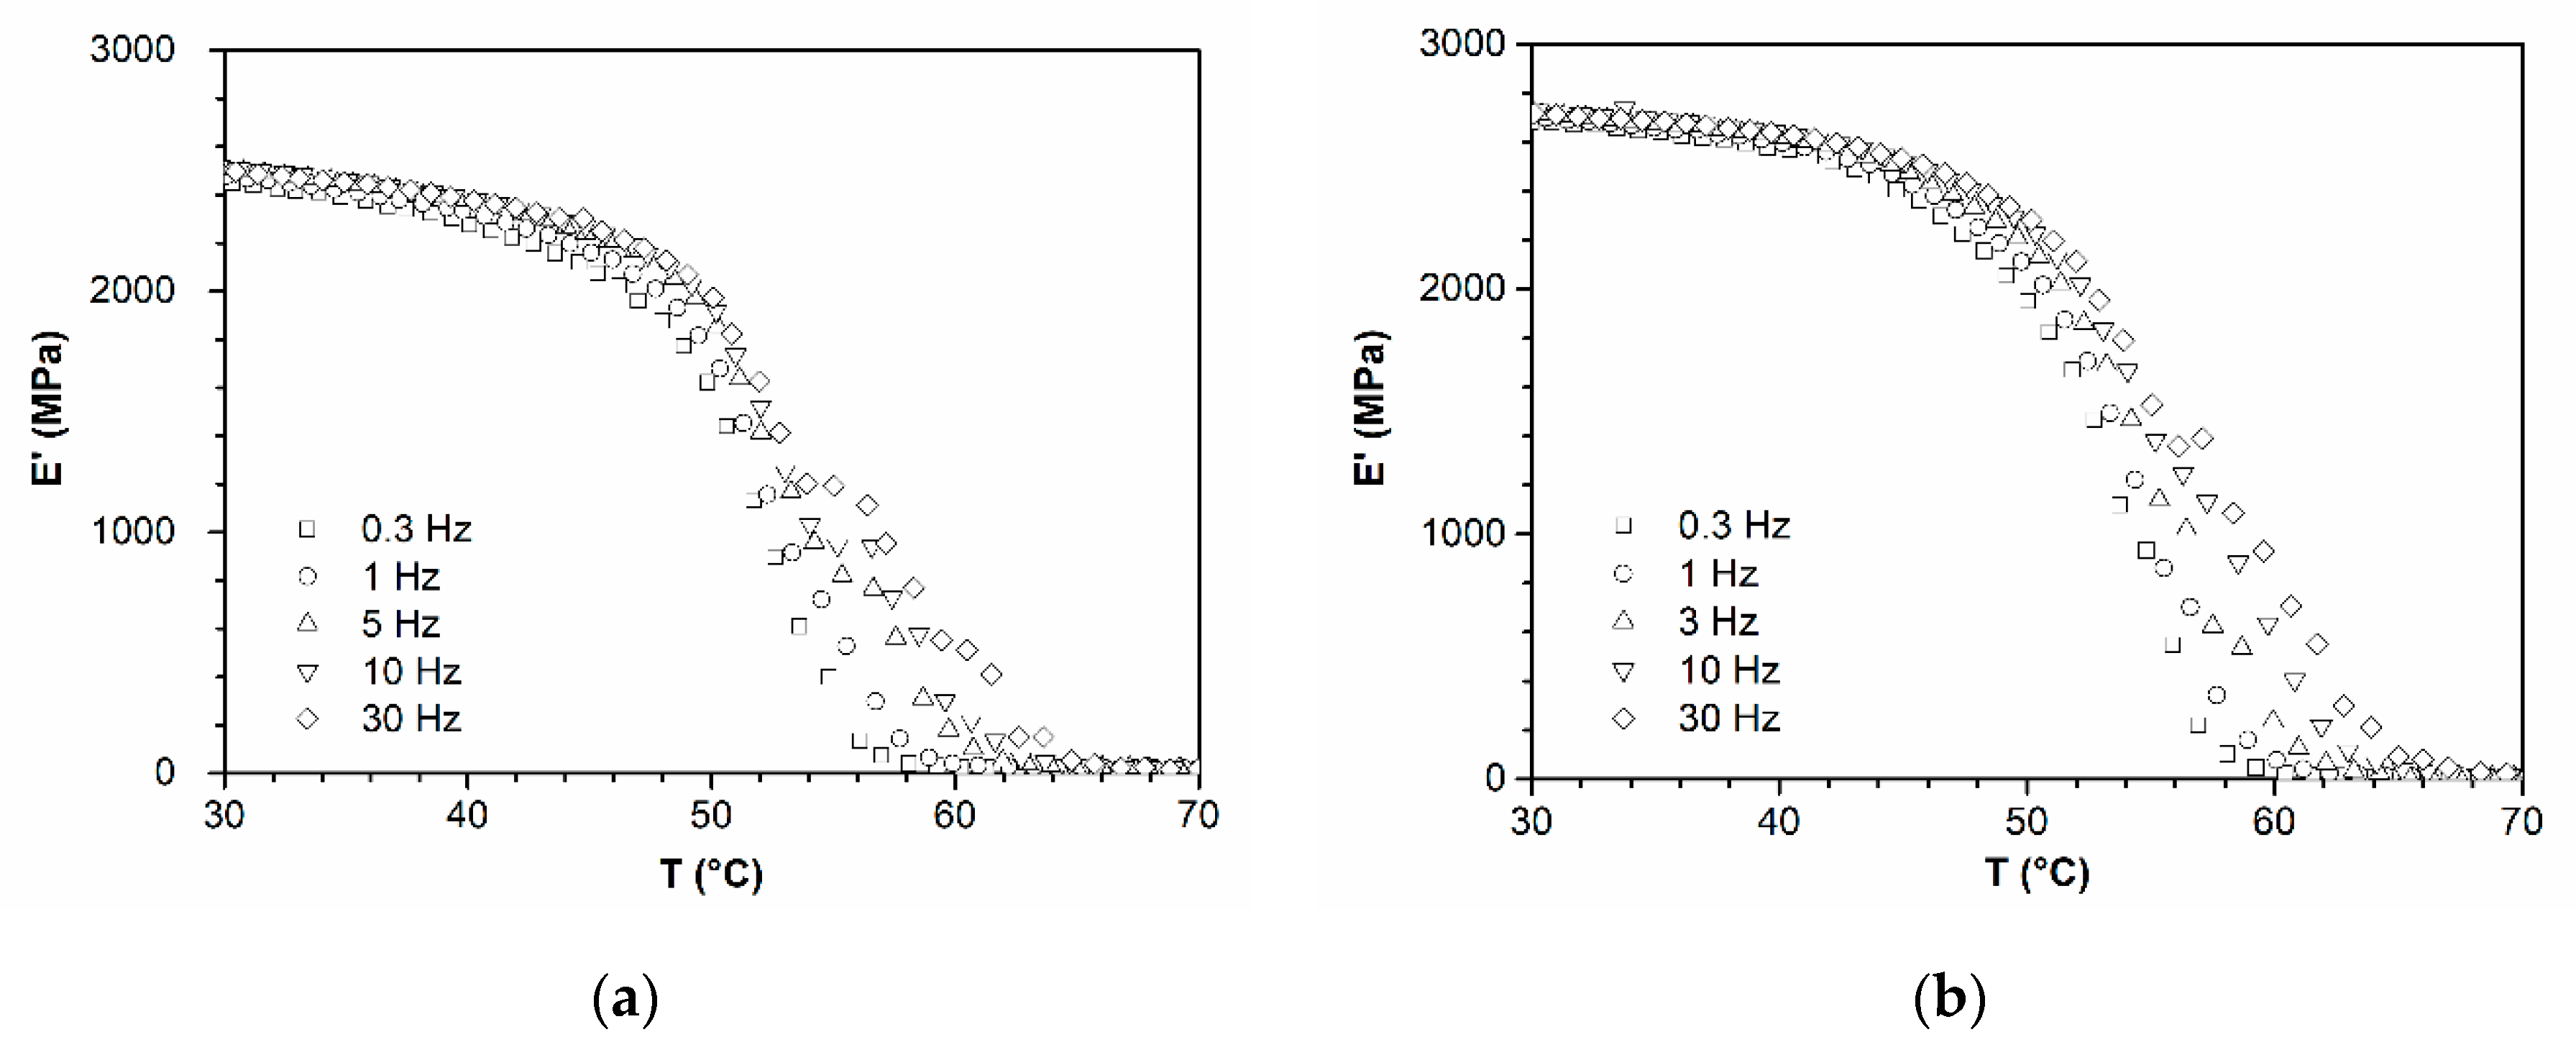
3.3.2. Multifrequency DMTA Analysis

In order to further investigate the viscoelastic properties of the prepared materials, multifrequency DMTA tests were also carried out. In Figure 8a,b, the storage modulus curves at different frequencies of PLA and PLA-Ar805-8 samples are respectively reported. As expected, the higher the frequency, the higher the storage modulus, and the higher the temperature of damping peak (not shown for brevity), in agreement with previous results obtained on PLLA and PLLA/hydroxyapatite composites [21]. Moreover, the higher the filler content, the higher the storage modulus in the entire range of tested frequencies (0.3–30 Hz).
Moreover, through the application of the frequency–temperature superposition principle, master curves of storage modulus were built, selecting a reference temperature of 30 °C, in a large frequency interval (about 10−20–108 Hz), as shown in Figure 9a. Once again, it is evident that fumed silica addition determined a systematic increase of E′ over the whole range of the testing frequencies, especially at elevated filler amounts. From the analysis of the trends of the shift factor (log10aT) with the temperature reported in Figure 9b, some differences between neat PLA and 2–8 vol% nanofilled samples could be observed, either below or above the Tg zone (about 50–60 °C). On the other hand, shift factor of 24 vol% nanocomposite results were very similar to that of PLA. Those comparisons appear much more evident considering the activation energy of shift factor ΔEsf determined considering an Arrhenius-type dependence, as reported in Equation (4):
l o g a T = l o g K Δ E s f R T
where K is the pre-exponential factor, R = 8.314 J/molK, and T the absolute temperature. The slope of the best fit line below (0–40 °C) and above Tg (55–70 °C) were considered. The results reported in Figure 9c evidence for composition of 4 vol% a relative maximum of 693 kJ/mol at a low temperature, and a ΔEsf value of 476 kJ/mol at a high temperature. These findings seem to be related to the good dispersion of filler, which progressively decreases with silica content, and consequently affects the polymer mobility in both glassy and rubbery states.
From multifrequency analysis, the dependence of Tg on frequency F could be also considered. The correspondent Equation (5) was utilized for the determination of activation energy at TgETg), as an indicator of the chain mobility in the transition from the glassy to the rubbery phase.
l o g F = l o g F 0 Δ E T g R   T g
where F0 is the pre-exponential factor, R = 8.314 J/molK, and Tg is the temperature of the damping peak at the selected frequency F. The results of best fit line are reported in Table 5, and show a higher activation energy for PLA (623 kJ/mol) with respect to FS nanocomposites, in analogy with the previous findings for PLLA and hydroxyapatite filled composites up to a concentration of 50 wt% [21]. It is also worth noting that ΔETg of PLA corresponds to ΔEsf (621 kJ/mol) at high temperature, whereas the values of nanocomposites result in between the correspondent ΔEsf values shown in Figure 9c.
The dynamic fragility of PLA and relative fumed silica nanocomposites could be estimated following the thermal methods proposed by Papageorgiou et al. for PLA and nanocomposites at 2.5 wt% of silica, montmorillonite, and multiwalled carbon nanotubes [53]. The fragility parameter m and the strength parameter (D) can be defined as reported in Equations (6) and (7), respectively:
m = Δ E T g ( ln 10 )   R   T g
D = ( ln 10 ) m m i n 2 m m m i n
where ΔETg is the activation energy at Tg, R = 8.314 J/mol K, and mmin = 16 is the reference according to Crowley and Zografi [70]. The higher the m parameter, the higher the fragility, and the higher the D parameter, the higher the strength. In the present calculation, experimental data from DMTA analysis were used, such as the activation energy determined from multifrequency analysis (see Table 5) and Tg as the maximum of damping peak at 1 Hz, as reported in Table 4.
The results evidenced a strength parameter D lower than 10 as an indicator of relative fragility, in accordance with the conclusions reported in the paper of Pa et al., where they found that the addition of 2.5 wt% of different nanofillers (hydrophilic fumed silica, montmorillonite, or carbon nanotubes) determined an increase of the dynamic fragility at Tg. On the contrary, in the present work, the addition of a hydrophobic fumed silica (i.e., Ar805) determined a reduction of the fragility parameter m in the range of about 9–18%, and a correspondent D increase of 12–28%, more pronounced for a filler concentration of 2–4 vol%.

4. Conclusions

Surface-treated fumed silica nanoparticles were melt-compounded at different amounts with a PLA matrix specifically designed for packaging applications. Thermo-mechanical behavior of the resulting materials was compared, in order to evaluate the effectiveness of the selected nanofiller in improving the mechanical stability of the prepared composites. The good nanofiller dispersion detected in FESEM micrographs was responsible for a slight increase of the thermal degradation resistance of the material, especially at an elevated silica amount. DSC tests revealed how the crystallization behavior of the sample was not significantly affected by the nanofiller addition. Interestingly, nanosilica introduction determined an important improvement of the E′, especially above the glass transition temperature, and the Vicat grade could also be improved at elevated filler amounts. The stabilizing effect due to silica introduction was confirmed by DMTA tests performed at different frequencies, and master curves were properly obtained. The Sumita model was successful applied for the evaluation of the nanoparticles’ dispersion. These results confirmed the potential of hydrophobic silica nanoparticles with a proper functionalization in the design of biodegradable materials for packaging applications, with improved dimensional stability at elevated service temperatures.

Supplementary Materials

The following data are available online at https://www.mdpi.com/2076-3417/10/19/6731/s1, Figure S1: Melt flow index of PLA and fumed silica nanocomposites at 170–190–210 °C.

Author Contributions

Conceptualization, L.F., A.D., A.P.; methodology, A.D., A.P.; validation, L.F.; data curation, L.F., A.D.; writing—original draft preparation, A.D.; writing—review and editing, L.F., A.D., A.P. All authors have read and agreed to the published version of the manuscript.

Funding

This research received no external funding.

Acknowledgments

The authors warmly acknowledge Massimo Sebastiani for his contribution to the experimental work.

Conflicts of Interest

The authors declare no conflict of interest.

Dedication

This paper is dedicated to the memory of Prof. Emo Chiellini (died on 21 August 2020).

References

  1. Kulkarni, R.K.; Pani, K.C.; Neuman, C.; Leonard, F. Polylactic acid for surgical implants. Arch. Surg. 1966, 93, 839–843. [Google Scholar] [CrossRef] [PubMed]
  2. Barrows, T.H. Degradable implant materials: A review of synthetic absorbable polymers and their application. Clin. Mater. 1986, 1, 233–257. [Google Scholar] [CrossRef]
  3. Chiellini, E.; Solaro, R. Recent Advances in Biodegradable Polymers and Plastics; Wiley-VCH Verlag: Weinheim, Germany, 2003. [Google Scholar]
  4. Tsuji, H. Polylactide. In Biopolymers Polyesters III Applications and Commercial Products; Doi, Y., Steinbuchel, A., Eds.; Wiley VCH Verlag: Weinheim, Germany, 2002; pp. 129–177. [Google Scholar]
  5. Auras, R.; Lim, L.T.; Selke, S.E.M.; Tsuji, H. Poly(Lactic Acid): Synthesis, Structures, Properties, Processing, and Applications; John Wiley & Sons: Hoboken, NJ, USA, 2010. [Google Scholar]
  6. Jiménez, A.; Peltzer, M.; Ruseckaite, R. Poly(lactic acid) Science and Technology: Processing, Properties, Additives and Applications. Polymer Science, Series; Royal Society of Chemistry: Cambridge, UK, 2014. [Google Scholar]
  7. Farah, S.; Anderson, D.G.; Langer, R. Physical and mechanical properties of PLA, and their functions in widespread applications—A comprehensive review. Adv. Drug Deliv. Rev. 2016, 107, 367–392. [Google Scholar] [CrossRef] [PubMed] [Green Version]
  8. Lunt, J. Large-scale production, properties and commercial applications of polylactic acid polymers. Polym. Degrad. Stab. 1998, 59, 145–152. [Google Scholar] [CrossRef]
  9. Fambri, L.; Migliaresi, C. Crystallization and thermal properties. In Poly(lactic acid): Synthesis, Structures, Properties, Processing, and Applications; Auras, R., Lim, L.T., Selke, S.E.M., Tsuji, H., Eds.; John Wiley & Sons: Hoboken, NJ, USA, 2010; pp. 113–124. [Google Scholar]
  10. Garlotta, D. A literature rewiew of poly(lactic acid). J. Polym. Environ. 2002, 9, 63–81. [Google Scholar] [CrossRef]
  11. Perego, G.; Cella, G.D.; Bastioli, C. Effect of molecular weight and crystallinity on poly(lactic acid) mechanical properties. J. Appl. Polym. Sci. 1996, 59, 37–43. [Google Scholar] [CrossRef]
  12. Auras, R.; Lim, L.T. Processing technologies for poly(lactic acid). Prog. Polym. Sci. 2008, 33, 820–852. [Google Scholar] [CrossRef]
  13. Auras, R.; Harte, B.; Selke, S. An overview of polylactides as packaging materials. Macromol. Biosci. 2004, 4, 835–864. [Google Scholar] [CrossRef]
  14. Oksman, K.; Skrifvars, M.; Selin, J.F. Natural fibres as reinforcement in polylactic acid (PLA) composites. Compos. Sci. Technol. 2003, 63, 1317–1324. [Google Scholar] [CrossRef]
  15. Miao, C.; Hamad, W.Y. Cellulose reinforced polymer composites and nanocomposites: A critical review. Cellulose 2013, 20, 2221–2262. [Google Scholar] [CrossRef]
  16. Murariu, M.; Dubois, P. PLA composites: From production to properties. Adv. Drug Deliv. Rev. 2016, 107, 17–46. [Google Scholar] [CrossRef] [PubMed]
  17. Raquez, J.-M.; Habibi, Y.; Murariu, M.; Dubois, P. Polylactide (PLA)-based nanocomposites. Prog. Polym. Sci. 2013, 38, 1504–1542. [Google Scholar] [CrossRef]
  18. Ray, S.S.; Yamada, K.; Okamoto, M.; Ogami, A.; Ueda, K. New Polylactide/Layered Silicate Nanocomposites. 3. High-Performance Biodegradable Materials. Chem. Mater. 2003, 15, 1456–1465. [Google Scholar] [CrossRef]
  19. Lewitus, D.; McCarthy, S.; Ophir, A.; Kenig, S. The effect of nanoclays on the properties of PLLA-modified polymers Part 1: Mechanical and thermal properties. J. Polym. Environ. 2006, 14, 171–177. [Google Scholar] [CrossRef]
  20. Singha, S.; Hedenqvist, M.S. A Review on Barrier Properties of Poly(Lactic Acid)/Clay Nanocomposites. Polymers 2020, 12, 1095. [Google Scholar] [CrossRef] [PubMed]
  21. Fambri, L.; Kesenci, K.; Migliaresi, C. Characterization of modulus and glass transition phenomena in poly(L-lactide)/hydroxyapatite composites. Polym. Compos. 2003, 24, 100–108. [Google Scholar] [CrossRef]
  22. Sun, J.; Shen, J.; Chen, S.; Cooper, M.A.; Fu, H.; Wu, D.; Yang, Z. Nanofiller Reinforced Biodegradable PLA/PHA Composites: Current Status and Future Trends. Polymers 2018, 10, 505. [Google Scholar] [CrossRef] [Green Version]
  23. Dorigato, A.; Pegoretti, A.; Kolarik, J. Nonlinear tensile creep of linear low density polyethylene/fumed silica nanocomposites: Time-strain superposition and creep prediction. Polym. Compos. 2010, 31, 1947–1955. [Google Scholar] [CrossRef]
  24. Dorigato, A.; D’Amato, M.; Pegoretti, A. Thermo-mechanical properties of high density polyethylene—Fumed silica nanocomposites: Effect of filler surface area and treatment. J. Polym. Res. 2012, 19, 9889. [Google Scholar] [CrossRef]
  25. Dorigato, A.; Pegoretti, A. Tensile creep behaviour of poly(methylpentene)-silica nanocomposites. Polym. Int. 2010, 59, 719–724. [Google Scholar] [CrossRef]
  26. Dorigato, A.; Govaert, L.E.; Pegoretti, A. Lifetime assessment of high-density polyethylene–silica nanocomposites. Nanomater. Nanotechnol. 2019, 9, 1–11. [Google Scholar] [CrossRef] [Green Version]
  27. Dorigato, A.; Pegoretti, A. (Re)processing effects on polypropylene/silica nanocomposites. J. Appl. Polym. Sci. 2014, 131, 40242. [Google Scholar] [CrossRef]
  28. Dorigato, A.; Pegoretti, A.; Fambri, L.; Slouf, M.; Kolarik, J. Cycloolefin copolymer/fumed silica nanocomposites. J. Appl. Polym. Sci. 2011, 119, 3393–3402. [Google Scholar] [CrossRef]
  29. Dorigato, A.; Pegoretti, A.; Frache, A. Thermal stability of high density polyethylene—Fumed silica nanocomposites. J. Therm. Anal. Calorim. 2012, 109, 863–873. [Google Scholar] [CrossRef]
  30. Dorigato, A.; Pegoretti, A.; Penati, A. Linear low-density polyethylene/silica micro- and nanocomposites: Dynamic rheological measurements and modelling. Express Polym. Lett. 2010, 4, 115–129. [Google Scholar] [CrossRef]
  31. Dabrowska, I.; Fambri, L.; Pegoretti, A.; Slouf, M.; Vackova, T.; Kolarik, J. Spinning, drawing and physical properties of polypropylene nanocomposite fibers with fumed nanosilica. Express Polym. Lett. 2015, 9, 277–290. [Google Scholar] [CrossRef]
  32. Fambri, L.; Dabrowska, I.; Ceccato, R.; Pegoretti, A. Effects of Fumed Silica and Draw Ratio on Nanocomposite Polypropylene Fibers. Polymers 2017, 9, 41. [Google Scholar] [CrossRef] [Green Version]
  33. Wu, L.; Cao, D.; Huang, Y.; Li, B.G. Poly(l-lactic acid)/SiO2 nanocomposites via in situ melt polycondensation of l-lactic acid in the presence of acidic silica sol: Preparation and characterization. Polymer 2008, 49, 742–748. [Google Scholar] [CrossRef]
  34. Cao, D.; Wu, L. Poly(L-lactic acid)/silicon dioxide nanocomposites prepared via in situ melt polycondensation of L-lactic acid in the presence of acidic silica sol: Isothermal crystallization and melting behaviors. J. Appl. Polym. Sci. 2009, 111, 1045–1050. [Google Scholar] [CrossRef]
  35. Nerantzaki, M.; Prokopiou, L.; Bikiaris, D.N.; Patsiaoura, D.; Chrissafis, K.; Klonos, P.; Kyritsis, A.; Pissis, P. In situ prepared poly(DL-lactic acid)/silica nanocomposites: Study of molecular composition, thermal stability, glass transition and molecular dynamics. Thermochim. Acta 2018, 669, 16–29. [Google Scholar] [CrossRef]
  36. Yan, S.F.; Yin, J.B.; Yang, Y.; Dai, Z.Z.; Ma, J.; Chen, X.S. Surface-grafted silica linked with L-lactic acid oligomer: A novel nanofiller to improve the performance of biodegradable poly(L-lactide). Polymer 2007, 46, 1688–1694. [Google Scholar] [CrossRef]
  37. Zhang, Y.; Deng, B.Y.; Liu, Q.S. Rheology and Crystallization of PLA Containing PLA-Grafted Nanosilica, Plast. Rubber Compos. 2014, 43, 309–314. [Google Scholar] [CrossRef]
  38. Sepulveda, J.; Villegas, C.; Torres, A.; Vargas, E.; Rodriguez, F.; Baltazar, S.; Prada, A.; Rojas, A.; Romero, J.; Faba, S.; et al. Effect of functionalized silica nanoparticles on the mass transfer process in active PLA nanocomposite films obtained by supercritical impregnation for sustainable food packaging. J. Supercrit. Fluids 2020, 161, 104844. [Google Scholar] [CrossRef]
  39. Zhu, A.; Diao, H.; Rong, Q.; Cai, A. Preparation and properties of polylactide–silica nanocomposites. J. Appl. Polym. Sci. 2010, 116, 2866–2873. [Google Scholar] [CrossRef]
  40. Fukushima, K.; Tabuani, D.; Abbate, C.; Arena, M.; Rizzarelli, P. Preparation, characterization and biodegradation of biopolymer nanocomposites based on fumed silica. Eur. Polym. J. 2011, 47, 139–152. [Google Scholar] [CrossRef]
  41. Li, Y.; Han, C.; Bian, J.; Han, L.; Dong, L.; Gao, G. Rheology and biodegradation of polylactide/silica nanocomposites. Polym. Compos. 2012, 33, 1719–1727. [Google Scholar] [CrossRef]
  42. Pilic, B.M.; Radusin, T.I.; Ristić, I.S.; Silvestre, C.; Lazić, V.L.; Baloš, S.S.; Duraccio, D. Hydrophobic silica nanoparticles as reinforcing filler for poly (lactic acid) polymer matrix. Hem. Ind. 2016, 70, 73–80. [Google Scholar] [CrossRef]
  43. Lai, J.C.H.; Rahman, M.R.; Hamdan, S. Comparative studies of thermo-mechanical and morphological properties of polylactic acid/fumed silica/clay (1.28E) and polylactic acid/fumed silica/clay (1.34TCN) nanocomposites. Polym. Bull. 2018, 75, 135–147. [Google Scholar] [CrossRef]
  44. Chen, B.-K.; Shih, C.-C.; Chen, A.F. Ductile PLA nanocomposites with improved thermal stability. Compos. Part A Appl. Sci. Manuf. 2012, 43, 2289–2295. [Google Scholar] [CrossRef]
  45. Wen, X.; Lin, Y.; Han, C.; Zhang, K.; Ran, X.; Li, Y.; Dong, L. Thermomechanical and Optical Properties of Biodegradable Poly(L-lactide)/Silica Nanocomposites by Melt Compounding. J. Appl. Polym. Sci. 2009, 114, 3379–3388. [Google Scholar] [CrossRef]
  46. Dorigato, A.; Sebastiani, M.; Pegoretti, A.; Fambri, L. Effect of silica nanoparticles on the mechanical performances of poly(lactic acid). J. Polym. Environ. 2012, 20, 713–725. [Google Scholar] [CrossRef]
  47. Georgiopoulos, P.; Kontou, E.; Niaounakis, M. Thermomechanical properties and rheological behavior of biodegradable composites. Polym. Compos. 2014, 35, 1140–1149. [Google Scholar] [CrossRef]
  48. Lv, H.; Song, S.; Sun, S.; Ren, L.; Zhang, H. Enhanced properties of poly(lactic acid) with silica nanoparticles. Polym. Adv. Technol. 2016, 27, 1156–1163. [Google Scholar] [CrossRef]
  49. Lertphirun, K.; Srikulkit, K. Properties of Poly(Lactic Acid) Filled with Hydrophobic Cellulose/SiO2 Composites. Int. J. Polym. Sci. 2019, 2019, 7835172. [Google Scholar] [CrossRef] [Green Version]
  50. Georgiopoulos, P.; Kontou, E.; Meristoudi, A.; Pispas, S.; Chatzinikolaidou, M. The effect of silica nanoparticles on the thermomechanical properties and degradation behavior of polylactic acid. J. Biomater. Appl. 2014, 29, 662–674. [Google Scholar] [CrossRef]
  51. Khankrua, R.; Pivsa-Art, S.; Hiroyuki, H.; Suttiruengwon, S. Thermal and Mechanical Properties of Biodegradable polyester/silica Nanocomposites. Energy Procedia 2013, 34, 705–713. [Google Scholar] [CrossRef] [Green Version]
  52. Bikiaris, D.N. Nanocomposites of aliphatic polyesters: An overview of the effect of different nanofillers on enzymatic hydrolysis and biodegradation of polyesters. Polym. Degrad. Stab. 2013, 98, 1908–1928. [Google Scholar] [CrossRef]
  53. Papageorgiou, G.Z.; Achilias, D.S.; Nanakia, S.; Beslikas, T.; Bikiaris, D. PLA nanocomposites: Effect of filler type on non-isothermal crystallization. Thermochim. Acta 2010, 511, 129–139. [Google Scholar] [CrossRef]
  54. Myoung, S.H.; Im, S.S.; Kim, S.H. Non-isothermal crystallization behavior of PLA/acetylated cellulose nanocrystal/silica nanocomposites. Polym. Int. 2016, 65, 115–124. [Google Scholar] [CrossRef]
  55. Zhang, J.; Lou, J.; Ilias, S.; Krishnamachari, P.; Yan, J. Thermal properties of poly(lactic acid) fumed silica nanocomposites: Experiments and molecular dynamics simulations. Polymer 2008, 49, 2381–2386. [Google Scholar] [CrossRef]
  56. Fischer, E.W.; Sterzel, H.J.; Wegner, G. Investigation of the structure of solution grown crystals of lactide copolymers by means of chemical reactions. Kolloid-Z. Z. Polym. 1973, 251, 980–990. [Google Scholar] [CrossRef]
  57. Avrami, M. Kynetics of Phase Change I, General Theory. J. Chem. Phys. 1939, 7, 1103–1112. [Google Scholar] [CrossRef]
  58. Avrami, M. Kinetics of Phase Change. II Transformation-Time Relations for Random Distribution of Nuclei J. Chem. Phys. 1940, 8, 212. [Google Scholar] [CrossRef]
  59. Jog, J.P. Crystallisation in polymer nanocomposites. Mater. Sci. Technol. 2006, 22, 797–806. [Google Scholar] [CrossRef]
  60. Riande, E.; Diaz-Calleja, R.; Prolongo, M.G.; Masegosa, R.M.; Salom, C. Polymer Viscoelasticity, Stress and Strain in Practice; Marcel Dekker: New York, NY, USA, 2000. [Google Scholar]
  61. Wichmann, M.H.G.; Cascione, M.; Fiedler, B.; Quaresimin, M.; Schulte, K. Influence of surface treatment on mechancal behaviour of fumed silica/epoxy resin nano-composites. Compos. Interfaces 2006, 13, 699–715. [Google Scholar] [CrossRef]
  62. Fambri, L.; Bragagna, S.; Migliaresi, C. Biodegradable fibers of poly-L,DL-lactide 70/30 produced by melt spinning. Macromol. Symp. 2006, 234, 20–25. [Google Scholar] [CrossRef]
  63. Díaz-Díaz, A.M.; López-Beceiro, J.; Li, Y.; Cheng, Y.; Artiaga, R. Crystallization kinetics of a commercial poly(lactic acid) based on characteristic crystallization time and optimal crystallization temperature. J. Therm. Anal. Calorim. 2020, 1–8. [Google Scholar] [CrossRef]
  64. Iannace, S.; Nicolais, L. Isothermal Crystallization and Chain Mobility of Poly (L-lactide). J. Appl. Polym. Sci. 1997, 64, 911–919. [Google Scholar] [CrossRef]
  65. Di Lorenzo, M.R.; Androsch, R. Crystallization of poly(lactic acid). In Biodegradable Polyesters; Fakirov, S., Ed.; Wiley-VCH Verlag GmbH & Co. KGaA: Weinheim, Germany, 2015; p. 109. [Google Scholar] [CrossRef]
  66. Müller, A.J.; Ávila, M.; Saenz, G.; Salazar, J. Crystallization of PLA-based Materials. In Poly(Lactic Acid) Science and Technology: Processing, Properties, Additives and Applications; Polymer Science, Series; Jiménez, A., Peltzer, M., Ruseckaite, R., Eds.; Royal Society of Chemistry: Cambridge, UK, 2014; Chapter 3; pp. 66–98. [Google Scholar] [CrossRef]
  67. Hakim, R.H.; Cailloux, J.; Santana, O.O.; Bou, J.; Sanchez-Soto, M.; Odent, J.; Raquez, J.M.; Dubois, P.; Carrasco, F.; Maspoch, M.L. PLA/SiO2 composites: Influence of the filler modifications on the morphology, crystallization behavior, and mechanical properties. J. Appl. Polym. Sci. 2017, 134, 45367. [Google Scholar] [CrossRef]
  68. Sumita, M.; Tsukihi, H.; Miyasaka, K.; Ishikawa, K. Dynamic mechanical properties of polypropylene composites filled with ultrafine particles. J. Appl. Polym. Sci. 1984, 29, 1523–1530. [Google Scholar] [CrossRef]
  69. Fambri, L.; Dabrowska, I.; Ferrara, G.; Pegoretti, A. Morphology and viscoelastic properties of melt-spun HDPE/hydrotalcite nanocomposite fibers. Polym. Compos. 2016, 37, 288–298. [Google Scholar] [CrossRef]
  70. Crowley, K.J.; Zografi, G.D. The use of thermal methods for predicting glass-former fragility. Thermochim. Acta 2001, 380, 79–83. [Google Scholar] [CrossRef]
Figure 1. FESEM images of the fracture surface of polylactic acid (PLA)-based nanocomposites with 1, 2, 8, and 16 vol% of fumed silica.
Applsci 10 06731 g001
Figure 2. Thermogravimetric analysis (TGA) thermograms of PLA and nanocomposites at various nanosilica content (2–24 vol%).
Applsci 10 06731 g002
Figure 3. Differential scanning calorimetry (DSC) thermograms of neat PLA and relative nanocomposites at different nanosilica contents (2–24 vol%). (a) First heating; (b) cooling step; (c) second heating.
Applsci 10 06731 g003
Figure 4. Crystallization kinetics of PLA and PLA-Ar805-8 nanocomposite samples. (a) Relative crystallinity at different temperatures of PLA; (b) relative crystallinity at different temperatures of PLA-Ar805-8; (c) k-coefficient; and (d) n-coefficient of the Avrami equation.
Applsci 10 06731 g004
Figure 5. DMTA tests (heating rate 10 °C/min; 1 Hz) of PLA and relative nanocomposites at 2, 4, 8, and 24 vol% of FS. (a) Storage modulus, (b) loss factor (tanδ), (c) thermal strain, and (d) coefficient of thermal expansion (CTE) below and above Tg.
Applsci 10 06731 g005
Figure 6. Effective particle volume fraction (ϕe, ●), and effective volume per single particle (B) as a function of fumed silica volume fraction (ϕf, ○), according to the Sumita model [68].
Applsci 10 06731 g006
Figure 7. Tip penetration in Vicat tests (heating rate 2 °C/min, load 10 N) on PLA and relative nanocomposites.
Applsci 10 06731 g007
Figure 8. Storage modulus in multifrequency DMTA analysis of (a) PLA and (b) PLA-Ar805-8 nanocomposite at various frequencies in the range 0.3–30 Hz (heating rate of 0.5 °C/min).
Applsci 10 06731 g008
Figure 9. Multifrequency DMTA analysis on PLA and relative nanocomposites. (a) Master curves of storage modulus, (b) shift factor as a function of the temperature (at T0 = 30 °C), (c) activation energy of shift factor below and above Tg as a function of the filler content, calculated from Equation (4).
Applsci 10 06731 g009
Table 1. Melt flow index (at 2.16 kg) and activation energy of PLA-based nanocomposites at different temperatures.
Temperature and KineticsPLAPLA-Ar805-2PLA-Ar805-4PLA-Ar805-8PLA-Ar805-24
170 °C5.7 ± 0.25.2 ± 0.53.7 ± 0.22.3 ± 0.20.8 ± 0.1
190 °C16.4 ± 1.314.1 ± 1.210.4 ± 0.36.6 ± 0.62.2 ± 0.5
210 °C38.7 ± 2.537.3 ± 1.525.4 ± 0.818.9 ± 1.05.2 ± 1.2
Activation energy 1 (kJ/mol)85.3 ± 2.982.4 ± 4.684.8 ± 1.594.8 ± 1.481.9 ± 1.0
1 Calculated from Arrhenius plot (see Supplementary Figure S1).
Table 2. Results of TGA analysis on PLA-based nanocomposites.
SampleT5%
(°C)
Td
(°C)
m700
(%)
PLA350.0384.00.1
PLA-Ar805-2350.3386.12.7
PLA-Ar805-4351.0393.25.5
PLA-Ar805-8349.0394.310.2
PLA-Ar805-16352.3395.321.3
PLA-Ar805-24353.0396.430.3
Table 3. Results of DSC analysis of neat PLA and relative nanocomposites at different nanosilica contents (1–24 vol%).
SampleTg1
(°C)
Tm1
(°C)
Wc1
(%)
TgC
(°C)
Tg2
(°C)
PLA59.6141.20.657.059.4
PLA-Ar805-159.7140.81.253.760.0
PLA-Ar805-260.4141.21.053.859.9
PLA-Ar805-458.8140.51.251.559.7
PLA-Ar805-859.9140.81.551.060.8
PLA-Ar805-1658.9139.91.254.460.0
PLA-Ar805-2456.6139.11.550.159.7
Tg1 = glass transition temperature (first heating stage). Tm1 = melting temperature (first heating stage). Wc1 = crystallinity degree (first heating stage). TgC = glass transition temperature (cooling stage). Tg2 = glass transition temperature (second heating stage).
Table 4. Results of DMTA analysis and Vicat softening temperature (VST) of PLA and relative fumed silica nanocomposites.
SampleStorage Modulus E′ (MPa)
at 25 °C/40 °C/60 °C
E″ Peak
(°C)
Tanδ Peak
Tg 1/Height/Width 2(°C/–/°C)
Thermal Strain at 65 °C
(%)
VST
(°C)
PLA2180/2100/11.155.656.6/2.99/6.2 11.262.6 + 0.2
PLA-Ar805-22220/2120/41.356.860.6/2.61 /6.26.162.8 + 0.4
PLA-Ar805-42410/2280/28.955.859.4/2.31/6.93.563.1 + 0.3
PLA-Ar805-82580/2440/63.256.160.2/1.96/7.42.663.9 + 0.6
PLA-Ar805-242710/2520/17056.361.1/1.12/10.11.270.6 + 0.2
1Tg determined at max of the damping peak; 2 width determined at half of the damping peak.
Table 5. Activation energy at TgETg) and fragility parameters of PLA and relative nanocomposites.
SampleΔETg
(J/mol K)
m 1D 1
PLA623 ± 2299.07.1
PLA-Ar805-2517 ± 1281.09.1
PLA-Ar805-4547 ± 5286.08.4
PLA-Ar805-8554 ± 786.88.3
PLA-Ar805-24576 ± 1990.18.0
1 Fragility parameters (m) and strength parameter (D) are determined from Equations (6) and (7).

