Abstract
Peak particle velocity (PPV) is a critical parameter for the evaluation of the impact of blasting operations on nearby structures and buildings. Accurate estimation of the amount of PPV resulting from a blasting operation and its comparison with the allowable ranges is an integral part of blasting design. In this study, four quarry sites in Malaysia were considered, and the PPV was simulated using gene expression programming (GEP) and Monte Carlo simulation techniques. Data from 149 blasting operations were gathered, and as a result of this study, a PPV predictive model was developed using GEP to be used in the simulation. In order to ensure that all of the combinations of input variables were considered, 10,000 iterations were performed, considering the correlations among the input variables. The simulation results demonstrate that the minimum and maximum PPV amounts were 1.13 mm/s and 34.58 mm/s, respectively. Two types of sensitivity analyses were performed to determine the sensitivity of the PPV results based on the effective variables. In addition, this study proposes a method specific to the four case studies, and presents an approach which could be readily applied to similar applications with different conditions.
1. Introduction
In mining and civil engineering projects, a common technique to remove rock mass is to blast the rock mass. This results in a problem of wasted blasting energy, which occurs for different reasons, and brings about a number of environmental issues, like ground vibrations, backbreak, dust and fumes, air overpressure and flyrock [1,2,3,4,5]. One of the most adversative effects is ground vibration (GV) which may cause damage to neighbouring structures [6,7]. In the literature, GV is defined generally as a wave motion that can be extended from the blast point to adjacent zones [8].
Thus, blast-induced GV needs to be predicted, and its risks should be analysed and assessed in a way to enable making the best decisions about the design of blasting operations and minimize associated environmental issues.
Different controllable or uncontrollable factors affect the blast-induced GV level. Controllable factors include the blast geometry, stemming, burden, spacing and the type and volume of explosive material, while the uncontrollable ones include meteorological conditions and rock mass parameters [9]. The controllable parameters can typically be changed by the designers, while uncontrollable factors cannot be changed, and are almost constant [10,11,12,13]. The GV can be evaluated in terms of the four following indicators: (a) frequency, (b) peak particle velocity (PPV), (c) peak particle acceleration, and (d) peak particle displacement [14,15]. Among these parameters, PPV is the preferable and most frequently-used parameter mentioned in almost all standards [16,17].
All methods proposed in the literature for predicting the PPV value are classified into three groups: empirical, statistical, and soft computing. The empirical methods are developed mainly on the basis of two parameters: distance from the blast face and maximum charge per delay [18,19,20,21]. Empirical equations commonly fail to deliver appropriate results, due to the fact that they consider a limited number of predictors (only two mentioned parameters). Scholars have also used statistical approaches for the purpose of developing an appropriate formula for estimating the PPV values [7,22]. According to several published reports, these methods have also shown inefficiency in giving accurate values [7,22,23]. To fill this gap, many researchers have applied various soft computing (SC) and artificial intelligence (AI) techniques to various fields of engineering and science [24,25,26,27,28,29,30,31,32,33,34,35,36,37,38,39,40,41,42,43,44,45,46,47,48,49,50,51,52,53,54,55,56,57,58,59], particularly to obtain more accurate PPV values. For example, Monjezi et al. [60] developed a model based on an artificial neural network (ANN) with two hidden layers for predicting PPV for a dam in Iran. The PPV predictions of their ANN model were compared with empirical and multilinear regression (MLR) models. They demonstrated that the proposed ANN model was the most dominant model in predicting PPV, with a determination coefficient (R2) of 0.949. In two other studies, Jahed Armaghani et al. [61] and Hajihassani et al. [62] developed two hybrid ANN-based models—namely, particle swarm optimization ((PSO)-ANN) and imperialism competitive algorithm ((ICA)-ANN)—for predicting PPV, and interpreted that the PSO and ICA algorithms played a big role in the optimization of the ANN model in terms of receiving higher performance prediction. Shahnazar et al. [63] proposed a hybrid intelligent technique for predicting PPV using the adaptive neuro-fuzzy inference system (ANFIS), called PSO-ANFIS. A superior result was obtained in their study by the PSO-ANFIS model compared with a pre-developed ANFIS model. Amiri et al. [64] combined the K-nearest neighbours (KNN) algorithm with ANN, resulting in ANN-KNN. A single ANN model and two empirical techniques were also used to estimate PPV and compare these with the ANN-KNN model. In their results, the proposed ANN-KNN model was the best model at predicting blast-induced PPV. Thus, based upon the above discussion, it seems that SC and AI techniques are able to solve problems related to PPV prediction.
It is true that many studies have been carried out for the purposes of estimating the PPV value; however, the literature still lacks comprehensive research focusing upon all combinations and correlations of variables that have effect on the estimation of PPV. Gene expression programming (GEP), among all the SC and AI techniques, is one of the models capable of forming proper equations applicable to the prediction and solution of potential problems. GEP is widely applied to various applications of geotechnical engineering [65,66,67,68,69]. The present paper tries to develop an equation based on GEP to predict PPV values. The developed equation is then applied as an input to the Monte Carlo (MC) technique. MC is known as a prevailing technique in probability simulation, which can be applied to a variety of fields such as civil engineering, construction management, geotechnics and risk assessment [70,71]. The aim of this paper is to analyse the risk of ground vibration resulting from blasting by simulating all combinations of the effective variables in the PPV prediction, considering these variables’ correlations. The remainder of this paper is structured as follows: Section 2 presents data that have been gathered, together with the methods used for the analyses. Then the results and discussion are presented in Section 3, and the paper is concluded in Section 4.
2. Materials and Methods
In this section, the methods for data Peak particle velocity (PPV) measurement, prediction using GEP and MC simulation, are discussed. Figure 1 shows the flowchart of this research.
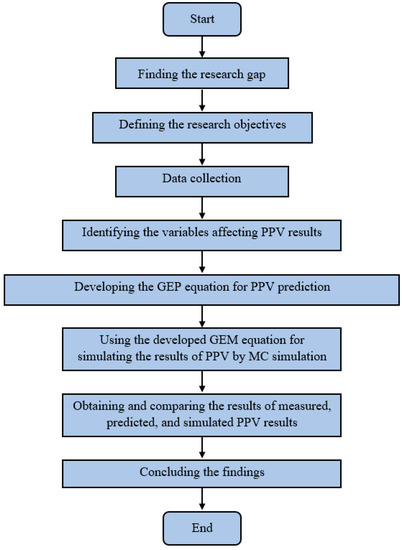
Figure 1.
Flowchart of different steps in this study.
2.1. Case Study and Data Collection
In this study, in order to apply methods for PPV evaluation, four quarry blasting sites in Malaysia were selected. The names of these quarries and their latitudes and longitudes are presented in Table 1. In addition, geological map and locations of these quarries are shown in Figure 2. Generally in these quarries, the type of rock is granite, and blast operations are conducted in order to create aggregate to be used for construction purposes. In each site, roughly 30,000 tonnes of aggregate is produced per month. A value of 10 m was measured as the minimum bench height in the Kulai Quarry, while a value of 28 m was observed as maximum bench height in the Bukit Indah Quarry. Various weathering zones, ranging from moderately weathered to completely weathered, were observed in the studied sites based on the suggested method by ISRM [72], and as reported by Abad et al. [73]. Results of the Schmidt hammer test (based on ISRM [72]) were measured in the range of 19–37. In addition, in these sites, rock quality designation (RQD) as an indicator of rock mass fracturing was measured as a minimum of 22.5% to a maximum of 61.25%. According to previous studies [74,75], resistance parameters of the rock mass can have a deep impact on explosive operations.

Table 1.
More information of the studied quarry sites.
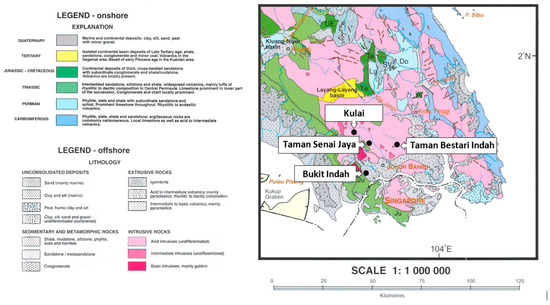
Figure 2.
The geological map and locations of studied quarries.
The total number of conducted blasting operations which were investigated in these sites was 149 operations. In these operations, different blasting parameters, including burden (the shortest distance between the hole and the exposed bench face), spacing (the distance between blast-hole rows), stemming (the material which is placed on top of explosives in blast holes), maximum charge per delay (the maximum amount of explosive charge detonated on one delay within a blast with units defined as kg), powder factor (the amount of explosive needed to remove and a fragment of 1 m3 of the rock mass with its unit defined as kg/m3) and distance from the blast face, were recorded. In all operations, a value of 115 mm was utilized for the blast-hole diameter. It is of a high importance to measure, evaluate and simulate PPV in the investigated sites, because blasting operations are carried out at a close distance to adjacent residential buildings. The nearest building is located 350 m away from the investigated sites; therefore, an area in a distance ranging from 65 m to 640 m to the blast face was determined for PPV measuring stations. All of the obtained PPV values were recorded opposite the quarry’s bench, and almost perpendicular to it, and the maximum PPV levels in a variety of directions were taken into consideration.
To effectively evaluate the PPV results, the parameters with the highest effects must be determined. As noted earlier, the two parameters of distance from the blast site and the maximum charge per delay have been widely taken into account by numerous scholars in the PPV prediction process. Furthermore, based on a number of studies available in the literature [7,11,22,60,76,77], powder factor and blasting pattern parameters play an important role in determining the PPV value. Therefore, in this study, the burden-to-spacing ratio (BS), stemming (ST), powder factor (PF), maximum charge per delay (MC) and the distance from the blast face (D) were considered as predictors or model inputs. The average, maximum, minimum, unit and symbol of the measured parameters are shown in Table 2. It is important to note that in the case of parameters which had several values in a blast (such as stemming length), their average values were considered and used in the established database.
Table 2.
Range, unit and symbol of the measured parameters in the sites.
2.2. Gene Expression Programming (GEP)
To obtain a mathematical relation, the method of GEP has been developed for the prediction of PPV. This method was firstly introduced by Ferreira [78]. Recently, the application of this method has increased in civil and mining engineering [7,67,79,80,81,82,83,84]. With the use of different mathematical operators and linear functions (e.g., +, −, sin, tan, cos, sqrt, x2, and x3), this method forms a mathematical relation between the input and output variables. In the following, a summary of the GEP modelling process is presented:
- Step 1
- On the basis of population number, a certain number of chromosomes are produced in a random way.
- Step 2
- The chromosomes of the initial population are denoted as mathematical equations.
- Step 3
- Each chromosome’s fitness is measured based on the fitness function (coefficient of determination, R2, or root mean square error (RMSE)). If the stopping criteria are not met, the best of the first generation is chosen using the roulette wheel method.
- Step 4
- The genetic operators, which are known as the core of the GEP algorithm, are applied to the rest of chromosomes for the purpose of creating modified individuals.
- Step 5
- At this step, the chromosomes will start creating the next generation. This process is iterated for a certain number of generations. More information about this method can be found in the work of other researchers [78,80,83,84].
Various models of GEP were applied in which non-normal distributions of data were used. A total of 80% of the data was allocated to the training section and 20% to the testing section. Regarding the use of two statistical indicators of R2 and RMSE [57,85,86,87] for determining the best model, a scoring system was used, as introduced by Zorlu et al. [88]. The highest and lowest values of R2 gain the highest and lowest score, respectively, while the situation is reversed for RMSE. For example, in the training section, values of R2 for models 6 and 2 are 0.7283 and 0.6927, respectively, and the highest (10) and lowest (1) scores are obtained for them. However, for the RMSE of the training, the lowest error is related to model 4, and thus obtains the highest score (10), and model 10 also obtains the lowest score because of its maximum error value. This method of ranking is applied in different sections, and at the end, the total score of each row is placed into the last column. As a result, model number 6 obtains the highest score and is introduced as the best model for predicting PPV (Table 3). As a result, R2 of 0.7283 and 0.6823 and RMSE of 4.2814 and 4.0344 for training and testing, respectively, show suitable levels of prediction for developing the GEP model.
Table 3.
The results of various gene expression programming (GEP) models for prediction of PPV.
The best PPV equation obtained by the GEP model is presented in Equation (6). This equation is a summation of Equations (1) to (5), which are presented as follows:
where, the variables of d(0), d(1), d(2), d(3), d(4), and Y are Burden to Spacing, Stemming, Powder Factor, Max charge Per Delay, Distance and PPV, respectively.
Figure 3 and Figure 4 show the results of PPV prediction using Equation (6), for training and testing, respectively.
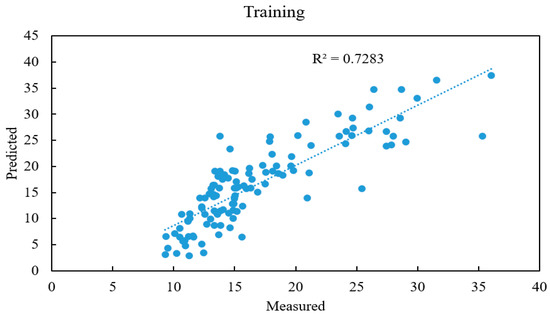
Figure 3.
Training results of Equation (6) for prediction of PPV.
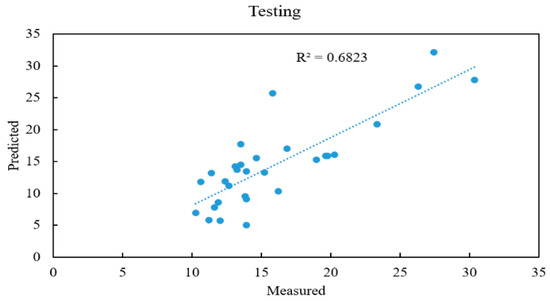
Figure 4.
Testing results of Equation (6) for prediction of PPV.
2.3. MC Simulation
2.3.1. Background
MC simulation is a quantitative risk assessment technique which considers the effect of deterministic and probabilistic variables in a single model [70]. In other words, MC simulation is capable of analysing the effect of uncertain variables to predict or assess the risk. MC simulation has been adopted in various engineering fields due to its capabilities in predicting the effect of uncertain variables. In an MC risk analysis model, random sampling techniques are used based on the requirements of the model, and statistical analyses are conducted to ensure accurate results are obtained. MC simulation is developed for probabilistic circumstances in which deterministic values of variables are not provided, so that historical data can be used with various distribution functions.
According to Figure 5, which illustrates the operation principal of MC simulation, multiple variables are involved in an MC model with various ranges and distribution functions [89]. Although a random number is chosen for the variables at every iteration, the variables’ distribution functions contribute in this random process. The number of required iterations is defined before conducting the analysis. Once the results of all iterations are obtained, their range of the outputs can be statistically analysed to predict the result. As a result, in an MC model, the inputs and outputs are ranges of values, rather than a deterministic value [90]. Notably, an MC simulation is capable of considering independent and dependent variables in a single model. Because there might be several variables involved in an MC model, in order to achieve more accurate results, the relationships among them should be investigated [91,92].
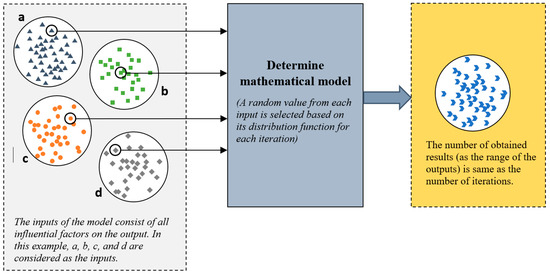
Figure 5.
Operating principle of a Monte Carlo (MC) simulation [93].
2.3.2. Application of MC Simulation in PPV Estimation
This section presents the modelling steps of MC techniques in the risk analysis of PPV. According to Figure 6, in this paper, six steps are considered for PPV estimation using MC simulation. First, the affecting variables (ST, BS, MC, PF and D), and their corresponding values which were gathered from quarry sites in Malaysia, were identified. Second, a predictive model which was carried out using GEP (Equations (1)–(6)) was developed. Third, the distribution function of each variable was considered. Because a large amount of data was gathered already, the distribution functions of all variables were calculated using the Risk Solver Platform [89]. The Risk Solver Platform is an MS-Excel plug-in feature which is used in this research for MC simulation. In this Risk Solver Platform, a ‘best-fit’ function is available to select the distribution function of the variables. The inputs for the MC simulation are presented in Table 4, together with their minimum and maximum amounts and the distribution functions. Notably, continuous probability distribution (CPD) was considered for all inputs during the use of this function.
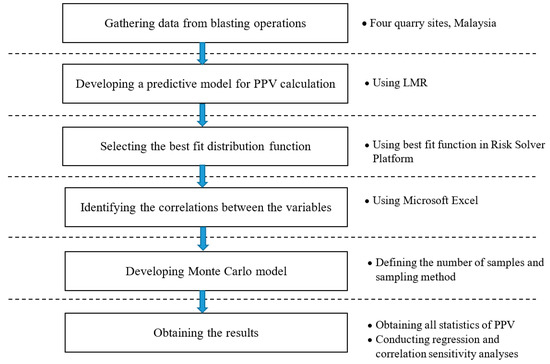
Figure 6.
Steps of application of Monte Carlo simulation in PPV risk analysis.
Table 4.
Distribution function of the inputs used in MC simulation.
Fourth, because the current study is mainly aimed at the achievement of effective combinations in MC simulations, the input correlations were taken into consideration in the process of simulation. This program makes use of a correlation matrix between the model inputs and involves major rank-order correlations (Spearman’s rho). In MC, the relations between model inputs have a deep impact on simulation results. Table 5 shows the mentioned relations obtained by Microsoft Excel Version 2013. Fifth, in developing the MC model, Latin hypercube sampling was used, due to its advantages compared with simple random sampling [94]. To ensure that every combination of variable values was analysed, 10,000 trials were performed. Then, the output ranges were generated as a sixth step.
Table 5.
Correlation coefficient of model inputs.
3. Results and Discussion
In this study, in order to cover two different phases of prediction and simulation, GEP and MC techniques were proposed, respectively. A GEP model with R2 values of 0.7283 and 0.6823 and RMSE values of 4.2814 and 4.0344 for training and testing, respectively, are able to provide a suitable accuracy level for PPV prediction.
Then, the proposed GEP equation was used as an input for the MC technique for simulation purposes. The results of the MC simulation indicated that the minimum and maximum values of PPV are 1.13 mm/s and 34.58 mm/s, respectively, with a mean value of about 18.28 mm/s. According to the results, the distribution function of 10,000 outputs is ‘logistic’, which is illustrated in Figure 7. Based on the output values, with 90% confidence, the amount of PPV is less than 25.25 mm/s, and 99% of the results are less than 30.86 mm/s. In this study, the simulation of PPV was conducted after measurement on site and prediction using GEP. Because the means of PPV simulation and prediction are very close (18.28 mm/s and 16.23 mm/s, respectively), it can be stated that the accuracy of the MC model in the PPV simulation is acceptable. Figure 8 demonstrates the differences among the measured, predicted and simulated results of PPV. Furthermore, in order to have a better illustration regarding the contribution of the input values in the obtained output for each trial in MC simulation, Figure 9 plots the random amounts of all inputs, which have been taken by the MC simulator. This figure also shows their corresponding PPV results which were generated during MC simulation. It should be noted that Figure 9 was generated using the Risk Solver Platform, the MC simulator in our research, to show the involvement of each input in the PPV result. According to Duvall and Fogelson [95], as a main standard, PPV values of less than 50 mm/s can be considered as an acceptable value. In this paper, we can state with 100% confidence that the PPV for the blasting operations is in the allowable range.
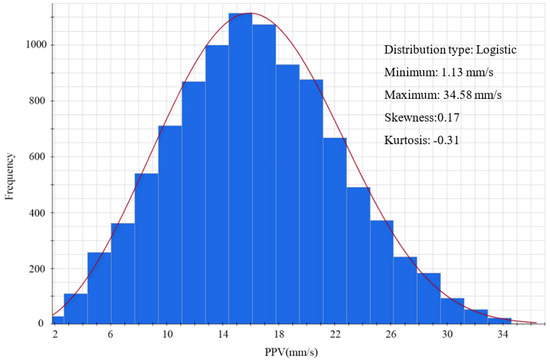
Figure 7.
Obtained frequency of PPV results using Monte Carlo simulation.
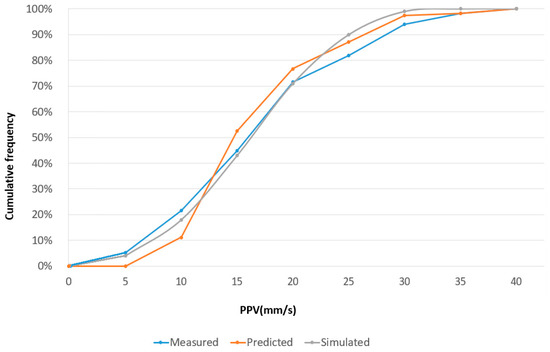
Figure 8.
Measured PPV values together with their correspond predicted and simulated values.
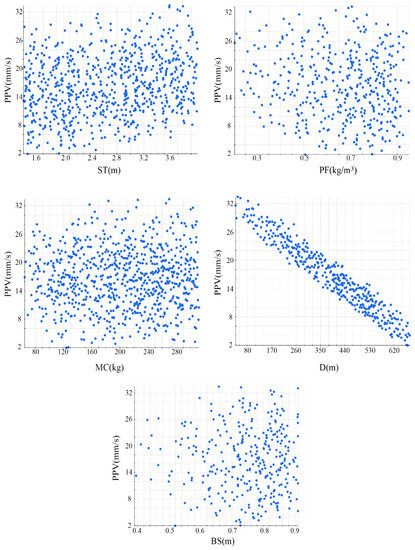
Figure 9.
Scatter results of each input against PPV obtained by Monte Carlo simulation.
Sensitivity Analysis
In order to figure out the effect of each variable in the output values, correlation sensitivity analysis (CSA) and regression sensitivity analysis (RSA) were conducted for different purposes. It should be noted that both types of sensitivity analyses were performed using the Risk Solver Platform. In the CSA, the ranges of correlations were between −1 and +1. In CSA, MC simulation uses rank order correlation, rather than linear correlation, to calculate the relationship between two data sets by comparing the rank of each value in a data set. Rank order correlation has an acceptable performance if uncertain variables are involved in the simulation, or the distribution function of the variables are not specified precisely [96]. As shown in Table 6, the level of effectiveness of each variable in the final output of the simulation can be obtained from the results of CSA.
Table 6.
Correlation sensitivity analysis (CSA) for PPV results in MC simulation.
According to Table 6, D has the most impact on the results of PPV in an MC simulation, followed by ST, MC, PF and BS. It is worth mentioning that D and PF had negative impacts on the amount of PPV, while ST, MC and BS had positive impacts.
In RSA, multiple regression analyses were conducted by varying one of the variable ranges (in this paper from −50% to +50%), while keeping the other variables constant [97]. It is noteworthy that these same processes were conducted for all variables to determine the influence of each variable on the output. The results of RSA indicated that the PPV result is highly sensitive to changes in D followed by ST and MC (see Figure 10). On the other hand, changes in the amount of BS have the lowest influence on the results. Results of the sensitivity analysis (especially regarding D, which is the most effective parameter on PPV) are in good agreement with studies carried out by [7,8,60]. For example, Monjezi et al. [60] proposed that the distance from the blast face is the most influential parameter on PPV among other used parameters (i.e., hole depth, stemming, maximum charge per delay). In addition, as discussed earlier, the distance from the blast face is one of the most effective parameters in empirical equations [15,17].
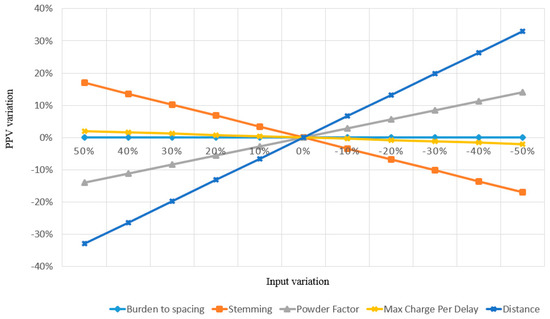
Figure 10.
Regression sensitivity analysis (RSA) for the inputs.
4. Conclusions
The PPV resulting from blasting operations—a critical environmental issue—needs to be predicted accurately for any blasting operations. The present research was centred upon the simulation of PPV in four quarry sites located in Malaysia. It took into account the input variables of stemming, powder factor, maximum charge per delay, burden-to-spacing ratio and the distance from the blast face. In addition, GEP was applied to the development of a predictive model, and the MC simulation was employed for the purpose of simulating all ranges of PPV results. All probable combinations of correlations and values of the variables were examined in the MC simulation process, and they were also analysed by carrying out 10,000 trials.
The results of the performance indices achieved for the developed GEP equation (training datasets: RMSE = 4.2814 and R2 = 0.7283, and testing datasets: RMSE = 4.0344 and R2 = 0.6823) confirmed its high capacity in terms of predicting the PPV value and also its applicability as an input equation into the MC simulation technique.
The range of PPV was simulated around 35 mm/s, and it starts from 1.13 mm/s up to 34.58 mm/s. Moreover, based on the results of the PPV, it can be stated with 100% confidence that the PPV is less than 50.8 mm/s, which is mentioned as the allowable maximum amount of PPV for surface mine blasting. Notably, based on the results of the RSA, the MC and ST have a direct relation with PPV, while any increase in the values of D and PF would lead to a reduction in the value of PPV. Moreover, based on the outcome of RSA and CSA, it was concluded that the result of the PPV is highly sensitive to the amount of D. These results are in good agreement with previous studies. The ST and PF are found to be the second and third most influential factors for PPV. Although BS was considered as an effective factor on PPV, its changes up to 50% were almost ineffective on PPV values. It is notable that the proposed equation is not applicable for other cases; however, the research framework can be adopted for other sites with different variables, values and functions for the purposes of predicting and simulating PPV.
Author Contributions
Conceptualization, D.J.A.; Data curation, A.A.; Formal analysis, A.M.; Supervision, K.Y.; Writing—review & editing, A.H.; Methodology, M.K. All authors have read and agreed to the published version of the manuscript.
Funding
This research received no external funding.
Acknowledgments
The authors would like to express their sincere gratitude to University Malaysia Kelantan for providing financial supports.
Conflicts of Interest
The authors confirm that this article content has no conflict of interest.
References
- Koopialipoor, M.; Fallah, A.; Armaghani, D.J.; Azizi, A.; Mohamad, E.T. Three hybrid intelligent models in estimating flyrock distance resulting from blasting. Eng. Comput. 2018. [Google Scholar] [CrossRef]
- Hasanipanah, M.; Jahed Armaghani, D.; Monjezi, M.; Shams, S. Risk assessment and prediction of rock fragmentation produced by blasting operation: A rock engineering system. Environ. Earth Sci. 2016, 75, 808. [Google Scholar] [CrossRef]
- Jahed Armaghani, D.; Hajihassani, M.; Marto, A.; Shirani Faradonbeh, R.; Mohamad, E.T. Prediction of blast-induced air overpressure: A hybrid AI-based predictive model. Environ. Monit. Assess. 2015, 187, 666. [Google Scholar] [CrossRef] [PubMed]
- Saghatforoush, A.; Monjezi, M.; Faradonbeh, R.S.; Armaghani, D.J. Combination of neural network and ant colony optimization algorithms for prediction and optimization of flyrock and back-break induced by blasting. Eng. Comput. 2016, 32, 255–266. [Google Scholar] [CrossRef]
- Hasanipanah, M.; Golzar, S.B.; Larki, I.A.; Maryaki, M.Y.; Ghahremanians, T. Estimation of blast-induced ground vibration through a soft computing framework. Eng. Comput. 2017, 33, 951–959. [Google Scholar] [CrossRef]
- Ghoraba, S.; Monjezi, M.; Talebi, N.; Armaghani, D.J.; Moghaddam, M.R. Estimation of ground vibration produced by blasting operations through intelligent and empirical models. Environ. Earth Sci. 2016, 75, 1137. [Google Scholar] [CrossRef]
- Shirani Faradonbeh, R.; Jahed Armaghani, D.; Abd Majid, M.Z.; MD Tahir, M.; Ramesh Murlidhar, B.; Monjezi, M.; Wong, H.M. Prediction of ground vibration due to quarry blasting based on gene expression programming: A new model for peak particle velocity prediction. Int. J. Environ. Sci. Technol. 2016, 13, 1453–1464. [Google Scholar] [CrossRef]
- Khandelwal, M.; Singh, T.N. Prediction of blast-induced ground vibration using artificial neural network. Int. J. Rock Mech. Min. Sci. 2009, 46, 1214–1222. [Google Scholar] [CrossRef]
- Aydan, Ö.; Geniş, M.; Bilgin, A.H. Effect of blasting on the bench stability at the Demirbilek open-pit mine. Environ. Geotech. 2014, 1, 240–248. [Google Scholar] [CrossRef]
- Verma, A.K.; Singh, T.N. Intelligent systems for ground vibration measurement: A comparative study. Eng. Comput. 2011, 27, 225–233. [Google Scholar] [CrossRef]
- Hasanipanah, M.; Monjezi, M.; Shahnazar, A.; Armaghani, D.J.; Farazmand, A. Feasibility of indirect determination of blast induced ground vibration based on support vector machine. Measurement 2015, 75, 289–297. [Google Scholar] [CrossRef]
- Khandelwal, M.; Kankar, P.K.; Harsha, S.P. Evaluation and prediction of blast induced ground vibration using support vector machine. Min. Sci. Technol. 2010, 20, 64–70. [Google Scholar]
- Aydan, O. Rock Dynamics; CRC Press: Boca Raton, FL, USA, 2017; ISBN 1315391295. [Google Scholar]
- Konya, C.J.; Walter, E.J. Rock Blasting; US Department of Transportation, Federal Highway Administration: Washington, DC, USA, 1985.
- Dowding, C.H. Suggested method for blast vibration monitoring. In International Journal of Rock Mechanics and Mining Sciences & Geomechanics Abstracts; Elsevier: Amsterdam, The Netherlands, 1992; Volume 29, pp. 145–156. [Google Scholar]
- New, B.M. Ground Vibration Caused by Civil Engineering Works; Report 53:19; Transport and Road Research Laboratory: London, UK, 1986. [Google Scholar]
- Standard, I. Criteria for Safety and Design of Structures Subjected to Under Ground Blast; Bulletin No: IS-6922; Bureau of Indian Standards: New Delhi, India, 1973.
- Armaghani, D.J.; Momeni, E.; Abad, S.V.A.N.K.; Khandelwal, M. Feasibility of ANFIS model for prediction of ground vibrations resulting from quarry blasting. Environ. Earth Sci. 2015, 74, 2845–2860. [Google Scholar] [CrossRef]
- Ambraseys, N.R.; Hendron, A.J. Dynamic Behavior of Rock Masses: Rock Mechanics in Engineering Practices; Wiley: London, UK, 1968. [Google Scholar]
- Iphar, M.; Yavuz, M.; Ak, H. Prediction of ground vibrations resulting from the blasting operations in an open-pit mine by adaptive neuro-fuzzy inference system. Environ. Geol. 2008, 56, 97–107. [Google Scholar] [CrossRef]
- Ataei, M.; Kamali, M. Prediction of blast-induced vibration by adaptive neuro-fuzzy inference system in Karoun 3 power plant and dam. J. Vib. Control 2013, 19, 1906–1914. [Google Scholar] [CrossRef]
- Hasanipanah, M.; Faradonbeh, R.S.; Amnieh, H.B.; Armaghani, D.J.; Monjezi, M. Forecasting blast-induced ground vibration developing a CART model. Eng. Comput. 2016, 33, 307–316. [Google Scholar] [CrossRef]
- Hajihassani, M.; Jahed Armaghani, D.; Monjezi, M.; Mohamad, E.T.; Marto, A. Blast-induced air and ground vibration prediction: A particle swarm optimization-based artificial neural network approach. Environ. Earth Sci. 2015, 74, 2799–2817. [Google Scholar] [CrossRef]
- Guan, X.; Liao, S.; Bai, J.; Wang, F.; Li, Z.; Wen, Q.; He, J.; Chen, T. Urban land-use classification by combining high-resolution optical and long-wave infrared images. Geo-Spat. Inf. Sci. 2017, 20, 299–308. [Google Scholar] [CrossRef]
- Koopialipoor, M.; Ghaleini, E.N.; Tootoonchi, H.; Jahed Armaghani, D.; Haghighi, M.; Hedayat, A. Developing a new intelligent technique to predict overbreak in tunnels using an artificial bee colony-based ANN. Environ. Earth Sci. 2019, 78, 165. [Google Scholar] [CrossRef]
- Liao, X.; Khandelwal, M.; Yang, H.; Koopialipoor, M.; Murlidhar, B.R. Effects of a proper feature selection on prediction and optimization of drilling rate using intelligent techniques. Eng. Comput. 2019. [Google Scholar] [CrossRef]
- Koopialipoor, M.; Ghaleini, E.N.; Haghighi, M.; Kanagarajan, S.; Maarefvand, P.; Mohamad, E.T. Overbreak prediction and optimization in tunnel using neural network and bee colony techniques. Eng. Comput. 2018. [Google Scholar] [CrossRef]
- Armaghani, D.J.; Mohamad, E.T.; Narayanasamy, M.S.; Narita, N.; Yagiz, S. Development of hybrid intelligent models for predicting TBM penetration rate in hard rock condition. Tunn. Undergr. Space Technol. 2017, 63, 29–43. [Google Scholar] [CrossRef]
- Armaghani, D.J.; Hasanipanah, M.; Amnieh, H.B.; Mohamad, E.T. Feasibility of ICA in approximating ground vibration resulting from mine blasting. Neural Comput. Appl. 2018, 29, 457–465. [Google Scholar] [CrossRef]
- Xu, C.; Gordan, B.; Koopialipoor, M.; Armaghani, D.J.; Tahir, M.M.; Zhang, X. Improving Performance of Retaining Walls Under Dynamic Conditions Developing an Optimized ANN Based on Ant Colony Optimization Technique. IEEE Access 2019, 7, 94692–94700. [Google Scholar] [CrossRef]
- Yang, H.; Koopialipoor, M.; Armaghani, D.J.; Gordan, B.; Khorami, M.; Tahir, M.M. Intelligent design of retaining wall structures under dynamic conditions. STEEL Compos. Struct. 2019, 31, 629–640. [Google Scholar]
- Yang, H.Q.; Li, Z.; Jie, T.Q.; Zhang, Z.Q. Effects of joints on the cutting behavior of disc cutter running on the jointed rock mass. Tunn. Undergr. Space Technol. 2018, 81, 112–120. [Google Scholar] [CrossRef]
- Yang, H.; Wang, H.; Zhou, X. Analysis on the damage behavior of mixed ground during TBM cutting process. Tunn. Undergr. Space Technol. 2016, 57, 55–65. [Google Scholar] [CrossRef]
- Yang, H.Q.; Zeng, Y.Y.; Lan, Y.F.; Zhou, X.P. Analysis of the excavation damaged zone around a tunnel accounting for geostress and unloading. Int. J. Rock Mech. Min. Sci. 2014, 69, 59–66. [Google Scholar] [CrossRef]
- Zhou, J.; Li, X.; Mitri, H.S. Evaluation method of rockburst: State-of-the-art literature review. Tunn. Undergr. Space Technol. 2018, 81, 632–659. [Google Scholar] [CrossRef]
- Zhou, J.; Li, X.; Mitri, H.S. Comparative performance of six supervised learning methods for the development of models of hard rock pillar stability prediction. Nat. Hazards 2015, 79, 291–316. [Google Scholar] [CrossRef]
- Xu, H.; Zhou, J.; Asteris, P.G.; Jahed Armaghani, D.; Tahir, M.M. Supervised Machine Learning Techniques to the Prediction of Tunnel Boring Machine Penetration Rate. Appl. Sci. 2019, 9, 3715. [Google Scholar] [CrossRef]
- Asteris, P.G.; Kolovos, K.G. Self-compacting concrete strength prediction using surrogate models. Neural Comput. Appl. 2019, 31, 409–424. [Google Scholar] [CrossRef]
- Sarir, P.; Chen, J.; Asteris, P.G.; Armaghani, D.J.; Tahir, M.M. Developing GEP tree-based, neuro-swarm, and whale optimization models for evaluation of bearing capacity of concrete-filled steel tube columns. Eng. Comput. 2019. [Google Scholar] [CrossRef]
- Asteris, P.G.; Nozhati, S.; Nikoo, M.; Cavaleri, L.; Nikoo, M. Krill herd algorithm-based neural network in structural seismic reliability evaluation. Mech. Adv. Mater. Struct. 2018, 26, 1146–1153. [Google Scholar] [CrossRef]
- Chen, H.; Asteris, P.G.; Jahed Armaghani, D.; Gordan, B.; Pham, B.T. Assessing Dynamic Conditions of the Retaining Wall: Developing Two Hybrid Intelligent Models. Appl. Sci. 2019, 9, 1042. [Google Scholar] [CrossRef]
- Armaghani, D.J.; Hatzigeorgiou, G.D.; Karamani, C.; Skentou, A.; Zoumpoulaki, I.; Asteris, P.G. Soft computing-based techniques for concrete beams shear strength. Procedia Struct. Integr. 2019, 17, 924–933. [Google Scholar] [CrossRef]
- Apostolopoulou, M.; Armaghani, D.J.; Bakolas, A.; Douvika, M.G.; Moropoulou, A.; Asteris, P.G. Compressive strength of natural hydraulic lime mortars using soft computing techniques. Procedia Struct. Integr. 2019, 17, 914–923. [Google Scholar] [CrossRef]
- Asteris, P.G.; Tsaris, A.K.; Cavaleri, L.; Repapis, C.C.; Papalou, A.; Di Trapani, F.; Karypidis, D.F. Prediction of the fundamental period of infilled RC frame structures using artificial neural networks. Comput. Intell. Neurosci. 2016, 2016. [Google Scholar] [CrossRef]
- Asteris, P.G.; Kolovos, K.G.; Douvika, M.G.; Roinos, K. Prediction of self-compacting concrete strength using artificial neural networks. Eur. J. Environ. Civ. Eng. 2016, 20, s102–s122. [Google Scholar] [CrossRef]
- Asteris, P.G.; Ashrafian, A.; Rezaie-Balf, M. Prediction of the compressive strength of self-compacting concrete using surrogate models. Comput. Concr. 2019, 24, 137–150. [Google Scholar]
- Asteris, P.G.; Moropoulou, A.; Skentou, A.D.; Apostolopoulou, M.; Mohebkhah, A.; Cavaleri, L.; Rodrigues, H.; Varum, H. Stochastic Vulnerability Assessment of Masonry Structures: Concepts, Modeling and Restoration Aspects. Appl. Sci. 2019, 9, 243. [Google Scholar] [CrossRef]
- Cavaleri, L.; Chatzarakis, G.E.; Di Trapani, F.; Douvika, M.G.; Roinos, K.; Vaxevanidis, N.M.; Asteris, P.G. Modeling of surface roughness in electro-discharge machining using artificial neural networks. Adv. Mater. Res. 2017, 6, 169–184. [Google Scholar]
- Yang, H.Q.; Xing, S.G.; Wang, Q.; Li, Z. Model test on the entrainment phenomenon and energy conversion mechanism of flow-like landslides. Eng. Geol. 2018, 239, 119–125. [Google Scholar] [CrossRef]
- Yang, H.; Liu, J.; Liu, B. Investigation on the cracking character of jointed rock mass beneath TBM disc cutter. Rock Mech. Rock Eng. 2018, 51, 1263–1277. [Google Scholar] [CrossRef]
- Zhou, X.P.; Yang, H.Q. Micromechanical modeling of dynamic compressive responses of mesoscopic heterogenous brittle rock. Theor. Appl. Fract. Mech. 2007, 48, 1–20. [Google Scholar] [CrossRef]
- Guo, H.; Zhou, J.; Koopialipoor, M.; Armaghani, D.J.; Tahir, M.M. Deep neural network and whale optimization algorithm to assess flyrock induced by blasting. Eng. Comput. 2019. [Google Scholar] [CrossRef]
- Zhou, J.; Shi, X.; Li, X. Utilizing gradient boosted machine for the prediction of damage to residential structures owing to blasting vibrations of open pit mining. J. Vib. Control 2016, 22, 3986–3997. [Google Scholar] [CrossRef]
- Jian, Z.; Shi, X.; Huang, R.; Qiu, X.; Chong, C. Feasibility of stochastic gradient boosting approach for predicting rockburst damage in burst-prone mines. Trans. Nonferrous Met. Soc. China 2016, 26, 1938–1945. [Google Scholar]
- Zhou, J.; Li, E.; Yang, S.; Wang, M.; Shi, X.; Yao, S.; Mitri, H.S. Slope stability prediction for circular mode failure using gradient boosting machine approach based on an updated database of case histories. Saf. Sci. 2019, 118, 505–518. [Google Scholar] [CrossRef]
- Koopialipoor, M.; Noorbakhsh, A.; Noroozi Ghaleini, E.; Jahed Armaghani, D.; Yagiz, S. A new approach for estimation of rock brittleness based on non-destructive tests. Nondestruct. Test. Eval. 2019, 34, 1–22. [Google Scholar] [CrossRef]
- Koopialipoor, M.; Murlidhar, B.R.; Hedayat, A.; Armaghani, D.J.; Gordan, B.; Mohamad, E.T. The use of new intelligent techniques in designing retaining walls. Eng. Comput. 2019, 1–12. [Google Scholar] [CrossRef]
- Zhou, J.; Koopialipoor, M.; Murlidhar, B.R.; Fatemi, S.A.; Tahir, M.M.; Armaghani, D.J.; Li, C. Use of Intelligent Methods to Design Effective Pattern Parameters of Mine Blasting to Minimize Flyrock Distance. Nat. Resour. Res. 2019. [Google Scholar] [CrossRef]
- Mohamad, E.T.; Koopialipoor, M.; Murlidhar, B.R.; Rashiddel, A.; Hedayat, A.; Armaghani, D.J. A new hybrid method for predicting ripping production in different weathering zones through in-situ tests. Measurement 2019. [Google Scholar] [CrossRef]
- Monjezi, M.; Ghafurikalajahi, M.; Bahrami, A. Prediction of blast-induced ground vibration using artificial neural networks. Tunn. Undergr. Space Technol. 2011, 26, 46–50. [Google Scholar] [CrossRef]
- Armaghani, D.J.; Hajihassani, M.; Mohamad, E.T.; Marto, A.; Noorani, S.A. Blasting-induced flyrock and ground vibration prediction through an expert artificial neural network based on particle swarm optimization. Arab. J. Geosci. 2014, 7, 5383–5396. [Google Scholar] [CrossRef]
- Hajihassani, M.; Jahed Armaghani, D.; Marto, A.; Tonnizam Mohamad, E. Ground vibration prediction in quarry blasting through an artificial neural network optimized by imperialist competitive algorithm. Bull. Eng. Geol. Environ. 2015, 74, 873–886. [Google Scholar] [CrossRef]
- Shahnazar, A.; Nikafshan Rad, H.; Hasanipanah, M.; Tahir, M.M.; Jahed Armaghani, D.; Ghoroqi, M. A new developed approach for the prediction of ground vibration using a hybrid PSO-optimized ANFIS-based model. Environ. Earth Sci. 2017, 76, 527. [Google Scholar] [CrossRef]
- Amiri, M.; Amnieh, H.B.; Hasanipanah, M.; Khanli, L.M. A new combination of artificial neural network and K-nearest neighbors models to predict blast-induced ground vibration and air-overpressure. Eng. Comput. 2016, 32, 631–644. [Google Scholar] [CrossRef]
- Johari, A.; Nejad, A.H. Prediction of soil-water characteristic curve using gene expression programming. Iran. J. Sci. Technol. Trans. Civ. Eng. 2015, 39, 143. [Google Scholar]
- Gandomi, A.H.; Alavi, A.H. A new multi-gene genetic programming approach to non-linear system modeling. Part II: Geotechnical and earthquake engineering problems. Neural Comput. Appl. 2012, 21, 189–201. [Google Scholar] [CrossRef]
- Khandelwal, M.; Armaghani, D.J.; Faradonbeh, R.S.; Ranjith, P.G.; Ghoraba, S. A new model based on gene expression programming to estimate air flow in a single rock joint. Environ. Earth Sci. 2016, 75, 739. [Google Scholar] [CrossRef]
- Jahed Armaghani, D.; Faradonbeh, R.S.; Momeni, E.; Fahimifar, A.; Tahir, M.M. Performance prediction of tunnel boring machine through developing a gene expression programming equation. Eng. Comput. 2017. [Google Scholar] [CrossRef]
- Faradonbeh, R.S.; Armaghani, D.J.; Monjezi, M.; Mohamad, E.T. Genetic programming and gene expression programming for flyrock assessment due to mine blasting. Int. J. Rock Mech. Min. Sci. 2016, 88, 254–264. [Google Scholar] [CrossRef]
- Mahdiyar, A.; Hasanipanah, M.; Armaghani, D.J.; Gordan, B.; Abdullah, A.; Arab, H.; Majid, M.Z.A. A Monte Carlo technique in safety assessment of slope under seismic condition. Eng. Comput. 2017, 33, 807–817. [Google Scholar] [CrossRef]
- Armaghani, D.J.; Mahdiyar, A.; Hasanipanah, M.; Faradonbeh, R.S.; Khandelwal, M.; Amnieh, H.B. Risk Assessment and Prediction of Flyrock Distance by Combined Multiple Regression Analysis and Monte Carlo Simulation of Quarry Blasting. Rock Mech. Rock Eng. 2016, 49, 3631–3641. [Google Scholar] [CrossRef]
- Hatheway, A.W. The complete ISRM suggested methods for rock characterization, testing and monitoring; 1974–2006. Environ. Eng. Geosci. 2009, 15, 47–48. [Google Scholar] [CrossRef]
- Abad, S.V.A.N.K.; Tugrul, A.; Gokceoglu, C.; Armaghani, D.J. Characteristics of weathering zones of granitic rocks in Malaysia for geotechnical engineering design. Eng. Geol. 2016, 200, 94–103. [Google Scholar] [CrossRef]
- Aydan, Ö.; Ulusay, R.; Tokashiki, N. A new rock mass quality rating system: Rock mass quality rating (RMQR) and its application to the estimation of geomechanical characteristics of rock masses. Rock Mech. Rock Eng. 2014, 47, 1255–1276. [Google Scholar] [CrossRef]
- Aydan, Ö.; Tano, H.; Ideura, H.; Asano, A.; Takaoka, H.; Soya, M.; Imazu, M. Monitoring of the dynamic response of the surrounding rock mass at the excavation face of Tarutoge Tunnel, Japan. In Proceedings of the ISRM International Symposium-EUROCK 2016, Ürgüp, Turkey, 29–31 August 2016. [Google Scholar]
- Jahed Armaghani, D.; Hajihassani, M.; Monjezi, M.; Mohamad, E.T.; Marto, A.; Moghaddam, M.R. Application of two intelligent systems in predicting environmental impacts of quarry blasting. Arab. J. Geosci. 2015, 8, 9647–9665. [Google Scholar] [CrossRef]
- Armaghani, D.J.; Hasanipanah, M.; Amnieh, H.B.; Bui, D.T.; Mehrabi, P.; Khorami, M. Development of a novel hybrid intelligent model for solving engineering problems using GS-GMDH algorithm. Eng. Comput. 2019, 1–13. [Google Scholar] [CrossRef]
- Ferreira, C. Algorithm for solving gene expression programming: A new adaptive problems. Complex Syst. 2001, 13, 87–129. [Google Scholar]
- Ozbek, A.; Unsal, M.; Dikec, A. Estimating uniaxial compressive strength of rocks using genetic expression programming. J. Rock Mech. Geotech. Eng. 2013, 5, 325–329. [Google Scholar] [CrossRef]
- Mollahasani, A.; Alavi, A.H.; Gandomi, A.H. Empirical modeling of plate load test moduli of soil via gene expression programming. Comput. Geotech. 2011, 38, 281–286. [Google Scholar] [CrossRef]
- Kayadelen, C. Soil liquefaction modeling by genetic expression programming and neuro-fuzzy. Expert Syst. Appl. 2011, 38, 4080–4087. [Google Scholar] [CrossRef]
- Faradonbeh, R.S.; Hasanipanah, M.; Amnieh, H.B.; Armaghani, D.J.; Monjezi, M. Development of GP and GEP models to estimate an environmental issue induced by blasting operation. Environ. Monit. Assess. 2018, 190, 351. [Google Scholar] [CrossRef]
- Güllü, H. Prediction of peak ground acceleration by genetic expression programming and regression: A comparison using likelihood-based measure. Eng. Geol. 2012, 141, 92–113. [Google Scholar] [CrossRef]
- Armaghani, D.J.; Faradonbeh, R.S.; Rezaei, H.; Rashid, A.S.A.; Amnieh, H.B. Settlement prediction of the rock-socketed piles through a new technique based on gene expression programming. Neural Comput. Appl. 2016, 29, 1115–1125. [Google Scholar] [CrossRef]
- Koopialipoor, M.; Fahimifar, A.; Ghaleini, E.N.; Momenzadeh, M.; Armaghani, D.J. Development of a new hybrid ANN for solving a geotechnical problem related to tunnel boring machine performance. Eng. Comput. 2019. [Google Scholar] [CrossRef]
- Zhao, Y.; Noorbakhsh, A.; Koopialipoor, M.; Azizi, A.; Tahir, M.M. A new methodology for optimization and prediction of rate of penetration during drilling operations. Eng. Comput. 2019. [Google Scholar] [CrossRef]
- Koopialipoor, M.; Nikouei, S.S.; Marto, A.; Fahimifar, A.; Armaghani, D.J.; Mohamad, E.T. Predicting tunnel boring machine performance through a new model based on the group method of data handling. Bull. Eng. Geol. Environ. 2018, 78, 3799–3813. [Google Scholar] [CrossRef]
- Zorlu, K.; Gokceoglu, C.; Ocakoglu, F.; Nefeslioglu, H.A.; Acikalin, S. Prediction of uniaxial compressive strength of sandstones using petrography-based models. Eng. Geol. 2008, 96, 141–158. [Google Scholar] [CrossRef]
- Optimization and Simulation User Guide. Available online: https://www.scribd.com/document/353584360/Solver-User-Guide (accessed on 18 November 2019).
- Ghasemi, E.; Sari, M.; Ataei, M. Development of an empirical model for predicting the effects of controllable blasting parameters on flyrock distance in surface mines. Int. J. Rock Mech. Min. Sci. 2012, 52, 163–170. [Google Scholar] [CrossRef]
- Zhou, J.; Aghili, N.; Ghaleini, E.N.; Bui, D.T.; Tahir, M.M.; Koopialipoor, M. A Monte Carlo simulation approach for effective assessment of flyrock based on intelligent system of neural network. Eng. Comput. 2019. [Google Scholar] [CrossRef]
- Arnold, U.; Yildiz, Ö. Economic risk analysis of decentralized renewable energy infrastructures—A Monte Carlo Simulation approach. Renew. Energy 2015, 77, 227–239. [Google Scholar] [CrossRef]
- Mahdiyar, A.; Marto, A.; Mirhosseinei, S.A. Probabilistic air-overpressure simulation resulting from blasting operations. Environ. Earth Sci. 2018, 77, 123. [Google Scholar] [CrossRef]
- Mahdiyar, A.; Tabatabaee, S.; Sadeghifam, A.N.; Mohandes, S.R.; Abdullah, A.; Meynagh, M.M. Probabilistic private cost-benefit analysis for green roof installation: A Monte Carlo simulation approach. Urban For. Urban Green. 2016, 20, 317–327. [Google Scholar] [CrossRef]
- Duvall, W.I.; Fogelson, D.E. Review of Criteria for Estimating Damage to Residences from Blasting Vibrations; US Department of the Interior, Bureau of Mines: Washington, DC, USA, 1962.
- Wang, Z.; Bou-Zeid, E.; Au, S. Analyzing the sensitivity of WRF’s single-layer urban canopy model to parameter uncertainty using advanced Monte Carlo simulation. J. Appl. Meteorol. Climatol. 2011, 50, 1795–1814. [Google Scholar] [CrossRef]
- Song, J.; Wang, Z. Evaluating the impact of built environment characteristics on urban boundary layer dynamics using an advanced stochastic approach. Atmos. Chem. Phys. 2016, 16, 6285–6301. [Google Scholar] [CrossRef]


© 2020 by the authors. Licensee MDPI, Basel, Switzerland. This article is an open access article distributed under the terms and conditions of the Creative Commons Attribution (CC BY) license (http://creativecommons.org/licenses/by/4.0/).