Article

Analysis of Carbon Tetrachloride-Extractable Species from Daxing Bituminous Coal

1
School of Chemical Engineering & Technology, China University of Mining & Technology, Xuzhou 221116, China
2
College of Chemistry, Chemical Engineering, and Materials Science, Zaozhuang University, Zaozhuang 277160, China
*
Authors to whom correspondence should be addressed.
Appl. Sci. 2020, 10(2), 494; https://doi.org/10.3390/app10020494
Submission received: 1 December 2019 / Revised: 3 January 2020 / Accepted: 7 January 2020 / Published: 9 January 2020

Abstract

:
Soxhlet extraction (SE), ultrasonic-assisted extraction (UAE), and microwave-assisted extraction (MAE) were carried out on Daxing coal with carbon tetrachloride. The extracted components were analyzed by GC-MS while the residues of the coal after extractions were analyzed by FT-IR spectroscopy. The obtained IR spectra indicated that the functional groups were barely changed in strength for the coal before and after extractions concluding that the macromolecular structures of coal were not destroyed in the extraction processes. XRD diagrams showed the peak around θ = 47 was totally disappeared by all the three extractions, indicating that the graphite-like structural substances in the coal were totally destroyed in the extraction processes. GC/MS analysis showed that: (1) The SE method extracted the least number of substances from the coal; on the other hand, the extracted compounds are largely chlorinated which can be explained by the free radical mechanism. (2) MAE extracted 75 organic compounds of which 53 are oxygen-containing substances. A small portion of non-alkanes (1.19%) was found, which is in contrast to the other two extraction methods. Moreover, a few biomarker compounds were also identified including hexaoxane, 2-methylcholest-3-ene, 6,9,12-tripropylheptadecane, and 17α-21β-28,30-bisnorhopane. (3) The three extraction methods gave totally different extraction patterns for the same coal, highlighting that the extraction method can dominate the outcome of the extracted products. The mechanisms behind these extraction processes are discussed. This study provides a base for the future choice of the extraction methods in terms of outcomes of the extraction products.

1. Introduction

Coal is an extremely complex and heterogeneous material. It is a challenging task to characterize the structure of coal due to the complex and heterogeneous nature. Understanding the origin, chemical structure, and carbon skeleton are important for coal exploitation and further utilization [1]. Comprehensive utilization of coal is of critical importance for the development of the economy. The production of high valued chemicals from coal is a tempting method for coal utilization, which is also a fundamental direction of coal conversion technologies, highly efficient, and of rational utilization. It has been demonstrated that coal extraction is a good method for achieving the above goals since many aromatic compounds are obtainable from the extraction process. Such aromatic compounds can be used as raw and starting materials for the synthesis of aromatic polymers and engineering plastics [2,3]. On the other hand, solvent extraction is an effective approach to study the compositions and structures of coal and to assist coal liquidation and faction [4,5,6]. In recent years, scientists have made in-depth studies on the solvent extraction yield and extraction efficiency of coal [7,8,9,10,11,12,13]. Chen et al. used acetone as a solvent to extract lignite by microwave-assisted heating, and obtained some correlations between extraction yield and power of microwave [14]. Qin et al. used carbon disulfide and petroleum ether to extract lignite through a Soxhlet extraction (SE) for studying the extracted components of coal [15]. The solubilization of small molecules in coal by solvent extraction and its effect on pore distribution of low-rank coal were studied. Xia et al. used high-performance liquid chromatography–electrospray ionization time-of-flight mass spectrometry to separate and identify several kinds of organic nitrogen isomers in Dongming lignite, and analyzed their structural information [16].
In this work, three different extraction methods, i.e., Soxhlet extraction (SE), ultrasonic-assisted extractions (UAE), and microwave-assisted extractions (MAE) were employed to study the extraction process of Daxing coal (Daxing Coal Mine, Zaozhuang, China). The extraction yields, the extracted components, and the residues of the extracted coal were also investigated. We herein report our results.

2. Experimental

2.1. Sample Preparations

Daxing coal (lumpy solids) was obtained from a washing plant in the Daxing Coal Mine and was sealed in a wide-mouth glass bottle with a corning screw cap. The coal was pulverized and passed through a 200 mesh sieve (<74 µm). The pulverized coal powder was dried at 60 °C for 24 h under a nitrogen gas stream (2 mL/min) using a tube furnace (the treatment process for removing free water from coal and avoiding oxidation of coal by oxygen). Table 1 shows the proximate and ultimate analytic results of the coal powder. Carbon tetrachloride (analytical grade) was used as an extraction solvent and was distilled prior to use. An Agilent 7890/7000B/QQQ gas chromatography-mass spectrometer (GC-MS/MS) was used for analysis of the extracted components. A Nicolet Magna IR-560 Fourier-transform infrared spectrometer (FT-IR) was employed for analysis of the coal residues after extractions.

2.2. Extraction Procedure

For the SE method, a 10 g dry Daxing coal was extracted by 50 mL carbon tetrachloride under reflux condition (77 °C) for 240 h. The residual coal was filtered off and dried in vacuum for 4 h at 80 °C, and then subjected to analysis by FT-IR and X-ray diffraction (XRD). For the extract, a sample of about 20 uL was used for GC-MS analysis and the rest was concentrated to dry and then weighed with the calculation of the extraction rate of coal.
For the UAE method, a 10 g coal sample was extracted with 50 mL of carbon tetrachloride in a round bottom flask to obtain extracts and residue by using an 800 watt ultrasonic instrument. Each ultrasonic extraction procedure lasted for 10 min and was repeated for two hundred times at room temperature to extract the soluble species as exhaustively as possible. The extract was filtered and then analyzed by GC-MS. Furthermore, the above extract was concentrated using the rotary evaporator to dry and then weighed with the calculation of the extraction rate of coal. The post-treatment and detection of filtered extracted residual coal are the same as those of SE method.
For the MAE method, an MDS-6 auto-frequency modulation microwave digestion/extraction oven with temperature and pressure control, made in China, was used for the microwave-assisted extraction experiments. The microwave power was 800 W and the control limit of the temperature was 343 K (inside the vessel). The pressure was 0.1 MPa. At first, the temperature and time in the oven were adjusted to a required value for the sample. Then, an accurately-weighed sample (ca. 10 g), together with 50 mL of solvent, was put into an extraction vessel made of polytetrafluoroethylene. The extraction vessel was placed into a rotating pan fixed at the bottom of the MDS-6 digestion/extraction oven. After extracting for 720 min, the extracts and residual coal were centrifuged at 2000 rev/min for 10 min. The post-treatment and detection of filtrate and residual coal solids are the same as those of the SE method.

2.3. Analytical Methods

The GC-MS/MS consisted of a capillary column from HP-5MS (cross-link 5% PH ME siloxane, 60 m length, 0.25 mm inner diameter, and 0.25 μm film thickness) and a quadrupole analyzer; an electron impact (70 eV) mode was operated. The gradient temperature mode was employed for the separation of components; namely, the compatible oven was kept at 60 °C for 5 min, then raised from 60 °C to 150 °C at 3 °C/min and then from 150 °C to 300 °C at 10 °C/min followed by holding at 300 °C for 5 min. Helium was used as the carrier gas at 1.0 mL·min−1. The inject volume of all the test sample was 0.4 μL. Data acquired were processed using MSD (B.05) ChemStation software [17]. Compounds were identified by comparing mass spectra with NIST11 library data [18]. The relative content (RC) of each compound was determined by the normalization method of peak area, i.e., the peak area of the compound divided by the sum of the peak areas of all the identified compounds in the total ion chromatograms. Coal samples before and after extractions were analyzed by FT-IR and XRD. FT-IR spectra were recorded using a Nicolet Magna IR-560 FT-IR spectrometer by collecting 64 scans using KBr pellets (coal and KBr were mixed evenly at a mass ratio of 1:200) with a resolution of 4 cm−1 in the measuring range of 4000–400 cm−1 at room temperature.
XRD diffraction spectra were obtained with a high-power (40 kW) X-ray diffractometer. The diffractometer contained a rotating copper anode, a graphite monochromator, and a scintillation counter. The diffraction patterns (2θ = 3–110°) were recorded at room temperature using Cu Kα radiation (λ = 1.54055 Å) at a scanning speed of 2 degree/s and a step size of 0.02 (2θ). Using the compatible software program supplied with the machine, the recorded diagrams were smoothed, background-subtracted, corrected for Ka2, and deconvoluted.

3. Results and Discussion

3.1. Calculation of Different Extraction Yields

The solvent extraction yield was calculated by Equation (1):
E = 100m1/[(100 − Aad − Mad)·m/100]
In Equation (1), m1 is the dried amount (g) obtained from the extracted solvent phase; m is the quality (g) of the starting raw coal; Aad is the ash content of the raw coal in air-dry base (%); Mad is the moisture content of raw coal in air drying base (%). The extraction yields obtained by different methods are 1.7% for UAE, 1.5% for SE, and 2.0% for MAE, respectively. The yield of SE is the worst because the solvent is always difficult to penetrate into the coal matrix. Solvent extraction of coal is a process where solvent diffusion occurs without external assistance. The ultrasonic-assisted process can promote solvent permeation into fractures of crosslinked bonds of the coal. The microwave-assisted process is more powerful for extraction than the ultrasound-assisted one, since microwave penetration is much stronger; consequently, the networks of coal could be opened and more organic substances were dissolved.

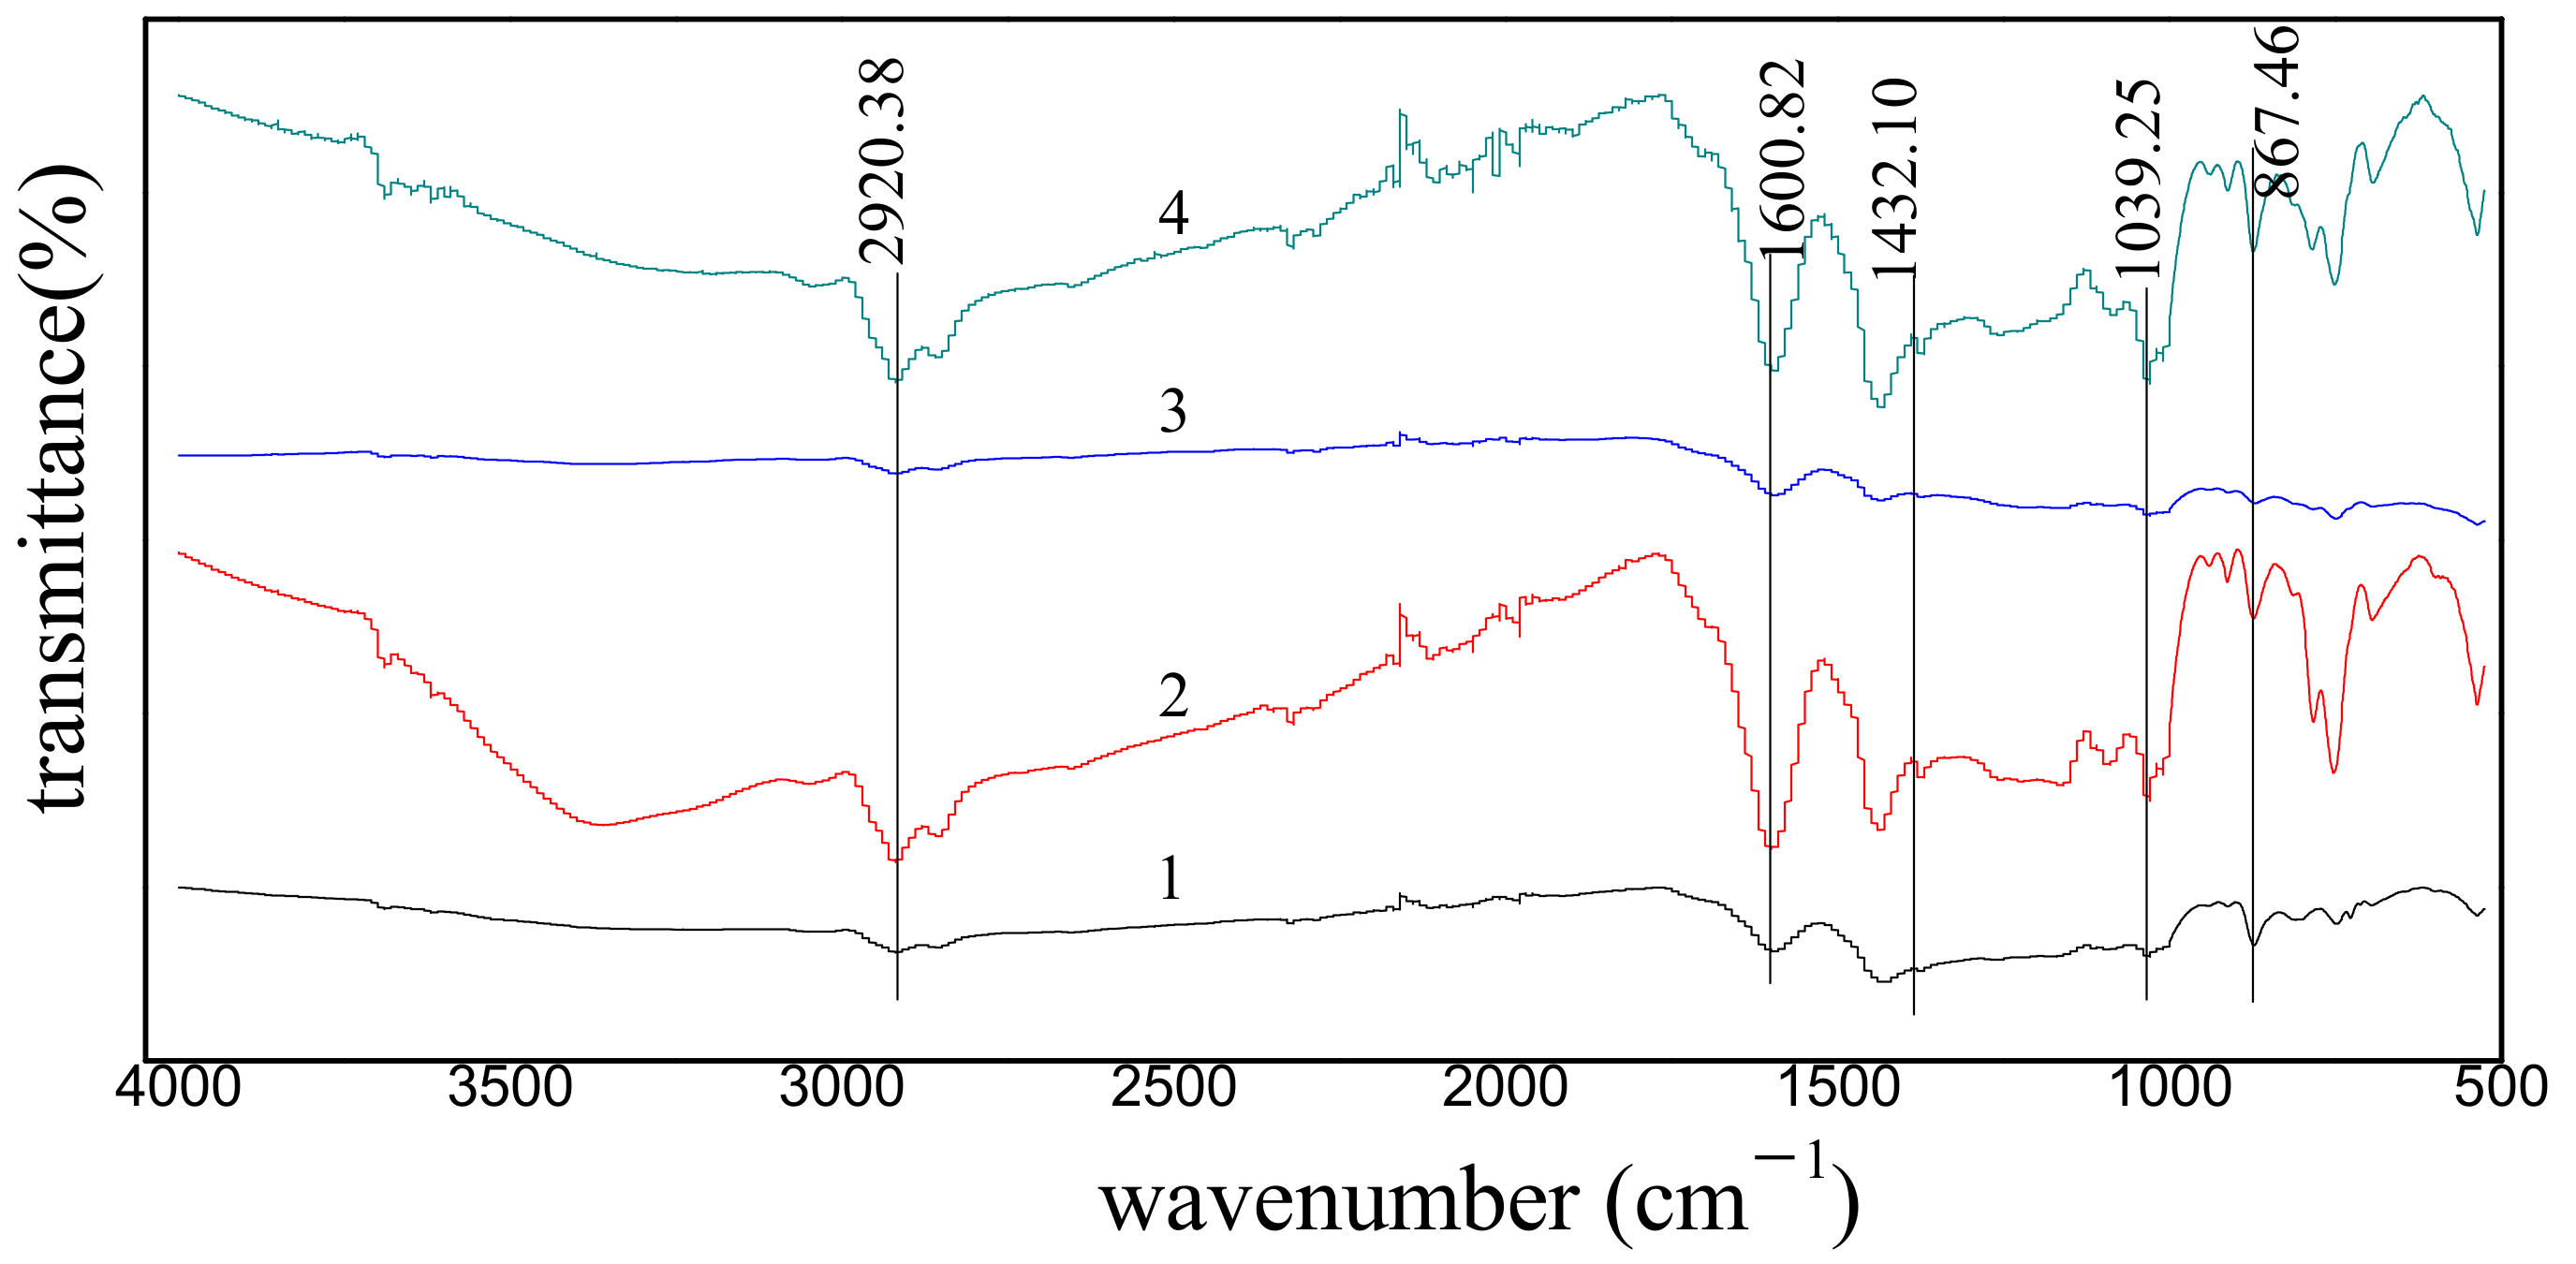
3.2. FT-IR Spectroscopic Analysis

The FT-IR spectra obtained for the coal samples before and after extraction are shown in Figure 1, showing that the spectra obtained from different methods of extraction are broadly similar in shape (i.e., the positions of absorption bands remain the same). However, the relative intensities of the absorption bands vary widely and all the major bands obviously stem from organic functional groups in coal samples. The absorption bands in the spectra were assigned according to the standard method in the literature [19,20]. In Figure 1, the absorption band at 3400–3350 cm−1 is assigned to the O-H stretching. The relatively weak band at 3080–3035 cm−1 in Figure 1 is due to the vibrational absorption from C-H bonds in aromatic rings. Clearly, in the SE process, more small molecules main network than that in the other extraction processes, showing a poor extraction degree in the Soxhlet process. A broad band between 2975 and 2848 cm−1, which is due to aliphatic -CH-, -CH2-, and -CH3 vibrations, is persisting for all the samples. The bands among 1745–1695 cm−1 are caused by aliphatic and aromatic carbonyl groups. Apparently, the carbonyl groups are essentially absent in raw coal and in residues after SE. The broad band around 1615–1585 cm−1 is assigned to the stretching vibration of C=C in aromatic compounds. The absorption peak of the extracted residual coal obtained by microwave and ultrasonic is enhanced at about 1600 cm−1, indicating that there are more aromatic structures in the extracted residual coal. The results also show that more small molecular substances are dissolved in the extraction process, which emphasizes the macromolecular structure of the coal. On the other hand, the absorption bands between 900 and 700 cm−1, which are assigned to C–H vibrations in aromatic compounds, can be observed for all the samples. The above observations suggest that all three extraction processes only destroy the weak interactions between small molecules and the network structure of macromolecules in coal, but do not break down the macromolecular structure of coal. The band intensities obtained for the residues after UAE and MAE are enhanced, while those from SE are remaining about the same.

3.3. XRD Analysis

The XRD diffraction spectra acquired for the raw coal and the residues after extractions are shown in Figure 2. The peak around 2θ = 28° stems mainly from the organic substances, while the peak around 2θ = 47° is caused specifically by graphite-like structural substances; all the rest of peaks are produced by mineralized substances [21,22]. Compared with the raw coal, the peak positions at 2θ = 28° are unchanged, which indicates the organic substances remain in the residues after extractions. On the other hand, the peak around 2θ = 47° was totally disappeared by all the three extractions, which illustrates that the graphite-like structural substances in the coal were totally destroyed in the extraction processes. All the rest of the peaks are obviously invariable as a result of present mineralized substances in the residues.

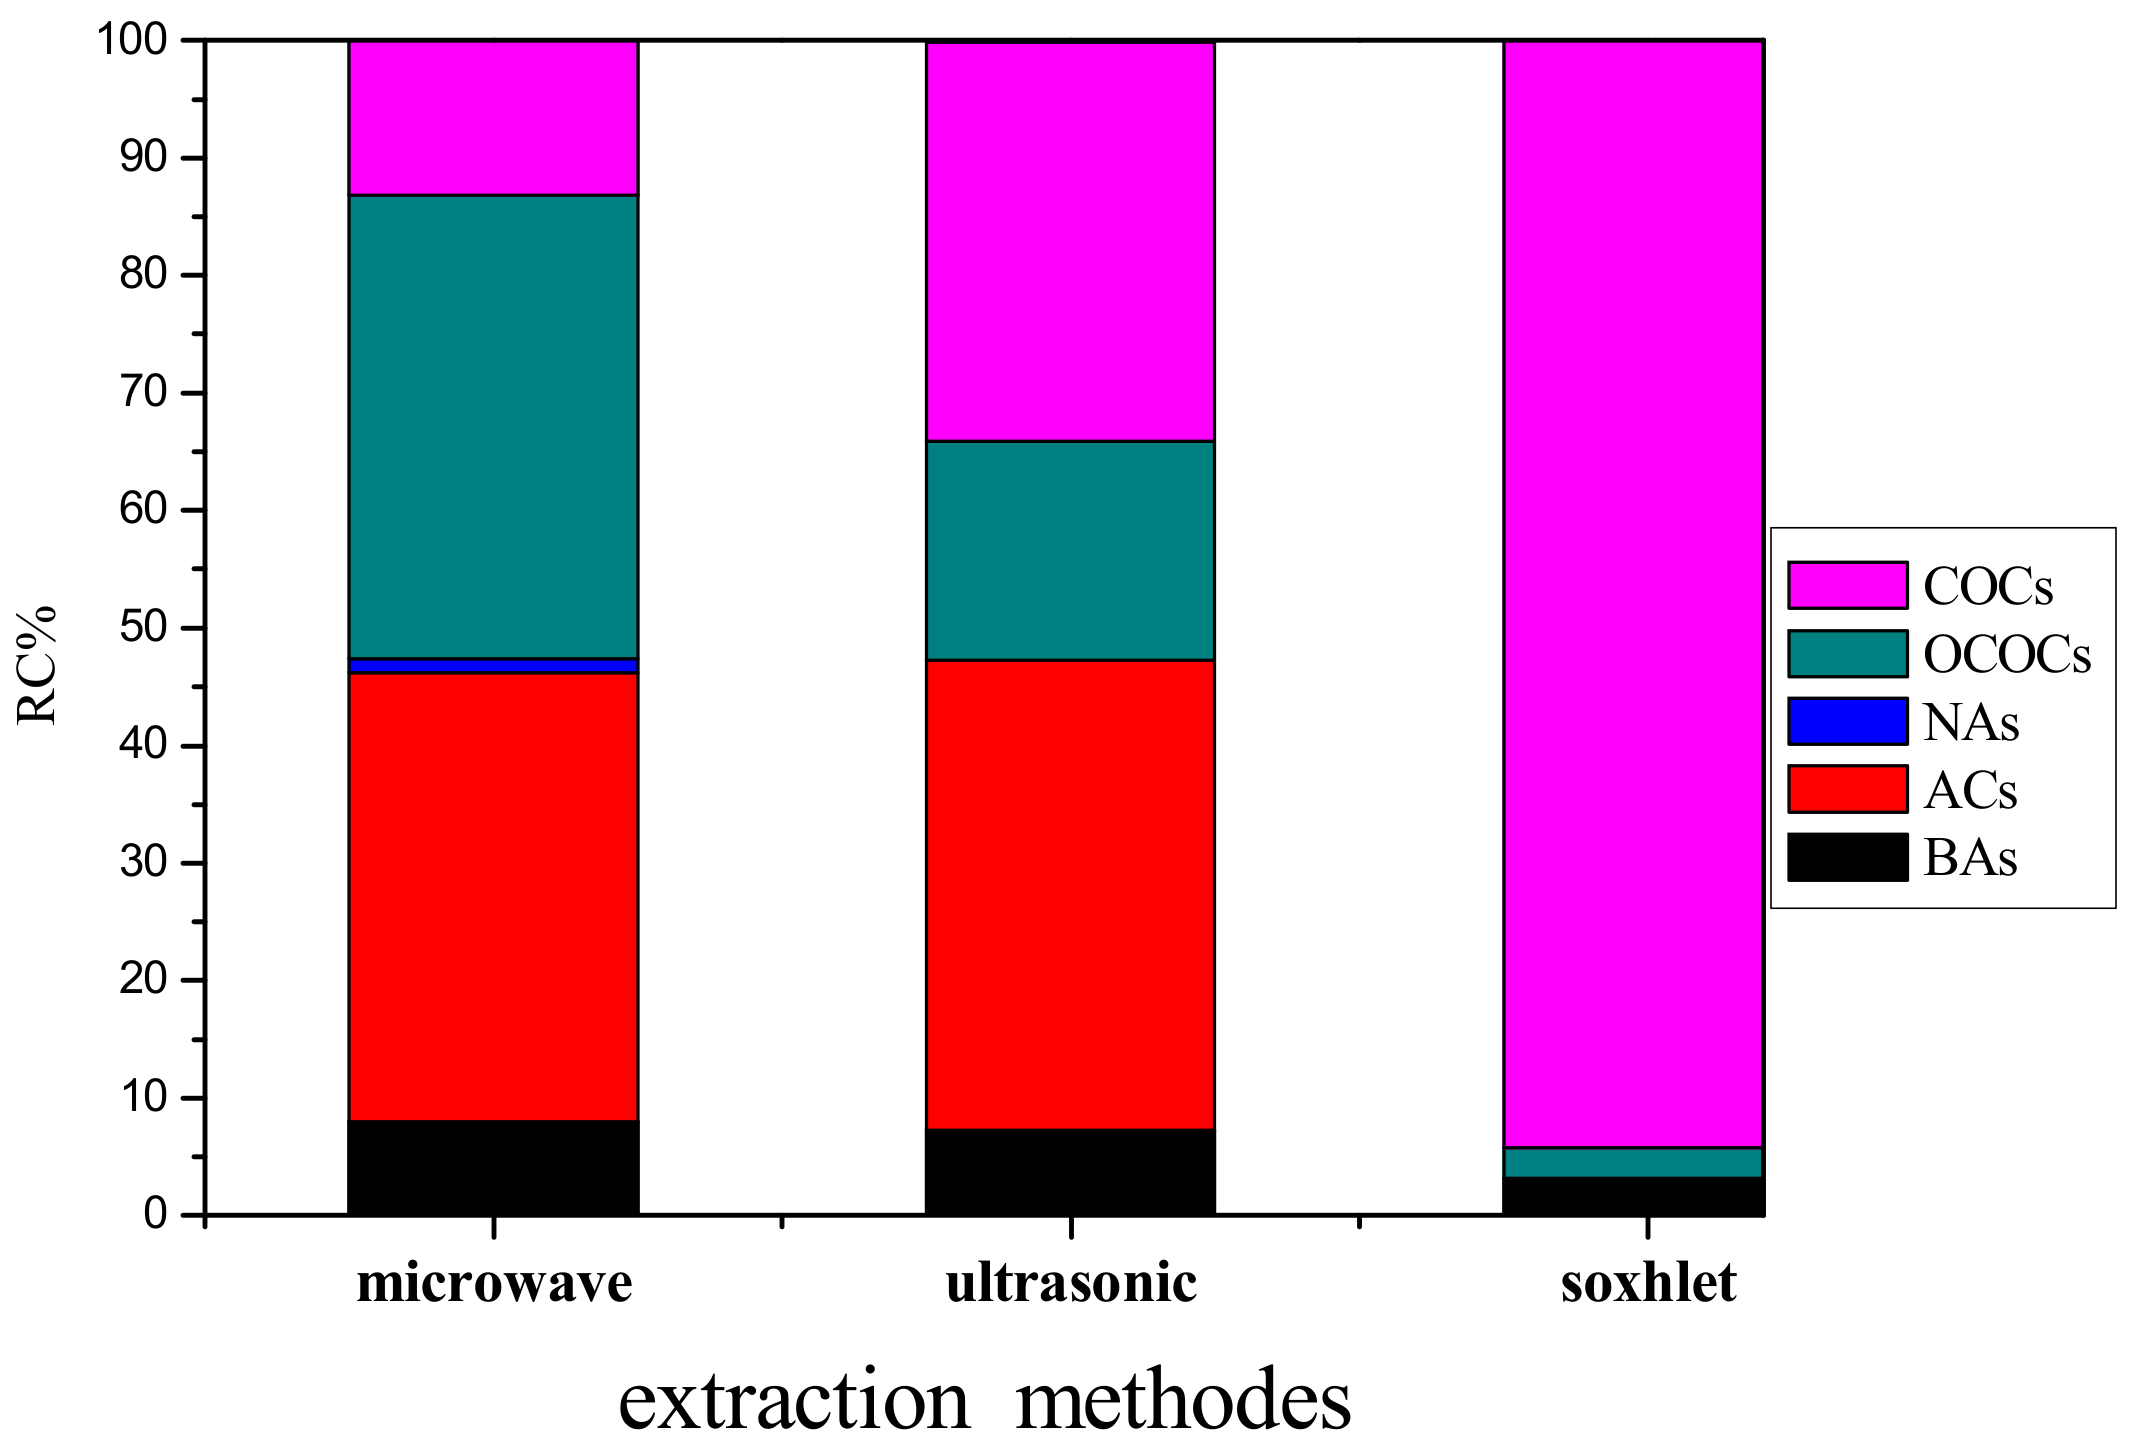
3.4. GC-MS Analysis of Extracts

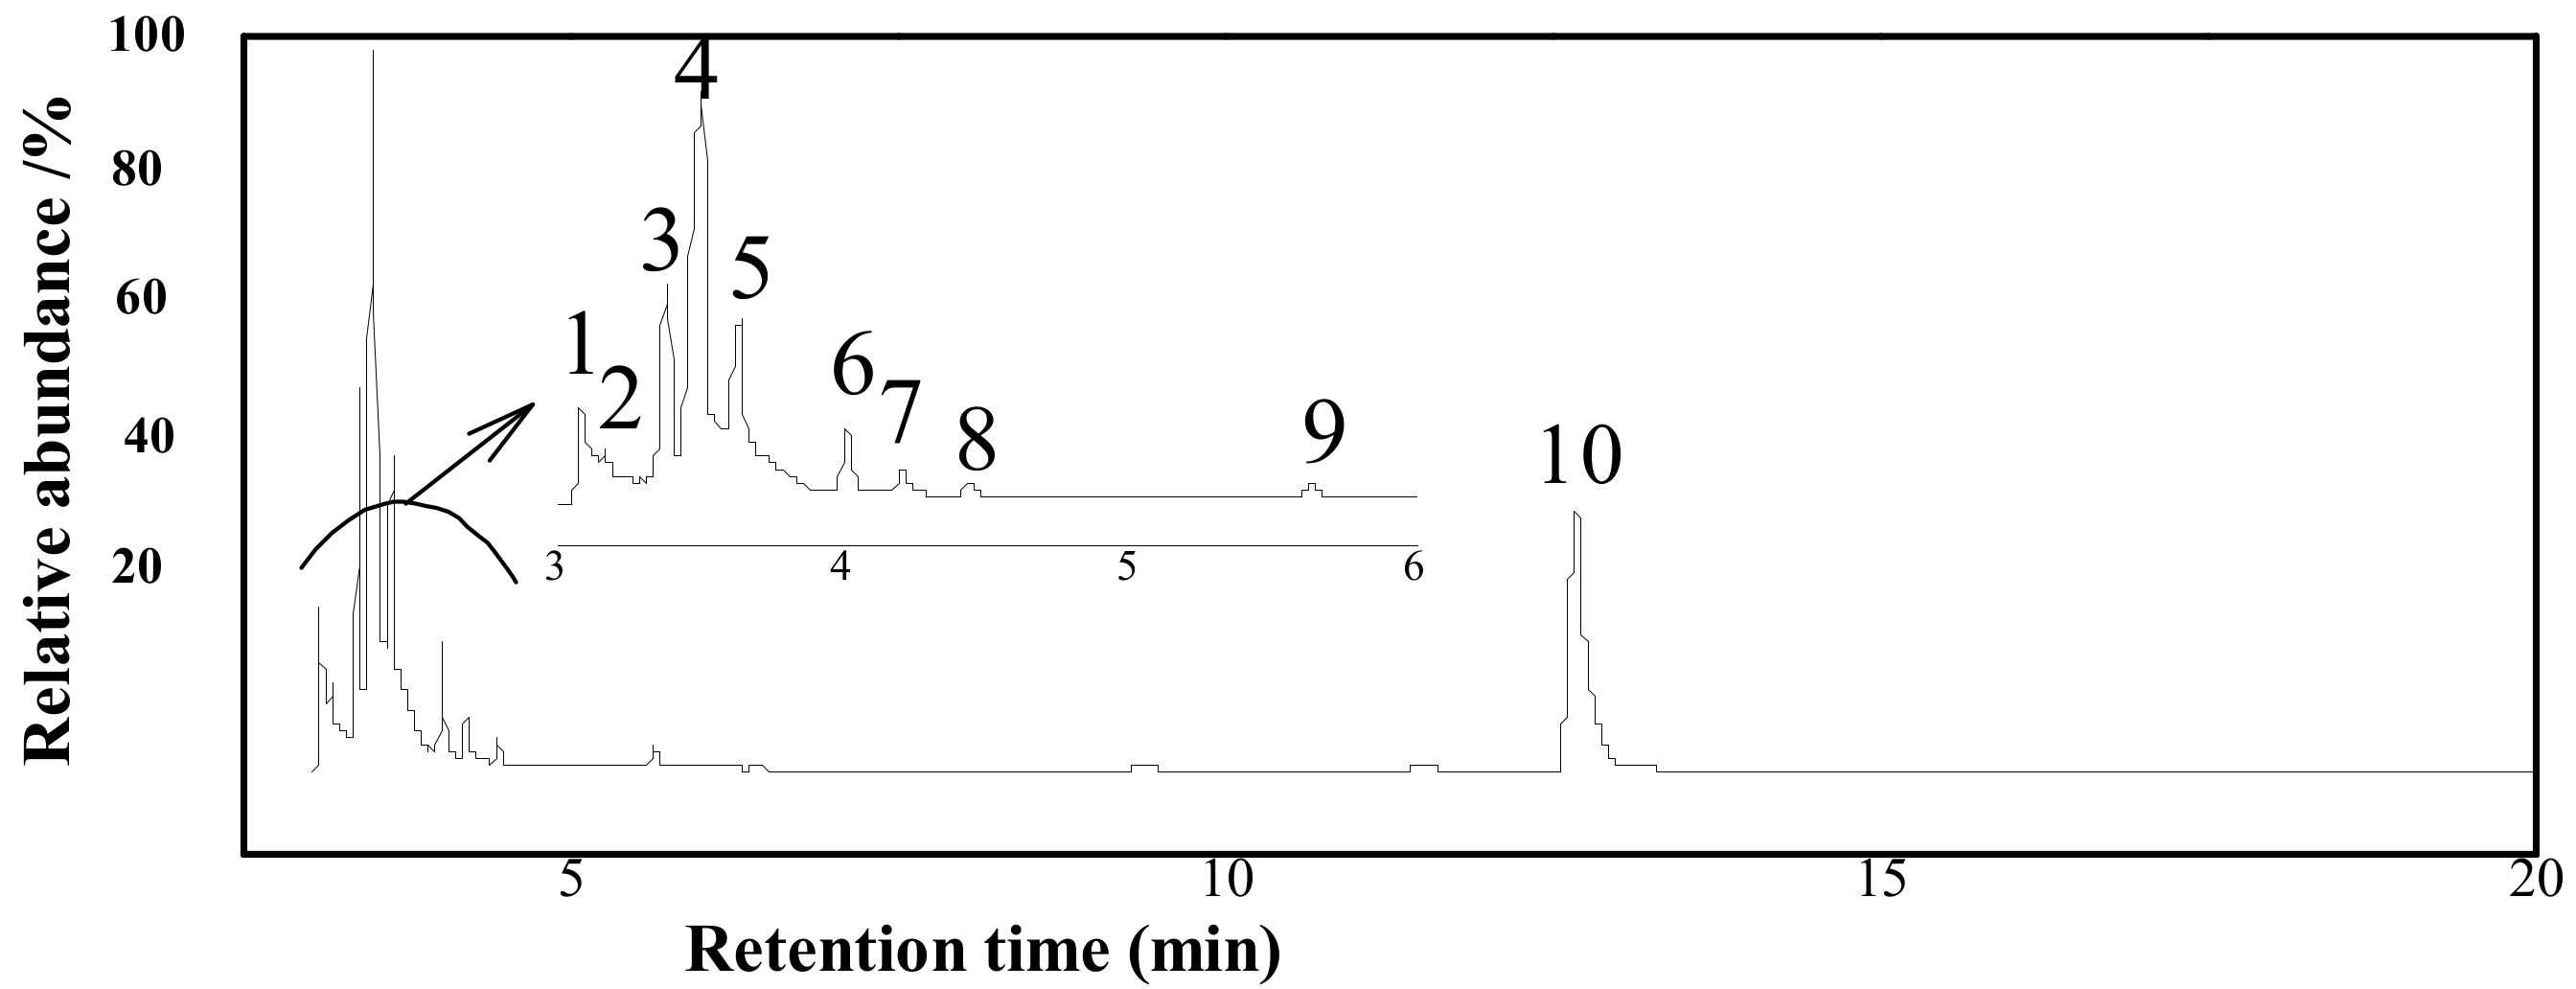
3.4.1. The Extract by SE Process

By comparing the chromatographic peaks detected in the total ion chromatogram (TIC) with the standard spectra of the NIST standard mass spectrometry database, the extracts by SE are shown in Figure 3. A total of ten organic compounds were derived by the mass analysis (the assignments of the peaks are provided in Table S1 in Supplementary Materials), involving eight fatty compounds, one anhydride, and one organic acid. Undoubtedly, chlorinated and fatty compounds are predominant (94.2%). The main aliphatic compounds are also chlorinated. Three of them are oxygen-containing compounds.

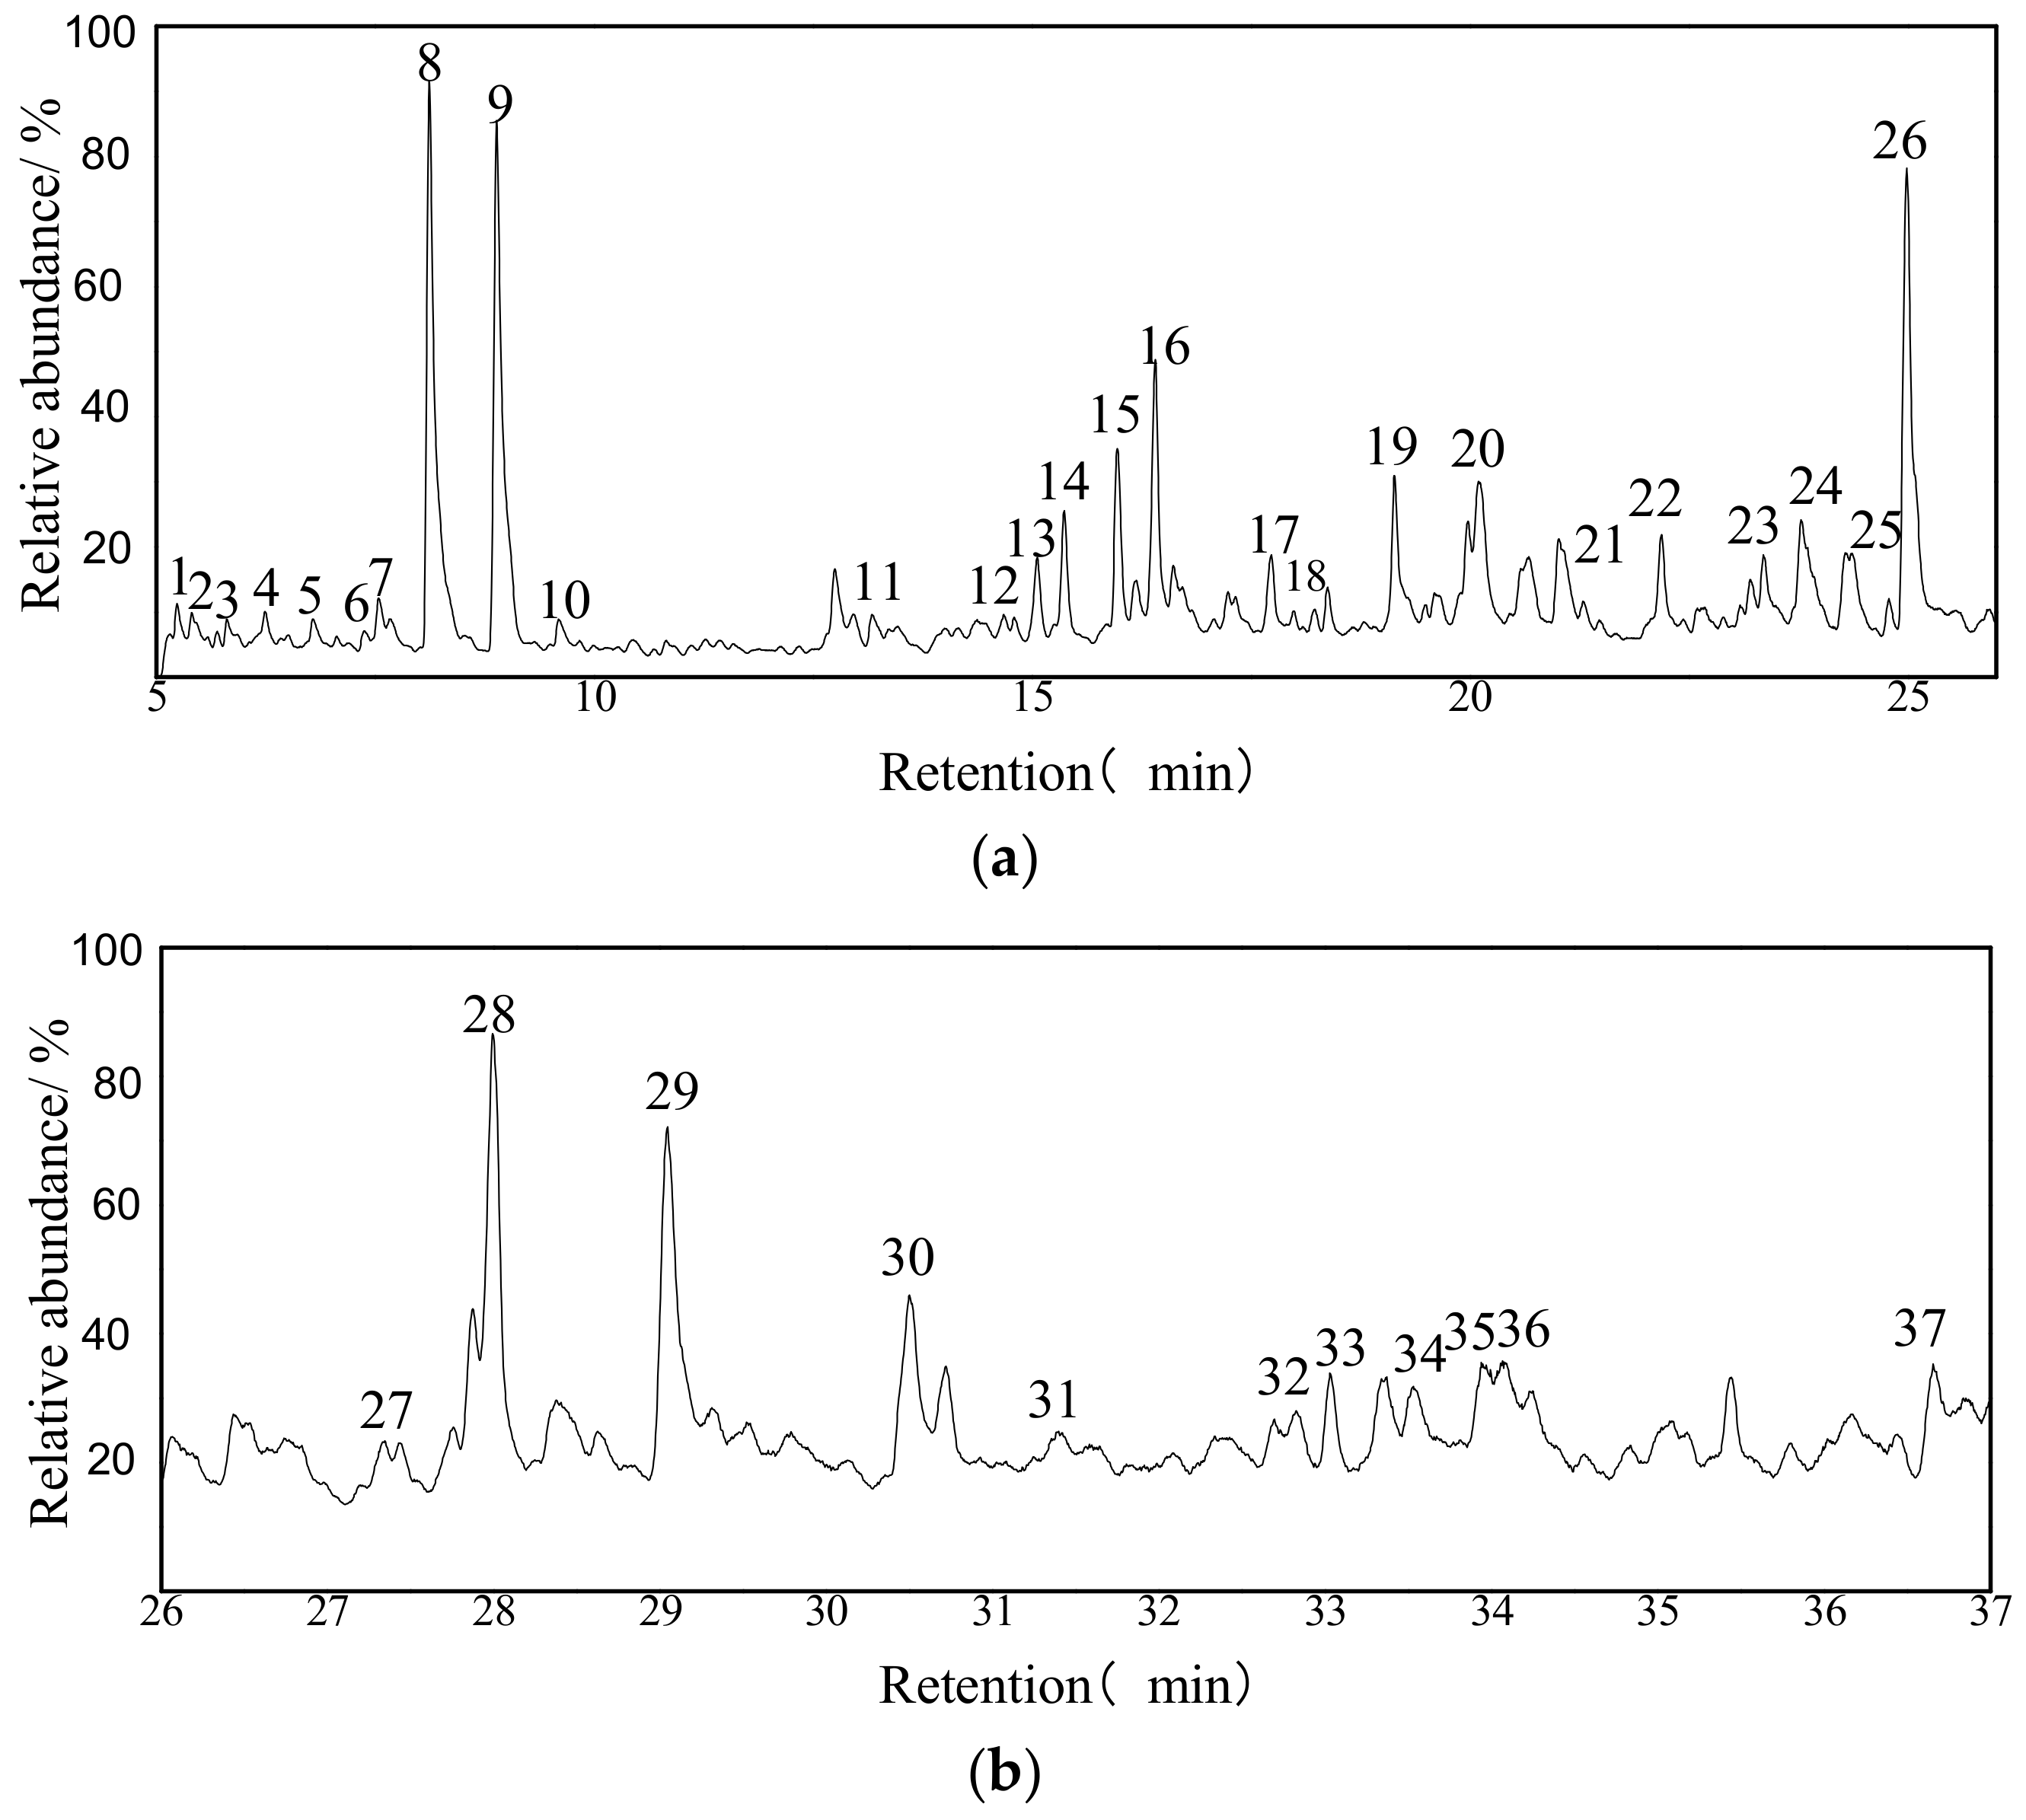
3.4.2. GC/MS Analysis of the Extract from the UAE

The TIC for extracts by the UAE is shown in Figure 4. A series of 37 compounds were identified by mass spectrometry; Table S2 in Supplementary Materials lists all the identified compounds according to the elution time. Clearly, aromatic compounds (ACs) and chlorinated organic compounds (COCs) dominate (about 75%), while no n-alkanes (NAs) were detectable in the extract. Table 2 summarizes the results according to the categories of the extracted substances. It is worth noting that the aromatic compounds include anthracene, benzene, azulene, and their derivatives. On the other hand, the oxygen-containing compounds are mainly ketones, alcohols, and aldehydes.

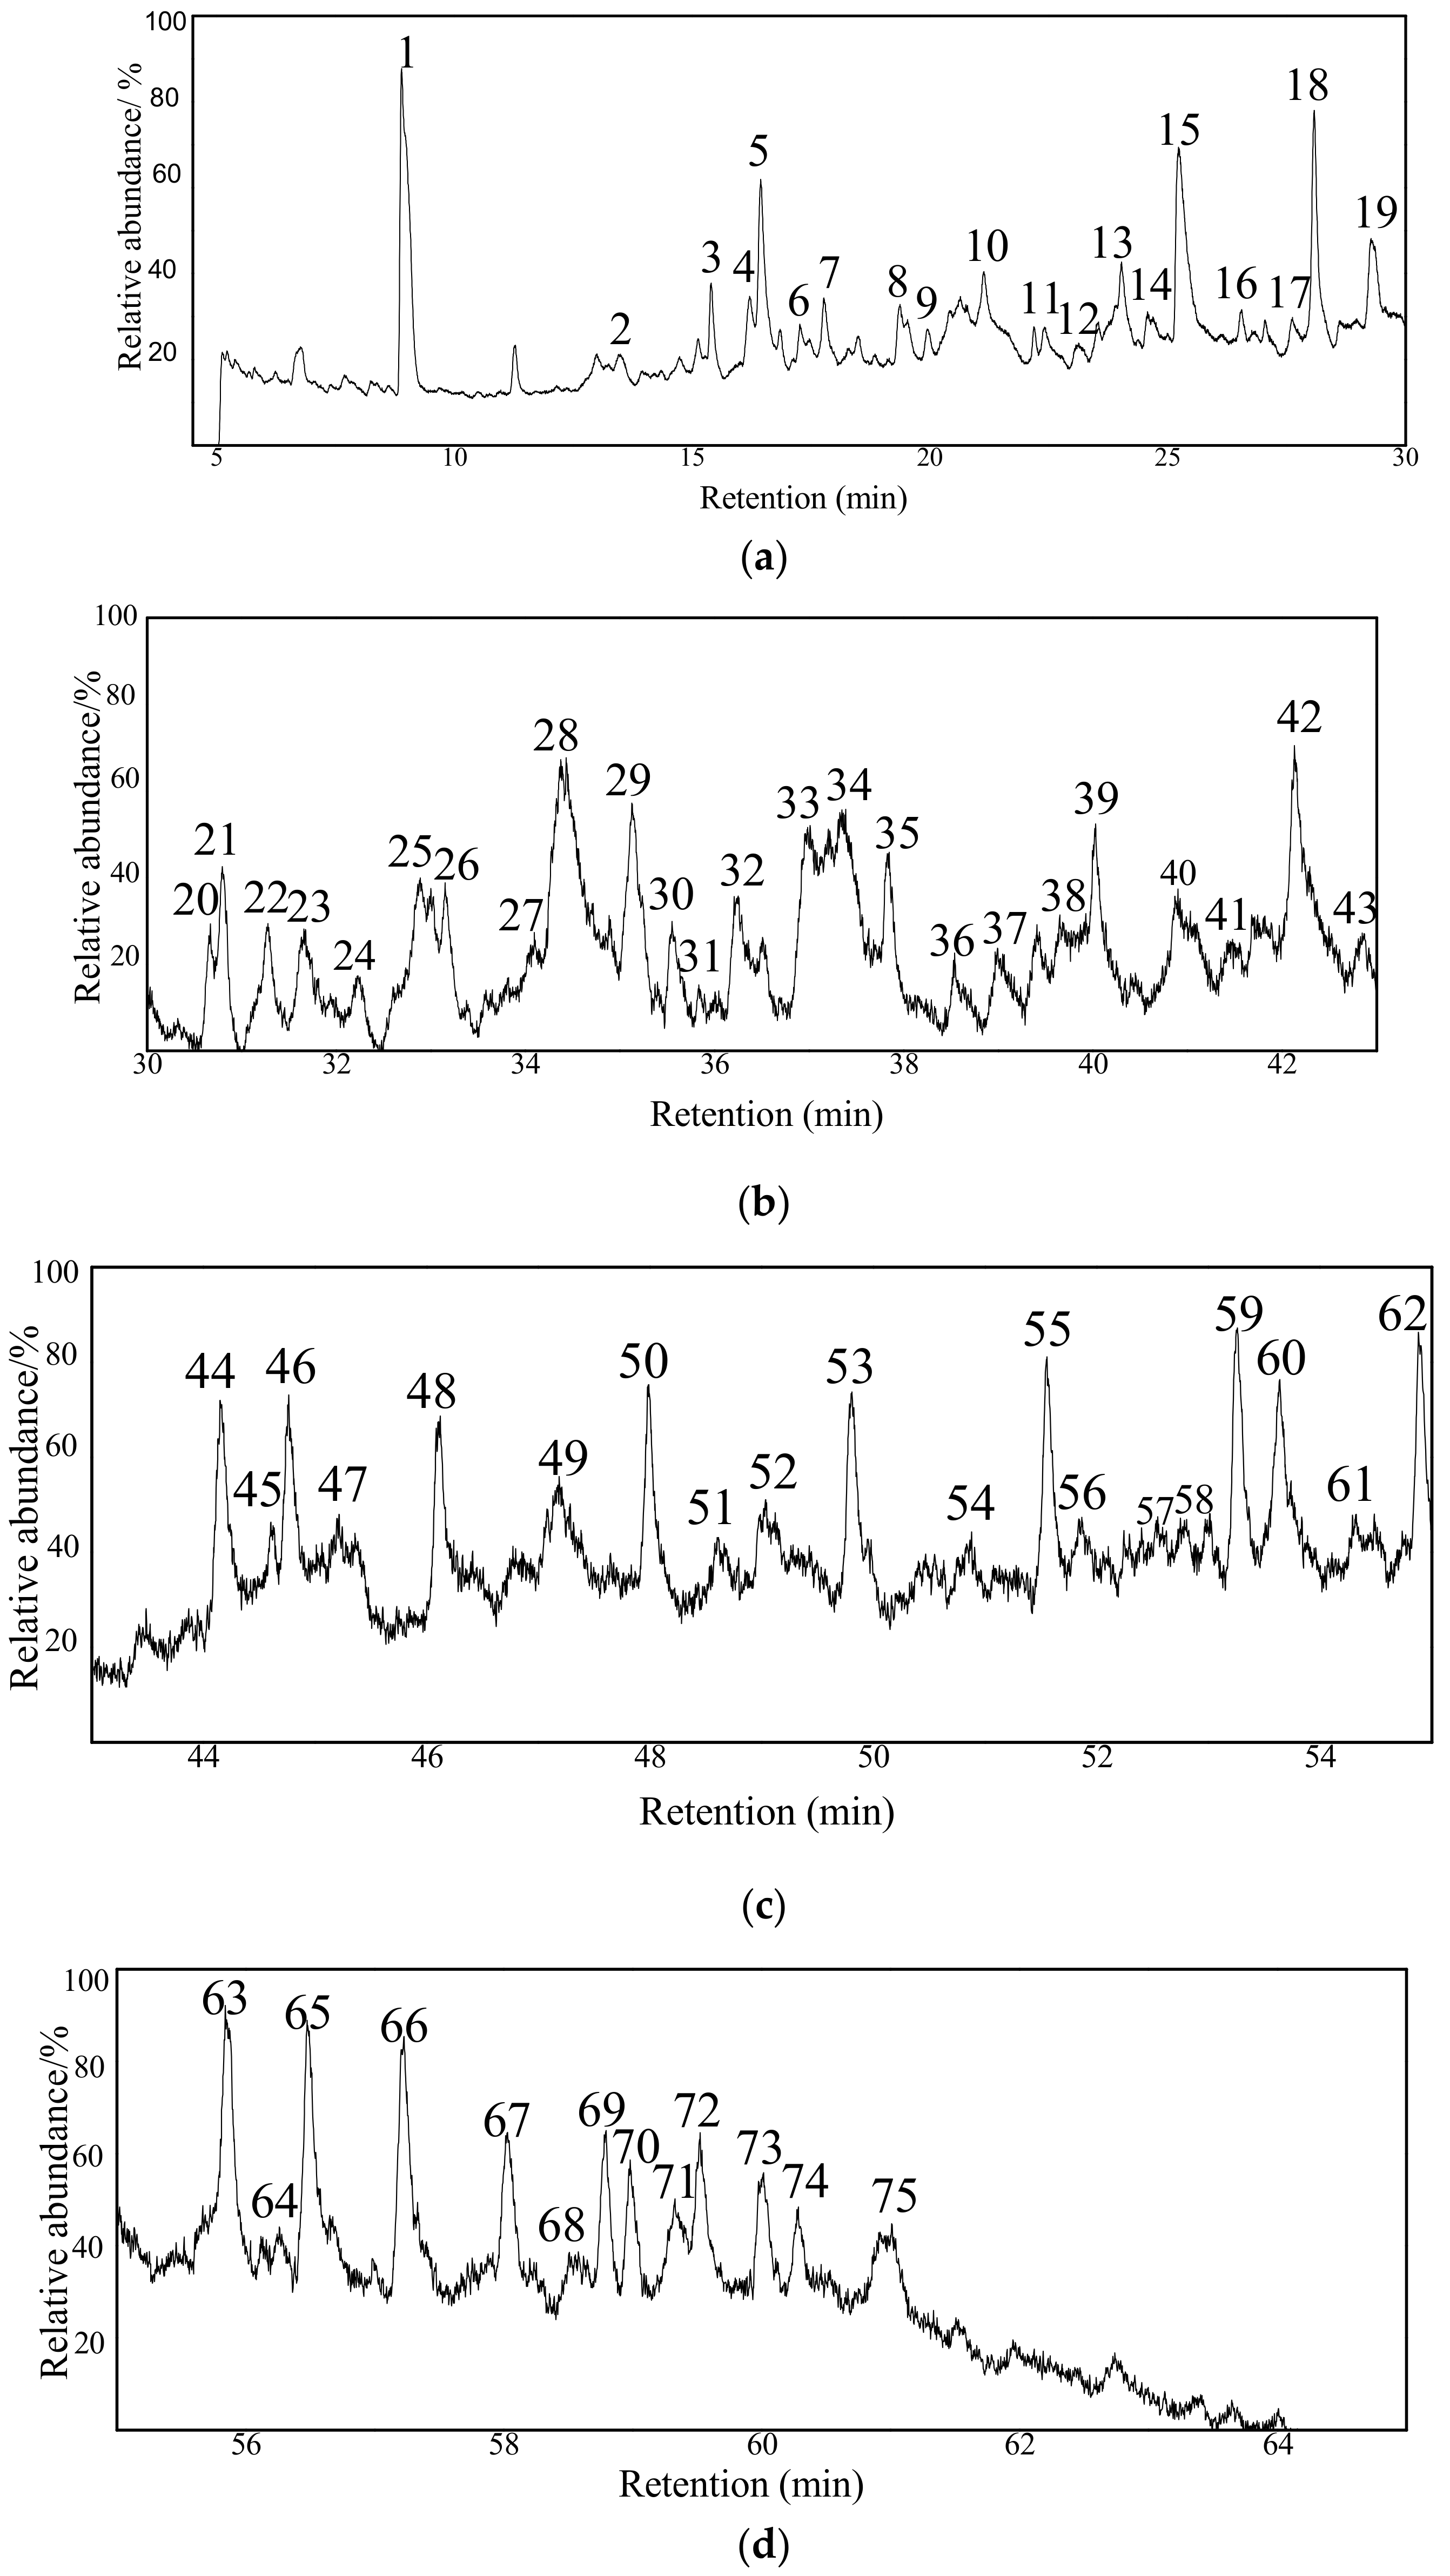
3.4.3. GC/MS Analysis of the Extract from the MAE

The TIC for the extract obtained by MAE is shown in Figure 5. In total, 75 substances were detected in the extract, which are provided in Table S3 in Supplementary Materials; categorially, these 75 substances are also listed in Table 2. The most salient future is that the number of the extracted substances was increased drastically whereas the increased substances are from the class of oxygen-containing compounds (OCOCs); the total amount of OCOCs is also the highest among the three extraction methods. On the other hand, the level of aromatic compounds was remained almost unchanged compared to the UAE. In addition, a small portion of NAs (1.19%) was found, which is in contrast to the other extraction methods. Moreover, a few biomarker compounds were also identified including hexaoxane (Peak 44), 2-methylcholest-3-ene (Peak 63), 6,9,12-tripropylheptadecane (Peak 65), and 17-alfa-21-beta-28,30-bisnorhopane (Peak 69) in Figure 5. Figure 6 illustrates the compositions according to the categories. The extracted relative content and species of the three extraction methods are shown in Figure 6. Compared with other two kinds of extraction, the species extracted by MAE is more, but the content of COCs is less, which might be attributable to carbon tetrachloride as a non-polar solvent is not conducive to the transmission of microwave energy, and will slow down accelerated movement of polar molecular reactants, and can also reduce the collision frequency between reactants. NAs and Bas are extracted more than the other two extractions. Therefore, the MAE method is especially suitable for the extraction of compounds with high solubility in nonpolar solvents.
It is commonly accepted that coal is a heterogeneous and complex mixture, consisting mainly of macromolecules that are linked globally by weak interactions including hydrogen bonds and van der Waals interactions. Among the three extraction methods, the MAE gave the most substances, followed by UAE, while the SE gave the least. The acquisition of most substances from the MAE is probably originated from the extraction mechanism. In the extraction process, the microwave radiations can pass through the medium (namely CCl4) and reach the deep frame of the coal. On the other hand, the microwave heating can accelerate the penetration of CCl4 into the matrix of the coal and can also accelerate the diffusion rate of the extracted molecules from the solid to the solid–liquid interface [23]. The electromagnetic fields of microwave have a few functions including polarizing instantly the molecules in the coal, destroying the hydrogen bonds, and breaking down the van der Wheels interactions. Consequently, some small “fragments” will dissolve in the solvent [24].
In the SE process, chlorinated compounds dominate the extracted substances (94.2%), indicating some chlorination reactions occurred. This is caused probably by the long extraction time (10 days) and in this period of time, chlorination reactions underwent. The mechanism for these chlorination reactions may involve some free radicals [25]: normally, coal contains a small number of metals such as copper and iron; these metals can possibly induce a generation of CCl3 free radicals according to Reaction (2). The reactive·CCl3 free radicals will attack some of the compounds (RH) extracted in CCl4 in a mode of chain propagation as described by Reactions (3) and (4). Finally, Reactions (5)–(7) are probably the chain termination reactions for the free radicals. The high percentage of C2Cl6 found in the extract (about 30%, Peak 10) is strong support to this mechanism.
M + C C l 4 M + C C l 3 + C l
R H + C C l 3 R + H C C l 3
R + C C l 4 R C l + C C l 3
C C l 3 + C C l 3 C l 3 C C C l 3
R + C C l 3 R C C l 3
R + R R R
In the MAE process, the particles in the solvent can be energized by microwave, which causes thermal and mechanical effects between CCl4 and Daxing coal. Microwave can weaken the diffusion resistance of the extracts in the solvent; consequently, the extraction yield can be improved significantly. When the power of the microwave is kept in a range, degradation of the extracts may occur [26]. On the other hand, degradation of the coal residues can also take place when the extraction process is maintained a long time at a relatively high temperature; therefore, more substances can be extracted out. The results obtained in the work are in line with those found by Zheng and coworkers [27]. Non-thermal effects of MAE facilitate the extraction of the oxygen-containing compounds, improving the coal rank and increasing the decomposition of minerals [28].

4. Conclusions

In this work, the Daxing coal was extracted by CCl4 using three different extraction methods. Both the coal residues and the extracts were analyzed using various means. Several conclusions can be drawn from the analytic results. (1) All the three extracted methods did not destroy the macromolecular structure of coal. (2) The SE method extracted the least number of substances from the coal; on the other hand, the extracted compounds are largely chlorinated, which can be explained by the free radical mechanism. (3) The MAE method extracted 75 organic compounds, of which 53 are oxygen-containing substances. (4) The data in Table 2 and in Figure 6 clearly indicate that the three different extraction methods can give totally different extraction patterns for the same coal, highlighting that the extraction method can dominate the outcome of the extracted products.

Supplementary Materials

The following are available online at https://www.mdpi.com/2076-3417/10/2/494/s1, Table S1: Compounds identified by GC-MS for the extract obtained by the SE method, Table S2: Compounds identified by GC-MS for the extract obtained by the UAE method, Table S3: Compounds identified by GC-MS for the extract obtained by the MAE method.

Author Contributions

For research articles, X.W. and H.Z. conceived and designed the experiments; L.J. and M.F. performed the experiments; F.L. and P.Y. analyzed the data; Z.Z. contributed reagents/materials/analysis tools; C.J. wrote the paper. All authors have read and agreed to the published version of the manuscript.

Funding

This research received no external funding.

Conflicts of Interest

The authors declare no conflicts of interest.

References

  1. Lino, M. Network structure of coals and association behavior of coal-derived erials. Fuel Process Technol. 2000, 62, 89–101. [Google Scholar]
  2. Miura, K. Mild conversion of coal for producing valuable chemicals. Fuel Process Technol. 2000, 62, 19–35. [Google Scholar] [CrossRef]
  3. Song, C.; Schobert, H.H. Non-fuel uses of coals and synthesis of chemicals and materials. Fuel 1996, 75, 724–736. [Google Scholar] [CrossRef]
  4. Wei, X.Y.; Wang, X.H.; Zong, Z.M. Extraction of organonitrogen compounds from five Chinese coals with methanol. Energ. Fuel 2009, 23, 4848–4851. [Google Scholar] [CrossRef]
  5. Wei, X.Y.; Wang, X.H.; Zong, Z.M.; Ni, Z.H.; Zhang, L.F.; Jia, Y.F.; Xie, K.C.; Lee, C.W.; Liu, Z.X.; Chu, N.B.; et al. Identification of organochlorines and organobromines in coals. Fuel 2004, 83, 2435–2438. [Google Scholar] [CrossRef]
  6. Schobert, H.H.; Song, C.S. Chemicals and materials from coal in the 21st century. Fuel 2002, 81, 15–32. [Google Scholar] [CrossRef]
  7. Schulten, H.R.; Marzec, A. Time- and temperature-resolved field ionization mass spectrometry of coals and their extracts. Fuel 1986, 65, 855–860. [Google Scholar] [CrossRef]
  8. Chen, B.; Wei, X.Y.; Zong, Z.M.; Yang, Z.S.; Qing, Y.; Liu, C. Difference in chemical composition of supercritical methanolysis products between two lignites. Appl. Energy 2011, 88, 4570–4576. [Google Scholar] [CrossRef]
  9. Luis, A.A.; Eduardo, E.W. Supercritical toluene and ethanol extraction of an Illinois No. 6 coal. Fuel 1984, 63, 227–238. [Google Scholar]
  10. Feng, L.; Liu, X.C.; Song, L.L.; Wang, X.H.; Zhang, Y.; Cui, T.W.; Tang, H.Y. The effect of alkali treatment on some physico-chemical properties of Xilinhaote lignite. Powder Technol. 2013, 247, 19–23. [Google Scholar] [CrossRef]
  11. Bergins, C. Mechanical/thermal dewatering of lignite. Part 2: A rheological model for consolidation and creep process. Fuel 2004, 83, 267–276. [Google Scholar] [CrossRef]
  12. Zhao, X.Y.; Zong, Z.M.; Cao, J.P.; Ma, Y.M.; Han, L.; Liu, G.F.; Zhao, W.; Li, W.Y.; Xie, K.C.; Bai, X.F.; et al. Difference in chemical composition of carbon disulfide extractable fraction between vitrinite and inertinite from Shenfu-Dongsheng and Pingshuo coal. Fuel 2008, 87, 565–567. [Google Scholar] [CrossRef]
  13. Zhou, G.; Wu, J.; Miao, Z.; Hu, X.; Li, X.; Shi, X.; Cai, Z.; Shang, Y. Effects of process parameters on pore structure of semi-coke prepared by solid heat carrier with dry destination. Int. J. Min. Sci. Technol. 2013, 23, 423–427. [Google Scholar] [CrossRef]
  14. Chen, H.; Li, J.W.; Zhao, L.; Ge, L.-M. Microwave-assisted extraction of Shenfu coal and its macromolecule structure. Mining Sci. Technol. 2009, 19, 19–24. [Google Scholar] [CrossRef]
  15. Qin, Z.H.; Jiang, C.; Hou, C.L.; Li, X.S.; Zhang, L.Y.; Chen, J.; Jiang, B. Solubilization of small molecules from coal and the resulting effects on the pore structure distribution. Min. Sci. Technol. 2009, 19, 761–768. [Google Scholar] [CrossRef]
  16. Xia, J.L.; Fan, X.; You, C.Y.; Wei, X.Y.; Zhao, Y.P.; Cao, J.P. Sequential ultrasonic extraction of a Chinese coal and characterization of nitrogen-containing compounds in the extracts using high-performance liquid chromatography with mass spectrometry. J. Sep. Sci. 2016, 39, 2491–2498. [Google Scholar] [CrossRef]
  17. Huang, Y.R.; Han, X.X.; Jiang, X.M. Comparison of fast pyrolysis characteristics of Huadian oil shales from different mines using Curie-point pyrolysis-GC/MS. Fuel Process Technol. 2014, 128, 456–460. [Google Scholar] [CrossRef]
  18. Li, Z.K.; Wei, X.Y.; Yan, H.L.; Zong, Z.M. Insight into the structural features of Zhaotong lignite using multiple techniques. Fuel 2015, 153, 176–182. [Google Scholar] [CrossRef]
  19. Sonibare, O.O.; Haeger, T.; Foley, S.F. Structural characterization of Nigerian coals by X-ray diffraction, Raman and FTIR spectroscopy. Energy 2010, 35, 5347–5353. [Google Scholar] [CrossRef]
  20. Chen, Y.; Mastalerz, M.; Schimmelmann, A. Characterization of chemical functional groups in macerals across different coal ranks via micro-FTIR spectroscopy. Int. J. Coal Geol. 2012, 104, 22–33. [Google Scholar] [CrossRef]
  21. Takagi, H.; Maruyama, K.; Yoshizawa, N.; Yamada, Y.; Sato, Y. XRD analysis of carbon stacking structure in coal during heat treatment. Fuel 2004, 83, 2427–2433. [Google Scholar] [CrossRef]
  22. Watanabe, I.; Sakanishi, K.; Mochida, I. Changes in coal aggregate structure by heat treatment and their coal rank dependency. Energy Fuels 2002, 16, 18–22. [Google Scholar] [CrossRef]
  23. Luque-Gareia, J.L.; Luque de Castro, M.D. Focused microwave-assisted Soxhlet extraction: devices and applications. Talanta 2004, 64, 571–577. [Google Scholar] [CrossRef] [PubMed]
  24. Parera, J.; Santos, F.J.; Galeeran, M.T. Microwave-assisted extraction versus Soxhlet extraction for the analysis of short-chain chlorinated alkanes in sediments. J. Chromatogr. A 2004, 1046, 19–26. [Google Scholar]
  25. Rostovshchikova, T.N.; Smirnov, V.V.; Kozhevin, V.M.; Yavsin, D.A.; Gurevich, S.A. Structurally organized nanocomposites in the catalysis of chlorohydrocarbon reactions. Kinet. Catal. 2003, 44, 555–561. [Google Scholar] [CrossRef]
  26. Liu, C.; Xue, H.; Shen, L.; Liu, C.; Zheng, X.; Shi, J.; Xue, S. Improvement of anthocyanins rate of blueberry powder under variable power of microwave extraction. Sep. Purif. Technol. 2019, 226, 286–298. [Google Scholar] [CrossRef]
  27. Zheng, X.; Xu, X.; Liu, C.; Sun, Y.; Lin, Z.; Liu, H. Extraction characteristics and optimal parameters of anthocyanin from blueberry powder under microwave-assisted extraction conditions. Sep. Purif. Technol. 2013, 104, 17–25. [Google Scholar] [CrossRef]
  28. Zuo, H.; Long, S.; Wang, C.; Zhang, P. A review of microwave treatment on coal. In 7th International Symposium on High-Temperature Metallurgical Processing; Springer: Cham, Switzerland, 2016; pp. 617–624. [Google Scholar]
Figure 1. FT-IR spectra obtained from the raw coal and the residues after extractions. (1) Raw coal. (2) Residues from the microwave-assisted extraction (MAE). (3) Residues from the Soxhlet extraction (SE). (4) Residues from the ultrasonic-assisted extraction (UAE).
Applsci 10 00494 g001
Figure 2. XRD spectra for the raw coal and the residues after extractions. (A) Raw coal. (B) The residues from the UAE. (C) The residues from SE. (D) The residues from the MAE.
Applsci 10 00494 g002
Figure 3. Total ion chromatogram (TIC) for the extract from the SE process.
Applsci 10 00494 g003
Figure 4. TIC of the extract by use of UAE. (a) TIC of 5–26 min; (b) TIC of 26–37 min.
Applsci 10 00494 g004
Figure 5. TIC for the extract obtained by the MAE process. (a) TIC of 5–30 min; (b) TIC of 30–43 min; (c) TIC of 43–55 min; (d) TIC of 55–65 min.
Applsci 10 00494 g005
Figure 6. Relative contents (RC) of the extracted substances according to the categories referred to Table 2.
Applsci 10 00494 g006
Table 1. Proximate and ultimate analyses of Daxing coal (wt.%).
Proximate AnalysisUltimate Analysis (daf)
MadAdVdafCHSNO a
1.3115.5230.8585.35.531.031.157.09
Note: a O is obtained by difference; Mad represents moisture content (air-dry basis); Ad represents ash content (dry basis); Vdaf represents volatile content (dry ash-free basis).
Table 2. Organic substances identified in the extracts from the coal samples with different extraction methods.
Number of Organic Species (Abbreviation) and Relative Content in %Extraction Method
SEMAEUAE
n-Alkanes (NAs)01 (1.19)0
Branched paraffin (BAs)1 (3.20)5 (7.99)3 (7.22)
Chlorinated organic compounds (COCs)8 (94.21)3 (13.12)5 (33.97)
Oxygen-containing organic compounds (OCOCs)1 (2.59)53 (39.50)13 (18.72)
Aromatic compounds (ACs)013 (38.19)16 (39.97)
Types of organic compounds107537

