Featured Application
Electric vehicles and battery management system.
Abstract
A low-cost programmable high-frequency alternating current (AC) electronic load for battery module diagnosis which possesses energy recycling and portability is proposed. The proposed AC electronic load consists of a micro-controller, a signal capturing circuit, and a resonant circuit, and can be integrated with a human–machine interface (HMI). To diagnose the dynamic characteristics of a lithium battery module, the proposed AC electronic load is served as a test load for providing a wide-range slew-rate loading function. In this study, the extracted energy from the tested battery module during the diagnostic process can be recycled to save energy. In addition, all of the battery module parameters and test conditions can be preset in the HMI, and the battery characteristics and the recycling rate of the electrical energy also can be estimated. Analysis of operation modes and simulations and some experimental results are used to verify the theoretical predictions.
1. Introduction
Due to energy waste and environmental damage, global warming is becoming more and more serious. Every country in the world is facing environmental pollution and oil shortages. Hence, electric vehicles that use batteries as power sources which do not emit exhaust gas to cause air pollution are gradually gaining importance in the market [1,2,3,4,5]. Based on these advantages, countries and major automakers all over the world are investing in the development and promotion of hybrid electric vehicles or electric vehicles. The battery module is the power source of electric vehicles and is one of the most essential components of electric vehicles because its capacity will determine the endurance of electric vehicles and its characteristics will determine their performance [6,7,8,9,10]. However, the price of battery modules is still high, accounting for a relatively high proportion of the overall cost, directly affecting the penetration rate of electric vehicles within the market. One of the reasons for the high price of battery modules is that their electrochemical properties are difficult to grasp. Nowadays, battery-related research, in addition to materials and electrochemical fields, generally includes monitoring of battery characteristics [1,2,3,4,5,6,7,8,9,10], design of battery management systems [11,12,13,14], estimation of state of charge [15,16,17,18,19,20], estimation of state of health [21,22,23,24,25,26], and so on.
The estimation of the state of charge (SOC) of the battery is currently a very important research topic [15,16,17,18,19,20]. In general, the state of charge is defined as the ratio of the current available battery capacity to the rated maximum available capacity, usually expressed as a percentage [18]. The most commonly seen conventional method today is to estimate the open circuit voltage method in conjunction with the Coulomb integral method. However, if the initial charge value determined by the open-circuit voltage method has an error with the actual SOC, the correctness of the calculation result will be affected [20]. In addition, the state of health (SOH) used to indicate the degree of battery aging is generally defined as the ratio of the maximum available capacity of the battery to the rated capacity, and is usually expressed as a percentage [21,22].
Nowadays, some research concentrates on SOC and SOH for power batteries, which is an important research topic [21,22,23,24,25,26] because the lithium battery is the most popular power source for electric vehicles (EVs). Yang et al. [23] has developed a battery testing system to capture the related information of the battery by a capturing circuit and a loading circuit which is used to release battery energy by various constant currents (CC). In fact, the loading characteristics of the aforementioned method cannot be recycled, and are totally different from the actual work conditions, which are really not just constant currents. In addition to the aforementioned power waste issue, other problems include inflexibility, expensiveness, and complexity. Currently, there are two battery test techniques that are widely used in industry applications. The simplest is to transfer the extracted electrical energy from the tested battery to the designated backup battery [24]. Additionally, the electrical energy extracted from the tested battery is converted into alternating current (AC) form and then returns to the power grid by connecting with an inverter [25]. However, this system is much more expensive and complicated.
The rechargeable battery is one kind of mobile energy storage device, and its applications range from consumer electronic products to the energy industry. As the battery number is increased in the energy storage equipment, the diagnosis of the battery is important and complex. In general, the battery diagnostics process includes at least two parts. First, the voltage, current, and temperature of all battery cells need to be detected and made sure to be normal. The second part concerns SOC/SOH, which are two critical performance indicators of batteries; many estimation techniques have been proposed in [11,12,13,14,15,16,17,18,19,20,21,22,23,24,25,26] for SOC/SOH. Battery diagnostic techniques can also be combined with chargers, battery analyzers, or monitoring equipment, and suitable diagnostic algorithms and interfaces can be applied according to the type of battery to fully to grasp the electrical characteristics of the battery.
Recently it has been recognized that in order to obtain dynamic characteristics for calculating the SOC/SOH of a power battery and to recycle the extracted electrical energy from a tested power battery, a programmable AC electronic load is essential to emulate a variety of dynamic load behaviors, and sequence control is also required [27,28,29,30]. In this paper, a proposed programmable high-frequency AC electronic load is utilized to improve the aforementioned drawbacks and to achieve a dedicated function. The extracted energy from the test battery module can almost be returned to the test battery after ending the test procedure. Moreover, the estimation of SOC/SOH is based on the method previously mentioned [26] to obtain an accurate valuation.
2. Hardware Description of the Proposed Battery Diagnostic System
Figure 1 depicts the circuit architecture of the proposed diagnostic system, which consists of a modified class E resonant circuit, a micro-controller (MCU: dsPIC33FJ64GS606), a USB(universal serial bus) UART (universal asynchronous receiver/transmitter) module (FT-232), an auxiliary power circuit, a signal (voltage, current, and temperature) capturing circuit, and a DC (direct current) level offset circuit. In this study, the modified class E resonant circuit is a key part of the proposed electronic load, which can provide a high-frequency sinusoidal current via the resonant technique in order to simulate the practical work conditions for catching the related characteristics of the battery module. The MCU shown in Figure 1 not only provides the gating signal of the MOSFET (metal-oxide-semiconductor field-effect transistor) in the class E resonant circuit but also receives all the sensed signals by the capturing circuit and then communicates with the human–machine interface (HMI) via the USB UART module (FT-232). The HMI is used to preset test conditions and display the tested results, including battery module parameters, battery protection conditions, baud rate, and SOC/SOH.
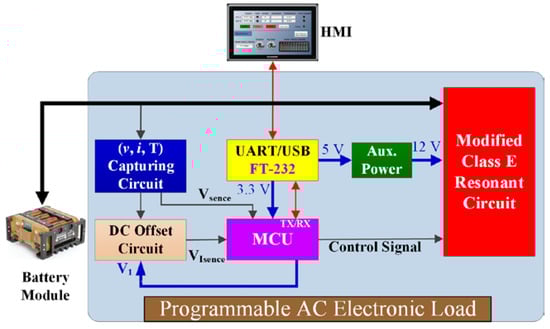
Figure 1.
Circuit architecture of the proposed high-frequency alternating current (AC) electronic load for lithium battery module. Legend: HMI, human–machine interface; MCU, micro-controller.
The most important feature of the proposed high-frequency AC load is that the energy extracted from the battery module during the diagnostic process can be recycled. When the diagnostic process begins, the battery module is connected to the modified class E resonant circuit to discharge with a resonant-type current. During the diagnostic process interval, the capturing circuit can detect some dynamic characteristic parameters of the battery module to calculate the corresponding SOC/SOH. Moreover, the proposed AC electronic load can provide sinusoidal load current, and the direction of the load current drawn from the battery module will be reversed when the positive semi-cycle ends. After the sinusoidal load current reverses into the negative semi-cycle, the original load current can charge the battery module along the original path based on the resonant characteristic of the modified class E resonant circuit. In other words, if all the component impedances can be ignored, there is almost no energy loss during the battery module test process. As shown in Figure 1, the modified class E resonant circuit plays a critical role within the proposed system. In practice, the proposed high-frequency AC electronic load can be used to generate a periodic load current which has wide slope variations from positive to negative infinity for the battery module test. Furthermore, the sinusoidal load is capable of supplying a dynamic load current within the positive semi-cycle for diagnosing battery characteristics and recycling the extracted energy within the negative semi-cycle. In order to provide such a load current, a modified class E topology is adopted as the main circuit of the sinusoidal load. The MCU is the control core of the system which can output the corresponding PWM (pulse width modulation) signal to drive the modified class E resonant circuit according to the test conditions, where the test conditions are preset in the HMI. Then, both the capturing values and the calculated values such as SOC/SOH will be displayed in real-time.
The high-frequency AC electronic load can generate a bidirectional sinusoidal load current. The wide slope variation characteristics of the sinusoidal waveform can be used to estimate the dynamic parameters of the battery module; hence, the ∆V and ∆I from the battery module can be obtained in the test operation and the dynamic impedance value (∆V/∆I) can be calculated. The dynamic impedance value can be used to estimate the SOC/SOH of the battery [26]. This method is different from the traditional EIS (electrochemical impedance spectroscopy) technique [31] because it does not need to specify an operating frequency or complicated circuit model. Because the calculation method is simple, it is easy to realize real-time estimation, and the test procedures can be arranged through the HMI in accordance with practical test requirements.
3. Model Analysis of the AC Electronic Load
The proposed low-cost AC electronic load was developed from a class E topology and includes two inductors, two capacitors, and a power switch, as shown in Figure 2a, where the tested battery module is used as the voltage source Vs. To generate the required bidirectional loading behavior, a modified class E circuit structure is employed. Moreover, the load resistance RL can be shorted to reduce the power loss, and C1, C2, and L2 can be integrated, becoming a capacitive component C under a specific frequency. After the modification and simplification, it is possible to obtain an equivalent circuit, as shown as Figure 2b. To approximate the practical work situations and to achieve portable design, a single switch circuit topology is employed to generate a high-frequency load current. A parasitic capacitance model was also considered, as shown in Figure 2c. The switching frequency fs of the sinusoidal load is varied to adjust to the load current amplitude. Based on the above design, the input inductor current iL is almost a symmetric waveform in each half-cycle. The key waveforms of the proposed sinusoidal load in a switching period are depicted in Figure 3. The circuit operation in a switching period is divided into five modes, and the equivalent circuit and the Laplace transform circuit of each mode are illustrated in Figure 4, Figure 5, Figure 6, Figure 7 and Figure 8.
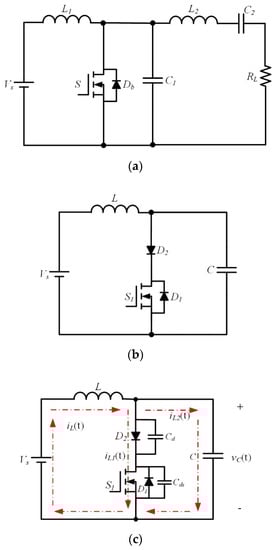
Figure 2.
The main circuit evolution of the sinusoidal load: (a) the original class E topology; (b) the equivalent circuit; and (c) the equivalent circuit with a parasitic capacitance model.
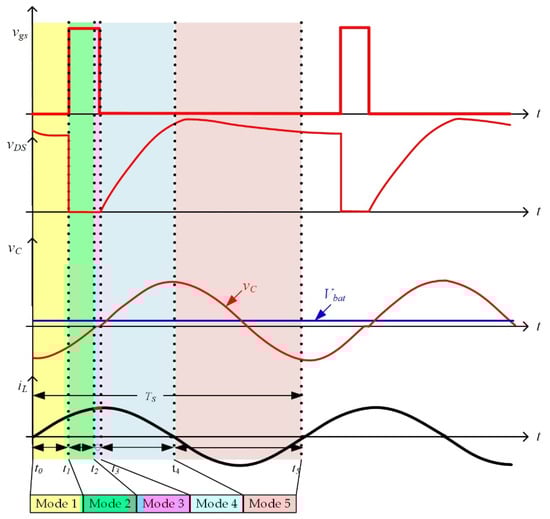
Figure 3.
The key waveforms of the sinusoidal load in a switching period.
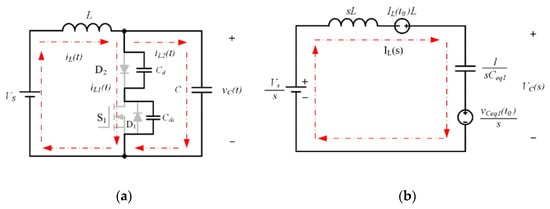
Figure 4.
Mode 1 principle: (a) the equivalent circuit; (b) the Laplace transform circuit.
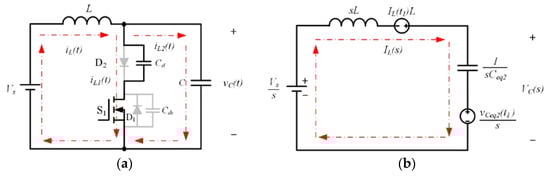
Figure 5.
Mode 2 principle: (a) the equivalent circuit; (b) the Laplace transform circuit.
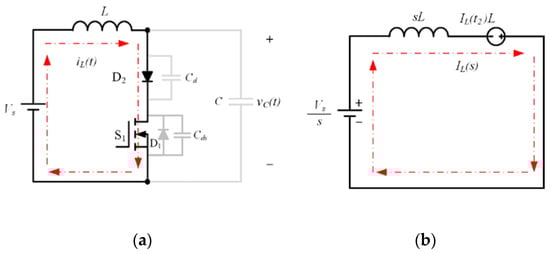
Figure 6.
Mode 3 principle: (a) the equivalent circuit; (b) the Laplace transform circuit.
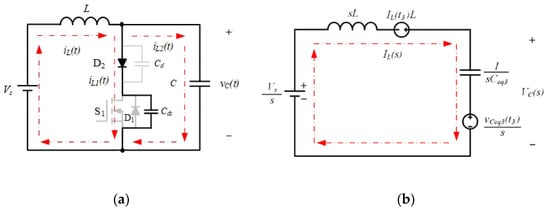
Figure 7.
Mode 4 principle: (a) the equivalent circuit; (b) the Laplace transform circuit.
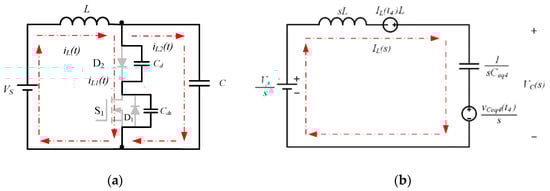
Figure 8.
Mode 5 principle: (a) the equivalent circuit; (b) the Laplace transform circuit.
Mode 1: [t0–t1]
In this mode, both switch S1 and diode D2 are turned off. Assuming the initial value iL(t0) = 0, resonant components include the resonant inductor L and the junction capacitance Cd, the parasitic capacitance Cds, and the resonant capacitor C. The equivalent circuit is shown in Figure 4a and the corresponding Laplace transform circuit in Figure 4b.
By the inverse Laplace transformation, we can obtain the inductor current iL(t) and vC(t) as
where
When t = t1, the switch S1 is turned on at this moment to end this mode.
Mode 2: [t1–t2]
At t = t1, the switch is turned on and the resonant capacitor’s voltage is still at a negative value, that is to say, the diode D2 is also turned off. Figure 5a,b depict the equivalent circuit and the Laplace transform circuit, respectively.
By the inverse Laplace transformation, we can obtain the inductor current iL(t) and vC(t) as
where
When t = t2, the resonant capacitor’s voltage vC(t) rises to zero, and this mode is ended.
Mode 3: [t2–t3]
During this mode, the resonant capacitor’s voltage rises higher than zero, the diode D2 is conducted, and the switch S1 is still turned on. Then, the resonant inductor L is magnetized by the voltage source Vs. Thus, iL(t) rises linearly and the electrical energy is stored in L. Figure 6a,b depict the equivalent circuit and the Laplace transform circuit, respectively.
From Figure 6b, we can obtain the equations
By the inverse Laplace transformation, we can obtain the inductor current iL(t) as
When the switch S1 is turned off, this mode is ended.
Mode 4: [t3–t4]
In this mode the switch S1 is turned off, the resonant capacitor’s voltage vC(t) reaches zero, and the inductor current iL(t) rises to a positive value. Hence, the diode D2 maintains its on status and the resonant inductor L resonates with Cds and C. Figure 7a,b depict the equivalent circuit and the Laplace transform circuit, respectively.
By the inverse Laplace transformation, we can obtain the inductor current iL(t) and vC(t) as
where
When t = t4, the resonant inductor current iL(t) decreases to zero and this mode is ended.
Mode 5: [t4–t5]
Within the last mode, the resonant inductor current iL(t) decreases to zero and the diode D2 is turned off. Thus, the resonant inductor L resonates with Cd, Cds, and C. Figure 8b shows the equivalent circuit and the Laplace transform circuit, respectively.
By the inverse Laplace transformation, we can obtain the inductor current iL(t) and vC(t) as
where
When t = t5, the resonant inductor current iL(t) resonates to zero, this mode is ended, and a complete cycle analysis is finished.
Figure 9 shows the implemented HMI, which is programmed by C# based on Visual Studio. Within the HMI the user can enter all of the battery information and preset related protection conditions, and the HMI can display the monitoring parameters V, I, and T and the estimation value (e.g., SOC/SOH) of the tested battery module. Within the HMI the user can program the test conditions under various C rates. The preset test conditions include three durations; the user can set an independent C rate loading current in each duration to simulate practical work conditions. After obtaining the dynamic parameters, including ∆V and ∆I, from the sensed battery data (V and I), the SOC/SOH can then be estimated by the algorithm proposed in [26]. Figure 10 shows a detailed flowchart of the proposed diagnostic procedure used to conduct system integration and management. Hence, the diagnostic information can be displayed in real-time in the HMI when the battery parameters and test conditions are set completely.
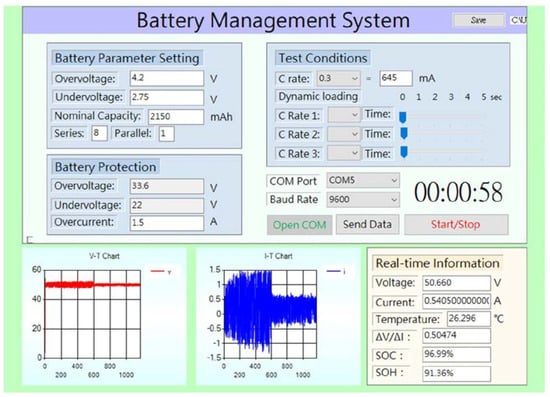
Figure 9.
The proposed diagnostic system interface for the lithium battery module.
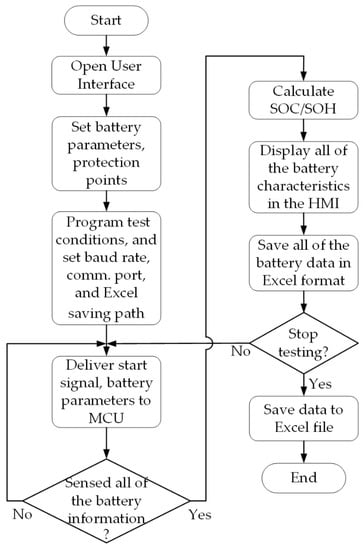
Figure 10.
Flowchart of the proposed diagnostic procedure.
4. Design Considerations
The key parameters of the proposed AC electronic load are listed in Table 1, where the lithium ion battery module has a 6S1P (6 series 1 parallel) configuration with a 2500 mAh capacity. To achieve the desired programmed AC loading characteristics with energy recycling, some component values should be selected or determined, including the resonant capacitor, resonant inductor, and duty cycle. The related design considerations are described below.

Table 1.
Related parameters of the main circuit.
(1) Determine the characteristic impedance
In one of the boundary test conditions in this work the minimum load current is set as iLmin = 0.2C = 500 mA and the maximum battery module voltage VBmin = 25.2 VDC. Thus, when the resonant circuit is under a resonant status, we can determine the maximum characteristic impedance as below.
(2) Select the resonant capacitance
Equation (34) can be rewritten as
Moreover, from Table 1, the resonant frequency is set as fr = 38.6 kHz, meaning the resonant frequency can be expressed as
Thus, the resonant capacitance can be obtained as
(3) Calculate the resonant inductance
From Equation (35), the resonant inductance also can be calculated as
(4) Estimate the duty cycle
The objective of the proposed AC electronic load is used to generate a load current close to positive and negative symmetry, i.e., the entire resonance behavior must be completed in one switching cycle (in other words, fs ≤ fr). When ignoring the errors and losses caused by all components, in the ideal case the resonant frequency fr will be equal to the switching frequency fs.
To provide sufficient energy to resonate continuously for the main circuit, the power switch of the resonant circuit must have sufficient conduction time. However, if this value is too large it will cause a positive and negative half-cycle asymmetry, which will reduce the energy recovery rate. The aforementioned description can be expressed as
where Dmax is the maximum duty cycle of the power switch.
Equation (39) can be rewritten, and we can obtain Dmax as
According to Table 1, the selected switching frequency fs ranges 33.5 kHz to 38.6 kHz, and when substituting into (40), the maximum duty cycle Dmax = 13.2%.
5. Simulations and Experimental Results
In this study a 6S1P lithium battery module serves as a test target to verify the theoretical feasibility. In actuality, the practical loading current of the power battery is neither periodic nor predictable. Hence, it is not easy to simulate the load current of the power battery for an online test. Due to the inherent wide-range slew-rate characteristics of a sinusoidal current waveform, it is suitable to use this waveform to demonstrate the related experimentations. Figure 11 shows the simulated and measured load current waveforms of the AC electronic load under C rate = 0.2 C. All the simulations and experimental results reveal that sinusoidal current waveforms are as previously predicted. When the C rate is changed to 1 C, the simulations and measurement results are demonstrated in Figure 12. It is obvious that the simulations and measurement results are quite consistent.
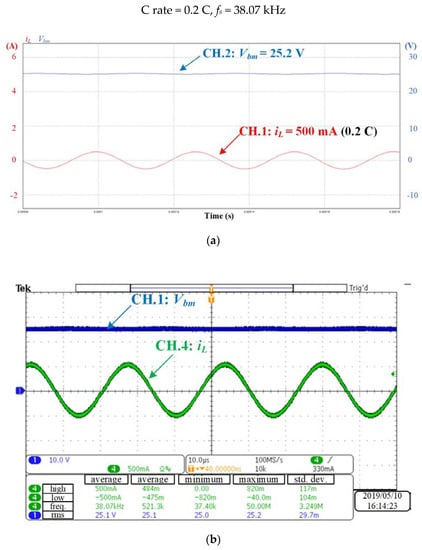
Figure 11.
Measured and simulated waveforms of the proposed sinusoidal load under C rate = 0.2 C: (a) simulated waveforms; (b) measured waveforms.
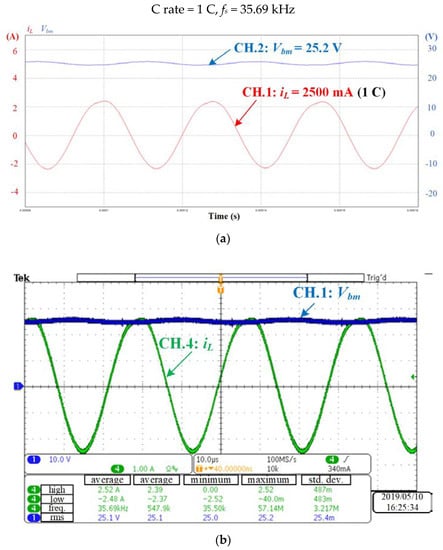
Figure 12.
Measured and simulated waveforms of the proposed sinusoidal load under C rate = 1 C: (a) simulated waveforms; (b) measured waveforms.
In practical work situations the battery module voltage will decrease with load consumption. To maintain the preset load current amplitude, variable frequency control is used to modulate the current amplitude of the sinusoidal load. Figure 13 demonstrates that the load current amplitude of the proposed sinusoidal load is still maintained at the preset value, even if the battery module voltage is lower.
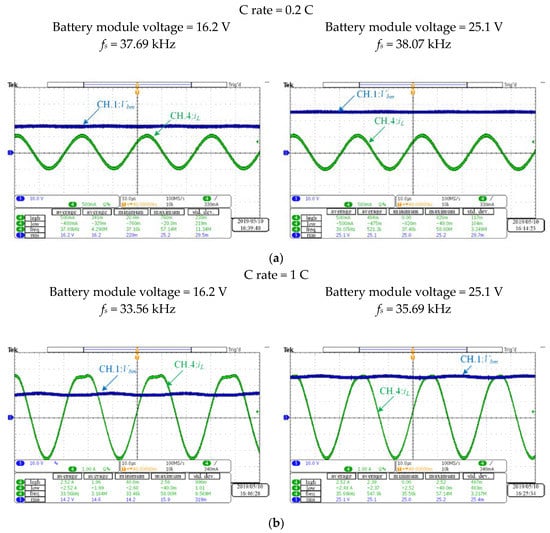
Figure 13.
A comparison between the minimum battery module voltage and maximum battery module voltage under various load conditions: (a) C rate = 0.2 C; (b) C rate = 1 C.
Finally, from integrating the area of the load current waveforms, the energy recycling rate can be calculated. In fact, it is clear that the areas of the positive and negative semi-cycles are different, i.e., the energy drawn from the battery during the test procedure cannot be recycled completely. In addition, although the proposed system has the function of energy recycling when the AC electronic load operates in each operation mode under different operating conditions, the current will cause power consumption when passing through each component, and this consumption cannot be recycled. In general, the Coulomb integral method can be adopted to calculate the SOC by measuring the battery current and integrating it in time. The proposed high-frequency AC electronic load provides a sinusoidal load current, and therefore, the SOC in the positive and negative half cycles can be calculated by the Coulomb integral method to estimate the energy recycling rate. In fact, during the test procedure, the load current will result in some power loss within the battery internal resistances, resonant components, and loop impedances; the energy therefore cannot be recycled completely during the battery module test. In order to accurately calculate the energy recycling rate, we first use the current probe and oscilloscope to capture the actual current waveform of the battery module. Secondly, all the acquired data is transferred to an Excel format file and the areas of the positive semi-cycle and the negative semi-cycle are calculated by using an Excel function. Ideally, energy can be completely recovered; in fact, each component on the electronic load will have some power loss, and the recycling rate will not be the same under different test conditions. In Figure 14a, when the C rate is set as 0.2C, the integration value of the positive semi-cycle Q1 is 442.5 μcoulombs and the integration value of the negative semi-cycle Q2 is 380.1 μcoulombs; i.e., the energy recycling rate is η = 85.9%. However, if the C rate is increased to 1C, the integration value of the positive semi-cycle Q1 is 1210.5 μcoulombs, and the integration value of the negative semi-cycle Q2 is 925.4 μcoulombs; hence, the energy recycling rate is reduced to η = 76.5%, as shown in Figure 14b. It is apparent that most of the unrecyclable energy is consumed on circuit components and results in power losses. Although the proposed sinusoidal electronic load cannot recycle all of the drawn energy from the battery module, it is still superior to the traditional battery tester in terms of cost and system construction. Figure 15 shows a comparison for the energy recycling rate under various test conditions.
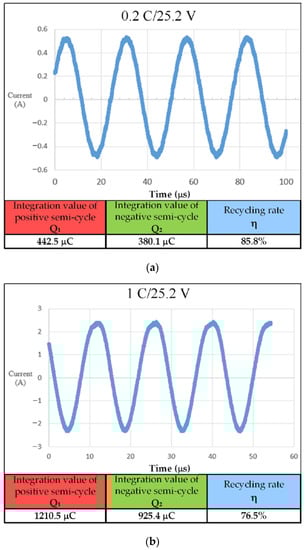
Figure 14.
Calculation of energy recycling rate under various load conditions: (a) C rate = 0.2 C; (b) C rate = 1 C.
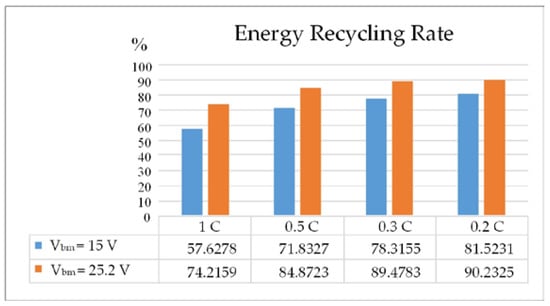
Figure 15.
The energy recycling rate under various test conditions.
Another important feature of this study is that it attempts to provide a programmable varying load. It is easy to program the amplitude and duration of the loading current via the implemented HMI. Figure 16 shows an example of measured loading current waveforms which can be applied to evaluate the dynamic characteristics of the lithium battery module. There are three different time intervals in the measured waveform, and different load currents of different C rates can be set separately. The user can preset the aforementioned parameters within the HMI as needed. With regard to the capturing circuit, some parameters of the tested battery module can be obtained to infer the battery module status. Figure 17 shows the experiment setup of the proposed system.
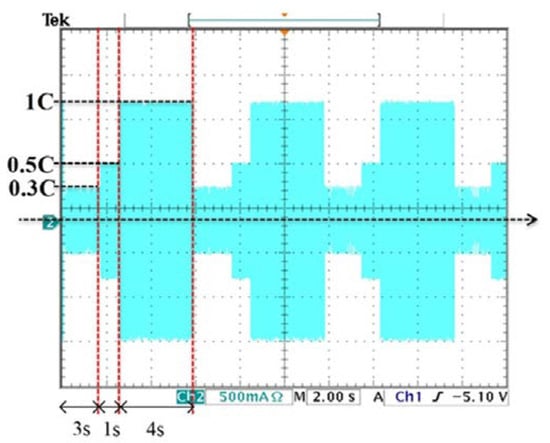
Figure 16.
The measured loading current waveforms of the proposed high-frequency AC electronic load using the programmable function.
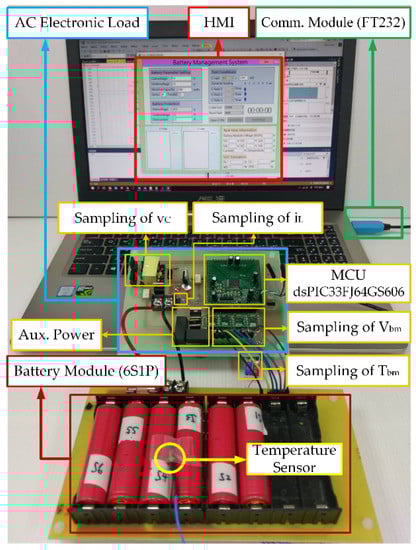
Figure 17.
Photographs of the experiment setup.
6. Conclusions
In this work, a high-frequency AC electronic load for lithium battery module tests based on the sinusoidal loading technique has been designed and implemented. The proposed AC electronic load provides a wide-range slew-rate loading current for approaching practical work situations and recycles the extracted energy every cycle without any additional grid-tied equipment or backup battery. Thus, this system exhibits compact topology and low cost, and works under conditions which are closer to real work conditions. Finally, the recycling rate of electrical energy during the test procedure has been verified by the experimental results of this work. It is also easy to embed any estimation algorithm to diagnose the SOC/SOH of lithium batteries using the proposed system.
Author Contributions
Conceptualization, C.-H.L. and K.-J.P.; methodology, C.-H.L.; software, K.-C.C.; validation, K.-C.C.; formal analysis, K.-C.C.; investigation, K.-J.P.; resources, K.-F.C.; data curation, K.-C.C.; writing—original draft preparation, C.-H.L.; writing—review and editing, C.-H.L.; project administration, K.-F.C.; funding acquisition, K.-F.C. All authors have read and agreed to the published version of the manuscript.
Funding
This research was funded by the Ministry of Science and Technology, Taiwan, R.O.C., grant number MOST 106-2221-E-011-094-MY3, and by the National Chung-Shan Institute of Science and Technology, grant number NCSIST-104-V409 (107).
Acknowledgments
The authors sincerely appreciate the support provided by the Taiwan Building Technology Center from The Featured Areas Research Center Program within the framework of the Higher Education Sprout Project of the Ministry of Education of Taiwan.
Conflicts of Interest
The authors declare no conflict of interest.
References
- Chaoui, H.; Christopher, C. State of charge and state of health estimation for lithium batteries using recurrent neural networks. IEEE Trans. Veh. Technol. 2017, 66, 8773–8783. [Google Scholar] [CrossRef]
- Nobile, G.; Scarcella, G. Real-rime model-based estimation of SOC and SOH for energy storage systems. IEEE Trans. Power Electron. 2017, 32, 794–803. [Google Scholar]
- Mukherjee, N.; De, D. A new state-of-charge control derivation method for hybrid battery type integration. IEEE Trans. Energy Convers. 2017, 32, 866–875. [Google Scholar] [CrossRef]
- Xiong, R.; Sun, F.; Gong, X.; He, H. Adaptive state of charge estimator for lithium-ion cells series battery pack in electric vehicles. J. Power Sour. 2013, 242, 699–713. [Google Scholar] [CrossRef]
- Adany, R.; Aurbach, D.; Kraus, S. Switching algorithms for extending battery life in electric vehicles. J. Power Sour. 2012, 231, 50–59. [Google Scholar] [CrossRef]
- Chaoui, H.; Mejdoubi, A.; Gualous, H. Online parameter identification of lithium-ion batteries with surface temperature variations. IEEE Trans. Veh. Technol. 2017, 66, 2000–2009. [Google Scholar] [CrossRef]
- Yuan, H.; Dung, L. Offline state-of-health estimation for high-power lithium-ion batteries using three-point impedance extraction method. IEEE Trans. Veh. Technol. 2017, 66, 2019–2032. [Google Scholar] [CrossRef]
- Bartlett, A.; Marcicki, J.; Onori, S.; Rizzoni, G.; Yang, X.; Miller, T. Electrochemical model-based state of charge and capacity estimation for a composite electrode lithium-ion battery. IEEE Trans. Control. Syst. Technol. 2016, 24, 384–399. [Google Scholar] [CrossRef]
- Cui, Y.; Shi, J.; Wang, Z. Quantum assimilation-based state-of-health assessment and remaining useful life estimation for electronic systems. IEEE Trans. Ind. Electron. 2016, 63, 2379–2390. [Google Scholar] [CrossRef]
- Frost, D.; Howey, D. Completely decentralized active balancing battery management system. IEEE Trans. Power Electron. 2018, 33, 729–738. [Google Scholar] [CrossRef]
- Elsayed, A.; Lashway, C.; Mohammed, O. Advanced battery management and diagnostic system for smart grid infrastructure. IEEE Trans. Smart Grid. 2016, 7, 897–905. [Google Scholar]
- Din, E.; Schaef, C.; Moffat, K.; Stauth, J. A scalable active battery management system with embedded real-time electrochemical impedance spectroscopy. IEEE Trans. Power Electron. 2017, 32, 5688–5698. [Google Scholar] [CrossRef]
- Barreras, J.; Fleischer, C.; Christensen, A.; Swierczynski, M.; Schaltz, E.; Andreasen, S.; Sauer, D. An advanced HIL simulation battery model for battery management system testing. IEEE Trans. Ind. Appl. 2016, 52, 5688–5698. [Google Scholar] [CrossRef]
- Chen, C.; Wang, D.; Li, J. A voltage monitoring IC with HV multiplexer and HV transceiver for battery management systems. IEEE Trans. Very Larg. Scale Integr. (VLSI) Syst. 2015, 23, 244–253. [Google Scholar] [CrossRef]
- Li, W.; Liang, L.; Liu, W.; Wu, X. State of charge estimation of lithium-ion batteries using a discrete-time nonlinear observer. IEEE Trans. Ind. Electron. 2017, 64, 8557–8565. [Google Scholar] [CrossRef]
- Xu, Q.; Xiao, J.; Wang, P.; Pan, X.; Wen, C. A decentralized control strategy for autonomous transient power sharing and state-of-charge recovery in hybrid energy storage systems. IEEE Trans. Sustain. Energy 2017, 8, 1433–1452. [Google Scholar] [CrossRef]
- Xiong, B.; Zhao, J.; Su, Y.; Wei, Z.; Skyllas-Kazacos, M. State of charge estimation of vanadium redox flow battery based on sliding mode observer and dynamic model including capacity fading factor. IEEE Trans. Sustain. Energy 2017, 8, 1658–1667. [Google Scholar] [CrossRef]
- Maharjan, L.; Inoue, S.; Akagi, H.; Asakura, J. State-of-charge (SOC)-balancing control of a battery energy storage system based on a cascade PWM converter. IEEE Trans. Power Electron. 2009, 24, 1628–1636. [Google Scholar] [CrossRef]
- Sheng, H.; Xiao, J.; Wang, P. Lithium iron phosphate battery electric vehicle state-of-charge estimation based on evolutionary gaussian mixture regression. IEEE Trans. Ind. Electron. 2017, 64, 544–551. [Google Scholar] [CrossRef]
- Hua, X.; Li, S.; Peng, H.; Sun, F. Robustness analysis of State-of-charge estimation methods for two types of Li-ion batteries. J. Power Sour. 2012, 217, 209–219. [Google Scholar] [CrossRef]
- Andre, D.; Appel, C.; Soczka-Guth, T.; Sauer, D. Advanced mathematical methods of SOC and SOH estimation for lithium-ion batteries. J. Power Sour. 2012, 224, 20–27. [Google Scholar] [CrossRef]
- Feng, X.; Li, J.; Ouyang, M.; Lu, L.; Li, J.; He, X. Using probability density function to evaluate the state of health of lithium-ion batteries. J. Power Sour. 2013, 232, 209–218. [Google Scholar] [CrossRef]
- Yang, C.; Lo, H.; Chui, H. Switching-mode battery test system. In Proceedings of the 2014 International Symposium on Computer, Consumer and Control, Taichung, Taiwan, 10–12 June 2014; pp. 605–608. [Google Scholar]
- Hwu, K.; Yau, Y. Active load for burn-in test of buck-type DC-DC converter with ultra-low output voltage. In Proceedings of the 2008 Twenty-Third Annual IEEE Applied Power Electronics Conference and Exposition, Austin, TX, USA, 24–28 February 2008; pp. 635–638. [Google Scholar]
- Ma, H.; Guo, Q.; Han, X.; Chen, L. Energy recycling load system with a high gain DC-DC converter for ultra low voltage power supplies. In Proceedings of the 2013 IEEE International Symposium on Industrial Electronics, Taipei, Taiwan, 28–31 May 2013; pp. 1001–1006. [Google Scholar]
- Hung, M.; Lin, C.; Lee, L.; Wang, C. State-of-charge and state-of-health estimation for lithium-ion batteries based on dynamic impedance technique. J. Power Sour. 2014, 268, 861–873. [Google Scholar] [CrossRef]
- Vazquez, R.; Olias, E.; Lazaro, A.; Barrado, A.; Pleite, J. Implementation of a loss-free programmable AC load. In Proceedings of the 24th Annual Conference of the IEEE Industrial Electronics Society (Cat. No.98CH36200), Aachen, Germany, 31 August–4 September 1998; pp. 630–635. [Google Scholar]
- She, X.; Zou, Y.; Wang, C.; Lin, L.; Tang, J.; Chen, J. Research on power electronic load: Topology, modeling, and control. In Proceedings of the 2009 Twenty-Fourth Annual IEEE Applied Power Electronics Conference and Exposition, Washington, DC, USA, 15–19 February 2009; pp. 1661–1666. [Google Scholar]
- Zhaoxia, A.; Xudong, B.; Fen, C.; Yunping, D.; Li, E. A novel filter for harmonics and inter-harmonics analysis and suppression in AC electronic load. In Proceedings of the 8th International Conference on Power Electronics-ECCE Asia, Jeju, Korea, 30 May–3 June 2011; pp. 770–777. [Google Scholar]
- Geng, Z.; Gu, D.; Hong, T.; Czarkowski, D. Programmable electronic AC load based on a hybrid multilevel voltage source inverter. IEEE Trans. Ind. Appl. 2018, 54, 5512–5522. [Google Scholar] [CrossRef]
- Wang, Q.; He, Y.; Shen, J.; Hu, X.; Ma, Z. State of charge-dependent polynomial equivalent circuit modeling for electrochemical impedance spectroscopy of lithium-ion batteries. IEEE Trans. Power Electron. 2018, 33, 8449–8460. [Google Scholar] [CrossRef]


© 2020 by the authors. Licensee MDPI, Basel, Switzerland. This article is an open access article distributed under the terms and conditions of the Creative Commons Attribution (CC BY) license (http://creativecommons.org/licenses/by/4.0/).