Article

Estimation of Thermal Diffusivity for Greenhouse Soil Temperature Simulation

1
Key Laboratory of Modern Agricultural Equipment and Technology, Ministry of Education and Jiangsu Province, School of Agricultural Equipment Engineering, Jiangsu University, Zhenjiang 212013, China
2
Department of Food, Agricultural and Biological Engineering, Ohio State University, Wooster, OH 44691, USA
*
Author to whom correspondence should be addressed.
Appl. Sci. 2020, 10(2), 653; https://doi.org/10.3390/app10020653
Submission received: 15 December 2019 / Revised: 8 January 2020 / Accepted: 10 January 2020 / Published: 16 January 2020
(This article belongs to the Section Environmental Sciences)

Abstract

:
In greenhouse energy balance models, the soil thermal parameters are important for evaluating the heat transfer between the greenhouse air and the soil. In this study, the soil thermal diffusivity was estimated from greenhouse soil temperature data using the amplitude, phase-shift, arctangent, logarithmic, and min-max methods. The results showed that the amplitude method and the min-max method performed well in estimating the soil thermal diffusivity. The obtained soil thermal diffusivity was input into a sinusoidal model to determine the greenhouse soil temperature at different soil depths. For greenhouse applications, the daily average soil temperature at different depths was predicted according to the temperature at the surface and the annual mean soil temperature. The model was validated using soil temperature data from summer and winter, when the greenhouse was cooled and heated, respectively.

1. Introduction

Collecting excess daytime solar energy to heat a greenhouse at night is an economic approach to conserve greenhouse energy consumption. Solar radiation is captured by the soil during the daytime and released at nighttime to warm the greenhouse air. To better understand the heat transfer mechanisms between the soil and the greenhouse air, studying the thermal transfer capacity of the greenhouse soil is desirable [1,2]. In this study, the two most important soil thermal properties are the heat transfer coefficients between the floor and the greenhouse air, as well as between the floor surface and the greater ground depths [3,4,5,6].
The response to temperature changes in the soil is often not instantaneous due to the large soil heat capacity. To study the time delay, researchers have often used soil temperature data to estimate the thermal diffusivity. Horton and Wierenga (1983) estimated soil thermal diffusivities based on measured soil temperature data using six different methods (the amplitude, phase-shift, arctangent, logarithmic, numerical, and harmonic methods). The calculated apparent thermal diffusivities were then used to predict the soil temperatures before they were compared to another set of measured temperatures [7]. On the other hand, Ozgener et al. (2013) used the principle of transient heat flow with assumptions of one-dimensional heat flow, homogeneous soil, and constant thermal diffusivity to predict the daily soil temperatures depending on depth and time. Their efforts resulted in establishing a model for soil temperature prediction as a function of depth [8]. Danelichen et al. (2013) estimated the soil thermal diffusivity from the soil temperature profile using the amplitude, logarithmic, arctangent, and phase-shift methods. The estimated soil thermal diffusivities showed significant differences and varied over the study period as a function of the volumetric soil water content [9]. Additionally, Li et al. (2014) used the harmonic method and the temperature integral method to determine soil heat storage and energy balance in arid and semiarid regions [10].
Furthermore, the residual effects of dissimilar management on the temporal variability and covariance structure of the soil temperature was reported by Awe et al. (2015) [11], and An et al. (2016) [12] used the amplitude, phase-shift, conduction–convection, and harmonic methods to estimate the thermal diffusivity under different climatic conditions in the subsurface layers. Yener et al. (2017) investigated the soil temperatures at different depths in several regions of Turkey. They used a sinusoidal prediction model for the soil temperatures based on the depth and time to describe the annual soil temperature variations in different regions of Turkey [13].
The boundary conditions of open-field soil and the soil underneath a greenhouse are different. Evaluations of the open-field soil thermal diffusivity assume that the soil is a one-dimensional isotropic medium and that the average soil temperature is the same at all depths. Conversely, the soil temperature in a greenhouse always has a thermal gradient. In a greenhouse, the soil surface is enclosed, and its temperature is different from that of the outside air, although at a certain depth (i.e., the constant-temperature layer), the soil temperature underneath a greenhouse will be the same as that of the outdoor soil. In this research, we focused on estimating the local heat transfer in the soil underneath a greenhouse above the constant-temperature layer. Various methods were employed to estimate the greenhouse soil thermal diffusivity and to determine the soil temperature at various depths.

2. Materials and Methods

2.1. Theory of Soil Temperature Simulation

Soil heat transfer occurs mainly via molecular transmission. In this study, the soil was assumed to be infinitely deep, and heat transfer occurred in a one-dimensional isotropic medium. With uniform thermal properties, the open-field soil surface temperature can be calculated by [14]
T ( 0 , t ) = T a v e ( 0 ) + A ( 0 ) sin [ ω t ϕ ]
where T ( 0 , t ) is the temperature at the soil surface at time t, °C
  • t is the time of day, h;
  • T a v e ( 0 ) is the average temperature at the soil surface, °C;
  • A ( 0 ) is the amplitude of the soil surface temperature fluctuation, °C;
  • ϕ is the phase shift, the delay of soil surface temperature change at soil surface, h;
  • ω is the radial frequency and is expressed as
    ω = 2 π τ
    where τ is the period of temperature fluctuation and is set to 24 h.
From Equation (1a), the temperature at any depth z and time t is given by:
T ( z , t ) = T a v e ( z ) + A ( z ) sin [ ω t ϕ ϕ z ]
where A ( z ) is the amplitude of the soil temperature fluctuation at depth z , °C
  • T a v e ( z ) is the average temperature at the soil depth z , °C;
  • ϕ z is the soil thermal transfer phase shift, the delay between the soil surface and depth z ;
  • A ( z ) and ϕ z are defined as [8]
A ( z ) = A ( 0 ) exp ( zB )
ϕ z = zB
where B is the inverse of the damping depth, and it is calculated by:
B = ω / 2 k
where k is the soil thermal diffusivity, m2 s−1, and it is calculated by:
k = λ / ρ c
where λ is the soil thermal conductivity (w m−1 K−1)
  • ρ is the density of the soil, kg m−3
  • c is the soil specific heat, J kg1 K−1
  • ρ c is the volumetric heat capacity, J m−3 K−1
Similarly, the soil temperature at depth z 2 can be calculated from the soil temperature at depth z 1 as follows:
T ( z 2 , t ) = T a v e ( z 2 ) + A ( z 2 ) sin [ ω t ϕ ϕ z 1 ϕ z 2 z 1 ]
With the boundary conditions at the surface ( z = 0) and substituting of Equations (3) and (4) into Equation (2), the soil temperature at any depth z and time t can be calculated by:
T ( z , t ) = T a v e ( z ) + A ( 0 ) exp ( zB ) sin [ ω t ϕ zB ]
In addition, the soil temperature at depth z 2 predicted from the soil temperature at depth z 1 can be calculated by:
T ( z 2 , t ) = T a v e ( z 2 ) + A ( z 1 ) exp ( z 2 B ) sin [ ω t ϕ ϕ z 1 ( z 2 z 1 ) B ]
The soil thermal diffusivity needed to calculate the inverse of damping depth ( B ) can be determined using one of the three methods discussed in the following section.

2.2. Soil Thermal Diffusivity Estimation Methods

2.2.1. Amplitude Method and Phase-Shift Method

The soil thermal diffusivity can be determined using both the amplitude ( k A M ) or phase shift ( k P S ) calculations, as follows [12]:
k A M = ω ( z 1 z 2 ) 2 2 ( ln ( A ( z 1 ) ) ln ( A ( z 2 ) ) ) 2
k P S = ω ( z 1 z 2 ) 2 2 ( ϕ z 1 ϕ z 1 ) 2
where A ( z 1 ) and A ( z 2 ) are the least-squares temperature amplitudes and ϕ z 1 and ϕ z 2 are the least-squares phase shifts at depths z 1 and z 2 , respectively, and can be obtained using Equation (7).

2.2.2. Arctangent Method and Logarithmic Method

For climate-controlled greenhouses, indoor air temperatures are maintained at specific set points. Therefore, the greenhouse air temperature is not a true sine function as is assumed for open fields. Instead, the upper boundary condition is more closely described by a Fourier series [10]:
T ( z , t ) = T a v e ( z ) + i = 1 n A i ( z ) sin ( i ω t + φ i )
where A i is the amplitude of the temperature harmonic i
φ i is the initial phase shift of series i
This equation indicates that the variation in the soil temperature consists of two parts: the constant temperature T a v e at depth z and n superimposed sine waves. Using the trigonometric function transformation, the equation can be written as:
T ( z , t ) = T a v e ( z ) + i = 1 n ( a i cos ( i ω t ) + b i sin ( i ω t ) )
where a i = A i ( z ) s i n φ i and b i = A i ( z ) c o s φ i , are the parameters of the Fourier series. Then,
A i ( z ) = a i 2 + b i 2
φ i = arctan ( a k b k )
where a k and b k are the shorter sides of triangle k.
Applying the Fourier series method shown in Equation (12), Horton et al. (1983) used the first four terms (n = 2) to describe an upper boundary condition at the soil depth z [15]. Using an arctangent transformation, the soil temperatures at depths z 1 and z 2 measured every 6 h during a 24 h period are T 1 , T 2 , T 3 , and T 4 and T 1 , T 2 , T 3 , and T 4 , respectively. Thus, the apparent thermal diffusivity ( k A R ) can be calculated as [16]
k A R = ω ( z 2 z 1 ) 2 2 ( arctan ( ( T 1 T 3 ) ( T 2 T 4 ) ( T 2 T 4 ) ( T 1 T 3 ) ( T 1 T 3 ) ( T 1 T 3 ) + ( T 2 T 4 ) ( T 2 T 4 ) ) ) 2
Using the logarithmic method, Seemann (1979) showed that the apparent thermal diffusivity ( k L G ) can be calculated as [17]
k L G = { 0.0121 ( z 2 z 1 ) 2 l n [ ( ( T 1 T 3 ) 2 + ( T 2 T 4 ) 2 ( T 1 T 3 ) 2 + ( T 2 T 4 ) 2 ] } 2

2.2.3. Min-Max Method

Equation (2) gives the range of soil temperature variation can be calculated as [18]
T ( z , t ) = T a v e ( z ) ± A ( z )
showing that the temperature features between a minimum and a maximum. Since the range of the sine function is from −1 to 1, A ( z ) can be calculated as:
A ( z ) = T m a x ( z ) T m i n ( z ) 2
Thus, using the min-max method, the soil thermal diffusivity ( k M M ) can be calculated as
k M M = ω ( z 1 z 2 ) 2 2 ( ln ( A ( z 1 ) ) ln ( A ( z 2 ) ) ) 2
where A ( z 1 ) and A ( z 2 ) are the amplitudes of temperature fluctuation determined from the min-max method at depth z 1 and z 2 , respectively.
Field-measured minimum and maximum temperatures recorded by temperature sensors at depths z 1 and z 2 , can be used to determine the soil thermal diffusivity. Consequently, the amplitude values can be determined without the temperature necessarily behaving strictly in a sinusoidal manner.

2.3. Data Collection

Field experiments were conducted in a greenhouse at Wooster campus of The Ohio State University (latitude: 40.78 N, longitude: 81.93 W) with a wall height of 2.54 m, a width of 7.32 m, a length of 14.63 m, and an arch height of 2.08 m. The greenhouse has a pad and fan cooling system and a space heater heating system for temperature control. The greenhouse air temperature was measured in the middle of the greenhouse at the plants’ level (1.2 m), while the soil surface temperature was measured immediately underneath a black ground cover with type K thermocouples. The soil temperature was measured in the middle of the greenhouse at depths of 0.1 m, 0.2 m, and 0.3 m using Decagon 5TE soil moisture and temperature sensors (Decagon Devices, Inc., Pullman, WA, USA). Due to different sensor connectors, the greenhouse air and soil surface temperatures were recorded by one data logger (CR3000, Campbell Scientific Inc., Logan, UT, USA), while the soil temperatures were recorded by another data logger (EM50, Decagon Devices, Inc., Pullman, WA, USA). All the data were automatically recorded every 10 min. The outdoor weather was recorded by the Ohio Agricultural Research and Development Center (OARDC) weather station. The experiments were conducted from 1 September to 31 December 2016, and the data were separated into cooling and heating seasons for analysis.

3. Results and Discussion

The results of greenhouse data collection, soil diffusivity determination, and evaluation of the soil temperature prediction are presented in this section. Greenhouse data were collected and separated into cooling and heating seasons. The soil diffusivities were calculated by using one set of the collected data following the five methods described in the soil thermal diffusivity estimation methods section and were then used as input value for the soil temperature prediction model. Then, the performances of the soil temperature prediction model at different depths using the calculated thermal diffusivities were evaluated against another set of collected greenhouse data.

3.1. Analysis of Greenhouse Data

Although greenhouse conditions are often maintained at constant temperatures (set points) that are controlled by active cooling and heating systems, the greenhouse soil temperature is affected not only by the greenhouse air but also by the change in solar radiation [19], such as the outdoor conditions. Changes in seasons affect greenhouse climate control, which changes the heat flux direction either from the air to the soil or from the soil to the air under heating or cooling conditions, respectively. Furthermore, the greenhouse soil could lose or gain heat from the outdoor soil depending on the season. Therefore, this study focused on analyzing the performance of the model during the cooling and heating seasons.

3.1.1. Cooling Season

Figure 1 shows the air temperatures inside and outside the greenhouse and soil temperatures at depths of 0 m, 0.1 m, 0.2 m, and 0.3 m during the cooling season. The cooling set point was 35 °C during the study period, except for 6–10 September, when the cooling system was deactivated.
On clear-sky days, the greenhouse air temperature increased with the thermal load from solar radiation until it reached the cooling temperature set point. Due to on-off cooling control actions, the air temperature oscillated slightly around the cooling temperature set point, 35 °C. In contrast, when the cooling control was deactivated from 6 September to 10 September, the air temperature reached as high as over 42 °C. In general, the air temperature profile showed a sinusoidal shape. The temperature profile looked differently on a rainy day (14 September) when the solar radiation was low. On that day, the greenhouse air temperature varied with the outside air temperature and formed two peaks.
Figure 1b shows that the soil temperature profiles had similar sinusoidal shapes as the greenhouse air profile but with smaller amplitudes and larger hysteretic phase shifts as the depth increased. When the cooling system was deactivated from 6 September to 10 September, the soil temperature increased with increasing greenhouse air temperature.

3.1.2. Heating Season

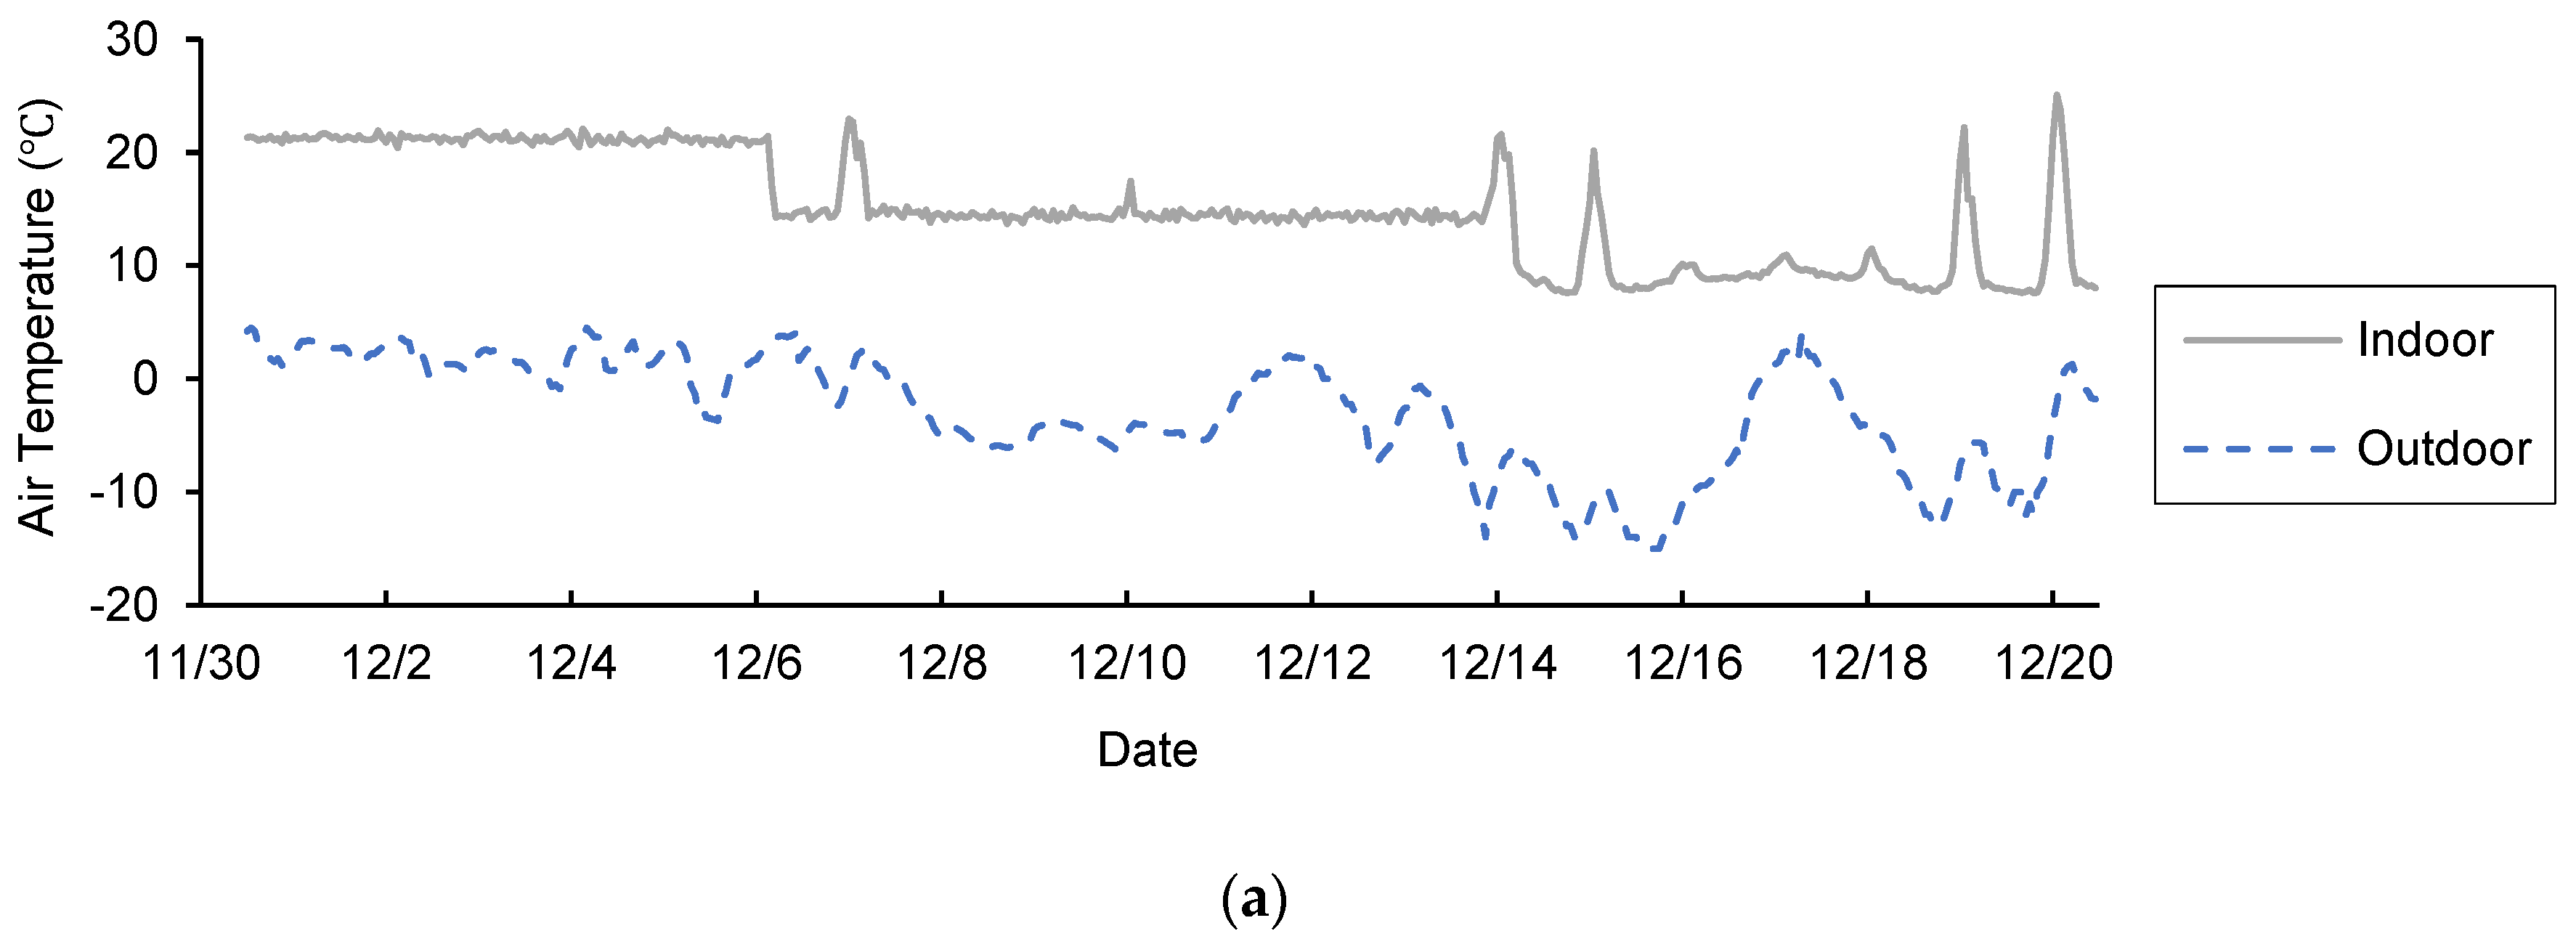
Figure 2 shows the air temperature inside and outside the greenhouse and soil temperatures at depths of 0.0 m, 0.1 m, 0.2 m, and 0.3 m in the heating season. The greenhouse air temperature was maintained above the heating set points throughout the experiment. To study the effect of the soil temperature at different air temperatures, the heating set points were 21 °C, 14.4 °C and 4.4 °C from 1 December to 6 December, 7 December to 13 December, and 14 December to 20 December 2016, respectively. The outdoor temperature was near or below 0 °C during this period.
Figure 2a shows that at the temperature set point of 21 °C, the greenhouse air temperature was accurately maintained at 21 °C. When the greenhouse set point was set as 14.4 °C, the greenhouse air temperature occasionally went above 14.4 °C and was sometimes higher than 20 °C under clear-sky conditions (7 December). When the temperature set point was set at 4.4 °C, the greenhouse air temperature showed a steady sinusoidal pattern under clear-sky conditions (15, 19, and 20 December). On the other hand, for rainy conditions (16 December), the sinusoidal pattern was less pronounced. The greenhouse air temperature was higher and more stable than the outside air due to the low solar radiation load days, absorption of solar radiation by the soil and insulation form the greenhouse structure. The soil temperature was higher than the air temperature; the deeper the soil was, the higher the soil temperature. This finding suggests potential heat transfer from the soil to the greenhouse air.
The soil temperature in Figure 2b shows diurnal variations in sinusoidal behavior with reduced amplitude and reduced phase shift. When the greenhouse temperature was set to 21 °C and at 14.4 °C, the outside air temperature was close to 0 °C. This outside temperature affected the soil temperature, especially at the soil surface. The diurnal greenhouse soil temperature pattern is easier to see but not the greenhouse air temperature pattern. Using an energy balance at the greenhouse floor measured by Sharma (1999) suggested that when the air temperature was maintained at a constant value [19], the diurnal variation in soil surface temperature is mainly affected by solar radiation. When the greenhouse air temperature was set to 4.4 °C, which was close to the outside air temperature, the soil temperature varied with the greenhouse air temperature. The soil temperatures at deeper depths were higher than those at the surface. The analysis of the cooling and heating seasons shows that the greenhouse soil temperature was affected by the greenhouse air temperature, solar radiation, and outside air temperature. The soil temperatures were lower than the greenhouse air temperature during the cooling season, while the effect was reversed during the heating season.

3.1.3. Daily Average Temperature

Figure 3 shows the daily average temperatures of the greenhouse air and soil at depths of 0.0 m, 0.1 m, 0.2 m, and 0.3 m from 1 September to 31 December 2016. With the greenhouse climate control system activated, the daily average greenhouse air temperatures were above 21 °C from 1 December to 6 December when the heating set point was 21 °C. When the heating set points were 14.4 °C (7 December to 13 December) and 4.4 °C (14 December to 31 December), the daily average greenhouse air temperatures were above 14.4 °C and 4.4 °C, respectively. The daily average greenhouse air temperatures on sunny days (27 December) were higher than the average temperatures on rainy days (24 December) and cloudy days (21 December).
In addition to the finding that the soil temperature is highly sensitive to the topography, leaf area index (LAI), and outdoor air temperature [20], the analyses for the cooling and heating seasons discussed in Section 3.1.1 and Section 3.1.2 show that the greenhouse soil temperature was also affected by the greenhouse air temperature. However, this effect was less pronounced at greater depths. For instance, in December, the soil temperature at a depth of 0.3 m was maintained higher than 10 °C, the average yearly temperature at the experiment site (Wooster, Ohio), while the greenhouse air temperature was less than 10 °C in December.
Figure 4 shows strong linear relationships between the daily average temperatures at various soil depths and the temperature at the soil surface.

3.2. Calculation of Soil Thermal Diffusivity

The thermal diffusivity of the greenhouse soil was calculated using methods discussed in Section 2.2 and field data from 1 to 7 September 2016. As shown in Table 1, the mean thermal diffusivity k of the greenhouse soil was calculated using the amplitude, phase-shift, arctangent, logarithmic, and min-max methods using the data collected at depths of 0.1 m and 0.3 m. The value of k for the greenhouse soil under different weather conditions and different greenhouse control methods was approximately 10 × 10−7 m2 s−1.

3.3. Greenhouse Soil Temperature Simulation

Data from 8 September 2016 to 31 December 2016 were employed to simulate the greenhouse soil temperature at different depths.

3.3.1. Average Soil Temperature Simulation

To predict soil temperatures, we assumed that at all depths, the temperature oscillates as a sinusoidal function of time around an average value that was constant for all depths. Using the results of a traditional linear regression model and the coefficient of determination of the average daily soil temperatures at depths of 0.1 m, 0.2 m, and 0.3 m determined from the average daily soil surface temperature, the average soil temperature at different depths, Tave (z), can be calculated as:
T a v e ( z ) = exp ( 0.1 B z ) T a v e ( 0 ) + T y e a r ( 1 exp ( 0.4 B z ) )
where T y e a r is the annual mean soil temperature outdoor, z is the soil depth and B = ω / 2 k is the inverse of the damping depth as described in Equation (5).
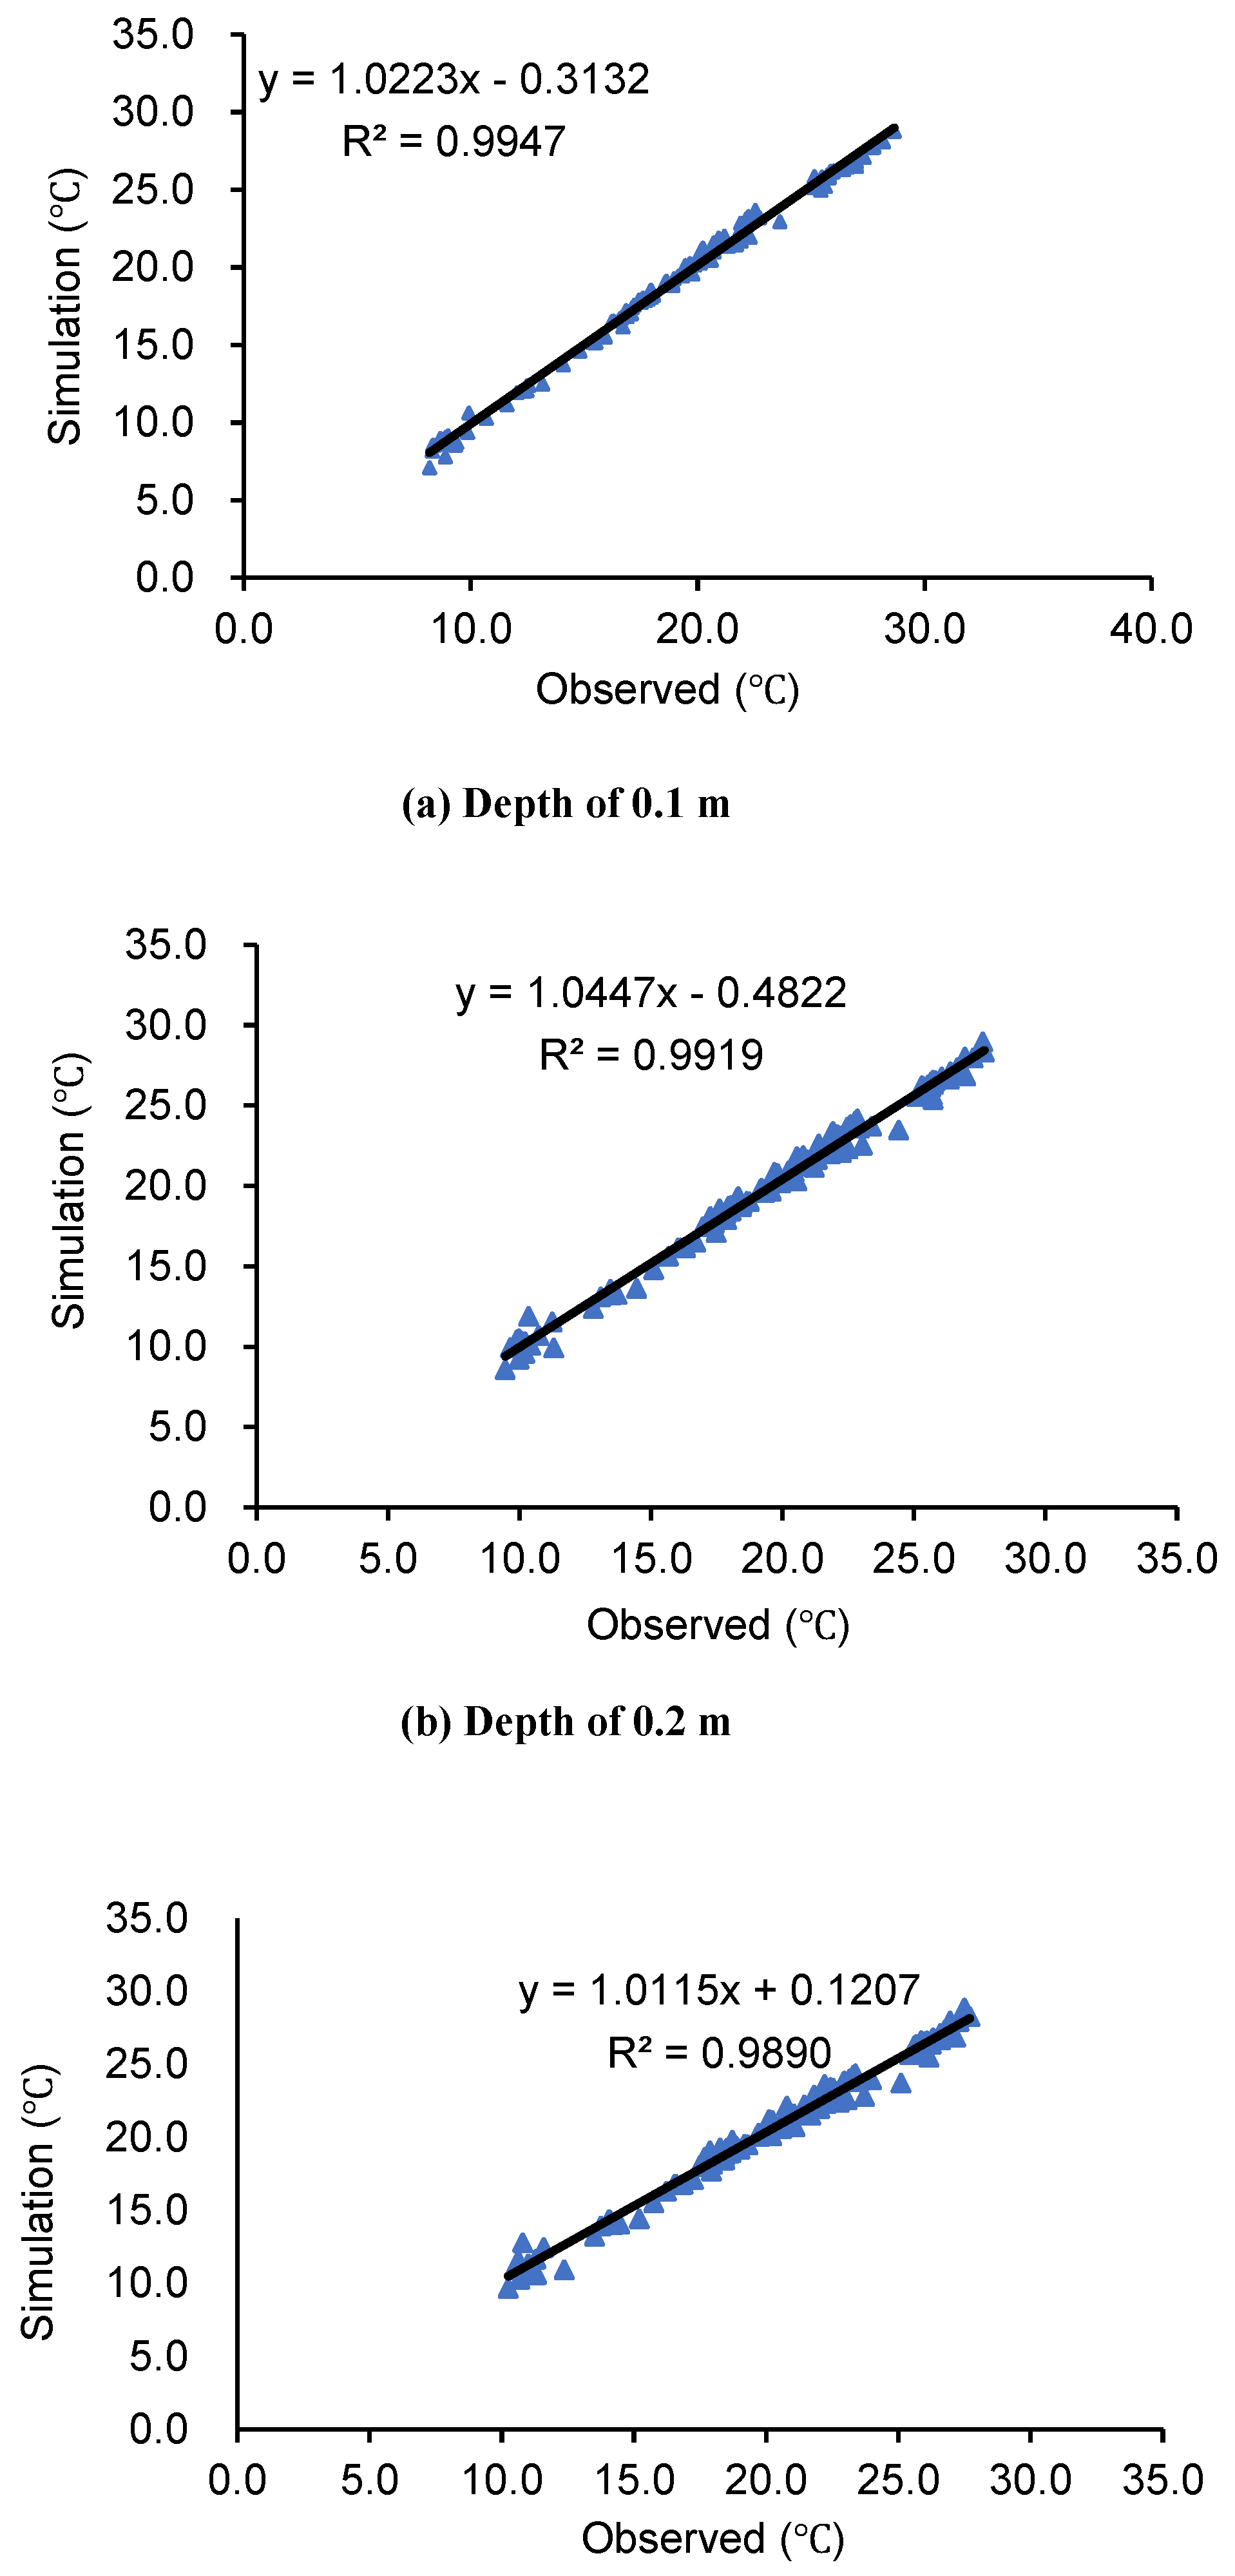
The thermal diffusivity (k) determined with the amplitude method discussed in Section 3.2 was used in Equation (18) to simulate the daily average soil temperatures at depths of 0.1 m, 0.2 m, and 0.3 m from September 8 to December 31. The annual mean soil temperature ( T y e a r ) was recorded by the OARDC weather station. Figure 5 shows the linear regression and coefficient of determination of the observed and simulated average soil temperatures at 0.1 m, 0.2 m, and 0.3 m depths.

3.3.2. Simulation of the Diurnal Variation of Soil Temperature

Using the calculated soil thermal diffusivity, the greenhouse soil temperature can be determined using Equations (8) and (18). The calculated and actual soil temperatures during the cooling season and heating seasons under typical climate conditions are shown in Figure 6 and Figure 7, respectively.
During the cooling season, on clear days with active cooling or under rainy conditions, the fitted Root Mean Square Error (RMSE) was less than 1 at the different depths. The simulated temperature was slightly higher than the observed value at depths of 0.2 m and 0.3 m. In addition, the phase shifts of the simulated soil temperature at the 0.2 m and 0.3 m depths were in agreement with the observed data. Under rainy conditions, the simulated soil temperatures at the 0.1 m and 0.2 m depths were consistent with the observed temperatures. The simulated soil temperatures under rainy conditions remained lower than the observed temperatures before 12:00 because the temperature on that day was low and the temperature on the day before was high, whereas in the afternoon, the simulation results closely matched the observed values. Using Equation (8), the time delay phase shift between the soil surface temperatures and the temperatures at a soil depth of 0.1 m was approximately 2.3 h for any weather or cooling condition. When the time delay was considered in the simulations of the soil temperature, the simulation results are in agreement with the observed soil temperature.
Figure 7 shows the results of the greenhouse soil temperature simulations at three different heating set points during the heating season. At each set point, the fitted RMSE was less than 0.5 for the different soil depths. When the heating set point was 4.4 °C, the heating system was not active because the greenhouse air temperature was always above the set point. On these days, the fluctuation of solar radiation resulted in a sinusoidal temperature profile at the soil surface (Figure 2). In general, since the soil surface is more sensitive than deeper soil to changes in solar radiation, the simulated amplitude was lower at different depths than at the surface. The simulated phase shifts between the soil surface temperature and the soil temperature at different depths were in agreement with the actual measurements.

4. Discussion

As reported, the thermal diffusivity (k) for sand varies across depths and weather conditions within a range of 10−5–10−7 m2 s−1 [12]; k for quartz sand is 12.5 × 10⁻⁷ m2 s−1 [15], and the k for loamy sand is approximately 2.5–8.4 × 10⁻⁷ m2 s−1 [21]. Table 1 shows the estimated the k values under different weather conditions and for different seasons. The phase-shift method yielded different results on clear-sky days when the greenhouse was cooled and or not cooled. The phase-shift, arctangent and logarithmic methods were greatly influenced by the weather conditions since the results on cloudy days differed largely from those on clear-sky days. The results obtained from the amplitude and min-max methods are more consistent with those obtained from the other methods under the conditions tested. Both of these methods calculated the amplitude of the temperature with similar results.
The soil temperature oscillates as a sinusoidal function of time around an average value that is constant for all depths [18], and the temperature deep into the soil after a certain depth becomes constant and is considered equal to the average soil temperature [22]. In fact, the soil temperature is affected by the solar radiation, soil moisture content, soil cover, and LAI [21,23,24,25]. The estimation method used heat to determine the average soil temperature agrees with the results obtained by Paul [26] (i.e., daily soil temperature decreased exponentially with increasing soil depth) and Tabari [27] (i.e., the amplitude of the annual temperature wave attenuates exponentially with increasing soil depth).
Table 2 shows the performance of the soil temperature prediction model under different environmental conditions for both the cooling and heating seasons. Outdoor sky condition effects (clear sky or rainy), indoor environmental control effects (active cooling or no active cooling) and various heating set points were taken into account. On a clear day, during the cooling season, especially without a cooling system, the greenhouse air temperature is higher than that outside the greenhouse (Figure 1). Thus, the soil surface temperature is higher than the greenhouse air temperature. Using the energy balance for the greenhouse floor between the indoor air and soil surface [28], the simulation results are higher than the observed values at depths of 0.2 m and 0.3 m (Figure 6b and Figure 6c, respectively). The RMSE for any soil depth is higher than the RMSE for the soil surface, indicating that the simulation model is sensitive to the surface temperature during the cooling season. During the heating season, using the energy balance for the two distinct soil sublayers of the soil surface [29], the fraction of solar radiation received by the greenhouse floor equals the sum of the rate of energy loss from the soil surface to the indoor air and the rate of energy loss from the soil surface to the sub soil [30,31]. Therefore, when the set point of the heating system is low (4.4 °C), the greenhouse is similar to the outside, and the estimation of the temperature is more consistent with the observed values (Figure 7). Table 2 also shows that the RMSE for the cooling season is generally larger than those for the heating season, partly because the soil temperature in the greenhouse is affected by both the air temperature and the amount of solar radiation. Overall, these results suggest that Equations (8) and (18) performed well in predicting the greenhouse soil temperature.

5. Conclusions

Heat transfer in greenhouse soil is an important variable affecting the greenhouse climate. In this study, we established and validated a greenhouse soil temperature model by estimating the thermal diffusivity of the soil. Our results showed that in the greenhouse, the diurnal soil temperatures at different depths have a steady sinusoidal behavior. The soil temperatures at different depths have decreasing amplitudes and hysteretic phase shifts with increasing depth. An evaluation of the five thermal diffusivity estimation methods showed that the amplitude method and the min-max method have the most consistent outcomes for estimating the greenhouse soil thermal diffusivity under different greenhouse and outdoor weather conditions. In addition, we found that the greenhouse soil temperature was affected by different factors during different seasons. The soil temperature is greatly affected by the greenhouse air temperature during the cooling season, while the soil temperature was mainly affected by the outdoor air temperature during the heating season due to the lower outdoor air temperature compared to the greenhouse air temperature. The soil temperature and daily average temperature at different depths can be predicted according to the temperature based on the soil thermal diffusivity. It should be noted that there are limitations to this study. First, the soil was assumed to be infinitely deep and second, we assumed that heat transfer only occurred downward in a one-dimensional isotropic medium. In reality, with the limited dimensions of the greenhouse, heat transfer through the soil is three-dimensional, and it is affected by the temperature gradient between the soils inside and outside the greenhouse. Second, the greenhouse air temperature is affected by more than just the outdoor air temperature. It is also affected by incoming solar radiation, crop growth and greenhouse climate control. To obtain a more comprehensive model, the convective heat transfer between the greenhouse air and the soil as well as the influence of different crops at different growing stages must be considered in a comprehensive energy balance model.

Author Contributions

J.W. and P.P.L. conceived and designed the experiments; W.F.L. performed the experiments; J.W. analyzed the data and wrote the paper; W.F.L. and P.P.L. edited the paper. All authors have read and agreed to the published version of the manuscript.

Funding

This research was supported by the Key R&D Programs of Jiangsu Province (BE2018321), the Natural Science Foundation of Jiangsu Provincial Department of Education (17KJA416002), the China Postdoctoral Science Foundation (2015M580400), the Jiangsu Province Postdoctoral Science Foundation (1501112B), and the Priority Academic Program Development of Jiangsu Higher Education Institutions.

Acknowledgments

The authors are grateful to the Ohio Agricultural Research and Development Center (OARDC), Ohio State University, Wooster, OH, USA, for providing support to conduct the experiments.

Conflicts of Interest

The authors declared that they have no conflicts of interest to this work.

References

  1. Sanford, S. Reducing greenhouse energy consumption—An overview. Energy Effic. Greenh. 2011, 3907, 1–16. [Google Scholar]
  2. Sethi, V.P.; Sharma, S.K. Survey and evaluation of heating technologies for worldwide agricultural greenhouse applications. Sol. Energy 2008, 82, 832–859. [Google Scholar] [CrossRef]
  3. Vadiee, A.; Martin, V. Energy analysis and thermo economic assessment of the closed greenhouse—The largest commercial solar building. Appl. Energy 2013, 102, 1256–1266. [Google Scholar] [CrossRef]
  4. Du, J.; Bansal, P.; Huang, B. Simulation model of a greenhouse with a heat-pipe heating system. Appl. Energy 2012, 93, 268–276. [Google Scholar] [CrossRef]
  5. Anifantis, A.S.; Colantoni, A.; Pascuzzi, S. Thermal energy assessment of a small scale photovoltaic, hydrogen and geothermal stand-alone system for greenhouse heating. Renew. Energy 2017, 103, 115–127. [Google Scholar] [CrossRef]
  6. Ghosal, M.K.; Tiwari, G.N. Modeling and parametric studies for thermal performance of an earth to air heat exchanger integrated with a greenhouse. Energy Convers. Manag. 2006, 47, 1779–1798. [Google Scholar] [CrossRef]
  7. Horton, R.; Wierenga, P.J. Estimating the Soil Heat Flux from Observations of Soil Temperature Near the Surface. Soil Sci. Soc. Am. J. 1983, 47, 14–20. [Google Scholar] [CrossRef]
  8. Ozgener, O.; Ozgener, L.; Tester, J.W. A practical approach to predict soil temperature variations for geothermal (ground) heat exchangers applications. Int. J. Heat Mass Transf. 2013, 62, 473–480. [Google Scholar] [CrossRef]
  9. Danelichen, V.H.M.; Biudes, M.S.; Souza, M.C.; Machado, N.G.; Curado, L.F.A.; Nogueira, J.S. Soil Thermal Diffusivity of a Gleyic Solonetz Soil Estimated by Different Methods in the Brazilian Pantanal. Open J. Soil Sci. 2013, 3, 15–22. [Google Scholar] [CrossRef] [Green Version]
  10. Li, Y.; Liu, S.; Wang, S.; Miao, Y.; Chen, B. Comparative study on methods for computing soil heat storage and energy balance in arid and semi-arid areas. J. Meteorol. Res. 2014, 28, 308–322. [Google Scholar] [CrossRef]
  11. Awe, G.O.; Reichert, J.M.; Wendroth, O.O. Temporal variability and covariance structures of soil temperature in a sugarcane field under different management practices in southern Brazil. Soil Tillage Res. 2015, 150, 93–106. [Google Scholar] [CrossRef]
  12. An, K.; Wang, W.; Zhao, Y.; Huang, W.; Chen, L.; Zhang, Z.; Wang, Q.; Li, W. Estimation from Soil Temperature of Soil Thermal Diffusivity and Heat Flux in Sub-surface Layers. Bound. Layer Meteorol. 2016, 158, 473–488. [Google Scholar] [CrossRef]
  13. Yener, D.; Ozgener, O.; Ozgener, L. Prediction of soil temperatures for shallow geothermal applications in Turkey. Renew. Sustain. Energy Rev. 2017, 70, 71–77. [Google Scholar] [CrossRef]
  14. De Silans, A.M.B.P.; Monteny, B.A.; Lhomme, J.P. Apparent soil thermal diffusivity, a case study: HAPEX-Sahel experiment. Agric. Forest Meteorol. 1996, 81, 201–216. [Google Scholar] [CrossRef]
  15. Horton, R.; Wierenga, P.J.; Nielsen, D.R. Evaluation of methods for determining the apparent thermal diffusivity of soil near the surface. Soil Sci. Soc. Am. J. 1983, 47, 25–32. [Google Scholar] [CrossRef]
  16. Nerpin, S.V.; Chudnovskii, A.C. Physics of the Soil: Israel Program for Scientific Translations; Keter Press: Jerusalem, Israel, 1967. [Google Scholar]
  17. Seemann, J. Measuring Technology. In Agrometeorology; Springer: Berlin/Heidelberg, Germany, 1979; pp. 40–45. [Google Scholar]
  18. Campbell, G.S.; Norman, J.M. An Introduction to Environmental Biophysics, 2nd ed.; Springer: Berlin, Germany, 1998. [Google Scholar]
  19. Sharma, P.K.; Tiwari, G.N. Parametric study of a greenhouse by using Runge–Kutta methods. Energy Convers. Manag. 1999, 40, 901–912. [Google Scholar] [CrossRef]
  20. Kang, S.; Kim, S.; Oh, S.; Lee, D. Predicting spatial and temporal patterns of soil temperature based on topography, surface cover and air temperature. For. Ecol. Manag. 2000, 136, 173–184. [Google Scholar] [CrossRef]
  21. Otunla, T.; Otunla, T.A.; Oladiran, E.O. Evaluation of soil thermal diffusivity algorithms at two equatorial sites in West Africa. Ann. Geophys. 2013, 56, R0101. [Google Scholar] [CrossRef]
  22. Sethi, V.P.; Sharma, S.K. Experimental and economic study of a greenhouse thermal control system using aquifer water. Energy Convers. Manag. 2007, 48, 306–319. [Google Scholar] [CrossRef]
  23. Zheng, D.; Hunt, E.R.; Running, S.W. A daily soil temperature model based on air temperature and precipitation for continental applications. Clim. Res. 1993, 2, 183–191. [Google Scholar] [CrossRef]
  24. Hu, Q.; Feng, S. A daily soil temperature dataset and soil temperature climatology of the contiguous United States. J. Appl. Meteorol. 2003, 42, 1139–1156. [Google Scholar] [CrossRef]
  25. Kätterer, T.; Andrén, O. Predicting daily soil temperature profiles in arable soils in cold temperate regions from air temperature and leaf area index. Acta Agric. Scand. Sect. B Soil Plant Sci. 2009, 59, 77–86. [Google Scholar] [CrossRef]
  26. Paul, K.I.; Polglase, P.J.; Smethurst, P.J.; O’Connell, A.M.; Carlyle, C.J.; Khanna, P.K. Soil temperature under forests: A simple model for predicting soil temperature under a range of forest types. Agric. For. Meteorol. 2004, 121, 167–182. [Google Scholar] [CrossRef]
  27. Tabari, H.; Sabziparvar, A.A.; Ahmadi, M. Comparison of artificial neural network and multivariate linear regression methods for estimation of daily soil temperature in an arid region. Meteorol. Atmos. Phys. 2011, 110, 135–142. [Google Scholar] [CrossRef]
  28. Joudi, K.A.; Farhan, A.A. A dynamic model and an experimental study for the internal air and soil temperatures in an innovative greenhouse. Energy Convers. Manag. 2015, 91, 76–82. [Google Scholar] [CrossRef]
  29. Sethi, V.P.; Sumathy, K.; Lee, C.; Pal, D.S. Thermal modeling aspects of solar greenhouse microclimate control: A review on heating technologies. Sol. Energy 2013, 96, 56–82. [Google Scholar] [CrossRef]
  30. Ghasemi Mobtaker, H.; Ajabshirchi, Y.; Ranjbar, S.F.; Matloobi, M. Solar energy conservation in greenhouse: Thermal analysis and experimental validation. Renew. Energy 2016, 96, 509–519. [Google Scholar] [CrossRef]
  31. Taki, M.; Ajabshirchi, Y.; Ranjbar, S.F.; Rohani, A.; Matloobi, M. Modeling and experimental validation of heat transfer and energy consumption in an innovative greenhouse structure. Inf. Process. Agric. 2016, 3, 157–174. [Google Scholar] [CrossRef] [Green Version]
Figure 1. Diurnal variation of greenhouse air temperature (a) and greenhouse soil temperature (b) during the cooling season.
Applsci 10 00653 g001aApplsci 10 00653 g001b
Figure 2. Diurnal variations of (a) air temperature and (b) greenhouse soil temperature during the heating season.
Applsci 10 00653 g002aApplsci 10 00653 g002b
Figure 3. Diurnal variations in the air temperature and the greenhouse soil temperature in the warming season.
Applsci 10 00653 g003
Figure 4. Linear regression and coefficient of determination of the daily average greenhouse soil temperatures of soil surface (0 m) and different depths.
Applsci 10 00653 g004aApplsci 10 00653 g004b
Figure 5. Linear regression and coefficient of determination of the observed and simulated average soil temperatures at different depths.
Applsci 10 00653 g005aApplsci 10 00653 g005b
Figure 6. Simulation results for the cooling season soil temperatures at 0.1 m, 0.2 m, and 0.3 m soil depths under various aerial conditions: clear-sky or rainy day, with or without active cooling.
Applsci 10 00653 g006aApplsci 10 00653 g006b
Figure 7. Simulation results of heating season soil temperature at 0.1 m, 0.2 m and 0.3 m soil depths from the soil su4rface temperature at different heating set points (21 °C, 14.4 °C and 4.4 °C).
Applsci 10 00653 g007aApplsci 10 00653 g007b
Table 1. Comparison of the apparent soil thermal diffusivity k (×10−7 m2 s−1) determined from amplitude, phase-shift, arctangent, logarithmic, and min-max methods using field data collected from 1 to 7 September 2016. The greenhouse was cooled with a pad and fan system from 1 September to 5 September, and no cooling was implemented from 6 September 6 to 7 September.
DateEnvironmental ConditionsAmplitude ( k A M ) Phase Shift ( k P S ) Arctangent ( k A R ) Logarithmic ( k L G ) Min-Max ( k M M )
9/1Cloudy sky, cooled9.537.749.1412.7110.58
9/2Clear sky, cooled8.9512.6911.028.1910.03
9/3Clear sky, cooled9.1712.7412.957.4610.28
9/4Clear sky, cooled9.4911.3712.568.6810.03
9/5Clear sky, cooled9.3811.3611.018.359.27
9/6Clear sky, Uncooled9.2112.0811.518.3810.53
9/7Clear sky, Uncooled9.5814.3411.857.8211.05
Average9.3311.7611.448.810.25
Standard Deviation0.232.041.251.770.56
Table 2. Performance of the soil temperature prediction model under different environmental conditions. The values in the table are the Root Mean Square Error (RMSE) of the model predictions and actual measurement.
Environmental ConditionsSoil Depth
0.1 m0.2 m0.3 m
Cooling seasonClear sky (w/cooling)0.950.800.47
Clear sky (w/o cooling)0.881.291.30
Rainy0.810.710.90
Heating seasonSet point: 21 °C0.310.110.24
Set point: 14.4 °C0.430.320.18
Set point: 4.4 °C0.250.120.24