Article

LCA as a Tool for the Environmental Management of Car Tire Manufacturing

by
Piotrowska Katarzyna
1,*,
Piasecka Izabela
2,
Bałdowska-Witos Patrycja
2,
Kruszelnicka Weronika
2 and
Tomporowski Andrzej
2
1
Faculty of Mechanical Engineering, Lublin University of Technology, 20-618 Lublin, Poland
2
Department of Technical Systems Engineering, Faculty of Mechanical Engineering, University of Science and Technology in Bydgoszcz, 85-796 Bydgoszcz, Poland
*
Author to whom correspondence should be addressed.
Appl. Sci. 2020, 10(20), 7015; https://doi.org/10.3390/app10207015
Submission received: 14 August 2020 / Revised: 24 September 2020 / Accepted: 30 September 2020 / Published: 9 October 2020
(This article belongs to the Special Issue Design and Management of Manufacturing Systems)

Abstract

:
Car tire manufacturing can be the cause of numerous environmental hazards. Harmful emissions from the production process are an acute danger to human health as well as the environment. To mitigate these unwanted consequences, manufacturers employ the eco-balance analysis at the product designing and development stage, when formulating general development strategies, and increasingly when investigating the entire product lifecycle management process. Since the negative effects of products are considered in a broader range of implications, it has become necessary to extend the traditional scope of analytical interest onto the production, use, and end-of-life stages. This work investigates the manufacturing of passenger car tires executed with traditional and modern manufacturing technologies. The Life Cycle Assessment (LCA) of tires reported in this study involved three LCA methods: Eco-Indicator 99, Cumulative Energy Demand (CED) and the scientific assessment methods developed by the Intergovernmental Panel on Climate Change, Global Warming Potential (IPCC). LCA as a tool for environmental analysis can be carried out for the entire life cycle or its individual phases. The implementation of the work made it possible to demonstrate that as a result of the identification of the main sources of negative impacts, it is possible to propose ways to minimize these impacts in the car tire manufacturing process. The results indicate that the most damaging impact is the depletion of natural resources, which play a key role in the production process of car tires.

Graphical Abstract

1. Introduction

The natural environment consists of many interacting phenomena and processes that must achieve a state of equilibrium. Manufacturing activity is constantly striving towards one direction—a cycle of production and consumption. In this cycle, raw materials are in the end converted to waste and dangerous emissions. Modern civilization is dependent on the automotive industry, both in terms of transport and everyday life. In order to reduce the consumption of raw materials, manufacturers must take this is into account at the design and production stage of a product.
The global production of tires currently reaches about 2 billion units, and the world production of rubbers is at nearly 30 million tonnes.T. This will not change in the near future; the number of passenger cars traveling on the road will only increase, and motor vehicles cannot be manufactured without tires.
Until recently, potential buyers of car tires paid attention primarily to the highest quality of the product, while manufacturers paid attention to the highest possible efficiency of the manufacturing process. Along with the growing ecological awareness around the world, attention began to be paid to the lowest possible harmfulness of both the production, operation, and post-use disposal of tires. Therefore, new solutions began to appear on the market, such as the green tires. Automotive companies are actively searching for solutions expected to improve the environmental soundness of their products. These efforts have contributed to reductions in fuel consumption and the emissions of harmful substances to the atmosphere, and have promoted the use of components that facilitate material recycling. Ecological tires are structurally similar to traditional tires; however, they are made of different materials. In addition, the ecological tire uses improved rubber compounds, and the tread pattern has been modified so the groove and sipes are not so deep. In numerous ways, ecological tires outperform traditional solutions, in terms of fuel efficiency, rolling resistance, and the emission of harmful substances such as carbon dioxide. Also, savings in fuel consumption are said to reach approximately 0.2 L/100 km, which compensates for the higher price of ecological tires. In addition, the novelty tire is about 20% lighter than a tire produced in a traditional manufacturing technology. Several aspects differentiate the traditional and the ecological tire, e.g., the tread pattern. In the modern tire production process, carbon black has been entirely replaced by silica. The substitution of steel and other materials contributes to the weight reduction of the green tire, which is claimed to weigh 25% less than a traditional one. Green tires are believed to reduce fuel consumption and carbon dioxide emissions by reducing rolling resistance, which in the traditional model amounts to approximately 12 kg/T, whereas the modern design is said to maintain the level of up to 8 kg/T. Another advantage of lower rolling resistance is the lesser noise generated by the tires. Therefore, green tires also have an impact on the environment, as noise is treated as a part of pollution. Furthermore, there is a marked rise in fuel economy. In urban traffic, a percentage share of fuel consumption reduction for ecological tires is close to 3%, while in rural/motorway traffic (at high speeds) it is reported to approach to 5%. Finally, the average resource used during the production of one ecological tire amounts to: 1036 MJ of electricity, 45 liters of water, 0.02 kg of solvents, and about 0.5 kg of waste is generated [manufacturer’s data].
Due to changes taking place in the modern economy and the emergence of new social expectations, in the life cycle of car tires, apart from technical, design, and manufacturing aspects, environmental protection objectives must be taken into account, including reducing the depletion of raw materials and improving the quality of the environment and negative impact on human health. In order to achieve these objectives, appropriate assessment tools are required that enable the identification and reduction of emerging environmental problems. The basic tool used for this type of assessment is a product life cycle analysis known as the LCA method (Life Cycle Assessment) [1].
Environmental Life Cycle Assessment (LCA) has been developed over the last three decades. LCA developed from merely energy analysis to a comprehensive environmental burden analysis in the 1970s. Then, full-fledged life cycle impact assessment and life cycle costing models were introduced in the 1980s and 1990s, and social-LCA and particularly consequential LCA gained ground in the first decade of the 21st century [2]. Life Cycle Assessment is a cradle-to-grave approach to assessing industrial systems. Cradle-to-grave begins with collecting material from the ground to produce a product and ends when all the materials are returned to the field. LCA evaluates all stages of life from the point of view that they are interdependent, which means that one operation leads to all. This method makes it possible to use the cumulative environmental impact from all stages of the product life cycle and provides a comprehensive picture of environmental conditions [3].
The key application of the LCA method is to support the search for new solutions that will ensure a balance between economic development and environmental protection. Optimization in terms of ecology, energy, and economy can be achieved by rationalizing the use of resources and all kinds of activities aimed at reducing the amount of pollution and waste. The rationalization of resource consumption is based on reducing the material and energy consumption of the processes taking place at each stage of the life cycle. Among them, the design and production stage is of particular importance, because it is then that decisions are made that affect the course of the further part of the cycle and, consequently, have a significant impact on the overall ecological and energy characteristics of a car tire. For this reason, particular attention during this research will be focused on the differences in the potential environmental impact of the production stage of traditional versus ecological car tires [4].
The main purpose of this work was to analyze the car tire manufacturing process with the use of the LCA method. Secondly, the study aimed to show the capacity of the LCA method to determine the tire production process parameters that will mitigate adverse environmental impacts in their entire life cycle horizon.

2. Life Cycle of a Car Tires

2.1. The Production Stage

The design of a modern car tire is an intricate and complex structural process that combines a number of rubber, steel, and textile elements. Each of these materials displays different characteristics that impart a specifically selected set of properties, e.g., shape, stiffness, strength, vibration damping, heat, and electrostatic charges dissipation [5]. Each manufactured tire is expected to perform according to the design specifications; hence, the choice and quality of materials are equally important as the manufacturing technology. Tires are elements that play an absolutely critical role in ensuring the safety of the driver and passengers, which is why it is essential that their production process is performed in accordance with applicable requirements and the product undergoes specialist tests [6]. The product damage in manufacturing usually occurs at the interface of two heterogeneous materials and is categorized as inner, outer, sidewall, tread face, or shoulder damage [7]. The tire is a system combining up to 20 different basic and supplementary elements that affect car handling. The components of the tire are shown in Table 1.
Depending on the class of the tire, it is reinforced with a range of supplementary elements, including insulation inserts, zero-degree belt, chafer strip, bead reinforcements, insolation bundle, sidewall reinforcement, and undertread [10,11]. After the designing, documentation, and prototyping stages, the tire components are prepared. With the top product quality in mind, all materials should be carefully selected on the basis of their respective physical and chemical properties, size, thickness, cutting angles, etc. Design specifications must be observed at every production plant, regardless of its location, thus ensuring that the same tire types provide the same performance, regardless of the place of manufacture [10].
The structure of rubber compounds is carefully adjusted to impart desired properties to the tire, so as to ensure its proper functioning and so that it will serve its intended purpose, e.g., a different compound is used in a summer versus winter tire. Moreover, rubber compounds of specially engineered properties build different parts of the tire, such as the sidewalls, the inner liner, or fillers in the bead zone, all of which are made of various types of rubber compounds. The compounds typically include the following materials: synthetic rubbers (butyl, SBR, BR), natural rubbers, oils, fillers (silica, soot), Sulphur, resins, anti-aging agents (antioxidants), vulcanization accelerators, and other agents as per specific requirements. The approximate material consumption involved in producing 1000 kg of tread rubber compound for a passenger car tire is 500 kg of rubber (mainly synthetic), 150 kg of silica, 150 kg of carbon black, 20 kg of Sulphur, 20 kg of resin, 100 kg of oils, and about 60 kg of other components [12,13]. All the ingredients are machine-mixed, their quantity and the adding sequence being crucial, until a homogeneous mass is obtained. The prepared compound is formed into plates or ribbons, whose dimensions facilitate their use in the subsequent stages of production. The compound surface is next coated with a release agent, for easier separation of rubber layers in the later stages, and the rubber compound material itself is subjected to accuracy measurements and analyses to verify its compliance with the design specifications [14]. An integral part of the tire design are the steel and textile cords. They form a carcass of the tire, which guarantees its required stiffness and shape, and which translates into a desired level of performance while driving. A single thread of a textile cord is made of twisted weaves of a large number of ultra-thin viscose, nylon, aramid, and polyester fibers (a single 195/65 R15 tire contains between 1500 and 1800 threads) [15]. The purpose of bead wires is to enable mounting a tire on a rim. There are several technologies for their production. They may come in the form of rings formed by braiding several wires with a round cross-section or by winding several layers of tape. The beads consist of separate wires of a rectangular or polygonal cross-section, coated in a rubber compound. Having all the components collected and prepared in advance, the confection stage may commence. The tire building process consists of arranging the pre-products in a strictly controlled sequence. Depending on the technology, a raw tire is obtained in a one- or two-stage process, which is followed by vulcanization in special molds, and then quality control [16,17]. The flowchart in Figure 1 presents the car tire production process.
As mentioned, the technologies used by tire manufacturers involve one or two stages. In the former case, the entire tire is produced on a single machine; in the latter, the carcass is typically put together in the first stage, and the basic and supplementary layers and technologies (belt, tread, etc.) are fitted consecutively [17]. The layers of the tire are laid flat inside a drum, which is next filled with air, the pressure of which causes the layers to bond. In the next stage, the structure is subjected to rolling, which shapes the tire, ensures the strong bonding of components and guarantees the removal of excess air that could become trapped between the components. The process output is the raw tire, which undergoes dimensional and shape control tests for errors [15].
After successfully passing the control step, in the next stage of production, the raw tires are placed in vulcanization presses, where vulcanization molds are fitted. The molds typically have a container structure, i.e., their elements form two sides of the mold. The rings form the sidewalls and impress the branding and other inscriptions, while the side protrusions form the groove and sipes in the tread. The two halves of the rings are each responsible for the half of the tread on one side. The tire is treated with high temperatures (in excess of 150 °C), while the pneumatic load presses the tire against the sides and the protrusions of the mold. In the thermoplastic melt-freeze process, the rubber transits to fluid (thus acquiring the shape of the mold) and eventually becomes elastic. Following the treatment, the tire remains in the mold for 10 minutes and then removed to cool down [17,18].
The final quality inspection includes a variety of tests. The visual assessment of the tire condition detects any foreign bodies that might have become trapped between the layers. This is followed by an X-ray inspection of the interior structure that aims to ensure that no defects or internal damage is present, and additional analyses that involve testing the mass, shape, and rigidity parameters, heterogeneity criteria, radial force measurements, conicity, and other parameters whose uniformity ensures the safety and comfort of driving. The tires are also cut across to assess the product’s compliance with the design specifications, which would otherwise impair their safety and performance properties [17].
Modern tire constructions tend to incorporate composites that combine various material properties, thus eliminating the disadvantages of particular compounds. As a result, new tire designs can conform to the challenges of constantly rising environmental and operational requirements [17,19].

2.2. The Use Stage

Each element of the tire can have a significant impact on fuel consumption and also on the reduction or increase of the negative environmental impact. On 1 November 2012, the obligation to label car tires was introduced in the European Union. The labels provide information on the most important aspects of tire performance, such as rolling resistance, wet grip, and noise emissions allowing for the quick and easy comparison of different products. They are designed to encourage manufacturers to act towards reducing rolling resistance, which leads to a reduction in carbon dioxide emissions to the atmosphere. Tires, mainly due to the rolling resistance, are responsible for 20–30% of the fuel consumption in passenger cars. Reducing fuel consumption allows for the reduction of the emission of CO2 and other harmful compounds into the environment. The other parameters on the labels are intended to force tire manufacturers to care for all performance metrics equally. Labels are to encourage consumers to make more informed choices and mobilize manufacturers to create products of the highest quality [20].
Tire wear contributes significantly to the flow of (micro) plastics into the environment. The particles generated during their use, emitted on the roads, can be dispersed in the environment through various routes. Smaller ones are usually emitted into the air, while large particles settle on the road surface and due to rainwater runoff, get into the soil, sewage, and surface waters. It is estimated that the relative share of tire wear in the total global amount of plastics ending up in our oceans is 5–10%. In the air, 3–7% of particulate matter (PM2.5) is made up of tire wear, indicating that it can contribute to the global health burden of air pollution, which can only be effectively addressed if awareness increases in this area [21].

2.3. The End of Life Management

Car tires are the largest source of post-consumer rubber products. For years, however, the number of tires withdrawn from use has increased, causing a negative impact on the environment. However, nowadays, the application of the principles of sustainable development implies a new approach to waste using environmentally friendly concepts, and it is necessary to re-evaluate the possibilities of managing this waste in order to increase its use and reduce the amount that requires disposal or storage. To this end, a waste hierarchy should be followed, focusing on reuse, recycling, and recovery, and disposal should be interpreted as the last available option corresponding to the highest level of loss and change in resources. The disposal of used tires is a global environmental problem due to the large number of tires produced each year; according to ETRMA, around 3.4 million tons of used tires are produced in Europe annually. There are three main lines of action aimed at solving the problem of used tires: extension of service life through increased durability and retreading, material recycling, and energy recovery. A certain number of tires can also be used in full [22,23,24].
Due to their durability, used tires constitute nuisance waste and should be used industrially. They do not degrade in the environment within 100 years. They must not be left in landfills because their accumulation in large quantities is a fire hazard. Recycling tires is a difficult process due to their composition and construction. In addition to rubber, they contain textile and steel cords that must be properly separated. Used tires that are no longer suitable for retreading are waste. Therefore, they should be managed in an environmentally safe manner. For this purpose, the most frequently used methods are the ones involving product or material recycling. Whole, compressed, or cut worn tires have many applications, including their shape, material characteristics, and ability to absorb impacts or noise are used [22,25]. Used car tires can be also used by burning them in cement plants or other energy installations. The obtained heat is used in many technological processes, e.g., for burning clinker in cement kilns. The calorific value of rubber can be compared to the calorific value of coal. The use of used tires as fuel in the production of cement is considered a waste-free method of managing large amounts of this type of waste, because the tires burn completely without slag or ash remains. The metals contained in the tire permanently adhere to the clinker, improving its properties [26].
The adoption of three directives by the European Parliament, Landfill 1999/31/EC, End-of-Life Vehicle 2000/53/EC, and Waste Incineration 2000/73/EC have had a major impact on the management of used tires in the EU. The Landfill Directive 1999/31/EC introduced a ban on the disposal of whole used tires from July 2003, and from July 2006, on shredded tires. Moreover, it obliges the member states to create conditions enabling the implementation of this intention. The End-of-Life Vehicle Directive 2000/53/EC requires tires to be removed from vehicles prior to scrapping. The third of the Waste Incineration Directive 2000/73/EC obliges cement plants that use tires as a supplementary fuel to obtain lower limits for the pollutant content in the waste gases [27].
The issues of post-consumer management are more often being considered when analyzing all the earlier stages of the life cycle. Tire manufacturers should, as much as possible, prevent or reduce waste and harmful negative impacts on the environment, not only during the production of tires but also after their end of life [28].

3. Materials and Methods

3.1. Object and Plan of Analysis

The objects of the study were two 205/55/R16 tires designated for use in passenger cars. The first specimen was produced using a traditional manufacturing technology, the other was the modern eco-tire.
Until recently, the first three stages of the tire life cycle (design, manufacturing, and use) were of interest to people only in the economic dimension. The framework for the minimization of the environmental impact occurring in the life cycle of industrial products is rooted in the concept of Life Cycle Thinking (LCT). It is one of the concepts recommended by the European Commission that are instrumental in achieving sustainable development. Its purpose is to foster positive change in manufacturing by reducing the environmental impact of processes and manufactured products. Currently, the EU is promoting mechanisms aimed at stimulating the manufacturing of environmentally sound products with a view to improve the condition of the European natural environment and boost the attractiveness and position of EU in the world. Therefore, the notion of seeking methods to minimize the environmental impact of products and services throughout their entire life cycle is consistent with the policies of the European Commission. The basic assumption is to implement intervention measures predominantly at the life cycle stages that exhibit the highest potential for reducing the negative impact on the environment [29,30,31,32]. Therefore, the focus of this work is on establishing which stages and factors of the car tire life cycle display the biggest potential for sustainability-driven improvement. From the design, to manufacture, utilization, and to post-consumer waste management, a product life is essentially a cycle, which is why the term “life cycle” is commonly applied to all products, including car tires. The concept of life cycle management (LCM) has an important practical dimension, but at the same time it is a way to introduce life cycle thinking into business practices. Its main goal is to manage the company’s operations and its products in such a way as to ensure more and more sustainable production and consumption [33,34]. A growing concern for nature leads to the development and use of increasingly complex methods to reduce the burden on the environment, hence, the development of methodologies for the assessment of the environmental impact of processes, products, and industries. One of the methods in question, the Life Cycle Assessment (LCA), applies a holistic approach to the product, which includes its impact from the acquisition of raw materials, through production and use, to final post-consumer waste utilization. It covers the environmental impact of all life cycle stages and is in line with the principles of sustainable development [35,36,37,38].
The point of reference for the analysis carried out in the subsequent sections was provided by the regulations and recommendations set out in the ISO 14040 group of International Standards. All four LCA phases were completed: the goal and scope definition, inventory analysis, impact assessment, and interpretation (Figure 2) [31].

3.2. Four Steps of the Analysis

One of the possible applications of the LCA method is the assessment of production technology from the point of view of its impact on the natural environment. The aim of the analysis was to compare the environmental impacts associated with the life cycle of two different types of tires based on different manufacturing technologies. Therefore, the conducted analysis is classified as a type of comparative analysis. It has been used to determine whether there are differences in the magnitude of the environmental impact generated during the life cycles of selected car tires produced based on two different technologies. The change of the production technology of traditional tires to ecological tires has taken place in the last few years and is mainly related to the materials and materials used in their production. The key issues of the conducted analysis concern environmental effects [36,39]. The goal of the analysis was firstly to provide the description of the status quo of the industry (retrospective LCA), and secondly, to study the potential future consequences and determine recommendations for the development of more environmentally friendly solutions (prospective LCA). The procedure follows an LCA methodology whose purpose is to determine the extent of the negative environmental impact of a given object’s life cycle. To that end, all four LCA phases were conducted. In the LCA analysis, two terms are particularly important: function and functional unit. In many cases, it is not possible to simply compare product A and product B as they may have different performance characteristics. The system boundaries are not always easy to define and the assumptions made during the process maybe not consistent, resulting in challenges when comparing between different results. Moreover, in most of the published cases of study, the LCA of a process, product, or service is retrospective (measured/estimated data) rather than prospective (forecasted data). Therefore, it does not typically relate to broad steps such as design, development, research, and education that can tremendously change the life cycle or even improving it by considering the prevention or reduction of manufacturing [38,39]. In a general sense, the analysis serves to estimate the potential environmental burden associated with the way that a given product performs its specific function. If possible and justified, a time frame should also be included in the functional unit. The functional unit is the quantified performance of a product system that serves as the reference unit in the life cycle analysis. The reference flow is a measure of the outputs from processes in the product system required to perform the function expressed by the functional unit. If the LCA analysis covers the entire life cycle, it is recommended that the functional unit from the product use stage be considered, as it will most comprehensively express and capture the essence of the function [40].
Due to the fact that both the analyzed products in this study are passenger vehicle tires performing in the same area of applications, it was resolved that the function would refer to this aspect. It was defined as covering the distance of 50,000 kilometers over a period of 5 years in an average style of driving.
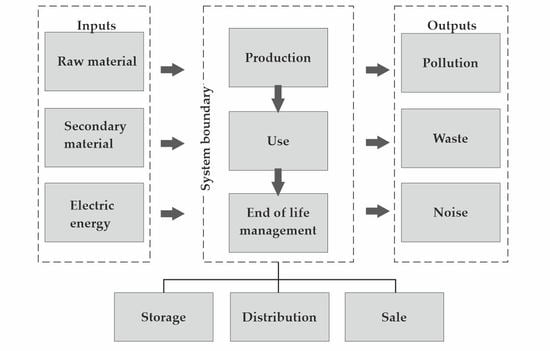
The key issue investigated in the course of this analysis was to highlight the differences in the environmental burden between the two products that result from changes in the manufacturing process and raw materials consumed by their production processes. The geographic and time frame of the data was the same and it was the technological scope that was different. Given that the company providing the data is in Europe and has a well-established position on the market, the considered geographic range is also Europe. The time frame encompassed the same range because both traditional and ecological car tires are currently in continuous production. From the spatial dimension perspective, no relevant impact is noted since both products are produced at the same tire manufacturing site, however, with the implementation of different production methods. This is the technology of manufacturing—traditional or ecological—that produces tires of specific and different parameters. Making certain exclusions in LCA analyses is almost always necessary. The cut-off criteria are either specified by value choices or may be dictated by independent factors, such as data gaps. In any case, several parameters are distinguished for specifying the cut-off rules, the most popular of which are exemptions based on the criterion of the mass percentage share in the total physical output and the percentage share in the total economic value of the output. The cut-off criteria enable selecting and specifying the key elements of the system and simplify both the model and the analysis. However, the exclusions should be clearly defined and described [41,42,43]. Storage, distribution, sales, and technical testing processes were outside of the scope of this study.

3.3. Life Cycle Inventory—LCI

The life cycle inventory analysis (LCI) constituted the second phase of LCA, which is the analysis of the set of inputs and outputs. This model represents the product system structure, and its smallest elements are unit processes. A unit process is the smallest component of the product system for which data are collected. What is more, the processes are connected by material and energy flows. All individual unit processes represented in the model were subjected to a completeness check and evaluation, performed using the material and energy balancing. The data were acquired according to inventory types and collected in the inventory table. Data collection provides additional background information regarding the source of origin, geographic range, age, etc. Therefore, the acquired data help determine the spatial and temporal location of the problems. However, the key classification criterion at this stage was the fact of belonging to the inventory of the studied system. In consequence, the problems were not assigned to a time or place, which, furthermore, is the reason why LCA is considered to be a so-called general technique. During analysis, the collection of data is adapted to model requirements and the impact category indicator (Figure 3) [43,44,45].
The research conducted within this study was carried out with the use of SimaPro 8.4.1 Software. The data were mostly acquired from tire manufacturers, however, the data related to processes and materials, less relevant for the assessment of environmental burden, were derived from the Ecoinvent 3.4 database (a component of SimaPro product).
The aggregation of data concludes this phase and introduces the subsequent stage—LCIA [45].

3.4. Life Cycle Impact Assessment—LCIA

In essence, the primary function of the Life Cycle Impact Assessment (LCIA) stage is to determine the impact of the lifecycle of a given product on the environment. The differences in the methodologies of various approaches to LCA are principally concerned with the LCIA phase. Inventory analysis is focused on quantifying the environmental burden, and its reliability is relative to data quality and the choice of criteria and assumptions for building the product system [42,46].
LCIA consists of mandatory and optional elements. Mandatory elements include defining impact categories, category indicators, characterization models as well as classification and characterization, whereas among optional elements there are normalization, grouping, weighting, and data quality analysis. While the sequence of obligatory elements is strictly defined and should be followed as is during the analysis, with regards to the optional elements, the question is whether and which steps are to be taken. If the results from the analysis are to be publicized, normalization and weighting are typically omitted, and the interpretation is performed at the level of the LCIA environmental profile (impact categories). Although this results in the loss of transparency and increases the difficulty of the analysis, it does carry a positive outcome, specifically, the results are deprived of subjectivity [47,48].
The results from the LCIA phase are presented in Section 4.

3.4.1. Eco-Indicator 99

The Eco-indicator 99 method (EI99) is a representative of the endpoint methods for environmental impact modeling and assessment. The characterization process defines the environment through the perspective of three main categories of damage, also referred to as environmental damage endpoints: Human Health, Ecosystem Quality, and Resources, which are further described by 11 impact points. The results from the EI99 analysis of impact points are subject to further processing—normalizing, grouping and weighting to obtain a single-score indicator, expressed in Eco-indicator points (Pt). The scale is adjusted so that one point reflects one-thousandth of the annual environmental load of an average European inhabitant [49].
Human health, one of the three damage categories recognized in the EI99 method, distinguishes five effects: climate change, ozone layer depletion, carcinogenic effect, respiratory involvement, and ionizing radiation. Deciding on an indicator of the impact area from among the endpoints of the environmental mechanism enables one to define a common unit for all adverse effects to human health. Environmental damage can be responsible for a number of disorders, which is why it requires certain means for the quantification of differences between them, hence the DALY scale. Disability Adjusted Life Years (DALY) assigns binary weights to diseases, where 0 denotes ideal health and 1 death. DALY is derived from the number of year life lost due to premature death or the number of years lived disabled [49,50,51].
Damage to ecosystem quality is significantly more diverse and less homogeneous compared to the impact on human health. It is expressed as the loss of certain species in a given area. Currently, a temporary solution is in use that allows converting between PAF (Potentially Affected Fraction) and PDF (Potentially Disappeared Fraction) units. This method cuts off and limits the considered groups of species because, theoretically, all species could be in danger of extinction. Three impact categories are considered in damage to ecosystem quality: ecotoxicity, acidification/eutrophication, and land use [30].
Modeling within the third area of ecological burden, resources, involves resource and damage analysis. Eco-indicator 99 accounts exclusively for mineral resources and fossil fuels. The quantification of damage pertaining to this category necessitated introducing a special indicator, surplus energy, expressed in MJ, which is analogous to DALY, PAF, and PDF. The higher the surplus energy—being a derivative of the decrease in concentration—the lower the quality of the resource (Figure 4) [50,51].

3.4.2. Cumulative Energy Demand (CED)

Cumulative Energy Demand is expressed in MJ-Eq and describes environmental burden through 7 damage categories: 2 non-renewable sources (nuclear energy and fossil fuels) and 5 renewable sources (solar, water, wind, geothermal, and biomass) [52].

3.4.3. IPCC

The scientific assessment method developed by the Intergovernmental Panel on Climate Change, Global Warming Potential (IPCC), serves as a quantitative assessment tool for expressing the contribution of particular greenhouse gases (GHG) to the greenhouse effect, relative to carbon dioxide. The time horizon is 20, 100, or 500 years. The total greenhouse effect damage indicator related to CO2 is equal to 1 [49,52].

3.4.4. Interpretation

Life cycle interpretation identifies in quantitative terms the relevance of findings from LCA, specifically, the disaggregation of results obtained at the LCI stage, characterization, normalization, grouping, or weighting, to specific components [30,36]. The data for the analysis were acquired directly from the car tire manufacturer and a recycling company, whereas the remaining data was derived from the SimaPro databases (PréConsultants, Amersfoort, The Netherlands).
A detailed interpretation of the results obtained from the analysis is given in Section 4 and Section 5.

4. Results and Discussion

The results are summarized in three sections, corresponding to the respective assessment methods Eco-indicator 99 (Section 4.1), CED (Section 4.2), and IPCC (Section 4.3). The results from the characterization stage are given in Table 2, and from the grouping and weighting stages in Table 3, Table 4, Table 5, Table 6, Table 7 and Table 8 and Figure 5, Figure 6, Figure 7, Figure 8, Figure 9 and Figure 10. The results describe each stage of traditional and ecological tire life cycles, accounting for their total life cycle impact and five environmental damage categories eliciting the highest levels of detrimental effects established in the study: carcinogens, respiratory inorganics, climate change, acidification/eutrophication, and fossil fuels. The outcomes of the study are the environmental factors quantified as eco-indicator points (Pt), i.e., easily comprehensible parameters facilitating the comparative analysis of dissimilar environmental impacts. One thousand points express an annual impact of an average European resident on the environment.

4.1. Eco-Indicator 99

Table 2 presents the results of the characterization of environmental consequences occurring in the material life cycle of a traditional and ecological car tire based on impact categories. Among substances detrimental to human health, these were the inorganic compounds causing respiratory diseases that were established to have the highest negative impact. Their maximum emissions levels were obtained in the use-stage of the traditional tire (1.09 × 10⁻³ DALY). The analyses indicate that the recycling processes would result in the reduction of their environmental impact over the entire life by a total of 8.54 × 10⁻⁷ DALY, and in the case of the ecological tire by a total of 1.49 × 10⁻⁶ DALY. Among the factors of a negative effect on animal health and life, ecotoxic substances were determined to be the leading cause of hazard. Their emissions reach the highest level in the production of the traditional tire (2.90 × 10 PAF × m2 × year). Recycling at the end of the product use stage of the life cycle would minimized the negative impact by 2.87 × 10⁻¹ × PAF × m2 × year in the conventional tire and 4.66 × 10⁻¹ × PAF × m2 × year in the eco-tire. Considering the hazards to plant organisms, the strongest negative effect is concerned with acidification or eutrophication of the natural environment. The highest level of the compound emissions responsible for these effects relate to the use of the traditional tire (3.64 × 10 PDF × m2 × year). Recycling would reduce the negative impact by a total of 4.45 × 10⁻² PDF × m2 × year (the traditional tire) and by −7.83 × 10⁻² × PDF × m2 × year (the ecological tire). Considering elevated energy consumption on account of raw material extraction, the highest level of harmful impact in this respect was recorded in fossil fuels. As in the previous cases, the most resource-engaging phase was the use of the traditional tire (4.11 × 10³ MJ). It was estimated that over the entire life cycle of the traditional tire, recycling would introduce total energy savings amounting to 5.95 MJ, and in the eco-tire 8.32 MJ.
One of the key purposes of LCM is to determine elements in the life cycle of a given product that exert the heaviest impact on the environment. In traditional and ecological tires, the impact categories that were shown to have the most substantial negative consequences for the environment are, in the order of magnitude, the extraction of fossil fuels (an aggregate score for the traditional tire was 100.87 Pt and 94.82 Pt for the eco-tire), emissions of respiratory inorganic substances (33.32 Pt—the traditional tire, 30.71 Pt—the eco-tire), emissions of compounds causing climate change (14.19 Pt—the traditional tire, 13.14—the eco-tire), and acidification/eutrophication emissions (3.21 Pt—the traditional tire, 2.97 Pt—the eco-tire). For both tire technologies, the highest negative emission rates occurred in the use stage (Figure 5).
Table 3 shows the grouping and weighting results concerning the environmental impact at particular stages of the traditional and ecological tire life cycle, divided into impact categories. The negative environmental impact was the highest in the fossil fuel extraction. The total ecological burden of this activity was estimated in the traditional tire at 97.8 Pt, and 92.7 Pt in the case of the eco-tire technology. Recycling is likely to cause a 0.14 Pt reduction in the environmental impact of the traditional tire life cycle, and a 0.2 Pt decrease in the ecological tire. Considering the secondary factors, it was found that inorganic substances linked to respiratory diseases and compounds that cause climate change also exhibit a particularly adverse impact on the environment. For both categories, the strongest negative effect rates were calculated in the tire use stage. On the other hand, the category that displayed the lowest ecological threat concerned compounds contributing to the ozone layer depletion in the traditional and ecological tire life cycle.
The grouping and weighting of consequences to the environment for carcinogens with respect to the products life cycles are shown in Table 4 and Figure 6. Unlike in the previously reported results, the highest hazard on the part of carcinogens was determined for the production stage of the tires’ life cycle: 1.51 Pt for the traditional tire and 1.17 Pt for the ecological tire. Considering particular chemicals, arsenic and cadmium ion emissions were found to reach particularly high levels, specifically, for As ions: 1.35 Pt (the traditional tire) and 1.05 Pt (the eco-tire), and for Cd ions: 0.12 Pt (the traditional tire) and 0.11 Pt (the ecological tire). The emissions levels could be improved by recycling, which would drive the decrease in the ecological burden of the entire life cycle of traditional tires by as much as 4.62 × 10⁻³ Pt (As ions) and 1.35 × 10⁻⁴ Pt (Cd ions). Exposure to arsenic compounds results in gastrointestinal irritation, vomiting and diarrhea, as well as skin lesions. In extreme cases, it can lead to death. Long-term exposure most often causes vascular diseases and the development of lung, skin, liver, kidney, and bladder cancer. Arsenic is usually present in the presence of other heavy metals, which increases the risk of interactions between them [50]. The toxic effect of cadmium is mainly related to its presence in the body in the form of free cadmium ions. It causes chronic poisoning, affects the metabolism of calcium and phosphorus compounds, and damages the proper mineralization of bones, increasing their fragility. Its harmful influence mainly affects the excretory and respiratory systems and the circulatory system [53,54].
Several observations emerge from the results of grouping and weighting performed to determine the environmental consequences resulting from the emissions of respiratory inorganic compounds throughout the traditional and ecological tire life cycle (Table 5 and Figure 7). The emission hazard was the highest in the tire use stage, amounting to 28.38 Pt in the case of the traditional tire and 26.89 Pt for the ecological tire. Sulphur oxide and nitrogen dioxide emissions were shown to constitute the greatest threat to health. For the former, they were 15.8 Pt (the traditional tire) and 15.0 Pt (the ecological tire), and for the latter 10.0 Pt (the traditional tire) and 9.49 Pt (the ecological tire), respectively. In both tires, recycling in the post-consumer waste management phase could bring in the drop in the harmful effect of Sulphur oxide by 4.07 × 10⁻³ Pt in relation to the life cycle of the traditional tire and by 3.60 × 10⁻³ Pt—the ecological tire. Sulphur dioxide is one of the most dangerous air pollutants. It is a colorless, highly toxic gas with a suffocating odor. Its high concentration in the air can damage the respiratory tract, while in plants it causes the death of leaves, reacting with water vapor or water droplets in clouds creates sulfuric acid, and forms sulphates with dust. Sulphur oxides also contribute to the occurrence of acid rain. The influence of nitrogen oxides also significantly affects the quality of the atmospheric air. Nitrogen dioxide (NO2) is commonly found in work and municipal environments, resulting from the combustion of nitrogen-containing organic substances. Acute nitrogen dioxide poisoning causes pulmonary edema which can be fatal. Moreover, this compound may act clastogenic and contribute to the development of neoplasms. Sulphur compounds and NOx are the main components of London-type smog [55].
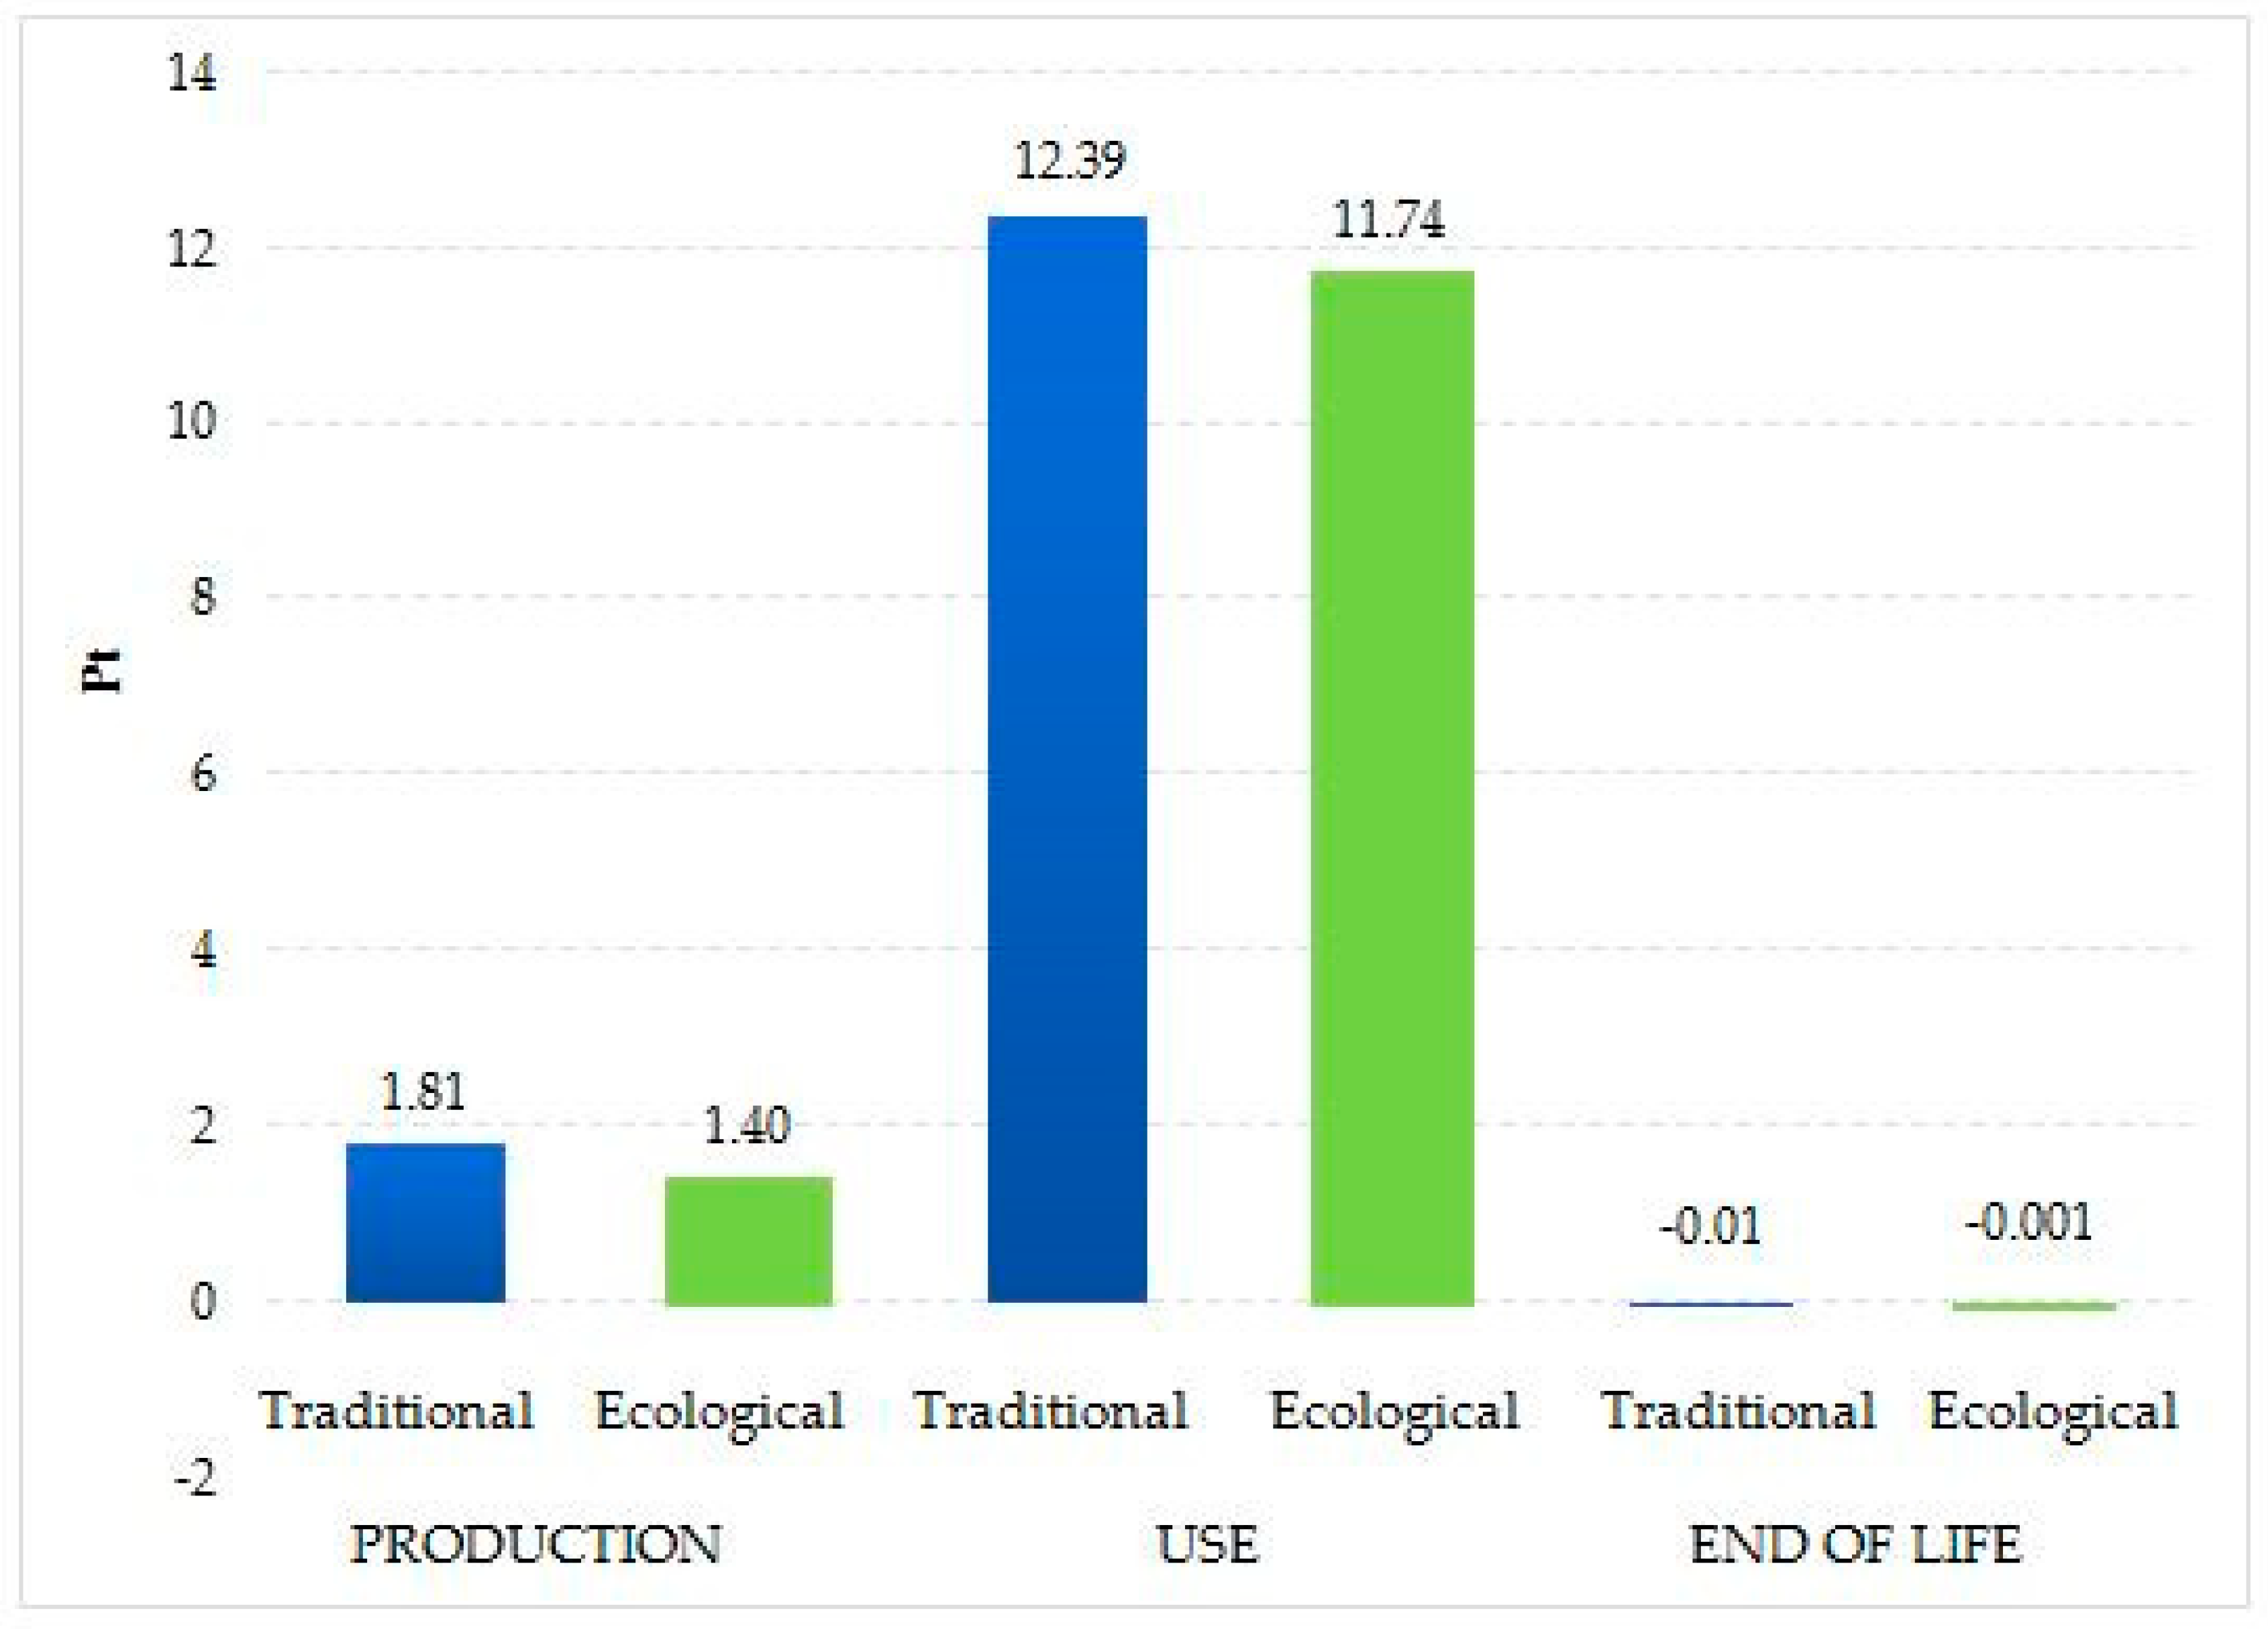
Table 6 and Figure 8 contain the results of grouping and weighting the environmental burden concerned with the emission of hazardous compounds—potential climate change factors. In the category of impact in question, the source of the most critical environmental impact should be traced to the stage of tire use: 12.39 Pt in the traditional tire technology and 11.74 Pt in the eco-tire life cycle. The highest emission levels were displayed for carbon dioxide. Recycling would curb the detrimental effect of carbon dioxide on the environment by 1.03 × 10⁻² Pt in the life cycle of the traditional tire and by 1.24 × 10⁻³ Pt for the ecological tire. There are many risks to human health in a car tire plant. The increase in the amount of this poisonous gas in the room negatively affects the well-being of employees. Carbon dioxide is a colorless, odorless, and non-flammable gas. It is heavier than air and has a choking effect on humans, but in low concentration it is not toxic to the human body. Therefore, it should be ensured that the chemical composition of the air in the production plant is slightly different from the natural (fresh) air. The increase in carbon dioxide content in the room causes the worker to have an adverse effect of hyperventilation, i.e., abnormal and rapid breathing. At higher concentrations, it may lead to unconsciousness and even loss of life [54,55].
Table 7 and Figure 9 report the results of grouping and weighting the environmental effect of acidification/eutrophication agents linked to the traditional and ecological car tire life cycle. The direst consequences were linked to the tire use-stage, which was where the highest values of the eco-indicator points were estimated: 2.84 Pt for the conventional tire manufacturing technology and 2.69 Pt for the ecological tire. Among the compounds promoting acidification/eutrophication, nitrogen dioxide (1.76 × 10⁻³ Pt traditional tire, 2.72 × 10⁻³ ecological tire) and Sulphur oxide (7.61 × 10⁻⁴ Pt traditional tire) displayed particularly high ecological damage rates. If implemented, the post-consumer waste management of car tires could help reduce the detrimental impact of Sulphur oxide emissions over the entire life cycle of the traditional tire by 2.32 × 10⁻⁴ Pt and the ecological tire by 2.06 × 10⁻⁴ Pt.
Grouping and weighting results of the environmental consequences of fossil fuel mining that occur in the traditional and ecological car tire life cycle are presented in Table 8 and Figure 10. The highest negative environmental impact was observed in the use-stage of both products’ life cycles: 97.83 Pt for the traditional tire design and 92.69 Pt for the ecological tire. Among the investigated processes, natural gas production exhibited a particularly high detrimental effect on the environment. The quantified effect of this factor was estimated at 97.69 Pt in the traditional tire manufacturing and 92.55 Pt in the ecological one.

4.2. CED

The highest energy consumption was recorded at the use-stage of the car tire life cycle. The most likely explanation for this observation is that setting the car in motion requires burning, in aggregate, extensive amounts of non-renewable fossil fuels. By reducing the fuel consumption, eco-friendly tires improve the average mileage, which translates into energy savings of 1500 MJ within a single life cycle. A similar mechanism is observed during the tire manufacturing stage—the technological process of one ecological tire production consumes 995 MJ energy less compared to the traditional tire manufacturing product (Figure 11).

4.3. IPCC

The consumption of non-renewable fuels throughout the car tire use period is inherent in the emission of greenhouse gases in the atmosphere. In fact, any action to reduce the pollution rates will be considered positive from the perspective of climate protection. Fitting cars with environmentally friendly tires could potentially reduce harmful emissions by 119 kg CO2eq compared to traditional tires (Figure 12). However, it would be the replacement of conventional fuels that power cars with renewable energy sources that would be sure to reduce the extent of the environmental burden throughout the life cycle of both conventional and green tires.

5. Summary and Conclusions

Tire manufacturing is a complex process with a multiple-stage execution. Manufacturers follow in-house production standards and procedures, which explicitly specify the entire process from the acquisition of raw resources to quality management. Faulty quality control could contribute to the emergence of hidden defects in both material quality and dimensional and shape accuracy. While the defects may be visible in a tire at purchase, they could also emerge in use, thereby contributing to the deterioration of operating conditions and travel comfort [52,53].
Manufacturing activities have a significant (usually negative) impact on the environment, including due to the consumption of natural resources, emissions of harmful substances, and the generation of waste. The level of air quality is significantly lower, generating many threats to human health. Air pollution associated with the production of car tires is a serious health risk because it shortens life expectancy and contributes to the occurrence of many diseases, including heart disease, respiratory disease, and cancer. Inhaling air with a high content of harmful substances not only causes health problems of varying severity but can even cause death in the long term.
The aim of the work was achieved owing to the use of LCA as an effective tool for the environmental production of car tires made in a traditional and ecological manner. The conducted research shows that a tire made in accordance with the traditional technology generates more negative consequences for the environment compared to an ecological tire. This is due to a larger (by about 20%) amount of materials used in its production. The most harmful environmental impact at the manufacturing stage is due to the high level of consumption of the constantly depleting natural resources that are necessary in the manufacturing process of car tires. The extraction of fossil fuels is an important cause of environmental degradation and deterioration of human health.
As it results from the analyses, the key factor generating the most negative environmental consequences (apart from manufacturing) is the operation stage. The use of unconventional, renewable energy sources to power a passenger car could significantly contribute to reducing the negative impact on the environment (e.g., by reducing the impact of fossil fuel extraction and the processes of obtaining energy from them).
Considering the economies of scale, i.e., the number of passenger cars registered in Europe, the use of environmentally friendly (lighter weight) tires would save a large amount of material resources needed at the manufacturing stage. This would translate, in a broader perspective, into the improvement of the environment. The possibility of obtaining conventional energy resources is becoming more difficult and more limited. The extraction of coal and crude oil and their combustion, in addition to the negative impact on the greenhouse effect and air purity, also causes irreversible damage to the landscape, land, and disturbances in the management of groundwater and ecosystems.
The results of the conducted research show that the processes related to the extraction of fossil fuels and emissions of inorganic compounds causing respiratory diseases, but also emissions of compounds causing climate change, compounds causing acidification/eutrophication, and carcinogens cause the most negative environmental consequences.
However, it is possible to control the production process of car tires in such a way as to limit its negative impact on the environment. For this purpose, it is possible to:
-
increase the importance of renewable raw materials in production processes, e.g., by obtaining rubber from plants such as Guayule instead of only traditional rubber tree, as well as replacing fossil raw materials with renewable materials, e.g., synthetic rubber from petroleum can be made from butadiene produced on the basis of bioethanol, fillers currently produced from crude oil or coal can be produced from vegetable fats and oils or obtaining silica from inedible rice husk, which is now intended for burning;
-
create a tire design that allows for easier separation of individual materials that will be easy to identify during development after use;
-
minimize the energy consumption and material consumption of the manufacturing, use, and post-use disposal of tires;
-
precisely verify the life cycle scenarios of various types of car tires in real conditions, taking into account various models of post-use management.

Author Contributions

Conceptualization, P.K. and P.I.; methodology, P.K., P.I., B.-W.P., K.W. and T.A.; software, P.K., P.I., B.-W.P. and K.W.; validation, P.I. and B.-W.P.; formal analysis, P.K., B.-W.P. and K.W.; investigation P.I., B.-W.P., K.W. and T.A.; resources, P.K. and P.I.; data curation, P.I., B.-W.P. and T.A.; writing—original draft preparation, P.K., P.I.; writing—review and editing, P.K., B.-W.P., and T.A.; visualization, P.I., B.-W.P. and K.W.; supervision, P.K., P.I., and T.A.; project administration, P.K. and P.I. All authors have read and agreed to the published version of the manuscript.

Funding

This research received no external funding.

Conflicts of Interest

The authors declare no conflict of interest.

References

  1. Kłos, Z. Introduction of environmental aspects in designing of machines. In MATEC Web of Conferences; EDP Sciences: Paris, France, 2019; Volume 254. [Google Scholar]
  2. Guinée, J.; Heijungs, R.; Huppes, G.; Zamagni, A.; Masoni, P.; Buonamici, R.; Rydberg, T. Life cycle assessment: Past, present, and future. Environ. Sci. Technol. 2011, 1, 90–96. [Google Scholar] [CrossRef] [PubMed]
  3. Ram, A.; Sharma, P. A Study on Life Cycle Assessment, ICNASET, February 24–25; Madhav University: Sirohi (Rajasthan), India, 2017. [Google Scholar]
  4. Bałdowska-Witos, P.; Kruszelnicka, W.; Kasner, R.; Tomporowski, A.; Flizikowski, J.; Mrozinski, A. Impact of the plastic bottle production on the natural environment. Part 2. Analysis of data uncertainty in the assessment of the life cycle of plastic beverage bottles using the Monte Carlo technique. Przem. Chem. 2019, 98, 1668–1672. [Google Scholar]
  5. International Organization for Standardization. ISO 4223-1:2017—Definitions of Some Terms Used in the Tire industry—Part. 1: Pneumatic Tires; International Organization for Standardization: Geneva, Switzerland, 2017. [Google Scholar]
  6. Dell’Acqua, G.; De Luca, M.; Prato, C.; Prentkovskis, O.; Junevicius, R. The impact of vehicle movement on exploitation parameters of roads and runways: A short review of the special issue. Transport 2016, 31, 127–132. [Google Scholar] [CrossRef] [Green Version]
  7. Kaka, S.; Himran, S.; Renreng, I.; Sutresman, O. The pneumatic actuators as vertical dynamic load simulators on medium weighted wheel suspension mechanism. J. Phys. Conf. Ser. 2018, 962, 1–9. [Google Scholar] [CrossRef] [Green Version]
  8. Voiku, I.P.; Komissarov, I.A. Double-sided summer-winter vehicle tire: Advantages and prospects ofindustrial production. IOP Conf. Ser. Mater. Sci. Eng. 2020, 709, 3–5. [Google Scholar] [CrossRef]
  9. Arachchige, U.; Sithari, M.; Rangana, H.; Tharakie, G.M.; Tharuka, H. Environmental Pollution by Tire Manufacturing Industry. Int. J. Sci. Technol. Res. 2018, 8, 80–81. [Google Scholar]
  10. Lebreton, B.; Tuma, A. A quantitative approach to assessing the profitability of car and truck tire manufacturing. Int. J. Prod. Econ. 2006, 2, 639–652. [Google Scholar] [CrossRef]
  11. Gratkowski, M.T. Burning characteristics of automotive tires. Fire Technol. 2014, 50, 379–391. [Google Scholar] [CrossRef]
  12. Lopera Perez, J.C.; Kwok, C.Y.; Senetakis, K. Effect of rubber size on the behavior of sand-rubber mixtures: A numerical investigation. Comput. Geotech. 2016, 80, 199–214. [Google Scholar] [CrossRef]
  13. Imbernon, L.; Norvez, S. From landfilling to vitrimer chemistry in rubber life cycle. Europ. Pol. J. 2016, 82, 347–376. [Google Scholar] [CrossRef]
  14. Bokhari, A.; Chuaha, L.F.; Yusup, S.; Klemeš, J.J.; Akbar, M.M.; Kamil, R.N.M. Cleaner production of rubber seed oil methyl ester using a hydrodynamic cavitation: Optimization and parametric study. J. Clean. Prod. 2016, 136, 31–41. [Google Scholar] [CrossRef]
  15. Azimov, Y.; Gilmanshin, I.; Gilmanshina, S. Modern technologies of waste utilization from industrial tire production. In Proceedings of the IOP Conference Series: Materials Science and Engineering, Kazan, Russia, 2–3 December 2015. [Google Scholar]
  16. Sobaszek, Ł.; Gola, A.; Kozłowski, E. Prediction of variable technological operation times in production jobs scheduling. IFAC Pap. 2019, 52, 1301–1306. [Google Scholar] [CrossRef]
  17. Ivan, G. Some aspects of tire impact on environment: Production, service and recycling. Elastomery 2002, 6, 24–38. [Google Scholar]
  18. Kannan, D.; Diabat, A.; Shankar, K.M. Analyzing the drivers of end-of-life tire management using interpretive structural modeling (ISM). The Intern. J. Adv. Manufact. Tech. 2014, 72, 1603–1614. [Google Scholar] [CrossRef]
  19. Rzeźnik, C.; Grześ, Z. Structural materials in agricultural machines. J. Res. Appl. Agric. Eng. 2017, 62, 100–103. [Google Scholar]
  20. Berge, T.; Mioduszewski, P.; Ejsmont, J.; Świeczko-Żurek, B. Reduction of road traffic noise by source measures—Present and future strategies. Noise Control. Eng. J. 2017, 65, 549–559. [Google Scholar] [CrossRef] [Green Version]
  21. Kole, P.J.; Löhr, A.J.; Van Belleghem, F.G.A.J.; Ragas, A.M.J. Wear and tear of tires: A stealthy sourceof microplastics in the environment. Int. J. Environ. Res. Public Health 2017, 14, 1265. [Google Scholar] [CrossRef]
  22. Bulei, C.; Todor, M.P.; Heput, T.; Kiss, I. Directions for material recovery of used tires and their use in the production of new products intended for theindustry of civil construction and pavements. In Proceedings of the International Conference on Applied Sciences (ICAS2017), Hunedoara, Romania, 10–12 May 2017. [Google Scholar]
  23. Uson, A.A.; German, F.F.; Zabalza, I.; Zambrana-Vasquez, D. Study of the environmental performance of end-of-life tire recycling through a simplified mathematical approach. Therm. Sci. 2012, 16, 889–899. [Google Scholar]
  24. Forrest, M.J. Recycling and Re-Use of Waste Rubber; Smithers Rapra Technology Ltd.: Shawbury, UK, 2014. [Google Scholar]
  25. Myhre, M.; Saiwari, S.; Dierkes, W.; Noordermeer, J. Rubber recycling: Chemistry, processing, and applications. Rubber. Chem. Technol. 2012, 85, 408–449. [Google Scholar] [CrossRef]
  26. Martínez, J.; Puy, N.; Murillo, R.; Garcia, T.; Navarro, M.; Mastral, A. Waste tire pyrolysis—A review. Renew. Sustain. Energy Rev. 2013, 23, 179–213. [Google Scholar] [CrossRef]
  27. Ramos, G.; Alguacil, F.; López, F. The recycling of end-of-life tires. Technological review. Rev. Metal. 2011, 47, 273–284. [Google Scholar]
  28. Piotrowska, K.; Kruszelnicka, W.; Bałdowska-Witos, P.; Kasner, R.; Rudnicki, J.; Tomporowski, A.; Flizikowski, J.; Opielak, M. Assessment of the environmental impact of a car tire throughout its lifecycle using the lca method. Materials 2019, 12, 4177. [Google Scholar] [CrossRef] [PubMed] [Green Version]
  29. Hunkeler, D.; Saur, K.; Stranddorf, H.; Rebitzer, G.; Finkbeiner, M.; Schmidt, W.P.; Jensen, A.A.; Christiansen, K. Life Cycle Management; SETAC Press: Pensacola, FL, USA, 2003; pp. 20–24. [Google Scholar]
  30. Piasecka, I.; Bałdowska-Witos, P.; Piotrowska, K.; Tomporowski, A. Eco-energetical life cycle assessment of materials and components of photovoltaic power plant. Energies 2020, 13, 1385. [Google Scholar] [CrossRef] [Green Version]
  31. Bałdowska-Witos, P.; Kruszelnicka, W.; Kasner, R.; Rudnicki, J.; Tomporowski, A.; Flizikowski, J. Impact of the plastic bottle production on the natural environment. Part. 1. Application of the ReCiPe 2016 assessment method to identify environmental problems. Przem. Chem. 2019, 10, 1662–1667. [Google Scholar] [CrossRef]
  32. Kirchain, R.E., Jr.; Gregory, J.R.; Olivetti, E.A. Environmental life-cycle assessment. Nat. Mater. 2017, 16, 693–697. [Google Scholar] [CrossRef] [PubMed]
  33. Mroziński, A.; Piasecka, I. Selected aspects of building, operation and environmental impact of offshore wind power electric plants. Pol. Marit. Res. 2015, 22, 86–92. [Google Scholar] [CrossRef] [Green Version]
  34. Kłos, Z. Ecobalancial assessment of chosen packaging processes in food industry. Int. J. Life Cycle Assess. 2002, 7, 309. [Google Scholar] [CrossRef]
  35. Jasiulewicz-Kaczmarek, M.; Gola, A. Maintenance 4.0 technologies for 2014 sustainable manufacturing—An Overview. IFAC Pap. 2019, 52, 91–96. [Google Scholar] [CrossRef]
  36. Piasecka, I.; Tomporowski, A. Analysis of environmental and energetical possibilities of sustainable development of wind and photovoltaic power plants. Probl. Sustain. Dev. 2018, 13, 125–130. [Google Scholar]
  37. Simla, T.; Stanek, W. Reducing the impact of wind farms on the electric power system by the use of energy storage. Renew. Energy 2020, 145, 772–782. [Google Scholar] [CrossRef]
  38. Wolfson, A.; Dominguez-Ramos, A.; Irabien, A. From goods to services: The life cycle assessment perspective. J. Serv. Sci. Res. 2019, 11, 17–45. [Google Scholar] [CrossRef]
  39. Guinēe, J.B. Handbook on life cycle assessment operational guide to the ISO standards. Int. J. Life Cycle Assess. 2002, 7, 311–313. [Google Scholar] [CrossRef]
  40. Bałdowska-Witos, P.; Piotrowska, K.; Kruszelnicka, W.; Błaszczak, M.; Tomporowski, A.; Opielak, M.; Kasner, R.; Flizikowski, J. Managing the uncertainty and accuracy of life cycle assessment results for the process of beverage bottle moulding. Polymers 2020, 12, 1320. [Google Scholar] [CrossRef] [PubMed]
  41. Tomporowski, A.; Flizikowski, J.; Wełnowski, J.; Najzarek, Z.; Topoliński, T.; Kruszelnicka, W.; Piasecka, I.; Śmigiel, S. Regeneration of rubber waste using an intelligent grinding system. Przem. Chem. 2018, 10, 1659–1665. [Google Scholar]
  42. Lewandowska, A. Environmental life cycle assessment as a tool for identification and assessment of environmental aspects in environmental management systems (EMS) part 1: Methodology. Int. J. Life Cycle Assess. 2011, 16, 178–186. [Google Scholar] [CrossRef] [Green Version]
  43. Shvetsova, O.A.; Lee, J.H. Minimizing the environmental impact of industrial production: Evidence from south korean waste treatment investment projects. Appl. Sci. 2020, 10, 3489. [Google Scholar] [CrossRef]
  44. Rebitzer, G.; Loerincik, Y.; Jolliet, O. Input-output life cycle assessment: From theory to applications. Int. J. Life Cycle Assess. 2002, 7, 174–176. [Google Scholar] [CrossRef] [Green Version]
  45. Imran, U.; Ahmad, A.; Othman, M. Life cycle assessment of simulated hydrogen production by methane steam reforming. Aust. J. Basic Appl. Sci. 2017, 11, 43–50. [Google Scholar]
  46. Olsen, S.; Christensen, F.; Hauschild, M.; Pedersen, F.; Larsen, H.; Torslov, J. Life cycle impact assessment and risk assessment of chemicals—A methodological comparison. Environ. Impact Assess. Rev. 2001, 21, 385–404. [Google Scholar] [CrossRef]
  47. Piasecka, I.; Tomporowski, A.; Piotrowska, K. Environmental analysis of post-use management of car tires. Przem. Chem. 2018, 97, 1649–1653. [Google Scholar]
  48. Tomporowski, A.; Piasecka, I.; Flizikowski, J.; Kasner, R.; Kruszelnicka, W.; Mroziński, A.; Bieliński, K. Comparision analysis of blade life cycles of land-based and offshore wind power plants. Pol. Marit. Res. 2018, 25, 225–233. [Google Scholar] [CrossRef] [Green Version]
  49. Goedkoop, M.; Spriensma, R. The Eco-Indicator 99—A Damage Oriented Method for Life Cycle Assessment Methodology Report; Pré Consultants: Amersfoort, The Netherlands, 2000; pp. 100–101. [Google Scholar]
  50. Dreyer, L.C.; Niemann, A.L.; Hauschild, M.Z. Comparison of three different LCIA methods: EDIP97, 521 CML2001 and Eco-indicator 99. Int. J. Life Cycle Assess. 2003, 8, 191–200. [Google Scholar] [CrossRef]
  51. Chłopek, Z.; Lasocki, J. Application of the life cycle assessment method to the study on the ecological properties of the car. Zesz. Nauk. Inst. Pojazdów 2013, 1, 57–66. [Google Scholar]
  52. Bovea, M.; Powell, J. Alternative scenarios to meet the demands of sustainable waste management. J. Environ. Manag. 2006, 79, 115–132. [Google Scholar] [CrossRef]
  53. Tomporowski, A.; Opielak, M. Structural features versus multi-hole grinding efficiency. Maint. Reliab. 2012, 14, 222–227. [Google Scholar]
  54. Kostrz, M.; Satora, P. The compounds responsible for air pollution. Inżynieria Ekol. 2017, 18, 89–95. [Google Scholar] [CrossRef]
  55. Ociepa-Kubicka, A.; Ociepa, E. Toxic effects of heavy metals on plants, animals and humans. Eng. Prot. Environ. 2012, 15, 169–180. [Google Scholar]
Figure 1. The tire-manufacturing process flowchart.
Applsci 10 07015 g001
Figure 2. Four phases of the Life Cycle Assessment (LCA) study. Own work based on [31,39].
Applsci 10 07015 g002
Figure 3. Inputs and outputs throughout the car tire life cycle. Own work based on [28].
Applsci 10 07015 g003
Figure 4. Grouping in Eco-indicator 99. Own work based on [30].
Applsci 10 07015 g004
Figure 5. Results of grouping and weighting of environmental damage at individual stages of the traditional and ecological tire life cycle, including impact categories.
Applsci 10 07015 g005
Figure 6. Results of grouping and weighting of environmental damage from carcinogens at individual stages of the traditional and ecological tire life cycle.
Applsci 10 07015 g006
Figure 7. Results of grouping and weighting of environmental damage from respiratory inorganics at individual stages of the traditional and ecological tire life cycle.
Applsci 10 07015 g007
Figure 8. Results of grouping and weighting of environmental damage from climate change at individual stages of the traditional and ecological tire life cycle.
Applsci 10 07015 g008
Figure 9. Results of grouping and weighting of environmental damage from acidification/eutrophication at individual stages of the traditional and ecological tire life cycle.
Applsci 10 07015 g009
Figure 10. Results of grouping and weighting of environmental damage involved in the extraction of fossils at individual stages of the traditional and ecological tire life cycle.
Applsci 10 07015 g010
Figure 11. Cumulative Energy Demand (CED) assessment of energy consumption at individual stages of the traditional and ecological tire life cycle, including the type of raw material.
Applsci 10 07015 g011
Figure 12. Intergovernmental Panel on Climate Change (IPCC) assessment of greenhouse gas (GHG) emissions at individual stages of the traditional and ecological tire life cycle.
Applsci 10 07015 g012
Table 1. Most important components of a car tire [8,9].
ComponentMaterialDescriptionOccurrence
Inner linerSynthetic butyl rubberHigh resistance to acids, bases, and oxidizing agents. Minimizes air loss and protects inner components against water and oxygen.Traditional and the ecological tire
Textile carcassA textile fabric consisting of about 1.0–1.5-mm-thick cord threadsThe skeleton that allows the tire to maintain the shape under internal loads. It transfers loads during acceleration, braking, and turning.Traditional and ecological tire
Bead wiresA rubber-coated wire bundleIt ensures a proper and tight fit of the tire on the rim. Owing to friction, it transmits longitudinal forces.Traditional and ecological tire
FillerSynthetic rubberProvides high sidewall stiffness, driving comfort, manageability, and durability of the tire.Traditional and ecological tire
Bead bundleRubber-coated nylon or aramid cordIt guarantees tire durability and tightness, separates the wire from the rim.Traditional and ecological tire
SidewallThe rubber compound containing anti-ageing agentsProvides tire protection. Protects it against chafing and environmental factors (UV radiation, temperature variations, chemical compounds).Traditional and ecological tire
BeltsRubber-coated steel cordsProvides strength to the tire. Stabilizes the tread, prevents deep damage to the carcass, greatly reduces rolling resistance.Traditional tire
Rubber-coated polymer cordsEcological tire
TreadMain component of mixture is sootEnsures maneuverability, optimal grip and highest wear resistance, the key to noise level reduction, and rolling resistance.Traditional tire
Main component of mixture is silicaEcological tire
Table 2. Results of Eco-indicator 99 characterization of environmental damage at individual stages of the traditional and ecological tire life cycle, including impact categories.
Impact CategoryProductionUSEEnd of LifeUnit
Traditional TireEco TireTraditional TireEco TireTraditional TireEco Tire
Carcinogens5.81 × 10−54.53 × 10−53.58 × 10−83.58 × 10⁻⁸−1.55 × 10−71.17 × 10−7DALY
Respiratory organics8.97 × 10−85.77 × 10−86.60 × 10−76.25 × 10⁻⁷−1.32 × 10⁻⁸−2.22 × 10⁻⁸DALY
Respiratory inorganics1.91 × 10−41.48 × 10−41.09 × 10−31.03 × 10⁻³−8.54 × 10⁻⁷−1.49 × 10⁻⁶DALY
Climate change6.95 × 10−55.40 × 10−54.76 × 10−44.51 × 10⁻⁴−4.41 × 10⁻⁷−5.31 × 10⁻⁸DALY
Radiation1.04 × 10−77.99 × 10−86.46 × 10−126.46 × 10−120.00 × 1000.00 × 100DALY
Ozone layer1.43 × 10−82.55 × 10−91.67 × 10−131.67 × 10⁻¹³−4.22 × 10⁻¹⁰−2.12 × 10⁻¹⁰DALY
Ecotoxicity2.90 × 1011.85 × 10−13.44 × 10−23.44 × 10−22.87 × 10−14.66 × 10−1PAF × m2 × year
Acidification/Eutrophica-tion4.75 × 1003.69 × 1003.64 × 1013.45 × 101−4.45 × 10⁻²−7.83 × 10⁻²PDF × m2 × year
Land use2.47 × 1002.30 × 1005.97 × 10−55.97 × 10−50.00 × 1000.00 × 100PDF × m2 × year
Minerals5.16 × 10−13.52 × 10−12.82 × 10−42.82 × 10⁻⁴−7.14 × 10⁻²−1.65 × 10⁻⁴MJ
Fossil fuels1.34 × 1029.78 × 1014.11 × 1033.89 × 103−5.88 × 100−8.32 × 100MJ
Table 3. Results of grouping and weighting of environmental damage at individual stages of the traditional and ecological tire life cycle, including impact categories [unit: Pt].
Impact CategoryProductionUSEEnd of Life
Traditional TireEco TireTraditional TireEco TireTraditional TireEco Tire
Carcinogens1.51 × 1001.18 × 1009.43 × 10−49.33 × 10⁻⁴−4.04 × 10−33.06 × 10−3
Respiratory organics2.34 × 10−31.50 × 10−31.72 × 10−21.63 × 10⁻²−3.44 × 10⁻⁴−5.78 × 10⁻⁴
Respiratory inorganics4.96 × 1003.87 × 1002.84 × 1012.69 × 101−2.22 × 10⁻²−3.88 × 10⁻²
Climate change1.81 × 1001.41 × 1001.24 × 1011.17 × 101−1.15 × 10⁻²−1.38 × 10⁻³
Radiation2.72 × 10−32.08 × 10−31.78 × 10−71.68 × 10−70.00 × 1000.00 × 100
Ozone layer3.72 × 10−46.65 × 10−54.54 × 10−94.34 × 10⁻⁹−1.10 × 10⁻⁵−5.51 × 10⁻⁶
Ecotoxicity2.26 × 10−11.44 × 10−12.78 × 10−42.68 × 10−42.24 × 10−33.63 × 10⁻³
Acidification/eutrophication3.71 × 10−12.88 × 10−12.84 × 1002.69 × 100−3.47 × 10⁻³−6.10 × 10⁻³
Land use1.93 × 10−11.79 × 10−14.86 × 10−64.66 × 10−60.00 × 1000.00 × 100
Mineral depletion1.23 × 10−28.39 × 10−36.84 × 10−66.71 × 10⁻⁶−1.70 × 10⁻³−3.93 × 10⁻⁶
Fossil fuels3.18 × 1002.33 × 1009.78 × 1019.27 × 101−1.40 × 10⁻¹−1.98 × 10⁻¹
TOTAL1.23 × 1019.41 × 1001.41 × 1021.34 × 102−1.81 × 101−2.38 × 101
Table 4. Results of grouping and weighting of environmental damage from carcinogens at individual stages of the traditional and ecological tire life cycle [unit: Pt].
SubstanceProductionUSEEnd of Life
Traditional TireEco TireTraditional TireEco TireTraditional TireEco Tire
Arsenic, ions1.35 × 1001.05 × 1007.92 × 10−47.79 × 10⁻⁴−4.62 × 10−31.03 × 10−3
Cadmium, ions1.15 × 10−18.93 × 10−29.28 × 10−59.28 × 10⁻⁵−1.35 × 10−42.87 × 10−5
Fine particles < 2.5 µm2.03 × 10−21.59 × 10−26.06 × 10−56.06 × 10⁻⁵X-
Cadmium1.61 × 10−21.24 × 10−22.16 × 10−72.16 × 10⁻⁷−3.05 × 10−41.04 × 10−4
Arsenic1.55 × 10−21.21 × 10−27.59 × 10−87.59 × 10⁻⁸--
Unspecified metals3.18 × 10−7---1.34 × 10−32.04 × 10−3
Dioxins-1.01 × 10−32.71 × 10−72.71 × 10⁻⁷--
Table 5. Results of grouping and weighting of environmental damage from respiratory inorganics at individual stages of the traditional and ecological tire life cycle [unit: Pt].
SubstanceProductionUSEEnd of Life
Traditional TireEco TireTraditional TireEco TireTraditional TireEco Tire
Sulphur oxide1.33 × 10−2-1.58 × 1011.50 × 101−4.07 × 10⁻³−3.60 × 10⁻³
Nitrogen dioxide9.12 × 10−31.41 × 10−21.00 × 1019.49 × 100--
Suspended particulate matter (SPM)--2.49 × 1002.35 × 100--
Sulphur dioxide2.00 × 1001.58 × 1005.86 × 10−35.83 × 10⁻³--
Fine particles, < 2.5 µm1.46 × 1001.14 × 1004.34 × 10−34.34 × 10⁻³--
Nitric oxide1.31 × 1001.01 × 1001.16 × 10−21.16 × 10⁻²−1.68 × 10⁻²−3.06 × 10⁻²
Particulate matter, > 2.5 µm, and < 10 µm1.67 × 10−11.31 × 10−13.99 × 10−33.99 × 10⁻³--
Ammonia2.56 × 10−32.07 × 10−31.49 × 10−61.49 × 10−65.99 × 10−61.04 × 10⁻⁵
Table 6. Results of grouping and weighting of environmental damage from climate change at individual stages of the traditional and ecological tire life cycle [unit: Pt].
SubstanceProductionUSEEnd of Life
Traditional TireEco TireTraditional TireEco TireTraditional TireEco Tire
Carbon dioxide2.77 × 10−21.07 × 10−21.24 × 1011.17 × 101−1.03 × 10⁻²−1.24 × 10⁻³
Carbon dioxide, fossil1.69 × 1001.33 × 1006.62 × 10−36.60 × 10⁻³--
Methane, fossil8.76 × 10−26.86 × 10−24.92 × 10−44.92 × 10⁻⁴--
Carbon dioxide, biogenic1.63 × 10−21.27 × 10−23.35 × 10−53.35 × 10⁻⁵--
Nitrous oxide4.54 × 10−33.55 × 10−36.46 × 10−76.46 × 10−78.53 × 10−62.60 × 10⁻⁵
Carbon monoxide--3.08 × 10−32.92 × 10−3--
Carbon dioxide in air−2.26 × 10⁻²−1.76 × 10⁻²−1.82 × 10⁻⁷−1.75 × 10⁻⁷--
Table 7. Results of grouping and weighting of environmental damage from acidification and eutrophication at individual stages of the traditional and ecological tire life cycle [unit: Pt].
SubstanceProductionUSEEnd of Life
Traditional TireEco TireTraditional TireEco TireTraditional TireEco Tire
Nitrogen dioxide1.76 × 10−32.72 × 10−31.93 × 1001.83 × 100--
Sulphur oxide7.61 × 10−4-9.05 × 10−18.57 × 10−1−2.32 × 10⁻⁴−2.06 × 10⁻⁴
Nitric oxide2.52 × 10−11.94 × 10⁻¹². 26 × 10−32.23 × 10−3−3.24 × 10⁻³−5.90 × 10⁻³
Sulphur dioxide1.14 × 10−19.00 × 10−23.43 × 10−43.33 × 10⁻⁴--
Ammonia1.41 × 10−31.14 × 10−38.23 × 10−78.19 × 10−73.29 × 10−65.71 × 10⁻⁶
Table 8. Results of grouping and weighting of environmental damage involved in the extraction of fossils at individual stages of the traditional and ecological tire life cycle [unit: Pt].
SubstanceProductionUSEEnd of Life
Traditional TireEco TireTraditional TireEco TireTraditional TireEco Tire
Natural gas, 42.7 MJ/kg, fossil2.65 × 10−3-9.77 × 1019.26 × 101--
Natural gas, fossil1.12 × 1009.08 × 10−17.09 × 10−27.08 × 10−2--
Crude oil, fossil1.11 × 1009.01 × 10−16.45 × 10−26.44 × 10−2--
Hard coal, fossil4.23 × 10−13.30 × 10−11.98 × 10−41.96 × 10⁻⁴--
Crude oil, 42.6 MJ/kg, fossil2.96 × 10−1---−1.69 × 10⁻²−4.77 × 10⁻³
Natural gas from waste gases generated in coal mining processes/m31.34 × 10−11.04 × 10−14.43 × 10−74.35 × 10⁻⁷--
Natural gas, 30.3 MJ/kg, fossil6.69 × 10−28.40 × 10⁻²----
Natural gas, 35 MJ/m3, fossil3.21 × 10−2---7.44 × 10−31.42 × 10−2
Natural gas, raw material, 35 MJ/m3, fossil----−4.28 × 10⁻²−6.37 × 10⁻²
Natural gas, 36.6 MJ/m3, fossil----−4.12 × 10⁻²−7.21 × 10⁻²
Crude oil, raw material, 41 MJ/kg, fossil----−4.35 × 10⁻²−7.26 × 10⁻²