Abstract
Mining algorithms for Dynamic Contrast Enhanced Magnetic Resonance Imaging (DCE-MRI) of breast tissue are discussed. The algorithms are based on recent advances in multi-dimensional signal processing and aim to advance current state-of-the-art computer-aided detection and analysis of breast tumours when these are observed at various states of development. The topics discussed include image feature extraction, information fusion using radiomics, multi-parametric computer-aided classification and diagnosis using information fusion of tensorial datasets as well as Clifford algebra based classification approaches and convolutional neural network deep learning methodologies. The discussion also extends to semi-supervised deep learning and self-supervised strategies as well as generative adversarial networks and algorithms using generated confrontational learning approaches. In order to address the problem of weakly labelled tumour images, generative adversarial deep learning strategies are considered for the classification of different tumour types. The proposed data fusion approaches provide a novel Artificial Intelligence (AI) based framework for more robust image registration that can potentially advance the early identification of heterogeneous tumour types, even when the associated imaged organs are registered as separate entities embedded in more complex geometric spaces. Finally, the general structure of a high-dimensional medical imaging analysis platform that is based on multi-task detection and learning is proposed as a way forward. The proposed algorithm makes use of novel loss functions that form the building blocks for a generated confrontation learning methodology that can be used for tensorial DCE-MRI. Since some of the approaches discussed are also based on time-lapse imaging, conclusions on the rate of proliferation of the disease can be made possible. The proposed framework can potentially reduce the costs associated with the interpretation of medical images by providing automated, faster and more consistent diagnosis.
1. Introduction
Incidences of breast cancer have dramatically increased over the past 30 years, with the maximum number of incidents having gradually shifted from the 40–44 age group in the past 20 years to the 50–54 age group over the past decade. The modal age of onset and the median age of diagnosis have both increased over time, suggesting that the incidence rate is increasing with age [1]. In a study on the current status of breast cancer, it was found that in order to address current burdens of breast cancer in healthcare systems, it is necessary to first solve the problem of late breast cancer diagnosis. Governments also need new automated tools to more efficiently address a series of health problems associated with current lifestyle choices, which contribute to increased cancer cases and high mortality rates.
Compared with other clinical imaging methods for breast disease diagnosis, magnetic resonance imaging (MRI) is characterised by its excellent soft tissue resolution and no radiation damage from X-ray examination [2]. Recent advances in a dedicated breast imaging coil, the introduction of magnetic resonance contrast agents and the development of image registration in combination with time-lapse imaging have made Dynamic Contrast Enhanced Magnetic Resonance Imaging (DCE-MRI) a new clinical option, which is available nowadays in most hospitals.
Obtaining image sequences at multiple time instances before and after the injection of contrast agent not only improves the spatial and temporal resolution of breast MRI, but also combines morphology and haemodynamics, and enables a more accurate estimation of image intensity. Furthermore, the contrast between different tissues in resultant images is enhanced. Changes in intensity of the MRI signal with time reflect dynamic rather than steady-state characteristics of the tissue of interest, allow the evaluation of the blood inflow and outflow in the tissue and show changes in the physiology of the diseased tissue. In the diagnosis and treatment of tumours, relative differences in micro-vessel structure and proliferation, as well as microcirculation changes between malignant tumour tissues and benign tumour tissues, can be identified on the basis of the acquired signal after contrast agent injection. DCE-MRI can thus be used to distinguish soft tumour tissue from lymph nodes. At present, the automated interpretation of these images is still in its infancy, existing significant information embedded in the data structures is still not extracted or used by experts. Such information should be more efficiently used by automated classification systems that are based on learning algorithms to prevent the development of several types of breast disease [3].
With the continuous development and improvement of magnetic resonance equipment and computer technology, magnetic resonance can comprehensively evaluate breast lesions on the basis of inferred morphology, haemodynamics and molecular composition. The specificity of diagnosis is being constantly improved and gradually becoming an indispensable means of inspection for breast cancer screening. Such advances have been making a significant impact in the field of tumour diagnosis, where increasingly refined tumour images in terms of contrast and resolution provide a lot of additional information, enabling experts to identify disease types and rate of proliferation, as well as verify the efficacy of different types of treatment. Deep mining techniques may be used to efficiently extract such information, dramatically improving on the diagnostic accuracy of conventional imaging diagnosis [4].
Most computer based DCE-MRI detection systems of breast cancer are focused on the detection of lesions, but there are relatively fewer studies on lesion diagnosis. Existing magnetic resonance image processing software requires manual guidance and adjustment, so its processing time is relatively long. Furthermore, due to the gradients in the main magnetic field or due to patient motion, the results can show large variations in tumour detail and the image segmentation and classification effects are not ideal. In addition, in traditional high-dimensional DCE-MRI analysis, time domain signals and spatial domain characteristics in the image are processed separately to make a final diagnosis. Such approach results in low specificity of lesion detection, i.e., in a range of 40–80% [5,6]. The full use of spatial-position and temporal-association information of medical images is essential to obtain high-quality tumour segmentation and classification. Although in this paper we focus on data fusion of such information only within the context of DCE-MRI, the approach is generic to any tumour classification framework. By discussing advances in learning algorithms and classifiers, a new generic approach for multi-dimensional image analysis is proposed. This should also be equally applicable to other medical imaging modalities, such as X-ray tomography, terahertz imaging, acoustic imaging, etc. and has the potential to effectively solve several practical problems encountered in clinical medicine.
To clarify these concepts, this paper is structured as follows: Section 1 provides an introduction to breast DCE-MRI as this is the more well-established modality for building breast MR imaging systems. Section 2 discusses generic computer aided detection, diagnosis and classification methodologies applicable to high dimensional (breast tissue) MRI. The importance of breast parenchymal background classification in the identification of breast cancer is highlighted. A discussion on MRI radiomics is also provided as a high-throughput quantitative feature extraction strategy for tumour detection. In addition, computer aided detection and diagnosis methodologies are summarised, and the importance of self-supervised and semi-supervised deep learning methodologies is articulated. These are emergent topics within the current computer science community. The analysis of high-dimensional image datasets is also discussed and placed in the context of recent advances in tensor based image reconstruction. Because artefacts can be generated in image reconstruction as well as in segmentation processes based on multi-channel intensity gradients tensorial de-noising approaches need to be considered. These make use of higher order singular value decomposition routines. However, due to the universal applicability of these algorithms across all biomedical imaging modalities, a more focused discussion regarding their implementation is provided. In Section 3, recent advances in classification algorithms are considered. An emphasis is placed on multi-dimensional time-space enhancement using a deep learning network. Tensorial analysis may also be combined with geometric algebra approaches to create a rich classifier feature input space, so as to improve the training basis and increase the precision of the classifier. Recent advances in self-supervised learning and generative adversarial networks can be incorporated in this framework. The multichannel approach also integrates information acquired from multiple images at different time stamps, so models of predictive value on disease proliferation can be generated. Self-supervised learning allows boosting the performance of machine learning models by using both un-labelled as well as labelled data. Generative adversarial networks enable the discrimination and even sparse data based image regeneration of MRI, thus enabling the adoption of semi-supervised classification strategies. Therefore, we provide an overview of these approaches. The work finally proposes that there are benefits in combining generative adversarial networks with multi-task deep learning approaches. A new unified framework that incorporates multi-dimensional data and multi-task learning is proposed as a way forward for advancing computer aided diagnosis of breast DCE-MRI. Then, conclusions are provided in Section 4.
2. Research Status and Development Trends for Computer Aided Detection and Diagnosis of MRI
At present, there are not many studies that jointly discuss the detection and classification of breast tumours using DCE-MRI, and most studies focus on either the detection or classification alone. Since detection may benefit from advances in multi-feature classification, platforms that adopt a unified data fusion framework are more likely to detect the disease at an early stage. In the following sections, we will first summarise relevant research on breast fibrous glands as the morphology provides distinct features that may be extracted in a classification context. We then explore relevant research on histology-based imaging, and discuss annotation issues encountered in magnetic resonance and more specifically DCE-MRI. Subsequently, we provide an account of recent strategies and newly developed methods of performing computer-aided diagnostic with an emphasis on classification systems for the analysis of DCE-MRI. Subsequently, we discuss new opportunities and difficulties associated with tensor based reconstruction of breast MRI, and its impact on tumour classification research.
2.1. Image Feature Extraction of Breast Tumours and Pattern Classification of Breast Fibrous Glands
Women’s breasts are composed of lobules, ducts and fatty tissues. Most often, epithelial tumours start their growth inside the lobules and ducts; as tumours spread to other tissues of the breast [7], they eventually metastasise to other parts of the body. Although breast tumours are often referred to as one disease, there are many different types of breast tumours. Tumour cells can vary in location (milk ducts or lobules) and morphology when observed under a microscope. Additionally, morphological differences contain very useful information that enables an accurate prognosis.
Breast tumours can be divided into the following two main overarching categories: (i) Benign tumours that are considered as noncancerous and non-life-threatening and (ii) Malignant tumours that are characterised by abnormal cell growth and might rapidly spread or invade nearby tissues. Morphologically, the nuclei of the malignant cell may be easily identified as they are much bigger than in normal cell. Since benign tumours can turn malignant, monitoring is advisable.
A well established image assessment technique adopted by radiologists to assess disease proliferation is the Breast Imaging-Reporting and Data System (BI-RADS), which is published by the American College of Radiology (ACR) [1]. This methodology sub-divides clinical observations into 6 categories which are normally assigned by the radiologist. Different perspectives of breast images have been investigated according to the prevalence of the disease, its degree of advancement and the quality of the images. Classification on the basis of the above parameters is then performed using machine learning (ML) and Artificial Intelligence (AI) approaches.
A robust feature detector actually provides information on whether a particular feature is present in an image or not. There are four groups of features: empirical, structural, statistical and deep learning features, as illustrated in Figure 1. Empirical features are mainly proposed by radiologists and they qualitatively describe features verifiable by observation or experience rather than through a mathematical expression. Structural features provide information about the observed features characteristics such as structure, orientation and area, defining a convex hull describing a shape or region and centroid; this way a more mathematical description can be attributed to the observed features. Statistical information regarding the observed features in tumour images include the area of the nucleus or the centroid of the mass. Mean, Median and Standard Deviation can provide some potentially important information on the observed features and also have some diagnostic potential. Thus statistical features can be also used as additional information at the input of the classifier.
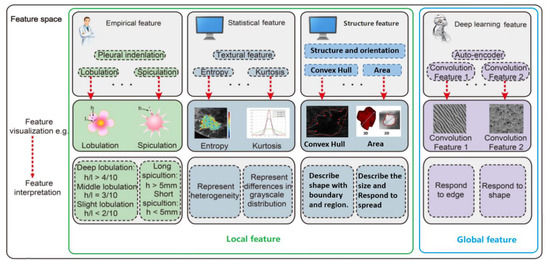
Figure 1.
Radiomic analysis simultaneously explores empirical features, statistical features, structure features and deep learning.
An alternative approach to improve the classifier performance is to invoke deep learning strategies. In deep learning, features are extracted from data directly, using non-linear inference engines in a similar way to that of an expert performing the diagnosis. The advantage of such approach is that the output of a classifier can be related to clinical outcomes more naturally. Generally, deep learning features are extracted from convolutional layers in the deep learning model. Each convolutional layer can include hundreds of convolutional filters, which can be defined as deep learning features. The deep learning features can describe multi-level tumour information from low-level (visual characteristics) to high-level (more abstract features) [8].
In a conventional image classification task, features are extracted locally using specific rules. Local texture and statistical features are universally accepted as the more important features for breast image classification. However, most current state-of-the-art techniques generally extract the features globally using kernels. These global features are the most used for image classification. It must be noted, however, that features extracted for classification do not always carry the same importance. Some features may even contribute to a degradation of the classifier performance. Inappropriate prioritization of some features can increase the classifier load as well as increase the model complexity. In contrast successful prioritization has the additional benefit of reducing computational time. For an in-depth discussion on feature extraction of breast tumours, the reader is referred to [9].
To improve the detection efficiency of breast tumours and reduce the cost of detection, BI-RADS emphasises the importance of observing the breast parenchyma, fibrous gland and background parenchymal enhancement in the structured MRI [10]. In the improved 2013 version of BI-RADS, previous breast parenchymal background classification based on the percentage of fibrous gland tissue and fat was remodelled and sub-divided into more classes: a predominantly fatty tissue class, a scattered sparse tissue class and a heterogeneously dense or extremely dense tissue class [11]. Boyd and Tice found that if FGT (Fibroglandular tissue) is dense, then the possibility of breast cancer developing is higher [2,3]. It has been found that women with a glandular tissue density of 75% or higher had an increased risk of breast cancer compared to women with a glandular tissue density of less than 10% in mammograms. Further, women with high breast density and proliferative benign breast disease have a high risk of breast cancer in the future, while women with low breast density have a low risk even if they have benign proliferative diseases. Background parenchymal enhancement (BPE) is the normal manifestation of enhanced fibrous gland tissue during DCE-MRI examination. Based on the enhancement of the image volume and the degree of FGT on the fat-suppressed sequences T1-weighted, BPE is also further divided into an almost no enhancement type, slight enhancement type, moderate enhancement type and obvious enhancement type. Studies have shown that the incidence of breast cancer increases with the increase of BPE [4]. In addition, You et al. [5] pointed out that, at multiple monitoring points of neo-adjuvant chemotherapy in patients with unilateral invasive breast cancer, the quantitative BPE of contralateral normal breast showed a continuous downward trend, similar to the change in tumour size during neo-adjuvant chemotherapy. Their work showed that there was a predictive aspect of BPE on the therapeutic effect of a treatment. Furthermore, it also showcased that an early reduction of bacterial artificial chromosome (BAC) in neo-adjuvant chemotherapy was positively correlated with pathological complete remission, especially in patients with hormone receptor-negative status [5]. Therefore, breast fibrous gland state was introduced as a supplementary feature for breast tumour detection, establishing the evaluation of BPE as a useful biological indicator of breast cancer proliferation [12,13,14].
2.2. Integration of Radiomics with DCE-MRI Datasets
Radiomics research is currently a very promising and emergent research topic in imaging informatics. The concept of radiomics was first proposed in 2012 by Lambin et al. [15]. In the past decade, Gillies et al. [16] found that the wider proliferation of pattern recognition tools, the increase in the size of data sets and the high-throughput extraction methodologies have dramatically benefitted computed tomography (CT), positron emission tomography (PET) and magnetic resonance imaging (MRI), along with other medical imaging modalities, and enabled the generation of predictive models for clinical use.
With the development of high-throughput quantitative feature extraction technology, it became possible to transform images into data that can be mined to provide decision support. The features that are most commonly mined usually include first, second, and higher-order statistics. Combining these data extracted from individual patients with similar data from other patients using bioinformatics tools, researchers are able to develop models that may potentially improve the diagnostic, prognostic and predictive accuracy. In contrast to the traditional method of processing medical images through visual interpretation, further analysis is possible on the basis of radiomics based imaging, which incorporates patho-physiological information, thus being of high clinical relevance.
Breast cancer is a complex disease caused by the progressive accumulation of multiple genetic mutations and epigenetic disorders of key genes triggered by cascade reactions. There are substantial differences between individual oncological patients according to the age and the phenotypic expression of the disease. Montemurro [17] and other researchers have shown that the diagnostic performance of DCE-MRI and diffusion-weighted imaging (DWI) can predict the biological behavior of individual breast tumours and evaluate the suitability of the treatment plan. Shin [18] found that on high-resolution DWI of breast cancer patients, the mean apparent diffusion coefficient (ADC) value of ER-negative tumours was significantly higher than that of ER-positive tumours (p = 0.005), which suggested that the ADC values on tumour and peritumoural stroma allow a good distinction of different biological labels. Sutton [19] and other studies have found that the kurtosis features extracted from DCE-MRI are significantly related to the Oncotype DxRS that can be genetically detected. Oncotype DxRS is an effective biomarker which can be used to guide the formulation of treatment plans, and enables doctors to predict the possibility of cancer recurrence and the efficacy of chemotherapy on the basis of image features. Wut [20] partitioned breast tumours on DCE-MRI into multiple sub-regions according to different enhancement characteristics. Through the extraction of a large number of features for analysis, it has been found that rapid inflow and outflow sub-regions allow the prediction of patients’ response to neo-adjuvant chemotherapy with area under the receiver operating characteristic curve (AUC) of 0.79.
Radiomics usually begins with data acquisition. It relies on the analysis of a large volume of medical images combined with locally or globally extracted specific biomarkers, and on the examination of the expression of genes associated with specific pathways, e.g., mTOR, as well as on the corresponding clinical data at the tissue or organism level to reveal the correlations that exist between them. Thus radiomics may provide a more robust quantitative and objective support for decisions surrounding cancer detection and treatment [15]. This is accomplished by fusing the quantitative information from medical images and combining the imaging features with clinical information, genomic information and biochemical information, to generate radiomic biomarkers. Such an approach is a newly emergent modality that meets clinical requirements and has significant potential to improve diagnostics and cancer treatments [8].
2.3. Computer-Aided MRI Diagnosis of Breast Cancer Using Convolutional Neural Networks and Adversarial Learning
With the development of medical technology, more and more imaging modalities are being used in hospitals. MRI machines can generate a large number of pathological images even from a single patient, overloading doctors that perform image-based diagnosis. This can also lead to cases of misdiagnosis or missed diagnosis; in addition, diagnosis is based on a doctor’s judgement, which is subjective, so the effectiveness of diagnosis varies. Training a doctor is time consuming and requires significant capital investment, and it is not uncommon in many hospitals to find it difficult to meet the current clinical demand [21].
Over the past few years, digital image processing by using convolutional neural networks (CNN-based deep learning), has become a well established modality. This is combined with deep learning methods to successfully perform segmentation of brain MRI images and classify lesions based on histopathological images, etc. Deep learning methods have been used in computer-aided design (CAD), such as IBM’s diagnostic robot “Watson” [22,23]. Watson’s working principle is to use deep CNNs to learn a large amount of image features through pattern matching, then establish a disease diagnosis model, and finally provide, in an automated fashion, the patient’s diagnosis results or treatment suggestions to the doctor. Watson’s example shows that the application of deep learning methods in CAD is a general trend.
There are several levels of involvement of an expert in the diagnostic process. It is possible to perform fully automated recognition (e.g., based on the overall three-dimensional shape of a tumour or lesion or the statistical significance of the increased vascularisation), semi-automatic recognition (e.g., based on threshold segmentation, area growth or fuzzy C clustering, etc.) and interactive recognition (after an expert manually selects the outline of the lesion and then cuts the edge). Compared with the semi-automatic recognition of the lesion area, automatic recognition has the advantages of improved speed and wide applicability at low cost. However, the accuracy of fully automatic tumour identification needs to be further improved [24,25]. There is tendency to use self-supervised and semi-supervised deep learning methods to detect and classify tumours using breast DCE-MRI. Adversarial learning reduces the reliance on manual annotation data, enabling accurate and rapid diagnosis of breast cancer. This learning modality constitutes a new method for the processing of high-dimensional medical images and establishes a complementary diagnostic approach for breast cancer.
2.4. Overview of Computer Aided Classification Algorithms for Cancer Diagnosis
Combining computer-aided detection, classification and diagnosis of early breast cancer using MRI is quite interdisciplinary and requires a wide spectrum of expertise that can most often be found in well established laboratories, such as the University of California, Irvine (UCI) [26], the Korean National Seoul University [27] or the Hangzhou University of Electronic Science and Technology [18,19]. There are also other well-known research institutes that have also made important advances by combining advances in detection, classification and diagnosis.
In CADs, the most frequently used classification algorithms are rule-based classifiers, pattern matching networks, neural networks (NNs), Markov random field, support vector machines (SVMs) [28,29,30], linear discriminant classifiers (LDAs) [31], k-nearest neighbours (k-NN) [32], multi-layer artificial neural networks (ANNs), decision trees, etc. SVM is still the most commonly used classification method [33,34]. In addition, ANNs are also powerful classification tools [35,36]. Inspired by the artificial immune algorithm, Peng et al. [37] used a semi-supervised algorithm to reduce classifier dependence on labelled data. Supervised information marked by professional doctors is introduced into the algorithm to guide the clustering process. By measuring the distance between the feature vectors of two samples, the probability that they are divided into the same category is calculated. Finally, the unlabelled samples are clustered with reference to membership. Using two well-known breast cancer benchmark datasets downloaded from the University of California, Irvine (UCI) machine learning database, the algorithm has shown significant potential for automatic classification and diagnosis of breast cancer. Because breast MRI examination involves very high resolution images of soft tissue, it can clearly distinguish the breast skin, subcutaneous fat gap, normal glands and diseased tissue. These high resolution images enable researchers to (i) distinguish between types of breast lesions and search for distinct features in the regions of these lesions, by identifying and analysing the background image features of each mammary gland through multiple dynamic parameter changes [38]; or (ii) to extract image features based on specific pixels in the segmentation [39,40]; or (iii) to use a classifier for diagnosis and prediction of breast tumours according to the difference in the spatial morphology of the enhanced part of the lesion [41,42].
There have been several approaches that show significant potential in improving MRI classifier performance. Rastghalam et al. [43] employed Markov random field and local binary pattern (LBP) to extract texture features of left and right breasts, respectively, then the authors applied the hidden Markov random field algorithms for classification at the decision level to achieve breast cancer diagnosis; Rouhi et al. [44] adopted a regional growth algorithm and CNN to perform classification of benign and malignant breast tumours; Khalil et al. [45] selected 125 breast cancer patients divided into two groups. The observation group used a high field 1.5 Tesla magnetic resonance instrument to perform a higher contrast resolution DCE-MRI examination, and the control group underwent routine MRI examination, aiming at the comparison of the morphology and boundary feature detail between the two groups, taking also into consideration the size of the lesions in the two groups of patients. Minimal lesions were revealed, especially with the higher field instrument, and the types of breast tumours were determined and classified. Azar et al. [46] used six SVM algorithms to classify breast tumours in breast images obtained using a molybdenum target, conducted a detailed comparative analysis of their performance Pawlovsky et al. [47] used a k-NN algorithm to diagnose breast cancer and the settings of the algorithm were further assessed in detail; Kharya et al. [48] applied the Naive Bayes algorithm for the classification of breast tumours.
Furthermore, Yang et al. [49] focused their attention on specific features of selected breast-occupying lesions which were also confirmed by pathological examination. Of the 46 lesions analyseanalysed, 31 (≈67%) were malignant. The aim was to observe the distribution characteristics of the Signal-Time curve in relation to the MRI scan of the areas occupied by benign and malignant breast tissue and compare the specificity, sensitivity and accuracy of differential diagnosis of breast cancer performed with a MRI dynamic scan and a plain scan. On the basis of the intensity curves obtained at different time instances, lesions were categorised into three types: persistent enhancing type (Type 1), plateau type (Type 2) and washout type (Type 3). Yang et al. [49] pathologic findings showed that the percentages of Type 1 benign and malignant lesions were 57 ± 4% and 43 ± 4%, the percentages of Type 2 lesions were 26 ± 2% and 74 ± 2% and the percentages of Type 3 lesions were 20 ± 2% and 80 ± 2%, respectively.
An important conclusion of their work was that differences in the distribution of Signal-Time curve types among benign and malignant lesions, were consistently statistically significant. They also found that the sensitivity, specificity and accuracy for detecting breast malignant lesions using DCE-MRI was higher than that of an MRI plain scan. It was thus concluded that variations in the Signal-Time curve of DCE-MRI is an additional feature of clinical value and, therefore, it would be appropriate for it to be incorporated in any AI based classifier.
Other works in the literature address problems related to DCE-MRI tumour classification by combining data interpolation [50], compressed sensing technology [51], tensor decomposition and reconstruction [52], deep learning [53], generative confrontation learning [54] and other methods. Further in-depth discussion of new methods for tumour classification using DCE-MRI can be found in [55,56].
Although breast tissue DCE-MRI are highly sensitive, the specificity of the detection is very low. Identification of nonlinear and highly correlated variables hidden in high-dimensional data is a challenging task. Traditional MRI analysis is often limited to one-dimensional information, ignoring the correlation of other dimensions. DCE-MRI, however, is composed of a collection of high-dimensional image datasets. Drawbacks in the processing of multi-dimensional data sets include the high computational cost and sensitivity to noise. A primary requirement in the post-processing is thus to reduce the dimensionality of these datasets in order to save storage space. Secondly, due to the complexity and diversity of the data, dynamic high-dimensional images do not have linear characteristics, so linear transforms may not be used. The commonly used nonlinear dimensionality reduction techniques for dynamic image segmentation methods, are incompatible with singular value decomposition and principal component analysis. Furthermore, vectorial transformations are based on two-dimensional dynamic image sequences, and this approach does not take explicitly into account the fundamental difference between values associated with the time dimension and the space dimension.
DCE-MRI provides sufficient spatial and temporal resolution for tumour image analysis at the same time. By adopting a spatio-temporal tensorial dataset framework, de-noising becomes more efficient because the variance in the noise across columns and rows in the tensor is co-averaged and tumour images with different structures can be transformed into simple geometric objects with greater precision. Using hierarchical decomposition, a geometric interpretation of the images is possible through deep reinforcement learning. Such multi-dimensional unified learning is proposed in [56,57]. Yin et al. [52] explored a tensor-based nonlinear dimensionality reduction algorithm in order to retain the data space structure. In combination with principal component analysis, the proposed methodology enables us to overcome the dimensional bottleneck that restricts the application of 3D reconstruction. Due to the unpredictability of tumour images and the non-uniformity of the image intensity in tumour regions, the information in the time and space dimensions is analyseanalysed, so as to isolate image noise interference, reconstruct connected tumour areas and reduce false positives, thereby improving the accuracy of automated recognition of breast tumours via DCE-MRI [52]. In order to solve the practical problem of the lack of labelled breast tumour data samples, [52] proposes a semi-supervised framework for breast tumour classification based on multi-task generative learning. This approach provides a new theoretical basis for the development of classification technology for multi-dimensional spatio-temporal medical image data.
2.5. Tensor Based MRI Image Analysis and Classification
As stated earlier, DCE-MRI provides a time series of three-dimensional magnetic resonance imaging. According to geometric algebra [58], one can match complex geometric objects of different dimensions through a range of simple transformations. Thus, it is possible to generate a series of three-dimensional spatial image data (Volumes), after clustering information, from multiple block-related regions (a trivector). These three-dimensional blocks are a series of two-dimensional spatial image stacks (Planes) arranged in three different directions. The two-dimensional images in each direction combine the time frame sequences to form a three-dimensional space-time image (trivector); each row or column on the image, combined with the time series, forms a two-dimensional space-time image (bivector). Figure 2 shows the basic components of 3D magnetic resonance image structure data based on a third-order tensorial representation.
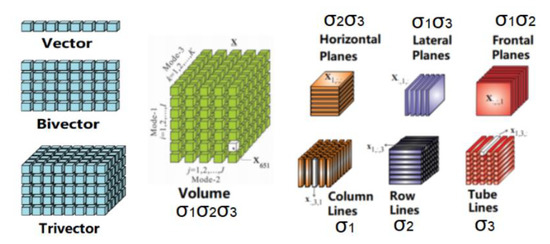
Figure 2.
Basic components of 3D magnetic resonance image structure data based on third-order tensor [52].
The formal expression of the geometric object of the three-dimensional MRI based on multiple vectors is represented as Figure 3.
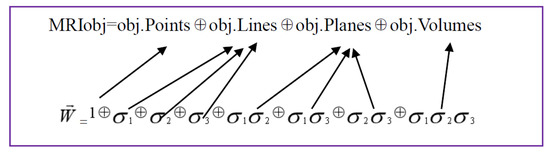
Figure 3.
Illustration of the formal expression of the geometric object of the three-dimensional MRI based on multiple vectors is represented.
From the equation presented above, a three dimensional MRI object (MRIobj) consists of object pixels (obj.Points), object rows or columns (obj.Lines), object planes (obj.Planes) and object volumes (obj.Volumes), along with three orientations in a spatial space. Considering that an image pixel corresponds to a point that is a scalar to be presented by 1; rows or columns of MRI are vectors to be labelled by , ; planes of MRI are bivectors, represented by , ; volumes of MRI object are trivectors, indicated by , .
Tensors enable multilinear mappings over a set of vector spaces. Under a tensorial framework, the four-dimensional objects registered in DCE-MRI are represented by a fourth order tensor (with time associated with an additional dimension), and the 3D shape geometry is treated as a third order tensor. A third order tensor has a directional definition in space, so any associated spatial matrix consists of three directional slices: horizontal, vertical and frontal. Tensor factorisation of a 3D spatial matrix is a universal methodology that aids the analysis of tomographic images. The tensor decomposition method adopted by Yin et al. [52] is based on the standard Tucker decomposition [59,60,61], and is also referred to as multilinear singular value decomposition (SVD) or higher-order SVD (HOSVD). The advantage of the HOSVD approach is that it allows estimation of the dimension of the core tensor by analysing the distribution of singular values [62].
Through the use of HOSVD, the dynamic MRI dataset (represented by a dynamic tensor ) is decomposed into three-mode basis image matrices and a core tensor Cτ, where ι = 1, 2, 3. The core tensor is associated with each mode of basis images; τ = 1, 2, …, 6 corresponds to a single time frame. PCA is applied on a temporal set of basis images. The temporal signal intensity variations for each pixel i within the decomposed basis image at each mode are associated with a state vector: = , , , , , (n = 6 to account for different time frames). The set of all state vectors within one mode of the basis images over a pre-determined time course is defined as with the number of pixels i in the basis image at a different mode denoted by ι. We used the symbol ε to label the mean of pixels in the basis images, the first-order covariance matrix of , , was calculated according to: and
A linear principal component analysis (PCA) transformation can then be applied to obtain the corresponding eigenvectors and eigenvalues λ = {λ1, λ2, …, λ6} by solving the generic equation λE = ΔE. A PCA routine of dynamic basis image datasets at each of the image modes yields 6 eigenvectors. As a result, a new mode vector is reconstructed for each of the different channels (state points) ( = 1, 2, …, 6). Then A can be matricised to to generate ι modes of basis images. In order to reconstruct a tensor for a 3D MRI approximation, the tensor product between the averaged core tensor and three modes of filtered basis images is calculated. This product is expressed as , where . Finally, the spatio-temporal features are reconstructed in a 3D space. An example of the resulting volume image generated following reconstruction from multiple channels is illustrated in Figure 4c. One can clearly observe improved intensity consistency for the colour-coded blue tumourous regions, which are clearly separated from the red background region. Figure 4d illustrates the resultant segment of the tumour following reconstruction. This should be contrasted with Figure 4b, where the whole region of the tumour shows inhomogeneous intensity with missed and spurious edges. Moreover, segmentation through the multi-channel reconstruction approach shows homogeneous boundaries for the tumours, and the entire tumour shape and tumour position are clearly retrieved. This can be also further validated by observing the overlapping images, shown in Figure 4e, where the yellow region consists of voxels mainly from the reconstructed tumour segment, which is used to fill-in the missing voxels from the conventional fuzzy c means (FCM) classified image. Multi-channel reconstruction leads to better defined tumour boundaries with reduced ambiguity and eliminates artefacts generated through the standard FCM reconstruction process.
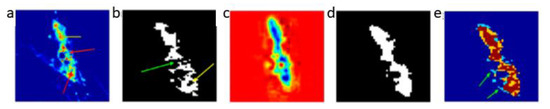
Figure 4.
Tumour segment reconstruction from multiple channels. (a) Illustration of intensity variation for breast tumour tissue images; the yellow arrows indicate a high intensity whereas the red arrows low intensity. (b) Illustration of fuzzy c means (FCM) based segmentation on (a) assuming inhomogeneous boundaries; the yellow arrows indicate an irregular ring-shaped region and a green arrow indicates missing pixels in the segmented object. (c) Reconstructed volume image from multiple channels. (d) The tumour segment after reconstruction. (e) Overlapped images (brown) of the original tumour segment (blue) and reconstructed tumour segment (yellow). The green arrows indicate the fuzzy edges associated with the original image. Images depict an in-situ ductal carcinoma based on [52].
3. High-Dimensional Medical Imaging Analysis Based on Deep Learning
Deep learning is rapidly becoming a very useful tool for studying biomedical images. In recent years, the application of CNNs has provided new insights in many image processing applications [63,64,65]. A variance of these are the deep convolutional neural networks (DCNNs). Compared with traditional neural networks, deep neural networks can automatically extract image features and learn the potential mapping relationship between input images and target images. DCNNs benefit from the recent developments in hardware and software, such as GPU programming. These advances have made real-time image segmentation and classification possible. With the help of DCNNs, a large number of new image analysis and classification algorithms have emerged [66,67,68,69]. In the field of medical image analysis and classification, GoogLeNet [70], a multi-scale residual network (MSRN) [71], U-Net neural network model [64], class structure-based deep convolutional neural network (CSDCNN) [72], a mixture ensemble of convolutional neural networks (ME-CNN) [73] and some others [74] have been explored. Unlike traditional methods, image classification algorithms based on deep learning do not require manual extraction of image features, and they can integrate image feature decomposition, feature fusion and image reconstruction into an end-to-end network model. These approaches greatly simplify the experimental process, speed up model execution and can maximise the use of image features to improve image classification. A detailed review on deep learning for MRI analysis can be found in the work by Lundervold et al. [75].
3.1. Deep Learning in Spatio-Temporal MRI
Based on geometric algebra, Yin et al. (2017) proposed a framework for deep learning of high-dimensional medical images. By decomposing high-dimensional images into simple geometric elements, such as points, lines, areas and volumes, and combining geometric algebra to analyse the multidimensional characteristics spatiotemporal data, a multi-scale deep classification system can be designed to perform feature extraction in medical images [57]. As discussed in [76], features originally extracted as scalar products can be conveniently combined to generate Clifford (geometric) products with additional discriminatory power from the original scalar products alone. An example of this is illustrated in Figure 5 where time-domain THz spectroscopic imaging data combined with MRI data are used for the design of a time-space unified deep learning scheme. A general representation of the associated geometric multilayered perceptron is shown in Figure 6.
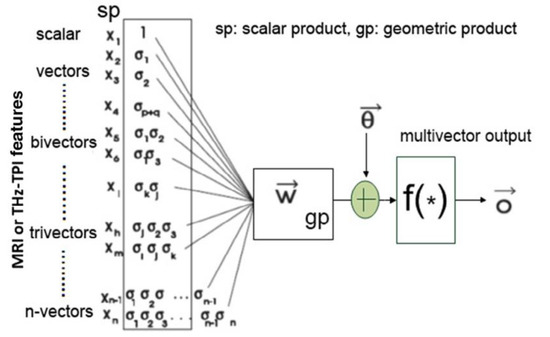
Figure 5.
Geometric neuron based on the McCulloch-Pitts neuron for magnetic resonance imaging (MRI) and terahertz (THz) pulse imaging datasets based on the generic framework discussed in Ref. [57].
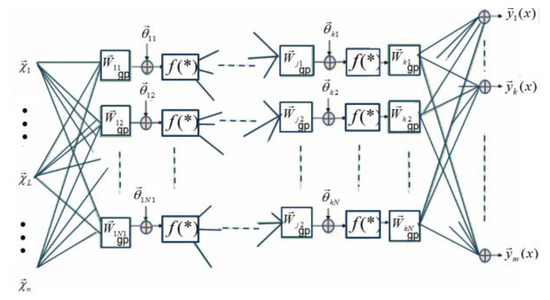
Figure 6.
A simplification of the learning rule discussed in Ref. [57], where it is suggested that in the training of geometric feedforward networks, the weights of the output layer could be real values (the output weight multivectors could be scalars of k-grade).
In order to create inputs to a DCNN, it is necessary to cluster dynamic image data associated with different dimensions. The purpose is to increase the depth of the deep learning network while removing redundant information so as to improve the convergence of the network to provide greater diagnostic accuracy. There are several hyper-dimensional image analysis and clustering strategies that may be considered for this purpose: one possibility is to adopt feature analysis and clustering methods for one-dimensional time series [77,78,79] or use clustering algorithms for two-dimensional spatial images, i.e., super voxel [80], Gray Level Co-ocurrence Matrix (GLCM) and Haralick’s statistical measures [81], 2D wavelet transforms [82,83] or two dimensional functional principal component analysis [84]. Another possibility is to use an image segmentation algorithm for three-dimensional spatial images, i.e., LCCP super-voxel [85], 3D wavelet transform [86]; or image segmentation algorithms for 3D time-space images, i.e., SLIC super-voxel [87] approaches. Image sequences of different dimensions may use different image analysis strategies to form a collection of scale-dependent features to be further analysed using a multi-task deep learning network framework. Figure 7 shows a flowchart of a semi-supervised tumour segmentation (SSTS) technique for the analysis of 2D and 3D spatial MRI, which uses these features in a super-voxel context.
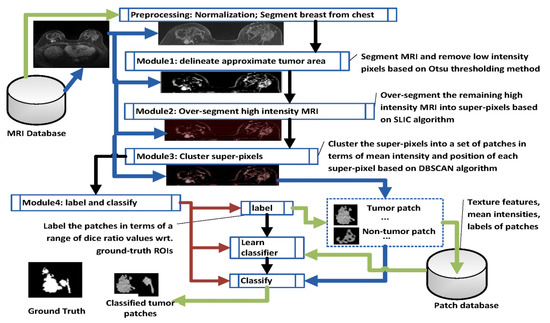
Figure 7.
Flowchart of Semi-Supervised tumour Segmentation (SSTS). This was developed in line with [88].
In SSTS, Module 1 delineates the approximate area captured by the scan using intensity based Otsu thresholding. As imaged tumours in MRI normally show higher intensity levels than the background, clustered pixels with low intensity associated with normal tissue are easily removed. An approximate area in the vicinity of the tumour can be over-segmented to super-pixels using SLIC (Module 2). A thresholding step can further reduce over-segmentation by removing low intensity noise. Module 3 clusters super-pixels based on the density-based spatial clustering of applications with noise (DBSCAN) technique in terms of mean intensities and positions. As a lesion is normally presented as a connected area in an MRI, this step groups super-pixels with similar intensity when they are spatially adjacent to each other (according to an 8-pixel adjacency matrix law). After DBSCAN clustering (Module 4), a set of tumour and (non)tumour patches are generated, where a (non)tumour patch is associated with the part of a (non)tumour area or the part that covers a (non)tumour area. Each labelled patch (tumour/(non)tumour) is described by 21 separate features (20 texture features and mean intensity). The features of each patch are stored in the Patch database. A deep learning classifier is subsequently trained to perform patch classification on the basis of labelled patches and their features according to a generated Patch database. The classified patches are finally combined together to represent a tumour area in a MRI [88].
3.2. Semi-Supervised Deep Learning Strategies for MRI
Traditional classifiers need labelled data for the training process. Labelling individual images, however, is often difficult, expensive and time consuming, as it requires the efforts of experienced annotators. Semi-supervised learning (SSL) is a special form of classifier, which reduces the overhead for annotation and labelling by using both labelled and unlabelled samples.
Ideally, only labelled samples should be used to ensure good classifier performance, but in many imaging modalities there is a shortage of these. For example, when classifying lesion patches vs. normal tissue patches, annotated features can be used to create a set of labelled patches. MRI without annotations can still be used to create a large set of unlabelled patches. There are two aspects in SSL methodologies that can lead to better classifier outcomes: the first is predicting labels for future data (inductive SSL); the second is predicting labels for the already available unlabelled samples (transductive SSL) [89].
SSL is naturally practiced by medical personnel in medical imaging, during segmentation as well as for diagnosis. For example in image segmentation, an expert might label only a part of the image, leaving many samples unlabelled. In computer-aided diagnosis, there might be ambiguity regarding the label of a subject, so instead of adding these subjects to the training set or removing them completely, they can still be used to improve the classifier performance [90]. Von et al. [91] presented an extension of Anderson’s Rational Model of Categorization and this forms the basis for SSL. Using an unconstrained free-sorting categorisation experiment, it was illustrated that labels were only useful to participants when the category structure is ambiguous.
Typically semi-supervised approaches work by making additional assumptions about the available data [89,92]. These include the smoothness assumption, i.e., samples close together in feature space are likely to be from the same class, the cluster assumption, i.e., samples in a cluster are likely to be from the same class, and the low density assumption, i.e., class boundaries are likely to be in low density areas of the feature space. For an in-depth review of SSL (not limited to MRI), one should refer to [90].
3.2.1. Self-Supervised Learning
For breast tumour MRI samples where for most of the time there is relatively limited annotation, a self-supervised deep learning strategy offers additional possibilities that are worth exploring in an AI context. A self-supervised machine learning approach avoids the use of prior information, which makes it very versatile from a learning perspective and able to cope with different tissue types of medical images that may have never been presented to the classifier. It also returns tissue probabilities for each voxel, which is crucial for a good characterisation of the evolution of lesions. The general idea of self-supervised learning is as follows. A classifier is first trained on the labelled samples. The trained classifier then classifies the unlabelled samples. These samples, or a subset of these samples, are then added to the training set. This process is repeated multiple times until the classifier achieves a particular level of precision.
In many scenarios, the dataset in question consists of more unlabelled images than labelled ones. Therefore, boosting the performance of machine learning models by using unlabelled as well as labelled data is an important but challenging problem.
Though self-supervised learning presents one possible solution to the key challenge of identifying a suitable self supervision task, i.e., generating input and output instance pairs from data, existing self-supervised learning strategies applicable to medical images so far have resulted in limited performance improvement. A promising future direction is discussed in the work by Chen et al. [93], who proposed a novel self-supervised learning strategy for medical imaging. The approach focuses on context restoration as a self-supervision task. Specifically, given an image, two small patches are randomly selected and swapped. By repeating this operation a number of times a new image is generated where the intensity distribution is preserved but its spatial information is altered. A CNN can then be trained on the artificially generated image to restore it back to its original version. CNN features identified in the self-supervision learning process can then be used to perform different types of transformations with greater precision, thus improving classification, localisation and segmentation.
A similar idea is discussed in the work by Zhuang et al. [94], who proposed a Rubik’s cube type recovery as a novel self-supervision task to pre-train 3D neural networks. The proxy task involves two operations, i.e., cube rearrangement and cube rotation, which enforce networks to learn translational and rotational invariant features from raw 3D data. Compared to the train-from-scratch strategy, fine-tuning from the pre-trained network leads to a better accuracy on various tasks, e.g., brain hemorrhage classification and brain tumour segmentation. The self-supervised learning approach can substantially boost the accuracy of 3D deep learning networks on the volumetric medical datasets without using extra data. This approach could also be adapted for MRI voxel datasets and is worth exploring.
3.2.2. Generative Adversarial Networks for MRI
Generative adversarial networks (GANs) are a special type of neural network system where two networks are trained simultaneously, with one tuned on image generation and the other on discrimination. Adversarial training schemes have gained popularity in both academia and industry, due to their usefulness in counteracting domain shift and effectiveness in generating new image samples. GANs have achieved a state-of-the-art performance in many image generation tasks, such as text-to-image synthesis [94], super-resolution [95] as well as image-to-image translation [96].
Unlike deep learning, which has its roots traced back to the 1980s [96], the concept of adversarial training is relatively new but there has been significant progress recently [97]. In the medical imaging field, GANs are widely used nowadays for medical image synthesis. There are two reasons for this, as discussed below:
(i) Although medical data sets become more accessible through public databases, most are restricted to specific medical conditions and are specific to measurement equipment and measurement protocols. Thus, availability of data for machine learning purposes still remains challenging, nevertheless synthetic data augmentation through the use of generative adversarial networks (GAN) may overcome this hurdle. Synthetic data also helps overcome privacy issues associated with medical data. It also addresses the problem of an insufficient number of positive cases that may be associated with each pathology, which limits the number of samples for training a classifier.
(ii) In addition, it is also widely accepted that there is limited expertise in annotating certain types of medical images or the annotation is so laborious that only a limited number of samples are incorporated in certain databases. For certain types of medical images, scaling, rotation, flipping, translation and elastic deformation have been used as a means to systematically augment datasets to increase the number of training samples [98]. However, these transformations are rather limiting in that they do not account for additional variations resulting from different imaging protocols or sequences, or variations in tumour morphology, location and texture according to a specific pathology. GANs provide a more generic solution for augmenting training images with promising results [99].
A current problem in developing a widely accepted database to compare the performance of different learning algorithms has led to novel approaches for generating artificially training datasets. Certain types of medical images are also too expensive to generate, so there is an interest in synthesising image samples. Zhang et al. [100] discussed the use of an adversarial learning-based approach to synthesise medical images for medical image tissue recognition. The performance of medical image recognition models highly depends on the degree of representativeness and the ability of all the required features in the training samples. Generative adversarial networks (GANs), which consist of a generative network and a discriminative network, can be used to develop a medical image synthesis model.
More specifically, deep convolutional GANs (DCGANs), Wasserstein GANs (WGANs) and boundary equilibrium GANs (BEGANs) can be used to synthesise medical images and their success rate can be compared. The justification for convolutional neural networks (CNNs) being applied in the GAN models, is that these can capture feature representations that describe a high level of semantic information in images. Synthetic images can be subsequently generated by employing the generative network mapping established. The effectiveness of the generative network can be validated by a discriminative network, which is trained to differentiate the synthetic images from real images. Through the adoption of a minimax two-player game learning routine, the generative and discriminative networks can train each other. The generated synthetic images can be finally used to train a CNN classification model for tissue recognition. Through experiments with synthetic images, a tissue recognition accuracy of 98.83% has been achieved [100], thus demonstrating the effectiveness and applicability of synthesising medical images through GAN models.
3.2.3. Semi-Supervised Knowledge Transfer for Deep Learning
Deep learning has dramatically advanced artificial intelligence in the past decade. Unlike traditional pattern recognition, manipulated features have always been dominant, so the number of parameters allowed in the feature space has been very limited. Recently a very popular learning scenario has been that of transfer learning [101]. One example of a related learning problem is when the data originates from different statistical distributions. This scenario is common in medical imaging, due to heterogeneous diseases or patient groups and/or due to differences between the acquisition of images, such as the use of different scanners or scanning protocols. Another example is encountered in the classification for the same data, such as in the detection of different types of abnormalities. Deep learning can automatically learn representations of features from big data that can contain thousands of parameters. Transfer learning is a learning modality that data scientists believe can further our progress towards Artificial General Intelligence. An example of this is the case where the goal of transfer learning is to learn from related learning problems.
The work of Carneiro et al. [102] demonstrated the merits of deep convolutional neural networks based on cross-domain transfer learning in medical image analysis. In their work, the area under curve (AUC) for benign and malignant binary classification problems exceeded 0.9, demonstrating a comprehensive solution to a challenging classification problem. Considering that traditional classification algorithms are difficult to use because of the existence of only a small number of labelled training samples, migration deep learning algorithms can also enable knowledge transfer between different but similar fields.
In a study aimed at predicting response to cancer treatment in the bladder, Cha et al. [103] compare networks without transfer learning, pre-trained on natural images, and pre-trained on bladder regions of interest (ROIs). They found that there are no statistically significant differences in the learning success rates between the two methods. Hwang and Kim [104] argue that it isnot possible to pre-train a network for medical data, because the data is not sufficiently similar. However, it is also suggested that the diversity of source data might be more important than its similarity to the target [90] for the method to be successful.
3.2.4. High-Dimensional Medical Imaging Analysis by Multi-Task Detection
Chartsias et al. [96] proposed a Spatial Decomposition Network (SDNet), which factorises 2D medical images into two groups with a higher level of abstraction: a group containing spatial anatomical factors and a group containing non-spatial modality factors, as illustrated in Figure 8. Such high-level representation of image features is ideally suited for several medical image analysis tasks, including the ones encountered in DCE-MRI, and can be applied in semi-supervised segmentation, multi-task segmentation and regression as well as image-to-image synthesis. Specifically, the proposed model can match the performance of fully supervised segmentation models, using only a fraction of the labelled images. Critically, the factorised representation also benefits from supervision obtained either when one uses auxiliary tasks to train the model in a multi-task setting reconstruction and segmentation, or when aggregating multimodal data from different sources (e.g., pooling together MRI and computer tomography (CT) data). To explore the properties of the learned factorisation, latent-space arithmetic can be applied [96]. The authors demonstrated that CT can be synthesised from MR and vice versa, by swapping the modality factors. It has also been demonstrated that the factor holding image specific information can be used to predict the input modality with high accuracy. A useful conclusion of this work is that description of medical image features at a higher level of abstraction provides new opportunities for information fusion across complementary imaging modalities.
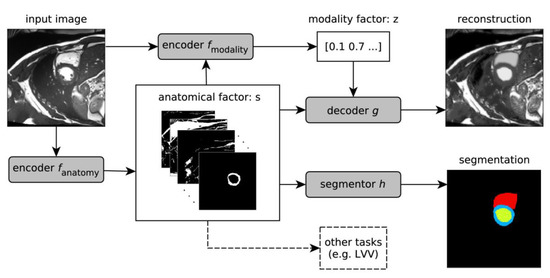
Figure 8.
Schematic overview of the proposed model. An input image is first encoded as a multi-channel spatial representation and an anatomical factor s is extracted using an anatomy encoder fanatomy. Then s can be used as an input to a segmentation network h to produce a multi-class segmentation mask (or some other task specific network). The anatomical factor s when integrated with the input image through a modality encoder fmodality is used to produce a latent vector z representing a specific imaging modality. The two representations s and z are then combined through a decoder to reconstruct the input image through the decoder network g for image reconstruction or a segmentor h for segmentation. This overview was developed in line with [105]. LVV means the Left Ventricular Volume.
3.2.5. Outlook for a Unified Multi-Dimensional Data Model from DCE-MRI via Multi-Task Learning
In the analysis of multi-dimensional medical images, especially in the analysis of noisy high-dimensional medical image data, the accurate recognition and detection of target images forms the basis for the subsequent analysis and classification tasks. Breast DCE-MRI involves multi-dimensional images that can be divided into multi-dimensional spatial structure images and multi-dimensional spatial image signals, these can in turn be further analysed and identified by using learning algorithms to match different dimensional features in the target domain images. The use of related features in different dimensions can significantly improve the classification success of MRI. By requiring the algorithm to converge while treating each dimensional feature independently, a multi-task MRI classification network can be designed so that it combines three modules of multi-dimensional spatial signals, spatial domain images and reconstructed tumour locations into an all-inclusive tumour classification network.
By sharing information across the three sub-modules during the training process, it is possible to maximise the utility of common features shared between medical images and potentially enable the development of a fully automatic, high-quality form of medical image classification and diagnosis.
Compared with natural images, paired training data sets of MRI are more difficult to obtain. In order to solve this problem and improve the image classification performance, an improved adversarial network framework is proposed as the perceptual discriminant network. The introduction of this network can be used to decide whether a segmented image is sufficiently realistic and representative of the organ or tissue observed. Unlike the ordinary adversarial networks discussed earlier, in the following paragraph we propose new network structure schemes that make use of new perceptual discriminant loss functions to achieve this goal. By combining the discriminant network that is used to automatically extract image structural features with the spatial signal features via the perceptual discriminant loss function, the aim is to improve the visual effect of image segmentation and classification accuracy.
A generating network can be designed to include a batch normalisation layer, a convolution layer, a deconvolution layer and a fully connected layer. The batch normalisation output of the convolution layer and the batch normalisation output of the corresponding deconvolution layer are spliced and used as the next input to the deconvolution layer. In order to combine the three sub-modules of structural image classification, image signal classification and reconstruction of tumour location information are subsequently conducted to form a multi-task classification network. The processing and tuning of each sub-module are conducted step by step, and at the same time, the information flow and information fusion between the sub-modules are optimized to maximise the transmission of information flow.
At the end of the network, a feature distillation module is positioned for automatically fusing all image features and removing redundant features, reducing the network model parameters for improved network performance. In the design of the loss function, we intended to fully consider the content, texture, color (intensity) and other characteristics of magnetic resonance images.
A series of new loss functions, such as spatial content loss (Content Loss, referred to as LossC), TV loss (Total Variation Loss, referred to as LossTV), and focal loss (LossFocal) can be expressed by using a generic partial loss function as follows:
here, indicates the image to be enhanced, u denotes the target image, denotes the output of the multi-task classification network and CHW indicates the spatial dimension of the enhanced image. The focal loss can be expressed as:
here, yi is the real category of the input instance, pi is the predicted probability that the input instance belongs to the category i and N is the number of pixels in the image space. The purpose of invoking the loss function is to reduce the loss of samples with a high probability of networks prediction under extremely unbalanced conditions of tumour categories, thereby enhancing the focus on positive samples and solving the problem of serious imbalance regarding the proportion of positive and negative samples.
An adversarial network can be utilised as a perceptual discriminant network. In order to function in this way, the output of the generated model and the numerically weighted images are used as the training set of the discriminant model. This model consists of two parts: the self-encoding module and the perceptual discriminating module.
The self-encoding module is used to encode its own image features so that the input image retains only its most important features, reducing computational complexity. The perceptual discriminant module introduces an improved VGG convolutional neural network architcture for extracting high-level semantic features of the image, and further judges the authenticity of the generated image from the high-level semantic feature level, so as to alleviate the difficulty of network training.
The discriminant model is an important auxiliary training part of the generative model and the output of the discriminant model is an important condition for generating the update weight of the network.
For the adversarial network, we planned to design a series of new loss functions to enhance color loss (Adversarial Color Loss, denoted as LossAC), adversarial semantic loss (Adversarial Semantic Loss, denoted as LossAS) and adversarial loss (Adversarial Loss, denoted as LossA), for the image to be further discriminated. The partial loss function can be expressed as:
where represents the jth convolutional layer of the perception discrimination module and represents the adversarial network.
The medical image enhancement framework completes the end-to-end magnetic resonance image enhancement task by jointly training the generation network (multi-task enhancement network) and the confrontation network (perceptual discrimination network).
Through the cooperation of multiple modules, the proposed model can extract the unique data features of medical images and achieve high-quality magnetic resonance image tumour classification from multiple feature spaces such as spatial structure, spatial signals and position details. This procedure is illustrated in Figure 9.
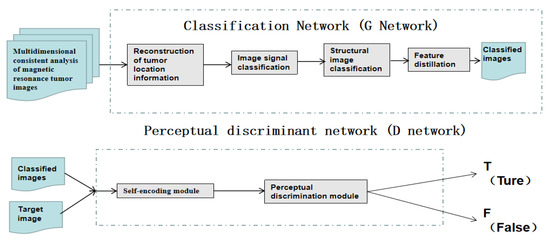
Figure 9.
Schematic diagram for constructing a multi-dimensional MRI enhancement framework based on generated confrontation learning, which is proposed.
4. Conclusions
Image feature extraction of breasts and pattern classification of breast fibrous glands have been discussed. Statistical parameters on the features of clinical interest can also be incorporated as separate entities to further refine classifier performance.
Deep learning in conjunction with convolutional neural networks can utilise additional parameters at higher level of abstraction to provide improved classification accuracy. These features may be either localised within an image or distributed across entire images or across different time instances. Dangers from inappropriate prioritisation of features in the input space of the classifier were also discussed.
The benefits of radiomic analysis when combined with imaging were also highlighted. Radiomic data based on the patho-physiology of a patient, as well as on the genome, proteome and transcriptome of a patient and associated biochemical markers can provide complementary information regarding a tumour state and contain additional information regarding disease progression, thus enabling personalised treatments. Such information can also be separately parametrised and incorporated within the feature space at the input of a classifier to improve classifier performance.
Different learning modalities that can potentially improve classifier performance were also discussed. Self-supervised and semi-supervised learning were critically considered and adversarial learning was proposed as a way forward, as it reduces the reliance on manually annotated data for classifier training.
Recent advances in high-field MRI that lead to higher resolution images were also considered and contrasted with DCE-MRI measurement modalities. DCE-MRI seems to be the most appropriate modality to characterize benign and malignant lesions. Although breast tissue DCE-MRI is highly sensitive, the specificity of the detection is very low. Integrating data across different images from different time stamps in a tensorial framework, provides additional opportunities for de-noising and extracting features in the data that may be distributed across the image plane and across different images at different time stamps. Analysis of such datasets using higher order singular value decomposition algorithms and using geometric algebra are proposed as a way forward because they enable more parameters to be integrated in a classifier. It is thus proposed that deep convolutional neural networks should make use of these tensorial datasets so as to take advantage of features that reside in spatio-temporal DCE-MRI.
Such approaches can also advance semi-supervised tumour segmentation routines. In addition, self-supervised learning approaches were critically considered. Advances in generative adversarial networks and semi-supervised knowledge transfer for deep learning were also discussed. Finally, the general structure of a high-dimensional medical imaging analysis platform that is based on multi-task detection and learning is proposed as a way forward. The proposed algorithm makes use of novel loss functions that form the building blocks for a generated confrontation learning methodology for tensorial DCE-MRI.
Author Contributions
Conceptualization, X.-X.Y.; Methodology, X.-X.Y.; Validation, X.-X.Y.; Formal Analysis, X.-X.Y.; Investigation, X.-X.Y.; Resources, X.-X.Y.; Writing-Original Draft Preparation, X.-X.Y.; Writing-Review & Editing, S.H.; Supervision, X.-X.Y. & S.H.; Project Administration, L.Y.; Funding Acquisition, L.Y. All authors have read and agreed to the published version of the manuscript.
Funding
This project is supported in part by the National Natural Science Foundation of China under contract Number 61872100.
Conflicts of Interest
The authors declare no conflict of interest.
References
- Liberman, L.; Menell, J.H. Breast imaging reporting and data system(BI-RADS). Radiol. Clin. N. Am. 2002, 40, 409–430. [Google Scholar] [CrossRef]
- Boyd, N.F.; Helen, G.; Martin, L.J.; Sun, L.; Stone, J.; Fishell, E.; Jong, R.A.; Hislop, G.; Chiarelli, A.; Minkin, S.; et al. Mammographic density and the risk and detection of breast cancer. N. Engl. J. Med. 2007, 56, 227–236. [Google Scholar] [CrossRef] [PubMed]
- Tice, J.A.; O’Meara ESs Weaver, D.L.; Vachon, C.; Ballard-Barbash, R.; Kerlikowske, K. Benign breast disease, mammographic breast density, and the risk of breast cancer. Jnci J. Natl. Cancer Inst. 2013, 105, 1043–1049. [Google Scholar] [CrossRef] [PubMed]
- Brenner, R.J. Background parenchymal enhancement at breast MR imaging and breast cancer risk. Breast Dis. Year Book Q. 2012, 23, 145–147. [Google Scholar] [CrossRef]
- You, C.; Peng, W.; Zhi, W.; He, M.; Liu, G.; Xie, L.; Jiang, L.; Hu, X.; Shen, X.; Gu, Y. Association between background parenchymal enhancement and pathologic complete Remission throughout the neoadjuvant chemotherapy in breast cancer patients. Transl. Oncol. 2017, 10, 786–792. [Google Scholar] [CrossRef]
- Gillies, R.J.; Kinahan, P.E.; Hricak, H. Radiomics: Images are more than pictures, they are data. Radiology 2016, 278, 563–577. [Google Scholar] [CrossRef]
- Skandalakis, J.E. Embryology and Anatomy of the Breast; Springer: Berlin/Heidelberg, Germany, 2009. [Google Scholar]
- Liu, Z.; Wang, S.; Dong, D.; Wei, J.; Fang, C.; Zhou, X.; Sun, K.; Li, L.; Li, B.; Wang, M.; et al. The Applications of Radiomics in Precision Diagnosis and Treatment of Oncology: Opportunities and Challenges. Theranostics 2019, 9, 1303–1322. [Google Scholar] [CrossRef]
- Nahid, A.-A.; Kong, Y. Involvement of Machine Learning for Breast Cancer Image Classification: A Survey. Comput. Math. Methods Med. 2017, 2017, 3781951. [Google Scholar] [CrossRef]
- Tardivon, A.A.; Athanasiou, A.; Thibault, F.; El Khoury, C. Breast imaging and reporting data system(BIRADS): Magnetic resonance imaging. Eur. J. Radiol. 2007, 61, 212–215. [Google Scholar] [CrossRef]
- Kwan-Hoong, N.; Susie, L. Vision20/20: Mammographic breast density and its clinical applications. Med. Phys. 2015, 42, 7059–7077. [Google Scholar]
- ACR. Breast Imaging Reporting and Data System® (BI-RADS®), 3rd ed.; American College of Radiology: Reston, VA, USA, 1998. [Google Scholar]
- Arslan, G.; Çelik, L.; Çubuk, R.; Çelik, L.; Atasoy, M.M. Background parenchymal enhancement: Is it just an innocent effect of estrogen on the breast? Diagn. Interv. Radiol. 2017, 23, 414–419. [Google Scholar] [CrossRef] [PubMed]
- Dontchos, B.N.; Rahbar, H.; Partridge, S.C.; Korde, L.A.; Lam, D.L.; Scheel, J.R.; Peacock, S.; Lehman, C.D. Are Qualitative Assessments of Background Parenchymal Enhancement, Amount of Fibroglandular Tissue on MR Images, and Mammographic Density Associated with Breast Cancer Risk? Radiology 2015, 276, 371–380. [Google Scholar] [CrossRef] [PubMed]
- Lambin, P.; Rios-Velazquez, E.; Leijenaar, R.; Carvalho, S.; van Stiphout, R.G.; Granton, P.; Zegers, C.M.; Gillies, R.; Boellard, R.; Dekker, A.; et al. Radiomics: Extracting more information from medical images using advanced feature analysis. Eur. J. Cancer 2012, 48, 441–446. [Google Scholar] [CrossRef]
- Hassani, C.; Saremi, F.; Varghese, B.A.; Duddalwar, V. Myocardial Radiomics in Cardiac MRI. Am. J. Roentgenol. 2020, 214, 536–545. [Google Scholar] [CrossRef]
- Montemurro, F.; Martincich, L.; Sarotto, I.; Bertotto, I.; Ponzone, R.; Cellini, L.; Redana, S.; Sismondi, P.; Aglietta, M.; Regge, D. Relationship between DCE-MRI morphological and functional features and histopathological characteristics of breast cancer. Eur. Radiol. 2007, 17, 1490–1497. [Google Scholar] [CrossRef]
- Shin, H.J.; Jin, Y.P.; Shin, K.C.; Kim, H.H.; Cha, J.H.; Chae, E.Y.; Choi, W.J. Characterization of tumour and adjacent peritumoural stroma in patients with breast Cancer using high-resolution diffusion-weighted imaging: Correlation with pathologic biomarkers. Eur. J. Radiol. 2016, 85, 1004–1011. [Google Scholar] [CrossRef]
- Sutton, E.J.; Jung Hun, O.; Dashevsky, B.Z.; Veeraraghavan, H.; Apte, A.P.; Thakur, S.B.; Deasy, J.O.; Morris, E.A. Breast cancer subtype intertumour heterogeneity: MRI-based features Predict results of a genomic assay. J. Magn. Reson. Imaging 2015, 42, 1398–1406. [Google Scholar] [CrossRef]
- Wut, W. Computer-Aided diagnosis of breast DCE-MRI using pharmacokinetic model and 3-D morphology analysis. Magn. Reson. Imaging 2014, 32, 197–205. [Google Scholar]
- Darmanayagam, S.E.; Harichandran, K.N.; Cyril, S.R.R.; Arputharaj, K. A novel supervised approach for segmentation of lung parenchyma from chest CT for computer-aided diagnosis. J. Digit. Imaging 2013, 26, 496–509. [Google Scholar] [CrossRef]
- Niehaus, R.; Raicu, D.S.; Furst, J.; Armato, S., III. Toward understanding the size dependence of shape features for predicting spiculation in lung nodules for computer-aided diagnosis. J. Digit. Imaging 2015, 28, 704–717. [Google Scholar] [CrossRef]
- Lavanya, R.; Nagarajan, N.; Devi, M.N. Computer-Aided diagnosis of breast cancer by hybrid fusion of ultrasound and mammogram features. In Artificial Intelligence and Evolutionary Algorithms in Engineering Systems; Springer: Berlin/Heidelberg, Germany, 2015; pp. 403–409. [Google Scholar]
- Chen, Y.; Wang, Y.; Kao, M.; Chuang, Y. Deep photo enhancer: Unpaired learning for image enhancement from photographs with gans. In Proceedings of the IEEE Conference on Computer Vision and Pattern Recognition, Salt Lake City, UT, USA, 18–23 June 2018; pp. 6306–6314. [Google Scholar]
- Yan, Z.; Zhang, H.; Wang, B.; Paris, S.; Yu, Y. Automatic photo adjustment using deep neural networks. ACM Trans. Graph. 2016, 35, 11. [Google Scholar] [CrossRef]
- Su, M.Y.; Mühler, A.; Lao, X.; Nalcioglu, O. Tumor characterization with dynamic contrast–enhanced MRI using mr contrast agents of various molecular weights. Magn. Reson. Med. 1998, 39, 259–269. [Google Scholar] [CrossRef]
- Lee, S.H.; Kim, J.H.; Cho, N.; Park, J.S.; Yang, Z.; Jung, Y.S.; Moon, W.K. Multilevel analysis of spatiotemporal association features for differentiation of tumour enhancement patterns in breast DCE-MRI. Med. Phys. 2010, 37, 3940–3956. [Google Scholar] [CrossRef]
- Dhara, A.K.; Mukhopadhyay, S.; Khandelwal, N. Computer-Aided detection and analysis ofpulmonary nodule from CT images: A survey. IETE Tech. Rev. 2012, 29, 265–275. [Google Scholar] [CrossRef]
- Firmino, M.; Angelo, G.; Morais, H.; Dantas, M.R.; Valentim, R. Computer-Aided detection (CADe) and diagnosis (CADx) system for lung cancer with likelihood of malignancy. Biomed. Eng. Online 2016, 15, 2–17. [Google Scholar] [CrossRef]
- Sun, T.; Zhang, R.; Wang, J.; Li, X.; Guo, X. Computer-Aided diagnosis for early-stage lung cancer based on longitudinal and balanced data. PLoS ONE 2013, 8, e63559. [Google Scholar] [CrossRef]
- Messay, T.; Hardie, R.C.; Rogers, S.K. A new computationally efficient CAD system for pulmonary nodule detection in CT imagery. Med. Image Anal. 2010, 14, 390–406. [Google Scholar] [CrossRef]
- Jacobs, C.; van Rikxoort, E.M.; Scholten, E.T.; de Jong, P.A.; Prokop, M.; Schaefer-Prokop, C.; van Ginneken, B. Solid, part-solid, or non-solid? Classification of pulmonary nodules in low-dose chest computed tomography by a computer-aided diagnosis system. Investig. Radiol. 2015, 50, 168–173. [Google Scholar] [CrossRef]
- Sharma, S.; Khanna, P. Computer-Aided diagnosis of malignant mammograms using Zernike moments and SVM. J. Digit. Imaging 2015, 28, 7–90. [Google Scholar] [CrossRef]
- Kooi, T.; Karssemeijer, N. Boosting classification performance in computer aided diagnosis of breast masses in raw full-field digital mammography using processed and screen film images. In Medical Imaging 2014: Computer-Aided Diagnosis; SPIE: Bellingham, WA, USA, 2014. [Google Scholar] [CrossRef]
- Tourassi, G.D.; Frederick, E.D.; Markey, M.K.; Floyd, C.E., Jr. Application of the mutual information criterion for feature selection in computer-aided diagnosis. Med. Phys. 2001, 28, 2394–2402. [Google Scholar] [CrossRef]
- Zheng, B.; Sumkin, J.H.; Zuley, M.L.; Lederman, D.; Wang, X.; Gur, D. Computer-Aided detection of breast masses depicted on full-field digital mammograms: A performance assessment. Br. J. Radiol. 2012, 85, 153–161. [Google Scholar] [CrossRef] [PubMed]
- Peng, L.; Chen, W.; Zhou, W.; Li, F.; Yang, J.; Zhang, J. An immune-inspired semi-supervised algorithm for breast cancer diagnosis. Comput. Methods Programs Biomed. 2016, 134, 259–265. [Google Scholar] [CrossRef] [PubMed]
- Yan, Y.; Sun, X.; Shen, B. Contrast agents in dynamic contrast-enhanced magnetic resonance imaging. Oncotarget 2017, 8, 43491–43505. [Google Scholar] [CrossRef]
- Newell, D.; Nie, K.; Chen, J.H.; Hsu, C.C.; Yu, H.J.; Nalcioglu, O.; Su, M.Y. Selection of diagnostic features on breast MRI to differentiate between malignant and benign lesions using computer-aided diagnosis. Eur. Radiol. 2010, 20, 771–781. [Google Scholar] [CrossRef] [PubMed]
- Yang, Q.; Li, L.; Zhang, J.; Shao, G.; Zhang, C.; Zheng, B. Computer-aided diagnosis of breast DCE-MRI images using bilateral asymmetry of contrast enhancement between two breasts. J. Digit. Imaging 2014, 27, 152–160. [Google Scholar] [CrossRef]
- Yang, Q.; Li, L.; Zhang, J.; Shao, G.; Zheng, B. A computerized global MR image feature analysis scheme to assist diagnosis of breast cancer: A preliminary assessment. Eur. J. Radiol. 2014, 83, 1086–1091. [Google Scholar] [CrossRef]
- Jalalian, A.; Mashohor, S.; Mahmud, R.; Karasfi, B. Foundation and methodologies in computer-aided diagnosis systems for breast cancer detection. EXCLI J. 2017, 20, 113–137. [Google Scholar]
- Rastghalam, R.; Pourghassem, H. Breast cancer detection using MRF-based probable texture feature and decision-level fusion-based classification using HMM on thermography images. Pattern Recognit. 2016, 51, 176–186. [Google Scholar] [CrossRef]
- Rouhi, R.; Jafari, M.; Kasaei, S.; Keshavarzian, P. Benign and malignant breast tumours classification based on region growing and CNN segmentation. Expert Syst. Appl. 2015, 42, 990–1002. [Google Scholar] [CrossRef]
- Khalil, R.; Osman, N.M.; Chalabi, N.; Ghany, E.A. Unenhanced breast MRI: Could it replace dynamic breast MRI in detecting and characterizing breast lesions? Egypt. J. Radiol. Nucl. Med. 2020, 51, 10. [Google Scholar] [CrossRef]
- Azar, A.T.; El-Said, S.A. Performance analysis of support vector machines classifiers in breast cancer mammography recognition. J. Neural Comput. Appl. 2014, 24, 1163–1177. [Google Scholar] [CrossRef]
- Pawlovsky, A.P.; Nagahashi, M. A method to select a good setting for the kNN algorithm when using it for breast cancer prognosis. In Proceedings of the 2014 IEEE-EMBS International Conference on Biomedical and Health Informatics (BHI), Valencia, Spain, 1–4 June 2014; pp. 189–192. [Google Scholar]
- Kharya, S.; Agrawal, S.; Soni, S. Naive Bayes Classifiers: A Probabilistic Detection Model for Breast Cancer. Int. J. Comput. Appl. 2014, 92, 26–31. [Google Scholar] [CrossRef]
- Yang, S.-N.; Li, F.J.; Chen, J.M.; Zhang, G.; Liao, Y.H.; Huang, T.C. Kinetic Curve Type Assessment for Classification of Breast Lesions Using Dynamic Contrast-Enhanced MR Imaging. PLoS ONE 2016, 11, e0152827. [Google Scholar] [CrossRef]
- Pineda, F.D.; Medved, M.; Wang, S.; Fan, X.; Schacht, D.V.; Sennett, C.; Oto, A.; Newstead, G.M.; Abe, H.; Karczmar, G.S. Ultrafast Bilateral DCE-MRI of the Breast with Conventional Fourier Sampling: Preliminary Evaluation of Semi-Quantitative Analysis. Acad. Radiol. 2016, 23, 1137–1144. [Google Scholar] [CrossRef]
- Yin, X.-X.; Ng, B.W.H.; Ramamohanarao, K.; Baghai-Wadji, A.; Abbott, D. Exploiting sparsity and low-rank structure for the recovery of multi-slice breast MRIs with reduced sampling error. Med. Biol. Eng. Comput. 2012, 50, 991–1000. [Google Scholar] [CrossRef]
- Yin, X.-X.; Hadjiloucas, S.; Chen, J.H.; Zhang, Y.; Wu, J.-L.; Su, M.-Y. Tensor based multichannel reconstruction for breast tumours identified from DCE-MRIs. PLoS ONE 2017, 12, e0172111. [Google Scholar]
- Negrete, N.T.; Takhtawala, R.; Shaver, M.; Kart, T.; Zhang, Y.; Kim, M.J.; Park, V.Y.; Su, M.; Chow, D.S.; Chang, P. Automated breast cancer lesion detection on breast MRI using artificial intelligence. J. Clin. Oncol. 2019, 37 (Suppl. S15), e14612. [Google Scholar] [CrossRef]
- Mardani, M.; Gong, E.; Cheng, J.Y.; Vasanawala, S.S.; Zaharchuk, G.; Xing, L.; Pauly, J.M. Deep Generative Adversarial Neural Networks for Compressive Sensing MRI. IEEE Trans. Med. Imaging 2019, 38, 167–179. [Google Scholar] [CrossRef]
- Dong, C.; Loy, C.C.; Tang, X. Accelerating the super-resolution convolutional neural network. In European Conference on Computer Vision; Springer: Cham, Switzerland, 2016; pp. 391–407. [Google Scholar]
- Yin, X.-X.; Hadjiloucas, S.; Zhang, Y. Pattern Classification of Medical Images: Computer Aided Diagnosis; Springer: New York, NY, USA, 2017. [Google Scholar]
- Yin, X.X.; Zhang, Y.; Cao, J.; Wu, J.L.; Hadjiloucas, S. Exploring the complementarity of THz pulse imaging and DCE-MRIs: Toward a unified multi-channel classification and a deep learning framework. Comput. Methods Programs Biomed. 2017, 137, 87–114. [Google Scholar] [CrossRef]
- Aragón, G.; Aragón, J.L.; Rodríguez, M.A. Clifford Algebras and Geometric Algebra. Adv. Appl. Clifford Algebras 1997, 7, 91–102. [Google Scholar] [CrossRef]
- Tucker, L. Some mathematical notes on three-mode factor analysis. Psychometrika 1966, 31, 279–311. [Google Scholar] [CrossRef]
- Bader, B.; Kolda, T. Efficient MATLAB computations with sparse and factored tensors. SIAM J. Sci. Comput. 2008, 30, 205–231. [Google Scholar] [CrossRef]
- Kolda, T.; Bader, B.W. Tensor decompositions and applications. SIAM Rev. 2009, 51, 455–500. [Google Scholar] [CrossRef]
- Cichocki, A.; Zdunek, R.; Phan, A.H.; Amari, S. Nonnegative Matrix and Tensor Factorizations: Applications to Exploratory Multi-Way Data Analysis and Blind Source Separation; John Wiley and Sons, Ltd.: West Susses, UK, 2009. [Google Scholar]
- Gharbi, M.; Chen, J.; Barron, J.T.; Hasinoff, S.W.; Durand, F. Deep bilateral learning for real-time image enhancement. ACM Trans. Graph. 2017, 36, 118. [Google Scholar] [CrossRef]
- Ignatov, A.; Kobyshev, N.; Timofte, R.; Vanhoey, K.; Vangool, L. DSLR-quality photos on mobile devices with deep convolutional networks. In Proceedings of the IEEE International Conference on Computer Vision, Venice, Italy, 22–29 October 2017. [Google Scholar]
- Sun, L.; Fan, Z.; Huang, Y.; Ding, X.; Paisley, J. A deep information sharing network for multi-contrast compressed sensing MRI reconstruction. arXiv 2018, arXiv:1804.03596. [Google Scholar] [CrossRef]
- Olut, S.; Sahin, Y.H.; Demir, U.; Unal, G. Generative adversarial training for MRA image synthesis using multi-contrast MRI. arXiv 2018, arXiv:1804.04366. [Google Scholar]
- Shen, D.; Wu, G.; Suk, H.I. Deep learning in medical image analysis. Annu. Rev. Biomed. Eng. 2017, 19, 221–248. [Google Scholar] [CrossRef]
- Wu, H.Q. Improving Emotion Classification on Chinese Microblog Texts with Auxiliary Coss-Domain Data. In Proceedings of the 2015 International Conference on Affective Computing and Intelligent Interaction (ACII), Xi’an, China, 21–24 September 2015. [Google Scholar]
- Zheng, C.; Xia, Y.; Chen, Y.; Yin, X.-X.; Zhang, Y. Early Diagnosis of Alzheimer’s Disease by Ensemble Deep Learning Using FDG-PET, IScIDE 2018. In Intelligence Science and Big Data Engineering; Lecture Notes in Computer Science; Springer: Cham, Switzerland, 2018; Volume 11266, pp. 614–622. [Google Scholar]
- Szegedy, C.; Liu, W.; Jia, Y.; Sermanet, P.; Reed, S.; Anguelov, D.; Vanhoucke, A. Rabinovich, Going deeper with convolutions. In Proceedings of the 2015 IEEE Conference on Computer Vision and Pattern Recognition (CVPR), Boston, MA, USA, 7–12 June 2015. [Google Scholar] [CrossRef]
- Li, J.; Fang, F.; Mei, K.; Zhang, G. Multi-scale Residual Network for Image Super-Resolution. In Proceedings of the European Conference on Computer Vision, Munich, Germany, 8–14 September 2018. [Google Scholar]
- Han, Z.; Wei, B.; Zheng, Y.; Yin, Y.; Li, K.; Li, S. Breast Cancer Multi-classification from Histopathological Images with Structured Deep Learning Model. Sci. Rep. 2017, 7, 4172. [Google Scholar] [CrossRef]
- Rasti, R.; Teshnehlab, M.; Phung, S.L. Breast cancer diagnosis in DCE-MRI using mixture ensemble of convolutional neural networks. Pattern Recognit. 2017, 72, 381–390. [Google Scholar] [CrossRef]
- Lehman, C.D.; DeMartini, W.; Anderson, B.O.; Edge, S.B. Indications for breast MRI in the patient with newly diagnosed breast cancer. J. Natl. Compr. Cancer Netw. 2009, 7, 193–201. [Google Scholar] [CrossRef]
- Lundervold, A.S.; Lundervold, A. An overview of deep learning in medical imaging focusing on MRI. Zeitschrift für Medizinische Physik 2019, 29, 102–127. [Google Scholar] [CrossRef]
- Bayro-Corrochano, E.; Buchholz, S. Geometric neural networks, visual and motor signal neurocomputation. In Algebraic Frames for the Perception-Action Cycle; Sommer, G., Zeevi, Y.Y., Eds.; Springer: Heidelberg, Germany; New York, NY, USA, 2005; pp. 379–394. [Google Scholar]
- Wang, X.; Smith, K.; Hyndman, R. Characteristic-Based Clustering for Time Series Data. Data Min. Knowl. Discov. 2006, 13, 335–364. [Google Scholar] [CrossRef]
- Policker, S.; Geva, A.B. Nonstationary time series analysis by temporal clustering. IEEE Trans. Syst. Man Cybern. Part B (Cybernetics) 2000, 30, 339–343. [Google Scholar] [CrossRef]
- Rani, S.; Sikka, G. Recent Techniques of Clustering of Time Series Data: A Survey. Int. J. Comput. Appl. 2012, 52, 1–9. [Google Scholar] [CrossRef]
- Wang, J.; Wang, H. A Supervoxel-Based Method for Groupwise Whole Brain Parcellation with Resting-State fMRI Data. Front. Hum. Neurosci. 2016, 10, 1–659. [Google Scholar] [CrossRef] [PubMed]
- Saraswathi, S.; Allirani, A. Survey on image segmentation via clustering. In Proceedings of the 2013 International Conference on Information Communication and Embedded Systems (ICICES), Chennai, India, 21–22 February 2013; pp. 331–335. [Google Scholar]
- Yin, X.; Ng, B.W.H.; Ferguson, B.; Abbott, D. Wavelet based local tomographic image using terahertz techniques. Digit. Signal. Process. 2009, 19, 750–763. [Google Scholar] [CrossRef]
- Yin, X.; Ng, B.W.H.; Ferguson, B.; Mickan, S.P.; Abbott, D. 2-D wavelet segmentation in 3-D T-ray tomography. IEEE Sens. J. 2007, 7, 342–343. [Google Scholar] [CrossRef][Green Version]
- Lin, N.; Jiang, J.; Guo, S.; Xiong, M. Functional Principal Component Analysis and Randomized Sparse Clustering Algorithm for Medical Image Analysis. PLoS ONE 2015, 10, e0132945. [Google Scholar] [CrossRef]
- Ramiya, A.M.; Nidamanuri, R.R.; Ramakrishnan, K. A supervoxel-based spectro-spatial approach for 3D urban point cloud labelling. Int. J. Remote Sens. 2016, 37, 4172–4200. [Google Scholar] [CrossRef]
- Bindu, H. Discrete Wavelet Transform Based Medical Image Fusion using Spatial frequency Technique. Int. J. Syst. Algorithms Appl. 2012, 2, 2277–2677. [Google Scholar]
- Amami, A.; Azouz, Z.B.; Alouane, M.T. AdaSLIC: Adaptive supervoxel generation for volumetric medical images. Multimed. Tools Appl. 2019, 78, 3723–3745. [Google Scholar] [CrossRef]
- Sun, L.; He, J.; Yin, X.; Zhang, Y.; Chen, J.H.; Kron, T.; Su, M.Y. An image segmentation framework for extracting tumours from breast magnetic resonance images. J. Innov. Opt. Health Sci. 2018, 11, 1850014. [Google Scholar] [CrossRef]
- Zhu, X.; Goldberg, A.B. Introduction to semi-supervised learning. In Synthesis Lectures on Artificial Intelligence and Machine Learning; Morgan & Claypool Publishers: San Rafael, CA, USA, 2009; pp. 1–130. [Google Scholar]
- Cheplygina, V.; de Bruijne, M.; Pluim, J.P.-W. Not-so-supervised: A survey of semi-supervised, multi-instance, and transfer learning in medical image analysis. Med. Image Anal. 2019, 54, 280–296. [Google Scholar] [CrossRef]
- Chapelle, O.; Scholkopf, B.; Zien, A. Semi-Supervised Learning; MIT Press: Cambridge, UK, 2006; Volume 2. [Google Scholar]
- Vong, W.K.; Navarro, D.J.; Perfors, A. The helpfulness of category labels in semi-supervised learning depends on category structure. Psychon. Bull. Rev. 2016, 23, 230–238. [Google Scholar] [CrossRef] [PubMed]
- Chen, L.; Bentley, P.; Mori, K.; Misawa, K.; Fujiwara, M.; Rueckert, D. Self-supervised learning for medical image analysis using image context restoration. Med. Image Anal. 2019, 58, 2019. [Google Scholar] [CrossRef] [PubMed]
- Zhuang, X.; Li, Y.; Hu, Y.; Ma, K.; Yang, Y.; Zheng, Y. Self-supervised Feature Learning for 3D Medical Images by Playing a Rubik’s Cube. In Medical Image Computing and Computer Assisted Intervention—MICCAI 2019. MICCAI 2019. Lecture Notes in Computer Science; Shen, D., Ed.; Springer: Cham, Switzerland, 2019; Volume 11767. [Google Scholar]
- Xu, T.; Zhang, P.; Huang, Q.; Zhang, H.; Gan, Z.; Huang, X.; He, X. Attngan: Fine-grained text to image generation with attentional generative adversarial networks. arXiv 2017, arXiv:1711.10485. [Google Scholar]
- Ledig, C.; Theis, L.; Huszar, F.; Caballero, J.; Cunningham, A.; Acosta, A.; Aitken, A.; Tejani, A.; Totz, J.; Wang, Z.; et al. Photo-realistic single image super-resolution using a generative adversarial network. arXiv 2017, arXiv:1609.04802. [Google Scholar]
- Zhu, J.Y.; Park, T.; Isola, P.; Efros, A.A. Unpaired image-to-image translation using cycle-consistent adversarial networks. arXiv 2017, arXiv:1703.10593. [Google Scholar]
- Yi, X.; Walia, E.; Babyn, P. Generative adversarial network in medical imaging: A review. Med. Image Anal. 2019, 58, 101552. [Google Scholar] [CrossRef]
- Simard, P.Y.; Steinkraus, D.; Platt, J.C. Best practices for convolutional neural networks applied to visual document analysis. In Proceedings of the Seventh International Conference on Document Analysis and Recognition, Edinburgh, UK, 6 August 2003; pp. 958–963. [Google Scholar]
- Zhang, Q.; Wang, H.; Lu, H.; Won, D.; Yoon, S.W. Medical Image Synthesis with Generative Adversarial Networks for Tissue Recognition. In Proceedings of the 2018 IEEE International Conference on Healthcare Informatics (ICHI), New York, NY, USA, 4–7 June 2018; pp. 199–207. [Google Scholar]
- Pan, S.J.; Yang, Q. A survey on transfer learning. IEEE Trans. Knowl. Data Eng. 2010, 22, 1345–1359. [Google Scholar] [CrossRef]
- Carneiro, G.; Nascimento, J.; Bradley, A.P. Bradley, Automated Analysis of Unregistered Multi-View Mammograms with Deep Learning. IEEE Trans. Med. Imaging 2017, 36, 2355–2365. [Google Scholar] [CrossRef]
- Chang, H.; Han, J.; Zhong, C.; Snijders, A.; Mao, J.-H. Unsupervised transfer learning via multi-scale convolutional sparse coding for biomedical applications. IEEE Trans. Pattern Anal. Mach. Intell. 2017, 40, 1182–1194. [Google Scholar] [CrossRef] [PubMed]
- Hwang, S.; Kim, H.-E. Self-transfer learning for fully weakly supervised object localization. arXiv 2016, arXiv:1602.01625. [Google Scholar]
- Chartsias, A.; Joyce, T.; Papanastasiou, G.; Semple, S.; Williams, M.; Newby, D.E.; Dharmakumar, R.; Tsaftaris, S.A. Disentangled representation learning in cardiac image analysis. Med. Image Anal. 2019, 58, 101535. [Google Scholar] [CrossRef]


Publisher’s Note: MDPI stays neutral with regard to jurisdictional claims in published maps and institutional affiliations. |
© 2020 by the authors. Licensee MDPI, Basel, Switzerland. This article is an open access article distributed under the terms and conditions of the Creative Commons Attribution (CC BY) license (http://creativecommons.org/licenses/by/4.0/).