Article

Novel Cost Reduction Method for Wind Farms Associated with Energy Storage Systems by Optimal Kinetic Energy Control

1
Department of Electrical and Electronic Engineering, Chiba University, Chiba 263-8522, Japan
2
Department of Electrical and Electronic Engineering, Kitami Institute of Technology (KIT), Hokkaido 090-8507, Japan
*
Author to whom correspondence should be addressed.
Appl. Sci. 2020, 10(20), 7223; https://doi.org/10.3390/app10207223
Submission received: 29 September 2020 / Revised: 12 October 2020 / Accepted: 13 October 2020 / Published: 16 October 2020
(This article belongs to the Special Issue Wind Generators: Technology and Trends)

Abstract

:
Wind power generation provides an attractive method for tackling global environmental issues. However, the power grid cannot accommodate large amount of wind farms (WFs) because the fluctuation of WF output degrades the power quality (frequency and voltage) in the power grid. Technical requirements that are related to WF power fluctuation are issued in many countries in order to introduce the WF without degrading power quality. Therefore, it is essential to smooth the WF output in order to satisfy the technical requirements. This paper proposes an operation methodology for a system that is composed of energy storage systems (ESSs) and WF by kinetic energy (KE) control. Moreover, an optimal KE control is presented. The economical aspect and the advantage of the proposed system are verified through scenario simulations.

1. Introduction

Wind power generation is spotlighted because of global warming and the depletion of fossil fuels, etc. [1]. If a large number of wind farms (WFs) are introduced to the power systems, it leads to a solution to the above issues, since thermal power generation in the power system is reduced. However, the power quality, such as frequency and voltage in the power system, is degraded because WF output constantly fluctuates with wind speed [2,3,4]. In the worst case, the power system may get unstable. Therefore, it is essential to smooth the WF output to maintain the power quality. In fact, technical requirements that are related to WF power fluctuation are issued in many countries [5,6,7].
To this end, three main approaches: energy storage system (ESS) (battery, superconducting magnetic energy storage system, or flywheel, etc.) [4,6,7,8,9,10,11,12,13,14], pitch angle control [15,16,17], and kinetic energy (KE) [18,19,20,21] control have been studied. The ESS is the most widely used in these approaches. However, its cost is very high. Some control schemes that reduce the rated power (the rated capacity) of the ESS have been proposed. A first-order low-pass filter (FLF) is usually used in ESS control systems [8,9,10]. Although the FLF is simple, a large rated ESS power is required. To improve the FLF, complex methods (optimal FLF [6,7], high-order filter [4], Kalman filter [13], fuzzy control [11], and machine learning method [12], etc.) have been proposed. Nevertheless, it is difficult to reduce the rated power (the rated capacity) of the ESS sufficiently. A simple controller composed of a gain and a second-order high-pass filter was proposed in [14]. This controller can reduce the rated power of the ESS more than the FLF. However, further cost reduction is desired in order to smooth the output of large-scale WFs.
The pitch angle control can smooth wind generator (WG) output without an ESS [15,16,17]. The implementation of the pitch angle control is easy and its installation cost is inexpensive. However, the WG output significantly decreases, since blades of the WG are operated in order to release the wind. It implies that the profit significantly decreases. In addition, the increase of mechanical stress and fatigue of the WG is inevitable. Therefore, it is impractical for the WG output to be smoothed by the pitch angle control.
The KE control has been proposed in order to smooth the WG output without releasing the wind [18,19,20,21]. The KE stored in the rotor of the WG can be used to smooth the WG output. When the smoothing command is received, the rotating mass releases or absorbs energy via rotor speed deceleration/acceleration. The control system is simple and easy to implement, as is the case of pitch angle control. Nevertheless, the operating point of the WG is shifted from the maximum power point. It implies that there is a trade-off between the WG output smoothing and the generating efficiency. Therefore, the reduction of the generating efficiency is inevitable in the KE control, although the efficiency of WG with KE control is higher than that with pitch angle control [18,19,20]. In addition, the available KE of the WG is much less than the energy of ESS. As a result, it is hard to satisfy the technical requirement (see Section 2.4) with only the KE control.
Table 1 summarizes the characteristics of standard smoothing methods. Because these methods have both advantages and disadvantages, it is difficult to achieve both cost reduction and WF output smoothing by a single method. Methods that coordinate these systems may achieve a good trade-off between these two objection. Although the system without ESS is attractive, there is no better way to replace the ESS completely, as discussed above.
This paper proposes a system that is composed of ESS and WF operated by the KE control. In addition, we present a coordination method for the ESS and WF via the optimization of the KE control. The optimal KE control can consider the trade-off between smoothing the WG output and the generating efficiency. As a result, the efficiency of the WG can be increased with the KE controller. The KE control was developed in [18] for a single WG. We generalize it to fit for all WGs in the WF. Moreover, an economical aspect of the KE control is revealed through scenario simulations. The advantage of the proposed system is verified by a comparative analysis with the standard system that is composed of ESS and WF operated by maximum power point tracking (MPPT).
The rest of the paper is organized, as follows: Section 2 describes the overall system under consideration. Section 3 briefly reviews the standard MA KE control and presents the optimal KE control for the WF. The cost calculation method is investigated for the proposed system with the ESS and the WF operated by the KE control in Section 4. The effectiveness of the proposed system is verified based on the cost comparison and scenario simulations with real wind data in Section 5. Section 6 concludes this paper.

2. System Description

2.1. System Configuration

Figure 1 shows the system configuration. In Figure 1, n is the number of WGs, V i ( i = 1 , 2 , , n ) is the wind speed, ω i ( i = 1 , 2 , , n ) is the mechanical rotor angular frequency, P i ( i = 1 , 2 , , n ) is the WG output, P WF ( = i = 1 n P i ) is the WF output, P b is the ESS output, and P g ( = P WF P b ) is the power that is supplied to the power system called combined output power. Note that the positive sign of P b implies power charge of the ESS. First, the WF output is smoothed by the KE control in the proposed system. Subsequently, the WF output is mitigated by the ESS in order to satisfy the technical requirement. The cost can be reduced, since the KE control can reduce the peak power of the WF output. Namely, the rated power of the ESS can be reduced.
When it is clear from the context, a continuous-time signal x ( t ) or a discrete-time signal x [ k ] is simply denoted by x (For simplicity, x [ k ] = x ( k T s ) is used where k 0 and T s are the sample number and the sampling period, respectively). Moreover, the time function and its Laplace transform are denoted by the same notation, such as P ( t ) and P ( s ) .

2.2. Wind Turbine Model

The output characteristics of the wind turbine [22,23] are expressed by:
P i = 1 2 ρ π R 2 V i 3 C p ( β , λ ) ,
C p ( λ , β ) = 0.5176 116 λ i 0.4 β 5 e 21 λ i + 0.0068 λ ,
1 λ i = 1 λ + 0.08 β 0.035 β 3 + 1 ,
λ = ω i R V i ,
d ω i pu d t = 1 2 H ( T m i T e i ) ,
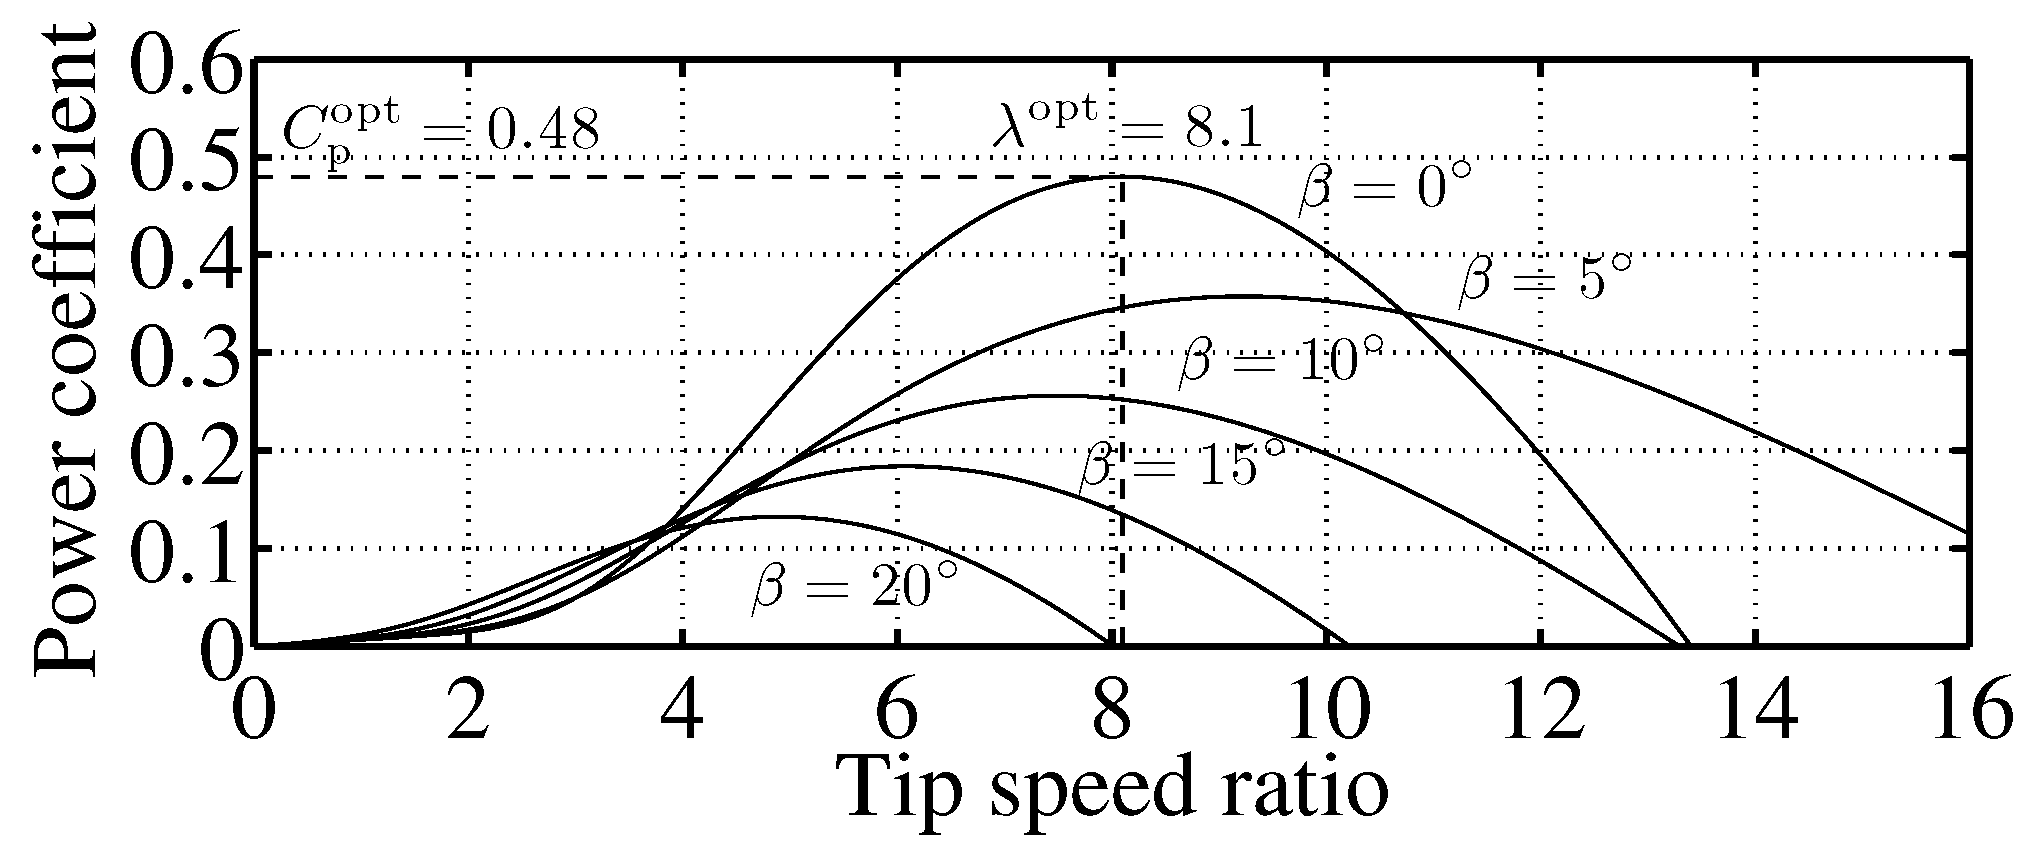
where ρ ( = 1.225 kg / m 3 ) is the air-density, R is the radius of rotor blade, λ is the tip speed ratio, β is the blade pitch angle, C p is the power coefficient, H is the inertia constant of the WG, T m i ( i = 1 , 2 , , n ) is the mechanical torque, and T e i ( i = 1 , 2 , , n ) is the electrical torque. The subscripts pu denote the per-unit. In variable speed wind turbines, high efficiency operation is achieved by MPPT, which keeps C p ( λ , β ) maximum. Figure 2 shows the C p - λ curve of the wind turbine. From Figure 2, the maximum power coefficient C p opt = 0.48 and the optimum tip speed ratio λ opt = 8.1 ( β is kept at zero) are known. As shown in [22,23], the MPPT output reference P i mppt and its per-unit are given by
P i mppt = 1 2 ρ π R 2 R λ opt 3 C p opt ω i 3 [ W ] ,
P i pu mppt = P i mppt P n = ω i pu 3 [ p . u . ] ,
respectively. In (7), the rated output P n of the WG is 1 2 ρ π R 2 ( R λ opt ) 3 C p opt ( ω i n ) 3 where ω i n is the rated mechanical rotor angular frequency. It is clear that the MPPT reference is calculated without measuring the wind speed. Note that a pitch angle control system [24] is used in order to prevent the wind turbine from rotating faster than the rated speed.

2.3. ESS Control System

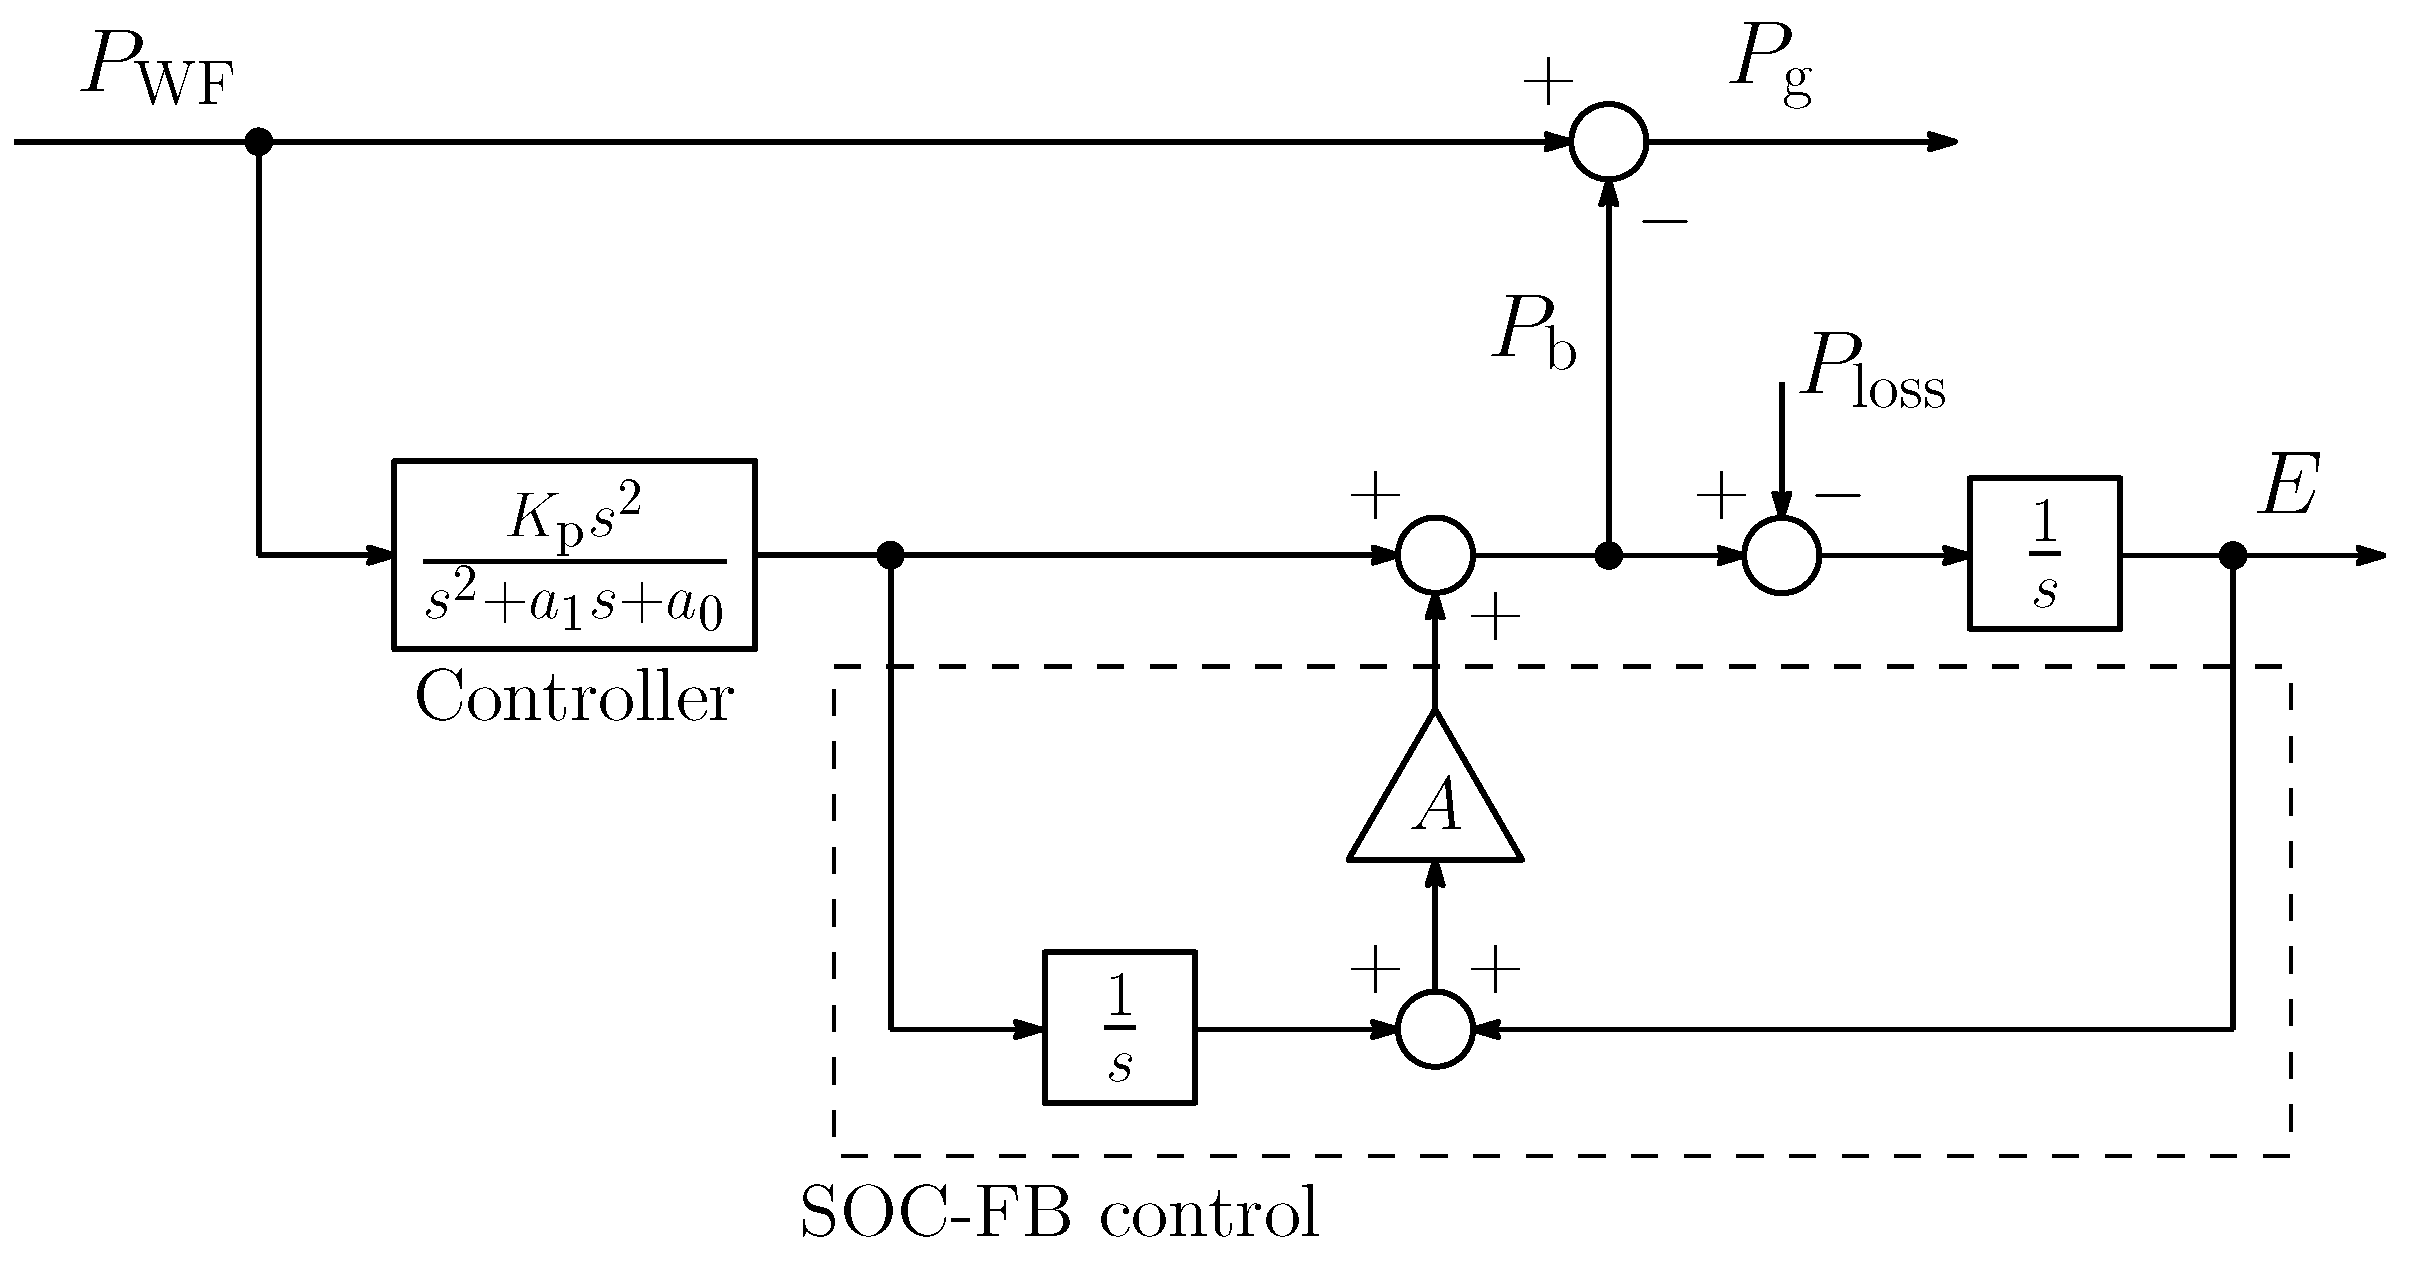
The ESS control system that was proposed in [14] is briefly described in this subsection. Figure 3 shows the ESS configuration (the block diagram of the ESS in Figure 1). P loss is the charge/discharge loss of the ESS, as given by
P loss ( t ) = ( 1 η ) · P b ( t ) ( P b ( t ) > 0 ) , ( 1 1 η ) · P b ( t ) ( P b ( t ) < 0 )
where η is the charge/discharge efficiency of the ESS. E denotes the remaining energy of the ESS that is calculated by integrating P b P loss . In Figure 3, the block diagram in the dashed frame shows the SOC-FB control [8], which regulates the state-of-charge (SOC) to its reference, and A is the SOC-FB gain. A controller K ( s ) that removes short-period components from the WF output is given by
K ( s ) = K p · G hpf ( s ) , G hpf ( s ) = s 2 s 2 + a 1 s + a 0
where a 0 , a 1 > 0 , K p ( 0 < K p 1 ) is a constant gain and G hpf ( s ) is a second-order high-pass filter. The WF output are divided into short and long period components P WF s and P WF l . Specifically, P WF s = s 2 P WF ( s ) / ( s 2 + a 1 s + a 0 ) , P WF l = ( a 1 s + a 0 ) P WF ( s ) / ( s 2 + a 1 s + a 0 ) and P WF ( s ) = P WF s + P WF l . Thus, the combined output is obtained by
P g ( s ) = ( 1 K p ) · P WF s + P WF l .
It is clear that the short-period component is reduced by a factor of ( 1 K p ) and the long-period component is directly supplied to the power system. Moreover, the ESS output is given by
P b ( t ) K p · P WF s .
Consequently, the controller proposed in [14] can reduce the required rated power of the ESS by a factor of K p .

2.4. Fluctuation of Combined Output and Technical Requirement

In this paper, the cost of the system that is composed of the ESS and the WF operated by KE control is investigated based on the following technical requirement [6,7,14].
  • The maximum power change per minute is within 10% of the WF power rating.
The combined output fluctuation Δ F g in a 1-min window is defined as
Δ F g ( t ) = max t 1 - min τ t P g ( τ ) min t 1 - min τ t P g ( τ ) P WF n ,
where P WF n is the rated WF output. Therefore, the WF output has to be mitigated in order to satisfy Δ F g ( t ) 10 % .

3. Kinetic Energy Control

As mentioned in Section 1, the KE control has a trade-off between smoothing the WG output and the generating efficiency. First, this section explains the standard KE control using MA. Subsequently, an optimized KE control considering the trade-off is proposed to improve the cost efficiency of KE control. Although a KE control is applied to a single WG in general, we generalize the KE control for the WF.

3.1. Standard Moving Average Kinetic Energy Control

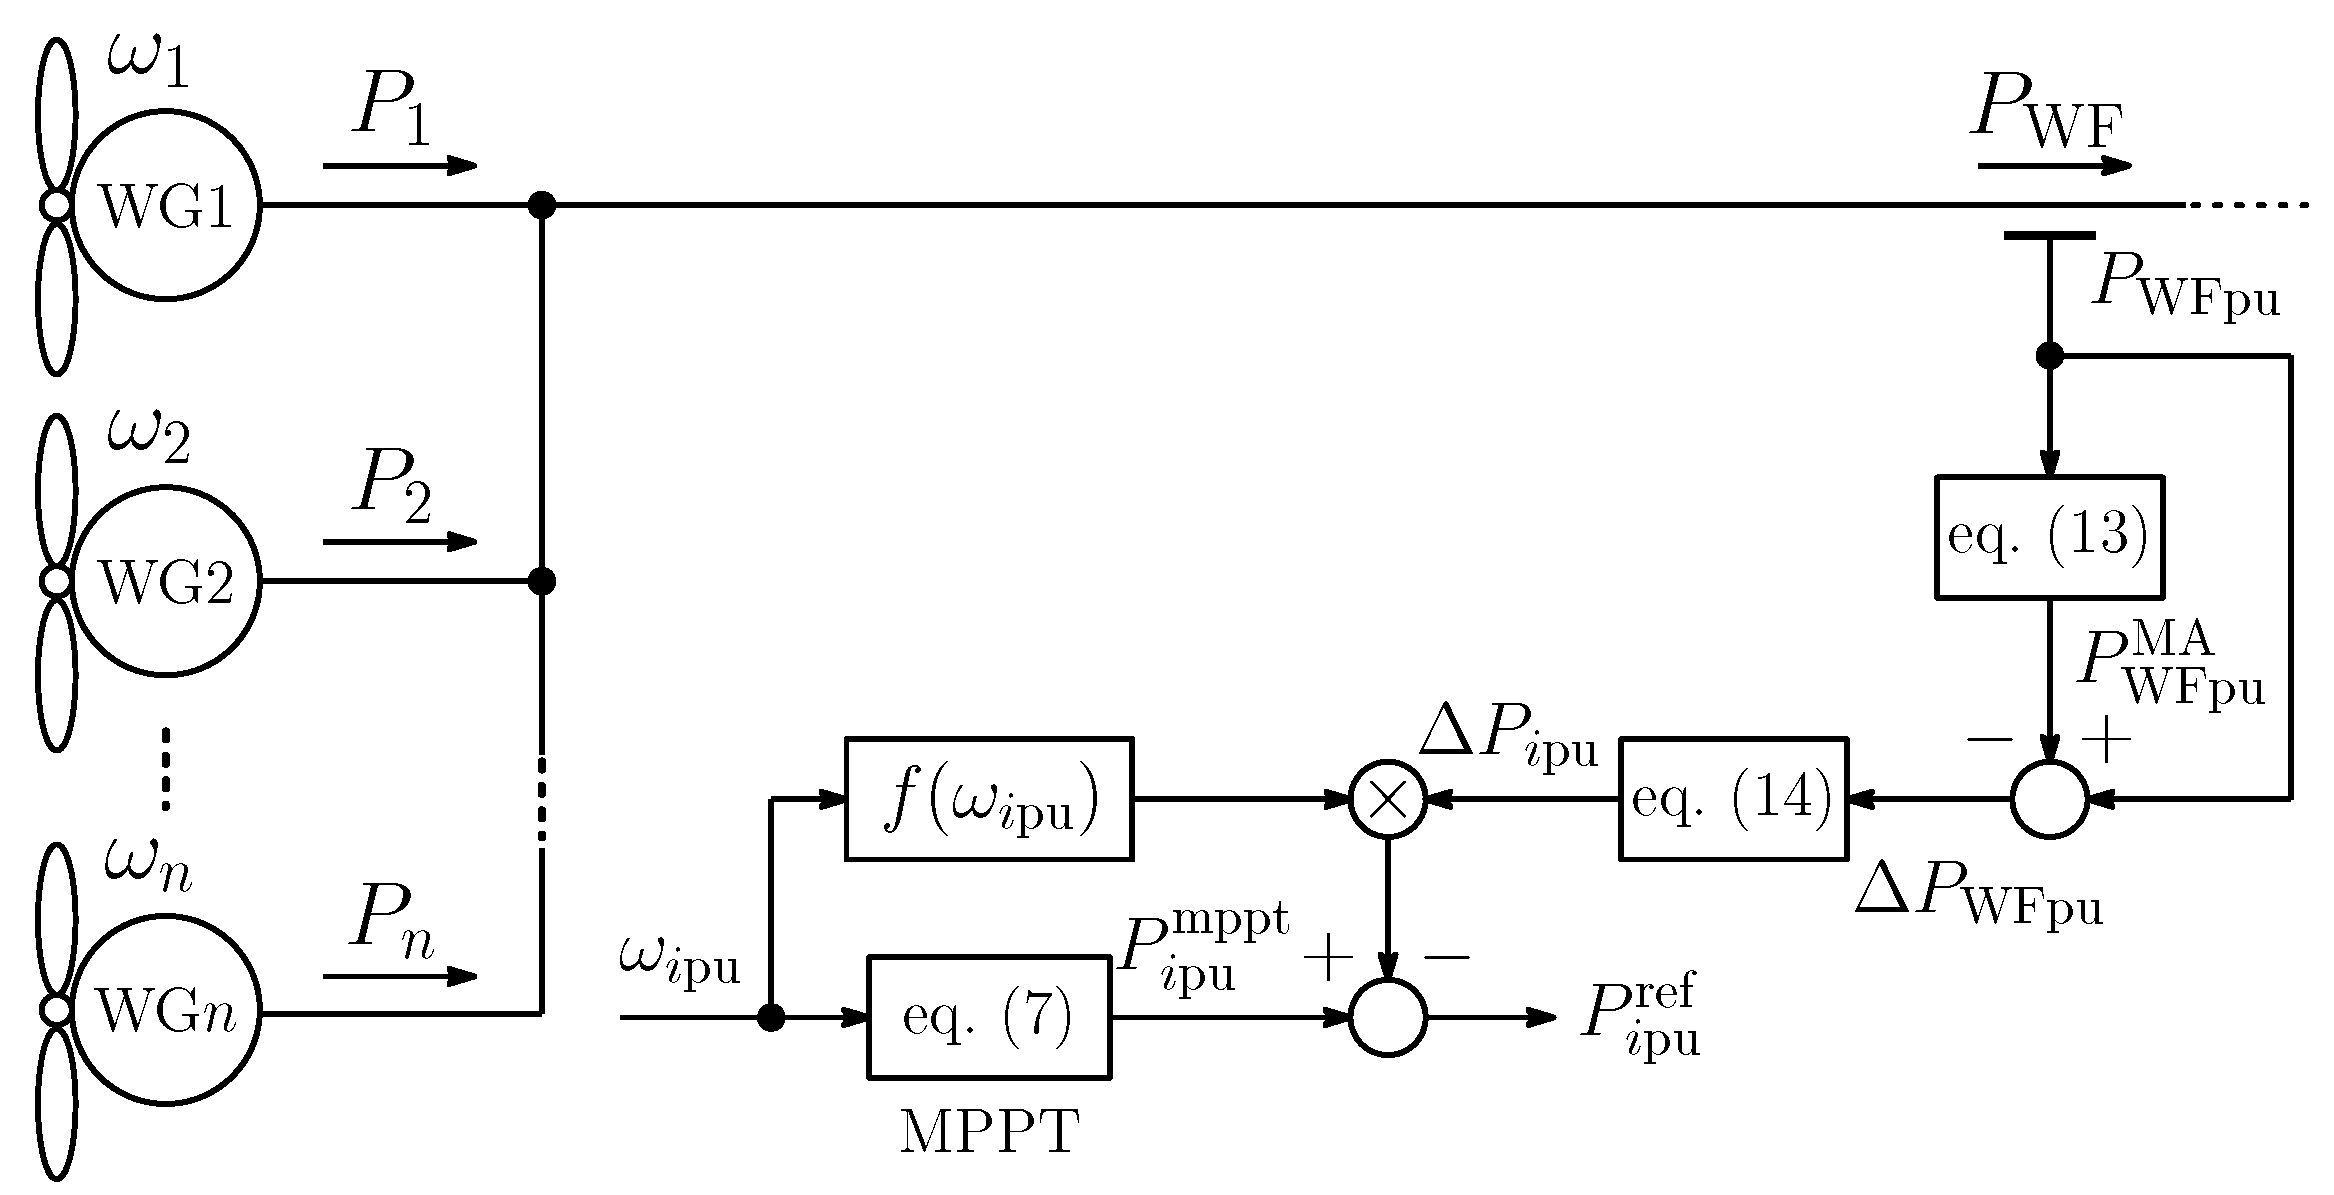
A KE control can be achieved by making the WG output follow its reference P i pu ref ( i = 1 , 2 , , n ) without the short-period components. Figure 4 shows the WGs with the MA KE control [18]. The short-period components of the WF output Δ P WF pu are smoothed out by the MA that is defined by
P WF pu MA [ k ] = 1 m i = 1 m P WF pu [ k ]
where P WF pu MA is MA of P WF pu in the last m steps. Subsequently, Δ P WF pu ( = P WFpu P WF pu MA ) is allocated to each WG, as follows
Δ P i pu = P i pu mppt P WF pu mppt · Δ P WF pu
where Δ P i pu ( i = 1 , 2 , , n ) is the fluctuation component to be compensated by WG and P WF pu mppt = i = 1 n P i pu mppt . The KE used to smooth the WF output increases by allocating the fluctuation components based on (14), because a WG with a higher rotational speed can release the KE more than other WGs with a low rotational speed. The generator efficiency can be increased by applying this allocation method to the method that was proposed in [18]. Finally, the WG reference output is given by
P i pu ref = P i pu mppt f ( ω i pu ) · Δ P i pu ,
where f ( ω i pu ) is given by
f ( ω i pu ) = 1 ( 0.5 < ω i pu ) , ( 10 ω i pu 4 ) ( 0.4 ω i pu 0.5 ) , 0 ( ω i pu < 0.4 ) .
The role of f ( ω i pu ) is to prevent the WG with low rotational speed from releasing excessive energy [18]. In this paper, the dynamics of the back-to-back converter in the WG is ignored to shorten the simulation time, because it is known that this does not affect the analysis, except for transient analysis, such as voltage dips [25]. Namely, this paper assumes P i ref P i .

3.2. Optimal Kinetic Energy Control

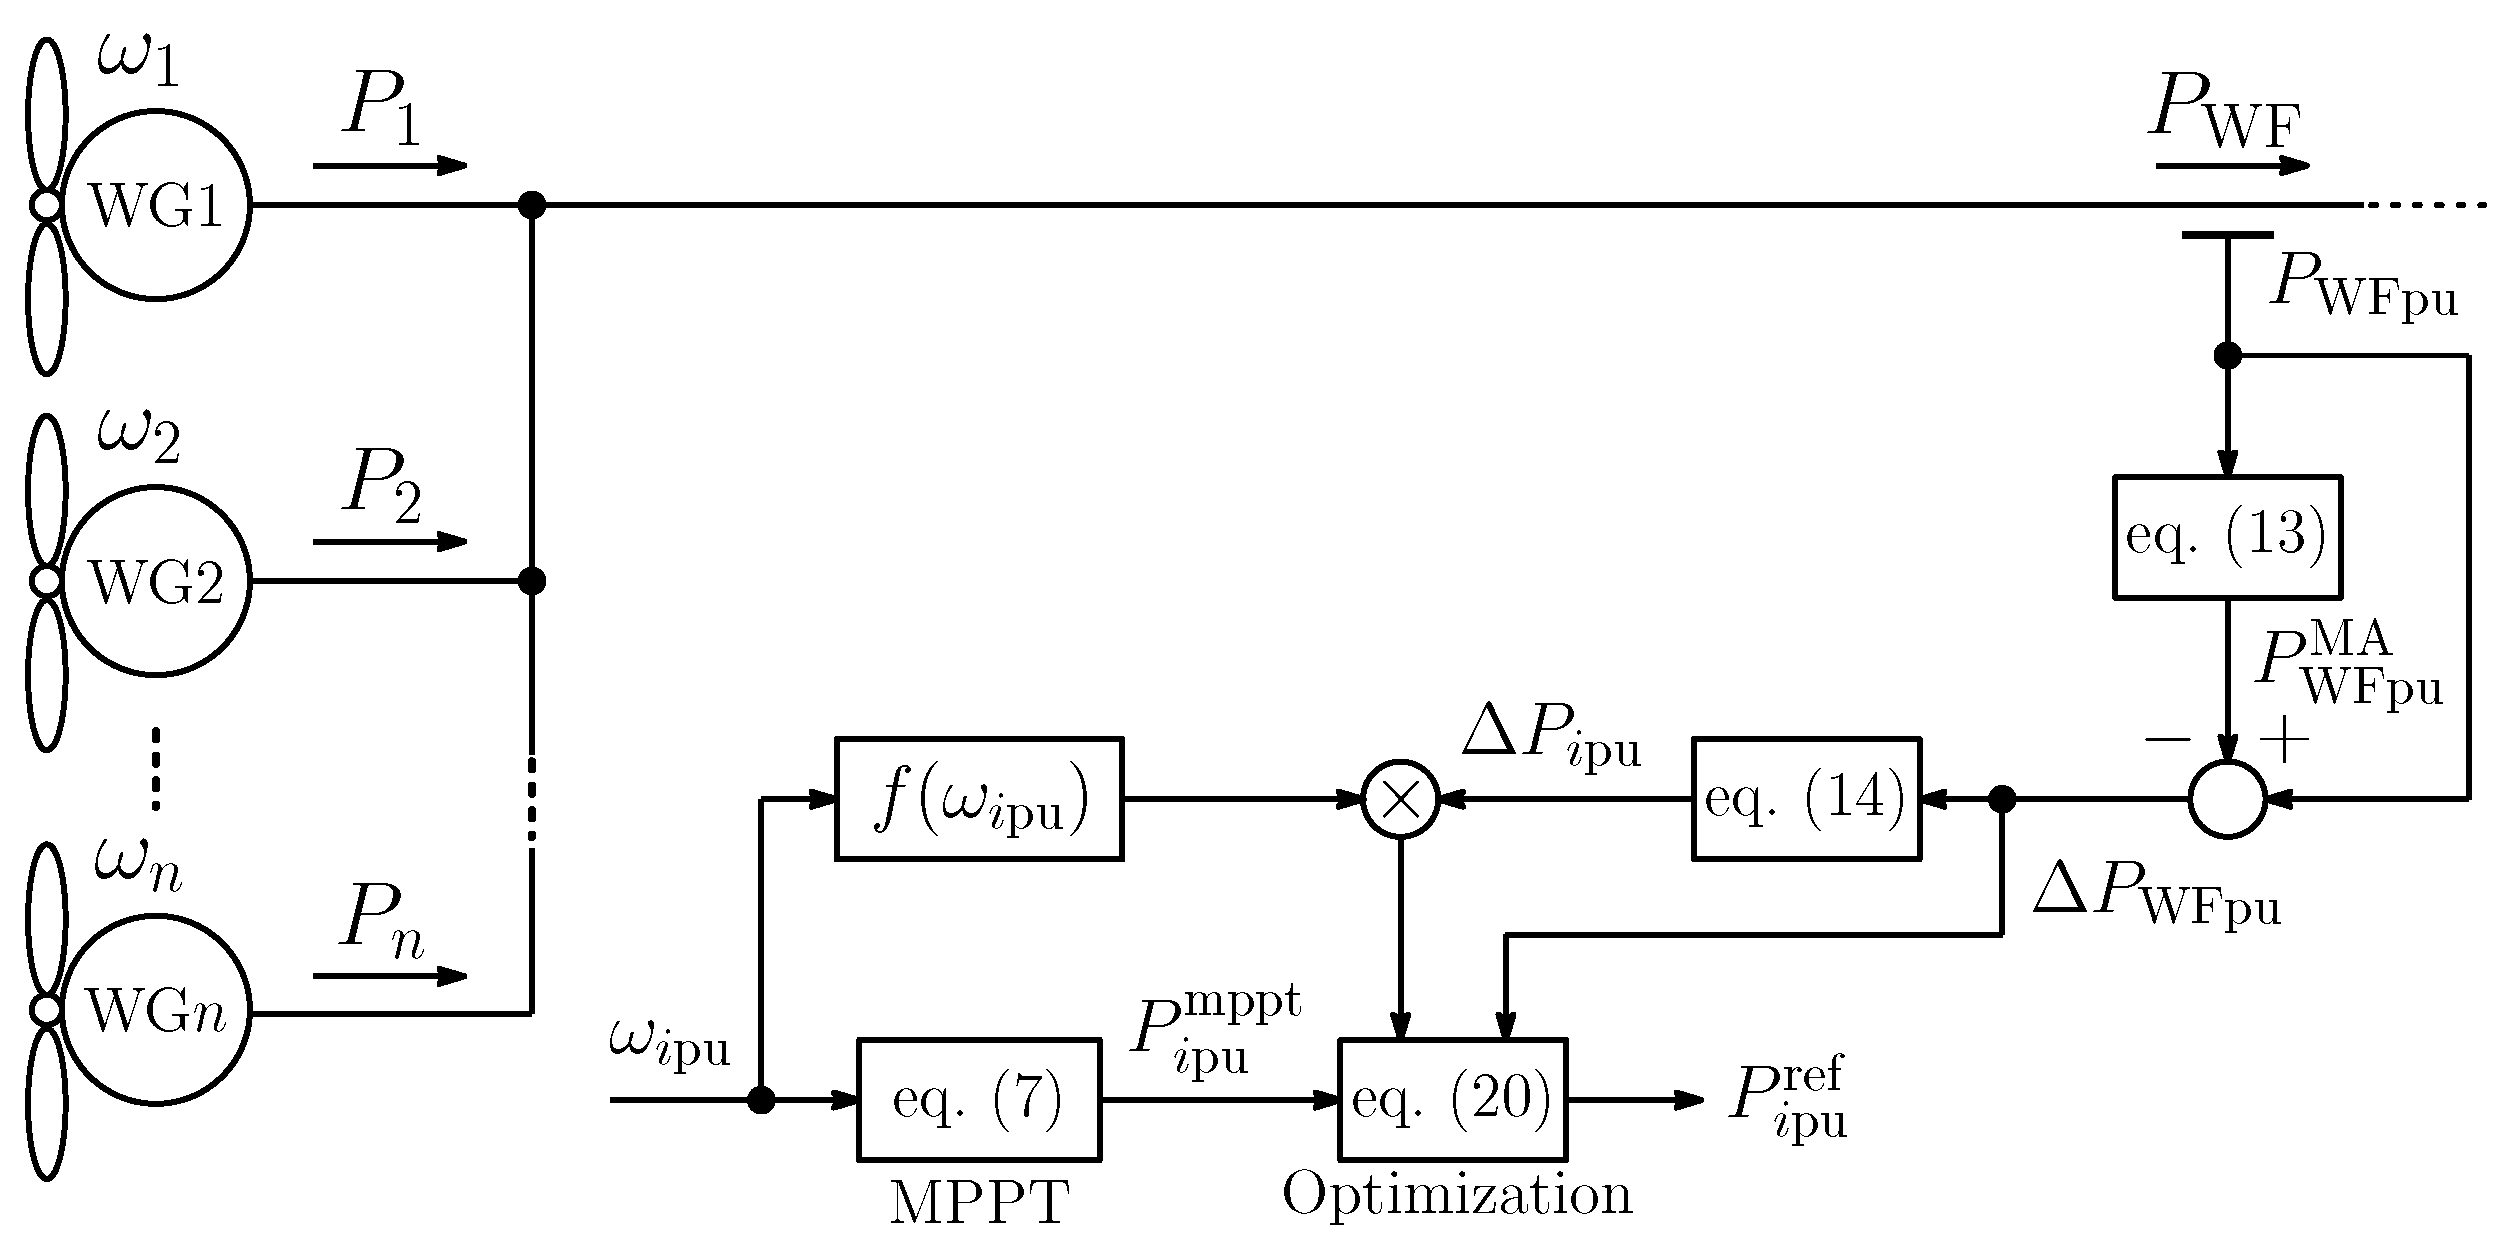
Figure 5 shows the WGs with the proposed optimal KE control. To consider the trade-off between the WG output smoothing and the generating efficiency, we optimize the WG reference by the following optimization problem:
P i pu ref = arg min J ( P i pu mppt , f ( ω i pu ) · Δ P i pu ) ,
where
J ( P i pu mppt , f ( ω i pu ) · Δ P i pu ) = ( P i pu mppt P i pu ref ) 2 + q ( ( P i pu mppt f ( ω i pu ) · Δ P i pu ) P i pu ref ) 2 .
The roles of the first term and the second term in (18) keeps the generating efficiency and smooths the WF output, respectively. It is clear that the WF can be optimally operated, handling the trade-off, when each WG output is regulated to its reference P i pu ref that is obtained from (17). In (18), q is a nonlinear weight that is given by
q = K q ( | Δ P WF pu | ) α ,
where K q 0 and the natural number α are weight and exponent weight, respectively. Weight q becomes small when Δ P WF pu approaches zero. It implies that the generating efficiency increases when the fluctuation of the WF output is small, because the second term in (18) is low. Figure 6 shows the relation between Δ P WF pu and q ( K q , α ) . Although it is difficult to find the best values of K q and α analytically, these weights can be determined based on the technical requirement and Figure 6. For example, when Δ P WF pu 0.1 p . u . , q has to be large in order to guarantee the technical requirement Δ F g ( t ) 10 % . Therefore, K q and α in (19) should be determined to satisfy the condition that q is large when Δ P WF pu 0.1 p . u .
The solution P i pu ref of (17) can be easily obtained by solving d J d P i pu ref = 0 because (18) is a convex function of P i pu ref . The solution is
P i pu ref = P i pu mppt + q ( P i pu mppt f ( ω i pu ) · Δ P i pu ) 1 + q .
The calculation time of (20) is short because (20) is a purely algebraic calculation. Therefore, this method does not require any special software (CPLEX and Gurobi, etc.) or numerical optimization (genetic algorithm and particle swarm optimization, etc.).

4. Cost Calculation Method

This section explains the method for estimating the cost of the system that is composed of the ESS and the WF operated by KE control. The cost during the lifespan of a WG is investigated in this analysis.
We define the installation cost of WF, ESS, an opportunity loss of WF, ESS, and cost of power converter system (PCS) of the battery in order to calculate the total cost of the system composed of the ESS and the WF operated by KE control, as follows:
  • Installation cost of WF:
    C WF I [ JPY ] = n × P n [ kW ] × WG price [ JPY / kW ] ,
  • Opportunity loss of WF:
    C WF O [ JPY ] = E WF loss [ kWh / h ] × Lifespan of WG [ h ] × Wind power price [ JPY / kWh ] ,
  • Installation cost of ESS:
    C ESS I [ JPY ] = Rated capacity [ kWh ] × Battery price [ JPY / kWh ] Battery lifespan [ h ] × Lifespan of WG [ h ] ,
  • Opportunity loss of ESS:
    C ESS O [ JPY ] = E ESS loss [ kWh / h ] × Lifespan of WG [ h ] × Wind power price [ JPY / kWh ] .
  • Cost of PCS:
    C PCS [ JPY ] = PCS price [ JPY / kW ] × Rated power of ESS [ kW ] .
For simplicity, the maintenance cost is neglected. The energy loss E WF loss is defined by 0 1 h [ P WF MPPT ( t ) P WF MA ( t ) ( or P WF opt ( t ) ) ] d t which implies the energy lost by the KE control. The rated capacity of the ESS [kWh] is determined by the rated power of the ESS that was obtained by the simulations. Although the cost of an ESS is determined by the rated capacity, it is constrained by the rated power of the ESS through the so-called C-rate [14,26]. The C-rate is given by
C-rate = Rated power of ESS [ kW ] Rated Capacity of ESS [ kWh ] .
In (24), E ESS loss is the integral of the charge/discharge loss 0 1 h P loss ( t ) d t . Battery lifespan depends on the calendar life L cal and cycle life L cyc . L cal is the lifespan due to the deterioration over time when the ESS does not charge/discharge. By contrast, L cyc is the lifespan due to the deterioration when ESS charges/discharges and it is influenced by the number of charge/discharge and the depth of discharge (DOD) [27]. Figure 7 shows the relation between the number of cycles (charge/discharge) and the DOD [28]. L cyc can be estimated by the rain-flow counting [29,30] and Figure 7 from the time responses obtained by simulation. Refer to [29,30] for the detailed calculation method of L cyc . The battery lifespan is calculated by
Battery lifespan min { L cal , L cyc } .
The total cost of the system is calculated by
Total cos t = C WF I + C WF O + C ESS I + C ESS O + C PCS .
From (28), the profit obtained in the WG lifespan can be calculated by
profit = 0 1 h P WF MPPT ( t ) d t [ kWh / h ] × Lifespan of WG [ h ] × Wind power price [ JPY / kWh ] Total cos t [ JPY ] .
As a result, we can validate the system that is composed of the ESS and the WF operated by KE control based on (28) and (29).
One hour simulation is conducted under typical wind condition to compute the generated energy and energy loss. Subsequently, all costs/profits are evaluated under the assumption that wind condition represents the typical situation.
Remark 1.
The cost evaluation is of course rather rough because of the limitation of available wind data. Its precision can be improved by replacing E WF loss , E ESS loss , 0 1 h P WF MPPT d t , L cyc by the corresponding per hour averages if the wind data is available.

5. Simulations and Discussions

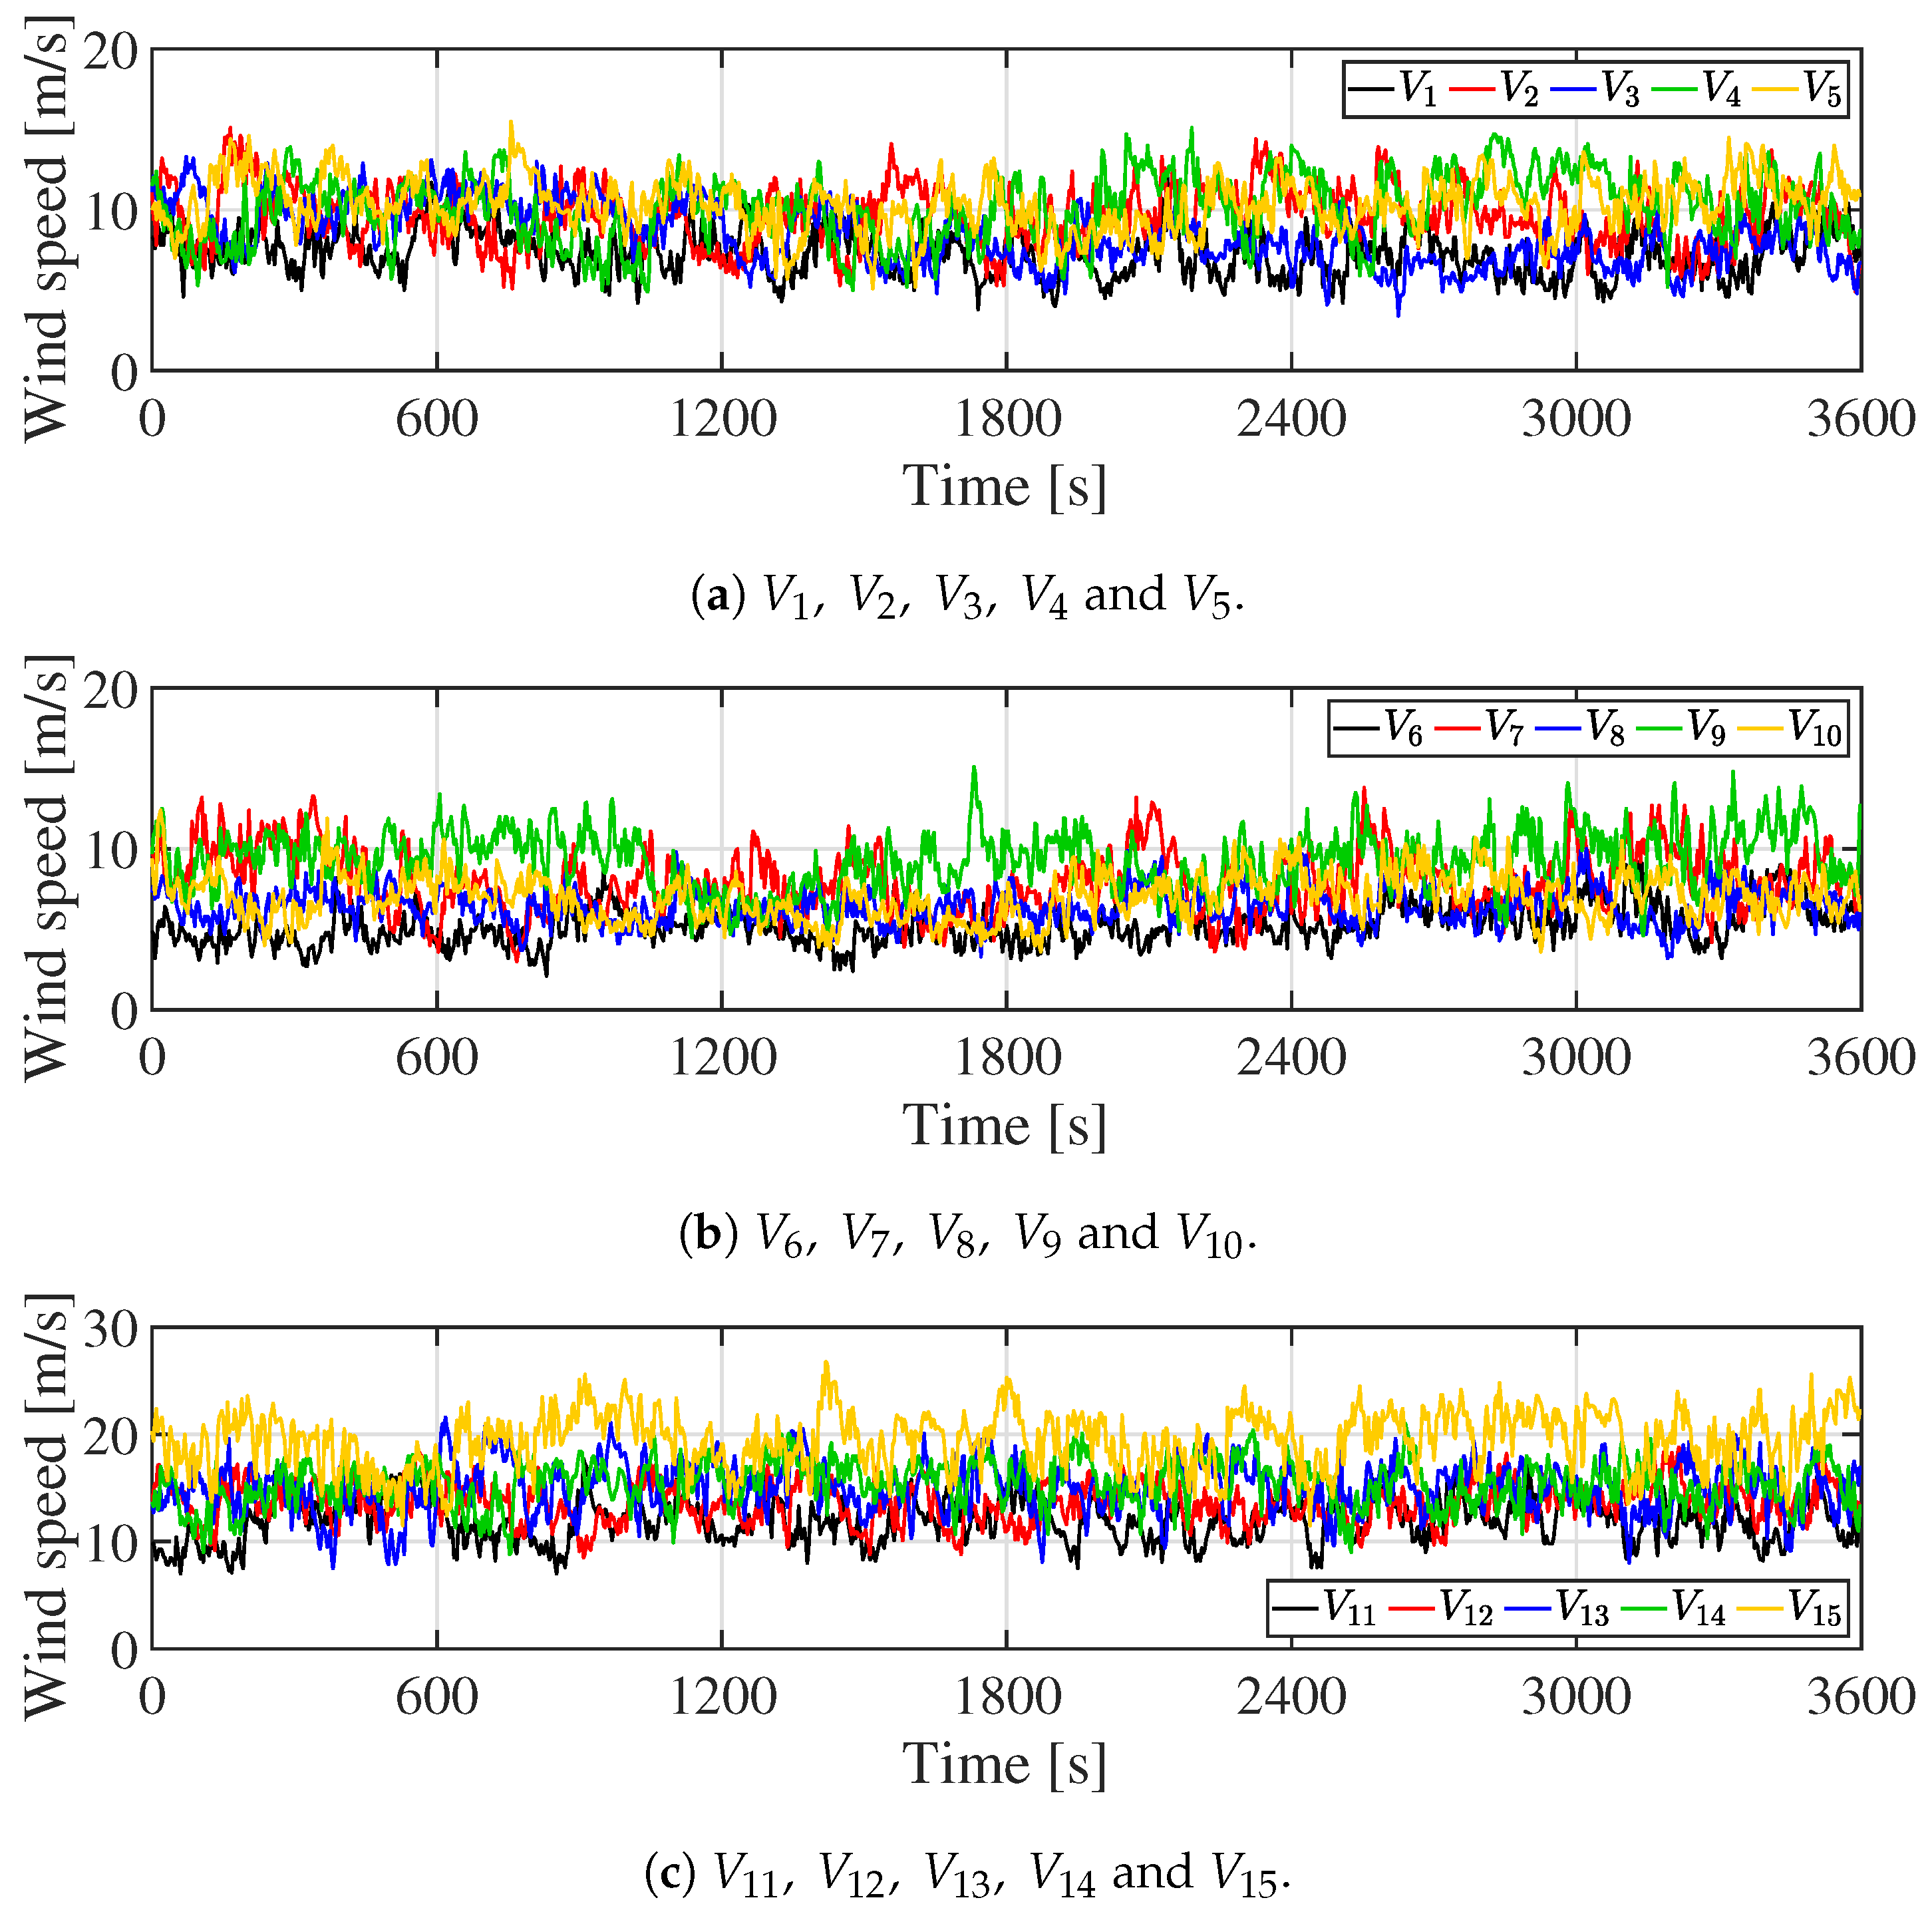
A comparative simulation is performed between the proposed systems and the conventional system composed of ESS and WF operated by MPPT control in order to validate the proposed systems composed of ESS and WF with KE control (the MA KE or the optimal KE control) based on the cost. We investigate two types of ESS: Li-ion and NaS battery. The real wind speed data (Five typical scenarios are selected for the analysis.) was measured at a WF in Hokkaido, Japan. These data were sampled every 3 s and their average and standard deviation (SD) are listed in Table 2. One Scenario is shown Figure 8. The costs and profits can be estimated accurately based on the simulation results that were obtained through enough wind data measured in four seasons. However, we do not have the data. As an alternative, we conduct one hour simulation based on five typical scenarios. The analysis condition, the parameters of ESSs and the controller parameters of WG and ESS are listed in Table 3, Table 4 and Table 5. Currently, the wind power price is 16 JPY/kWh in Japan [31]. However, we calculate the cost of the system based on the wind power price of 8 JPY/kWh, because the price will be cheaper in the near future. The price of batteries and the PCS are slightly different makers. The price was determined based on [10,26,32,33]. In addition, the efficiency of the li-ion and NaS battery is within 85 % to 95 % , respectively. Therefore, it is assumed that these batteries have the same efficiency in this analysis. We set the number of steps for MA as 10 times larger than a 1-min. window in the technical requirement ( 1200 · T s = 600 s). K q and α are determined using Figure 6, so that q becomes large when Δ P WF _ pu 0.1 . In the simulation, K p is determined by scenario simulations in order to ensure the technical requirement. Note that K p of the conventional system is the highest among the systems, because the conventional system does not have the KE control. The parameters for a 0 and a 1 are the same as [14].
The simulation was performed on MATLAB/Simulink 2019b and the simulation period was 3600 s. The time responses for scenarios 2 to 5 are omitted.

5.1. Simulations Results

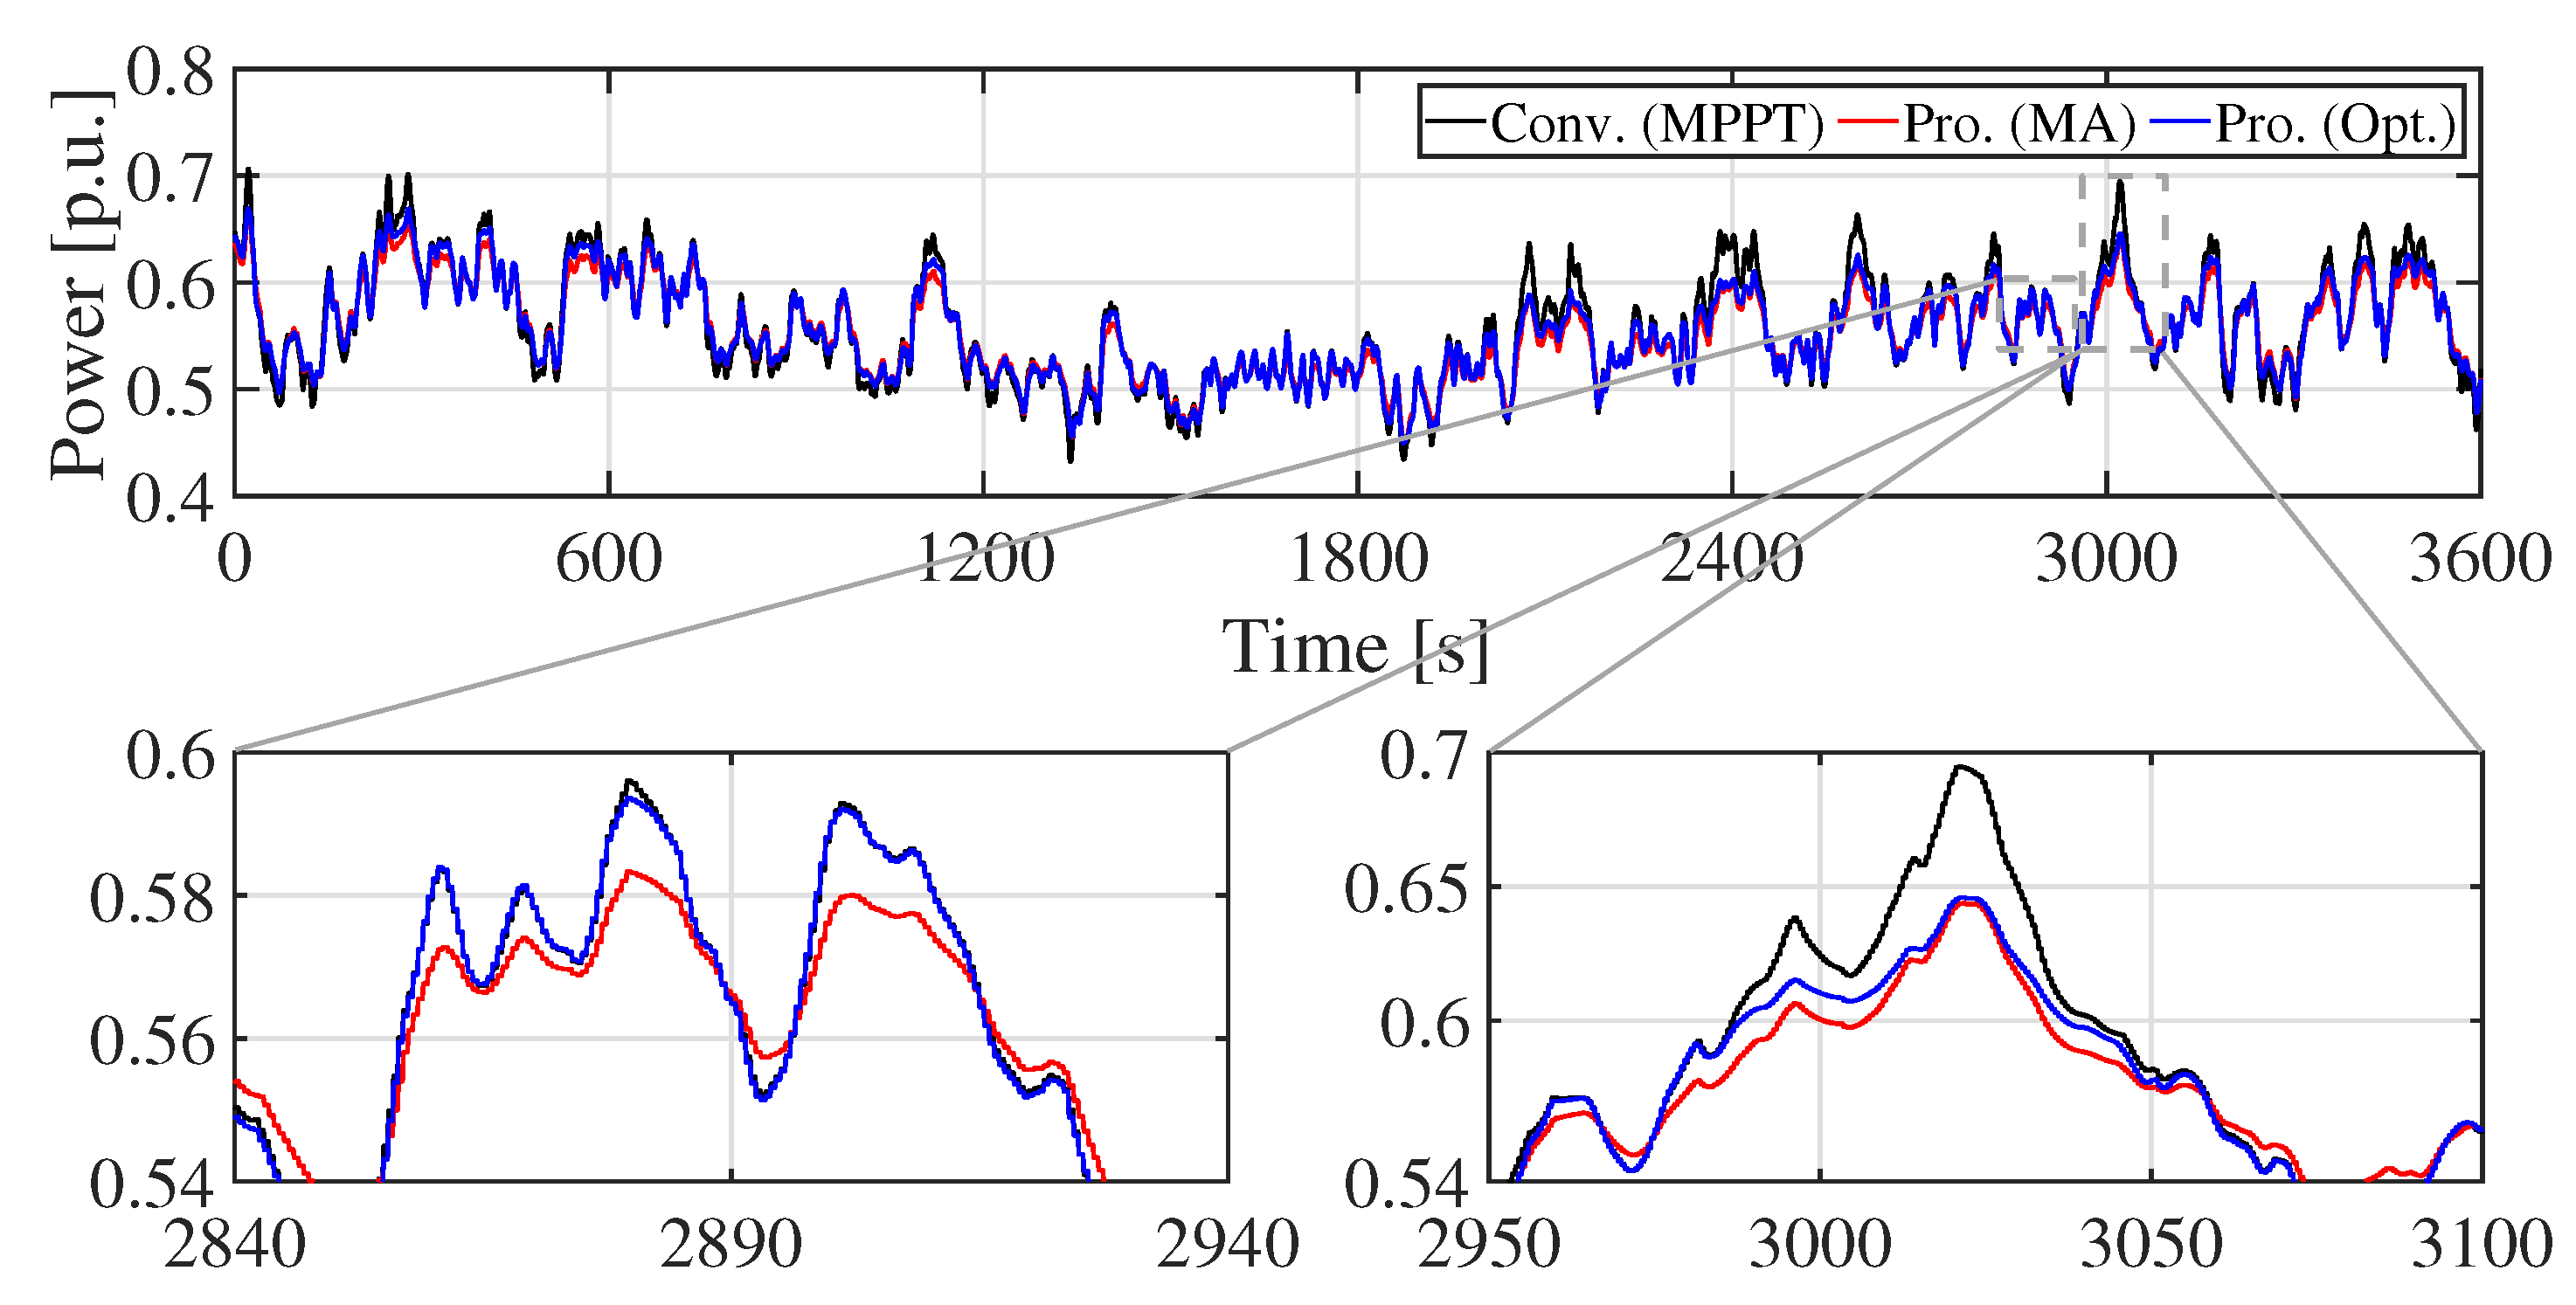
Figure 9 shows the WF output. It is clear that the WF output is smoothed by the KE control. Especially, the proposed optimal KE control mitigates the WF output only when the fluctuation becomes large. Therefore, the generating efficiency of WF with the optimal KE controller is kept higher than that of the MA KE controller. By contrast, L cyc can be large, and the charge/discharge loss of ESS is reduced by the MA KE control, because the stress of ESS is reduced. Figure 10 shows the ESS output. The peak of ESS output in the proposed systems is smaller than that in the conventional system. It implies that the technical requirement can be satisfied by an ESS with smaller rated power (small rated capacity). Figure 11 shows the combined output. It can be seen from Figure 9 and Figure 11 that the fluctuation of WF output is smoothed by the ESS. Although the KE control cannot satisfy the technical requirement by itself, as shown in Figure 12, the proposed system with the KE control and the ESS guarantees the requirement (Figure 13). Figure 14 and Figure 15 show the SOC of Li-ion battery and NaS battery, respectively. The SOC of the ESS in the proposed/conventional systems is maintained within the proper range. The fluctuation of the SOC of Li-ion battery is larger than that of NaS battery, because the C-rate of Li-ion battery is bigger than that of the NaS battery, although these batteries have the same rated power. Table 6 summarizes the simulation results. Rated power (rated capacity) of ESS is estimated from Table 6. The rated output power of the ESS in the proposed systems are approximately 45% less than that of the ESS in the conventional system. It is evident from these results that the technical requirement Δ F g ( t ) 10 % is satisfied while maintaining a lower charge/discharge loss of the ESS while using the KE control. Table 6 lists the SD of P WF and P g . These values is related to power quality, such as frequency in the power system. It is clear that the WF with KE control can mitigate not only 1-Min. fluctuation of P WF ( P g ) but also SD of WF output P WF ( P g ) without increasing the rated power of ESS. Moreover, the proposed optimal KE control can reduce the E WF loss , not requiring ESS with a high rated power. However, the Li-ion battery lifespan of the proposed system with the optimal KE controller is shorter than that with the MA KE controller because the MA KE controller removes the fluctuation of the WF output, regardless of whether the WF has large fluctuations or not. Therefore, the cycle life of the Li-ion battery in the proposed system with the MA KE control is longer than the proposed system with the optimal KE control. Note that the Li-ion battery lifespan of the ESS in the conventional system is larger than that of the proposed systems, because the ESS has large rated capacity. For the same reason, the lifespan of the NaS battery is determined by the calendar life, since the C-rate of the NaS battery is small.

5.2. Discussions

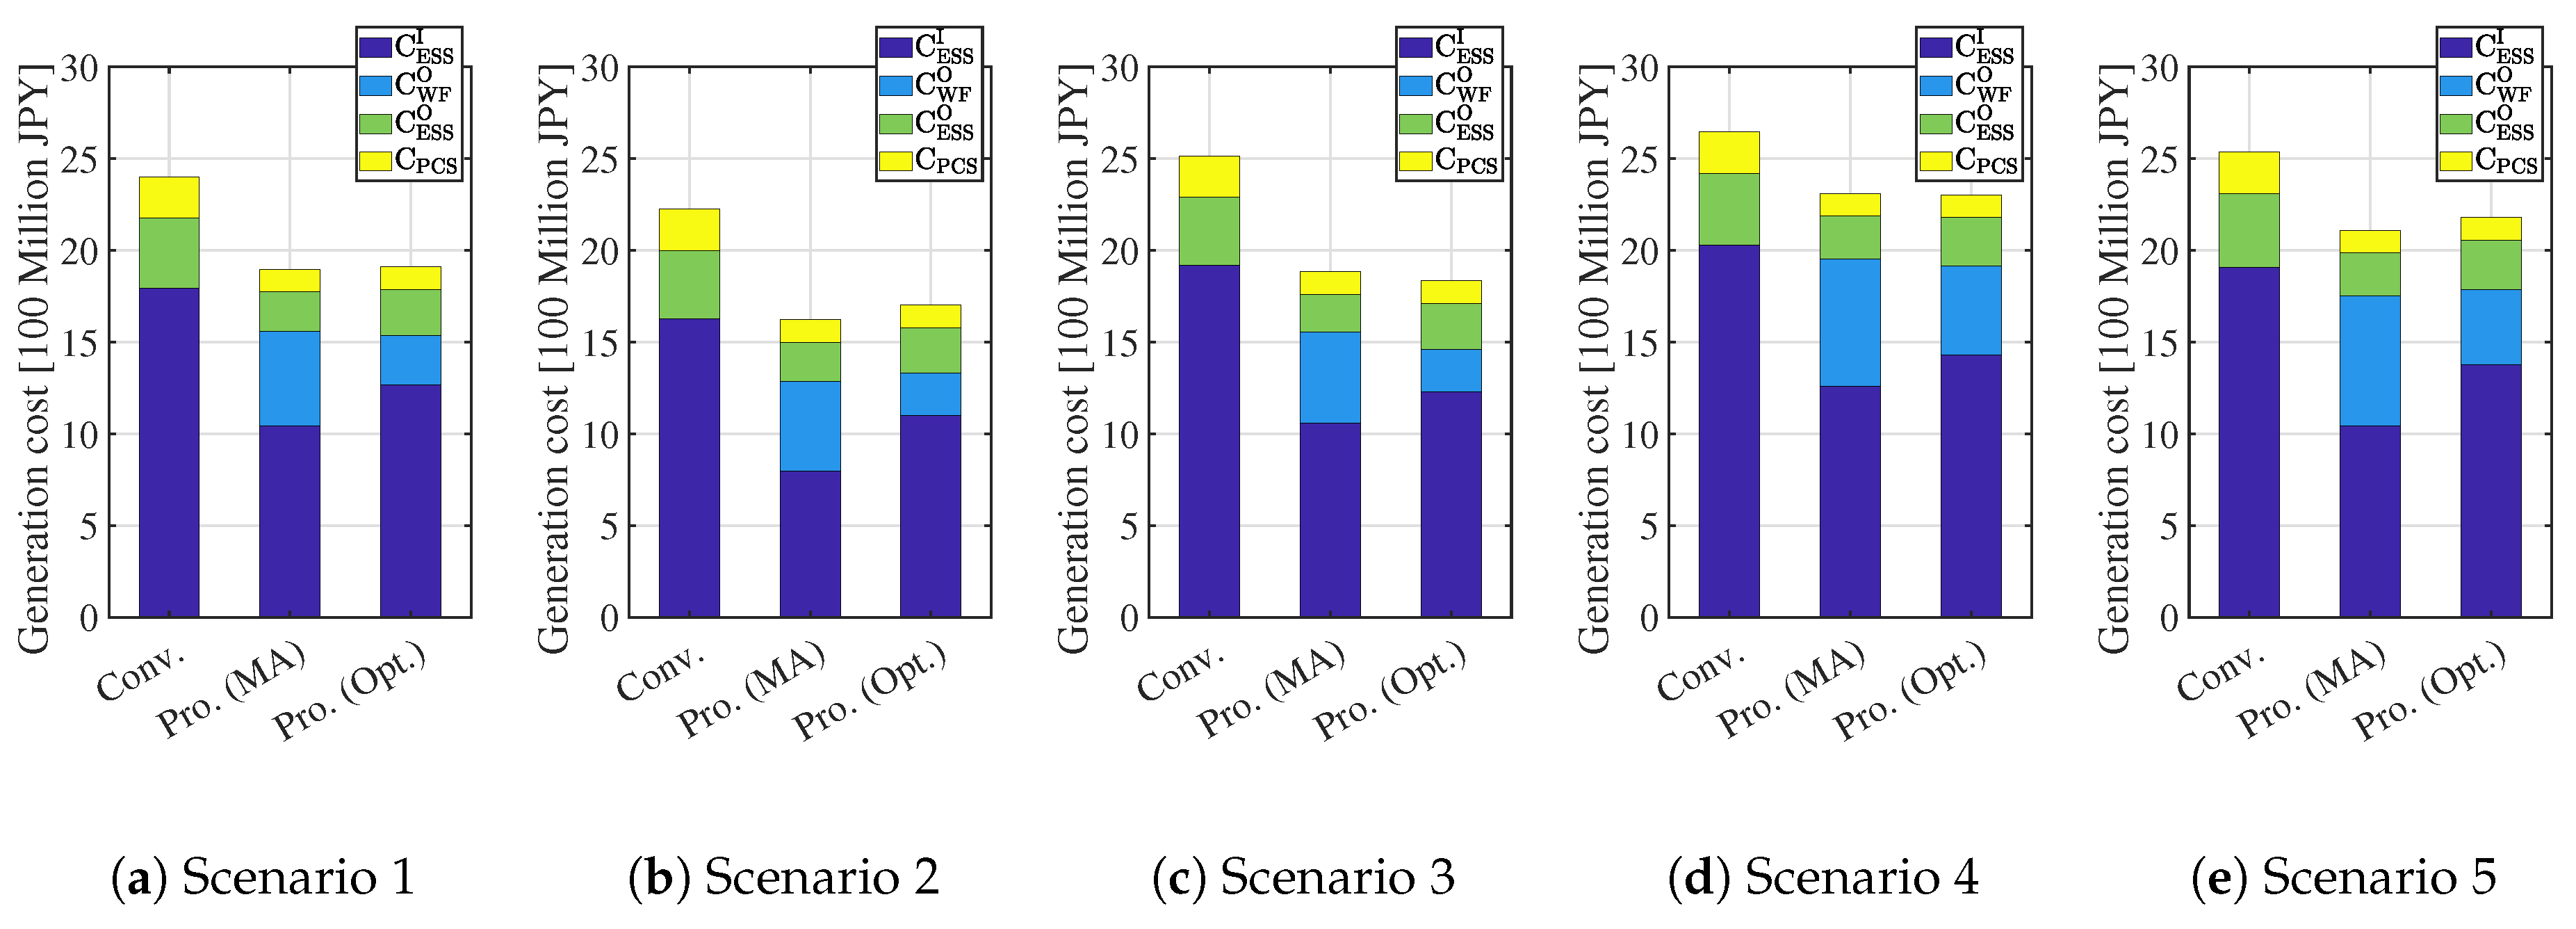
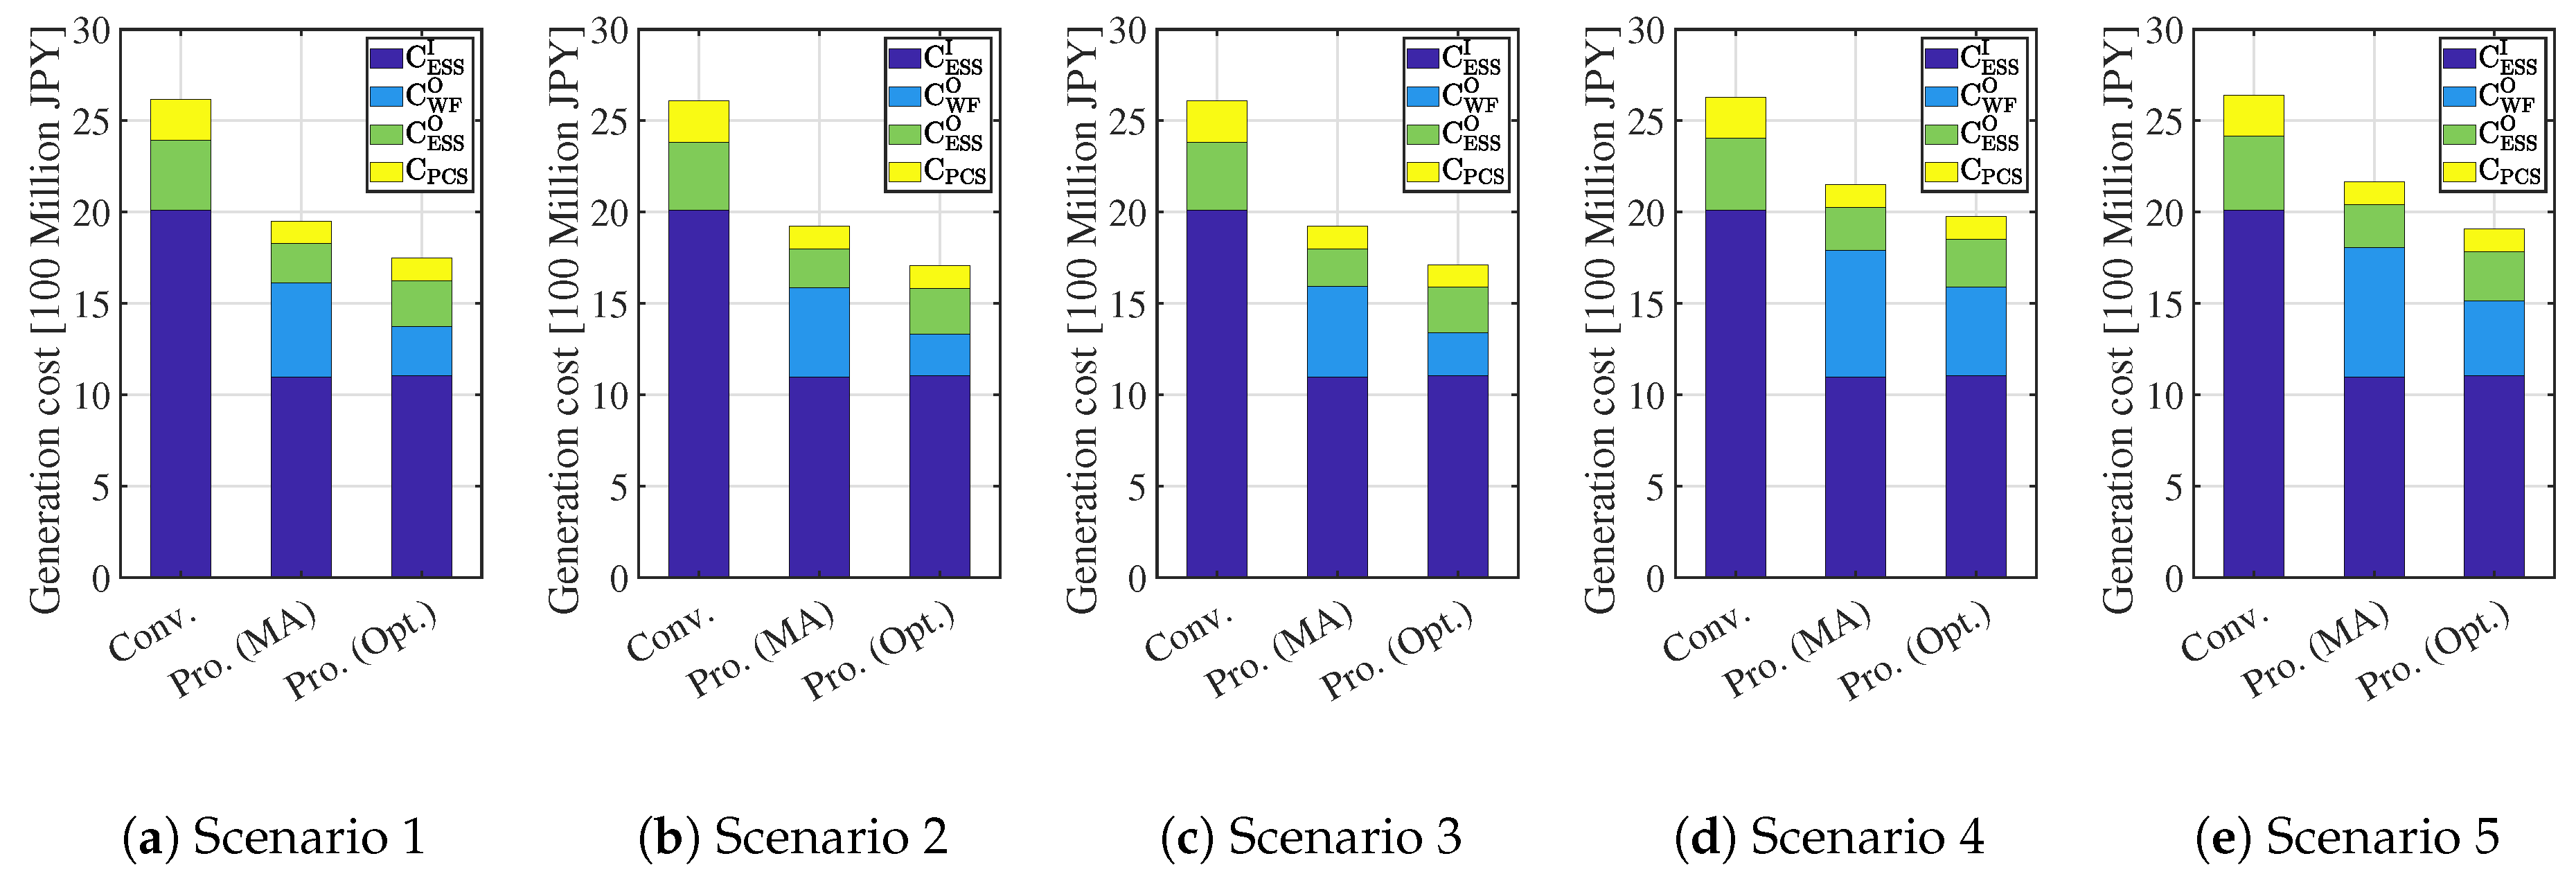
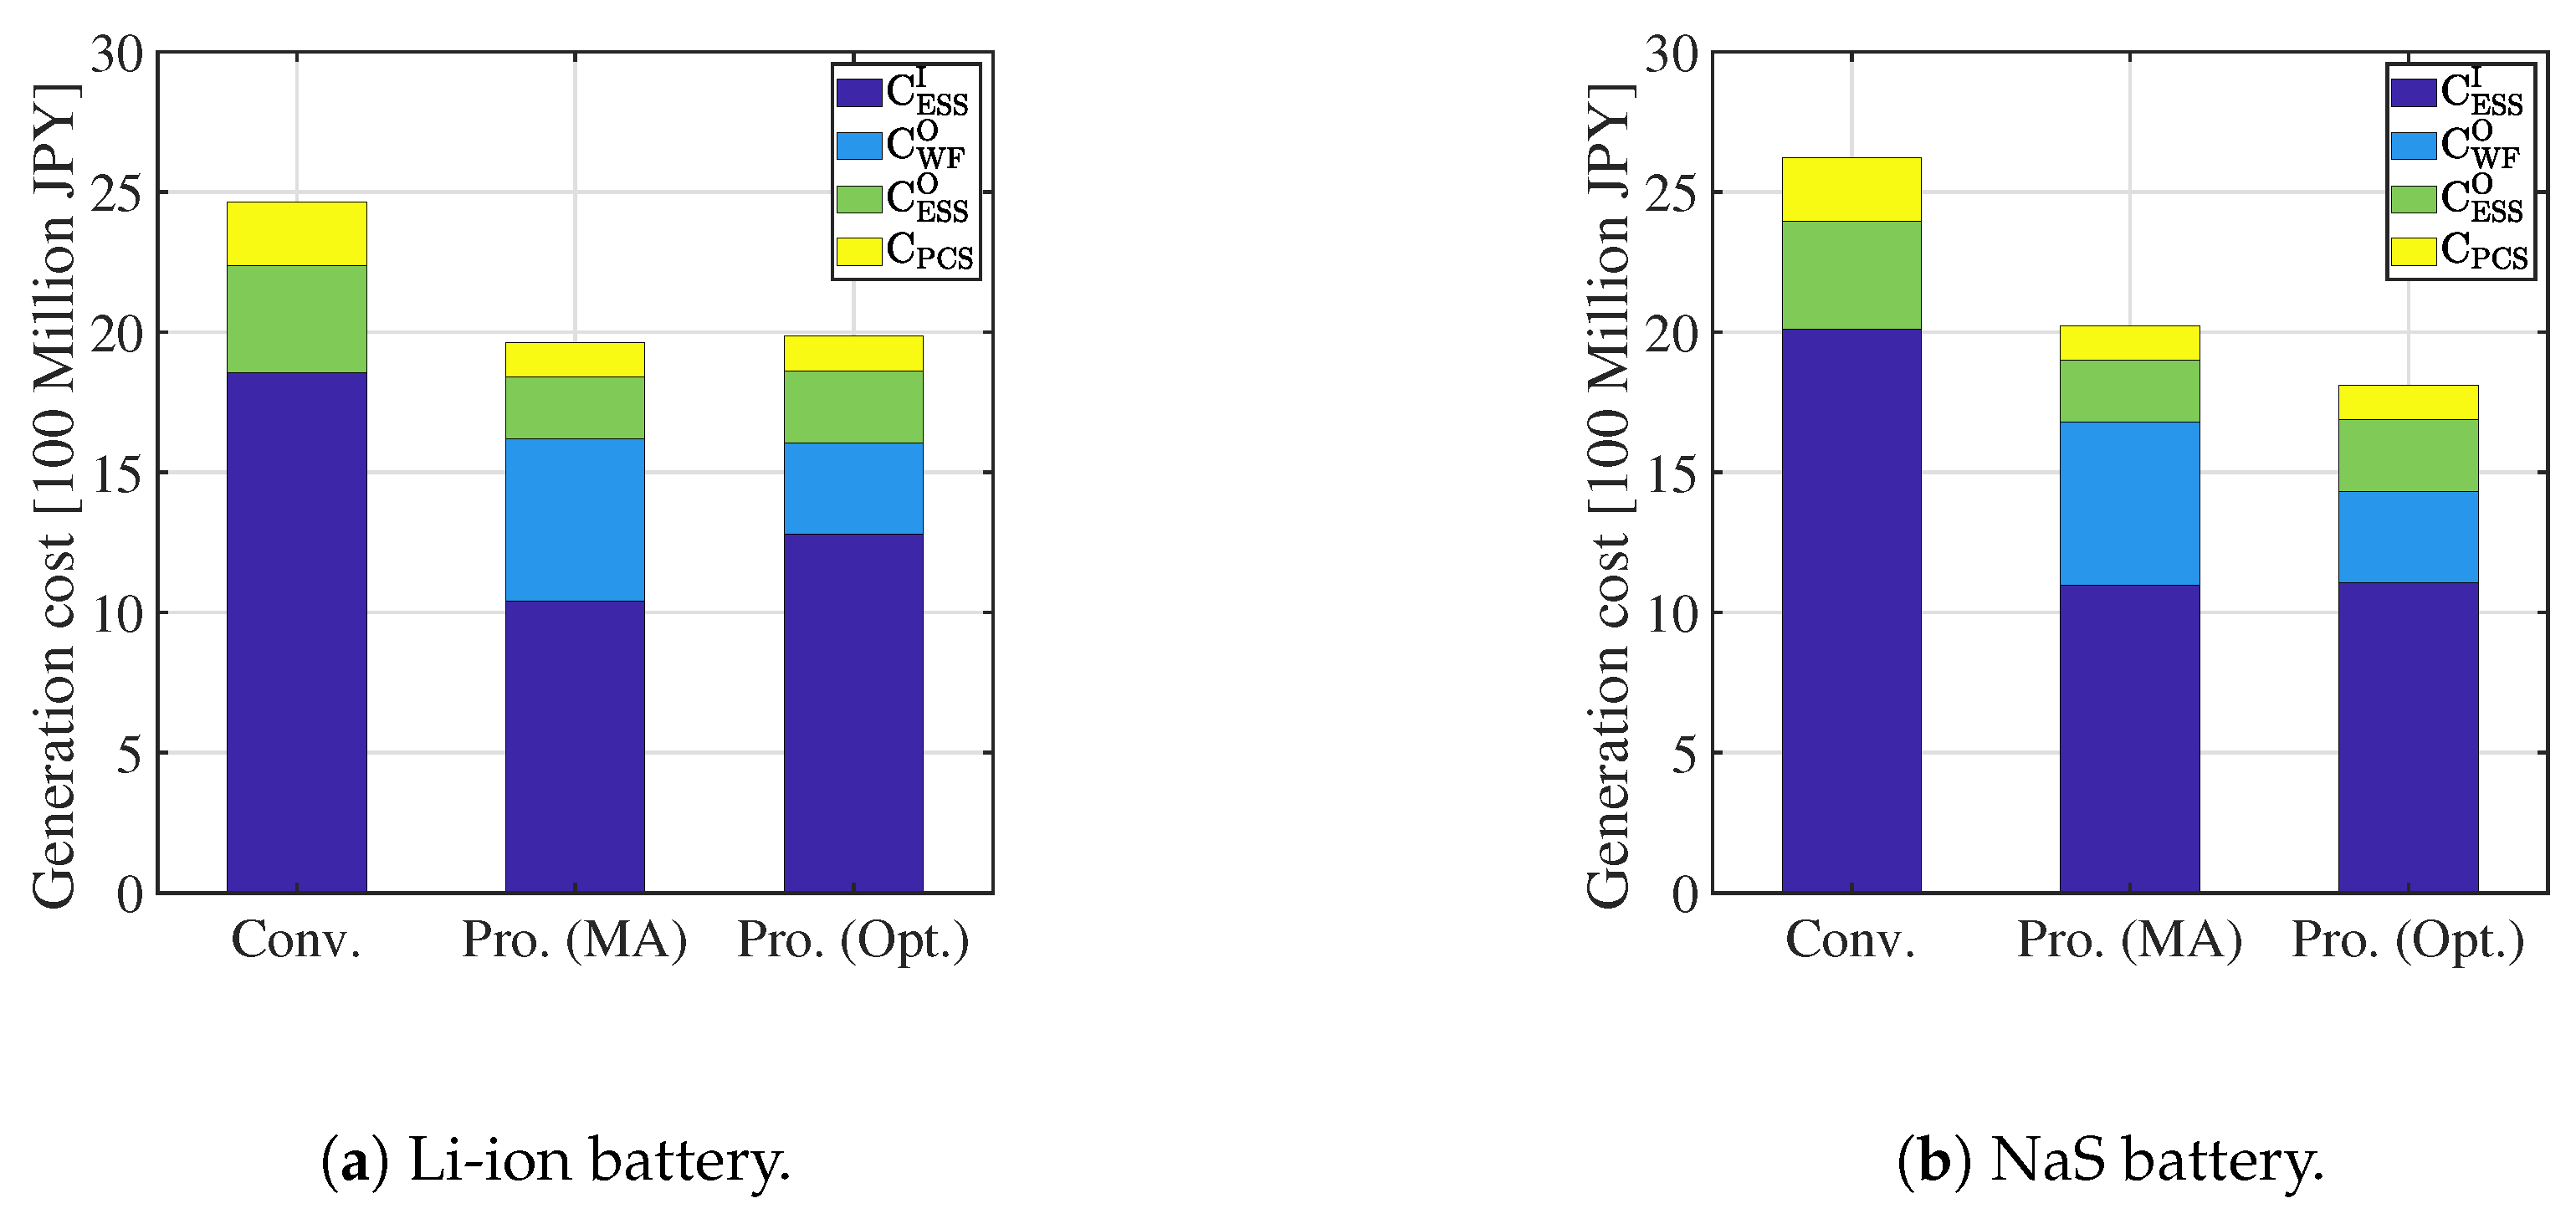
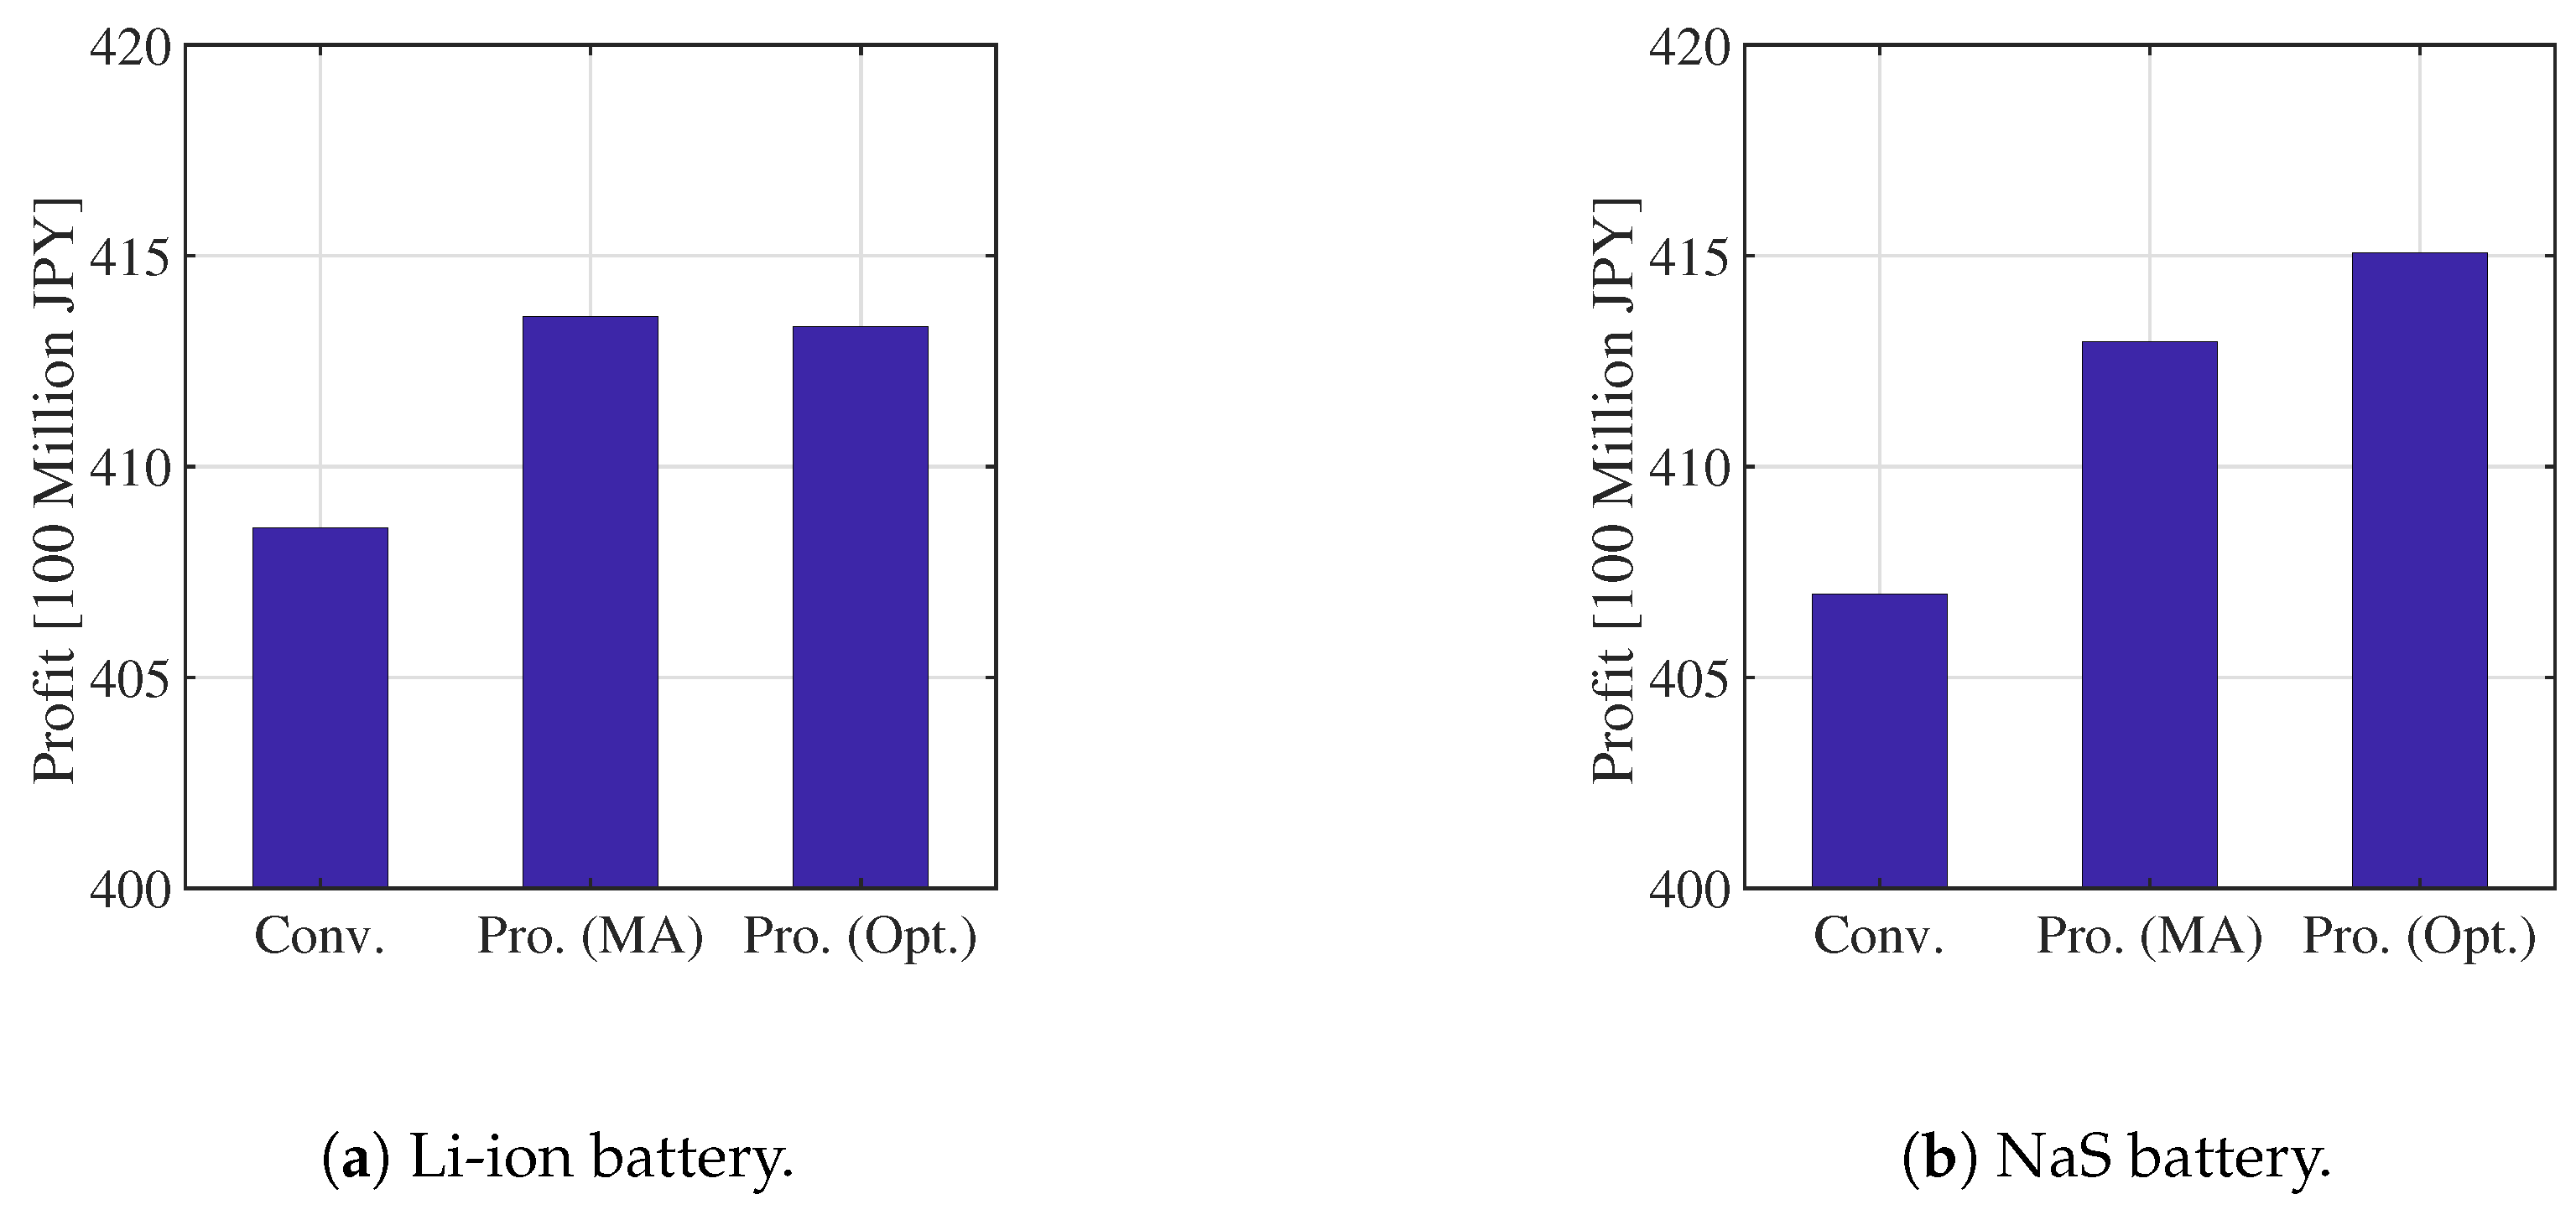
This subsection calculates the cost and the profit of the proposed systems and the conventional system that is based on the simulation results presented in Section 5.1. Figure 16 and Figure 17 show the total cost except for C WF I ( C WF I is the same in all scenarios as shown in Table 3). Figure 18 and Figure 19 and Table 7 summarize the cost except for C WF I , the profit and average of simulation results, respectively. It is clear that the proposed systems can increase the profit in the lifespan of WG (20 y). Especially, C ESS I in both proposed systems are lower than that in the conventional system. The profit of the proposed system with the MA KE controller and with the optimal KE controller does not differ much when the Li-ion battery is used. By contrast, the profit of the proposed system with the optimal KE controller is the highest in those systems when the NaS battery is used. Consequently, both proposed systems increase the profit by approximately 5 [100 million JPY] as compared to the conventional system when the Li-ion battery is used, and the proposed system with the optimal KE control increases the profit by approximately 7 [100 million JPY] when compared to the conventional system when the NaS battery is used. Moreover, as shown in Table 7, the proposed system not only satisfy the technical requirement, but also mitigate the SD of P WF and P g .

6. Conclusions

This paper proposed a system that is composed of the ESS and the WF operated by the KE control. In addition, an optimal KE control was presented in order to consider the trade-off between the smoothing of WG output and the generating efficiency. Scenario simulations demonstrated that the proposed system could suppress the WF output fluctuation with a lower ESS rated power. Moreover, the cost of the proposed system was investigated through the simulation results. Numerical simulations demonstrated that the proposed system could reduce the total cost of the system and increase the profit in the lifespan of WG. As a result, the proposed system with the optimal KE control increased the profit by approximately + 0.967 % to + 1.7 % as compared to the conventional system. The SD of output power is reduced by approximately 1.33 % to 1.7 % .

Author Contributions

K.K. and K.-Z.L. developed the basic concept. K.K. performed the simulation analysis. T.T.calculates the cost of the system. K.K. and M.W. developed an optimal kinetic energy control. K.-Z.L., T.Z. and J.T. revised this manuscript. K.K. wrote this manuscript. All authors have read and agreed to the published version of the manuscript.

Funding

This work was supported in part by the Japan Society for the Promotion of Science under Grant G19K04452 and in part by Yashima Environment Technology Foundation of Japan.

Conflicts of Interest

The authors declare no conflict of interest.

Abbreviations

ESSEnergy storage system
WFWind farm
KEKinetic energy
MAMoving average
FLFFirst-order low-pass filter
WGWind generator
MPPTmaximum power point tracking
SOCState-of-charge
PCSPower converter system
JPYJapanese yen
DODDepth of discharge
SDStandard deviation

Nomenclature

nNumber of WGs
VWind speed
ω Mechanical rotor angular frequency
PWG output
P WF WF output
P b ESS output
P g ( = P WF P b ) Combined output power
ρ Air-density
RRadius of rotor blade
λ Tip speed ratio
β Blade pitch angle
C p Power coefficien
HInertia constant of WG
T m Mechanical torque
T e Electrical torque
P mppt MPPT output reference
P loss Charge/discharge loss of the ESS
ASOC-FB gain
K p Gain of ESS controller
a 0 , a 1 Parameter of ESS controller
Δ F g Fluctuation ratio of combined output
ERemaining energy of ESS
Δ P WF Short-period components of the WF output
P WF MA MA of P WF
Δ P pu Fluctuation component of WG
qNonlinear weight
K q Weight
α Exponent weight
C WF I Installation cost of WF
C WF O Opportunity loss of WF
C ESS I Installation cost of ESS
C ESS O Opportunity loss of ESS
C PCS Cost of PCS
E WF loss Energy loss by KE control
C rate C-rate
E ESS loss Integral of the charge/discharge loss
L cal Calendar life
L cyc Cycle life
Subscript
puPer-unit
nrated value
Superscript
refReference value

References

  1. Global Wind Energy Council. Global Wind Report 2018. 2019. Available online: http://www.gwec.net/ (accessed on 24 September 2020).
  2. Liu, Y.; Du, W.; Xiao, L.; Wang, H.; Cao, J. A Method for Sizing Energy Storage System to Increase Wind Penetration as Limited by Grid Frequency Deviations. IEEE Trans. Power Syst. 2016, 31, 729–737. [Google Scholar] [CrossRef]
  3. Cao, J.; Du, W.; Wang, H.; McCulloch, M. Optimal Sizing and Control Strategies for Hybrid Storage System as Limited by Grid Frequency Deviations. IEEE Trans. Power Syst. 2018, 33, 5486–5495. [Google Scholar] [CrossRef]
  4. Koiwa, K.; Liu, K.; Tamura, J. Analysis and Design of Filters for the Energy Storage System: Optimal Tradeoff Between Frequency Guarantee and Energy Capacity/Power Rating. IEEE Trans. Ind. Electron. 2018, 65, 6560–6570. [Google Scholar] [CrossRef]
  5. Tsili, M.; Papathanassiou, S. A review of grid code technical requirements for wind farms. IET Renew. Power Gener. 2009, 3, 308–332. [Google Scholar] [CrossRef]
  6. Nguyen, C.; Lee, H. Optimization of power dispatch to minimize battery storage capacity in wind farm. In Proceedings of the 2014 IEEE Energy Conversion Congress and Exposition (ECCE), Pittsburgh, PA, USA, 14–18 September 2014; pp. 420–427. [Google Scholar]
  7. Nguyen, C.; Lee, H. Power Management Approach to Minimize Battery Capacity in Wind Energy Conversion Systems. IEEE Trans. Ind. Appl. 2017, 53, 4843–4854. [Google Scholar] [CrossRef]
  8. Yoshimoto, K.; Nanahara, T.; Koshimizu, G. New Control Method for Regulating State-of- Charge of a Battery in Hybrid Wind Power/Battery Energy Storage System. In Proceedings of the 2006 IEEE PES Power Systems Conference and Exposition, Atlanta, GA, USA, 29 October–1 November 2006; pp. 1244–1251. [Google Scholar]
  9. Kurose, N.; Takahashi, R.; Tamura, J.; Fukushima, T.; Sasano, E.; Shinya, K. A consideration on the determination of power rating of Energy Storage System for smoothing wind generator output. In Proceedings of the Electrical Machines and Systems (ICEMS), Incheon, Korea, 10–13 October 2010; pp. 622–627. [Google Scholar]
  10. Zhao, H.; Wu, Q.; Hu, S.; Xu, H.; Rasmussen, C.N. Review of energy storage system for wind power integration support. Appl. Energy 2015, 137, 545–553. [Google Scholar] [CrossRef]
  11. Zou, J.; Peng, C.; Shi, J.; Xin, X.; Zhang, Z. State-of-charge optimising control approach of battery energy storage system for wind farm. IET Renew. Power Gener. 2015, 9, 647–652. [Google Scholar] [CrossRef] [Green Version]
  12. Lin, F.; Chiang, H.; Chang, J.; Chang, Y. Intelligent wind power smoothing control with BESS. IET Renew. Power Gener. 2017, 11, 398–407. [Google Scholar] [CrossRef]
  13. Lamsal, D.; Sreeram, V.; Mishra, Y.; Kumar, D. Achieving a minimum power fluctuation rate in wind and photovoltaic output power using discrete Kalman filter based on weighted average approach. IET Renew. Power Gener. 2018, 12, 633–638. [Google Scholar] [CrossRef]
  14. Koiwa, K.; Ishii, T.; Liu, K.; Zanma, T.; Tamura, J. On the Reduction of the Rated Power of Energy Storage System in Wind Farms. IEEE Trans. Power Syst. 2020, 35, 2586–2596. [Google Scholar] [CrossRef]
  15. Senjyu, T.; Sakamoto, R.; Urasaki, N.; Funabashi, T.; Fujita, H.; Sekine, H. Output power leveling of wind turbine Generator for all operating regions by pitch angle control. IEEE Trans. Energy Convers. 2006, 21, 467–475. [Google Scholar] [CrossRef]
  16. Chowdhury, M.A.; Hosseinzadeh, N.; Shen, W. Fuzzy logic systems for pitch angle controller for smoothing wind power fluctuations during below rated wind incidents. In Proceedings of the 2011 IEEE Trondheim PowerTech, Trondheim, Norway, 19–23 June 2011; pp. 1–7. [Google Scholar]
  17. Chowdhury, M.; Hosseinzadeh, N.; Shen, W. Smoothing wind power fluctuations by fuzzy logic pitch angle controller. Renew. Energy 2012, 38, 224–233. [Google Scholar] [CrossRef]
  18. Sato, D.; Saitoh, H. Smoothing Control of Wind Farm Output by Using Kinetic Energy of Variable Speed Wind Power Generators. IEEJ Trans. Power Energy 2009, 129, 580–590. [Google Scholar] [CrossRef]
  19. Varzaneh, S.G.; Gharehpetian, G.; Abedi, M. Output power smoothing of variable speed wind farms using rotor-inertia. Electr. Power Syst. Res. 2014, 116, 208–217. [Google Scholar] [CrossRef]
  20. Howlader, A.M.; Urasaki, N.; Pratap, A.; Senjyu, T.; Saber, A.Y. A fuzzy control strategy for power smoothing and grid dynamic response enrichment of a grid-connected wind energy conversion system. Wind Energy 2014, 17, 1347–1363. [Google Scholar] [CrossRef]
  21. Zhao, X.; Yan, Z.; Zhang, X. A Wind-Wave Farm System With Self-Energy Storage and Smoothed Power Output. IEEE Access 2016, 4, 8634–8642. [Google Scholar] [CrossRef]
  22. Rosyadi, M.; Umemura, A.; Takahashi, R.; Tamura, J.; Uchiyama, N.; Ide, K. Simplified Model of Variable Speed Wind Turbine Generator for Dynamic Simulation Analysis. IEEJ Trans. Power Energy 2015, 135, 538–549. [Google Scholar] [CrossRef]
  23. Hazari, M.R.; Mannan, M.A.; Muyeen, S.M.; Umemura, A.; Takahashi, R.; Tamura, J. Stability Augmentation of a Grid-Connected Wind Farm by Fuzzy-Logic-Controlled DFIG-Based Wind Turbines. Appl. Sci. 2018, 8, 20. [Google Scholar] [CrossRef] [Green Version]
  24. Rosyadi, M.; Muyeen, S.M.; Takahashi, R.; Tamura, J. New controller design for PMSG based wind generator with LCL-filter considered. In Proceedings of the 2012 XXth International Conference on Electrical Machines, Marseille, France, 12 November 2012; pp. 2112–2118. [Google Scholar]
  25. Koiwa, K.; Sato, H.; Umemura, A.; Takahashi, R.; Tamura, J. Frequency Control of Power System by Output Frequency Band Control of Wind Farm by Variable Speed Wind Generators. IEEJ Trans. Power Energy 2015, 135, 351–361. [Google Scholar] [CrossRef]
  26. Tamura, S. Economic Analysis of Hybrid Battery Energy Storage Systems Applied to Frequency Control in Power System. Electr. Eng. Jpn. 2016, 195, 24–31. [Google Scholar] [CrossRef]
  27. Investigating R&D Committee on Application and Control Technology of Battery Energy Storage for Power Systems. In Application and Control Technology of Battery Energy Storage for Power Systems; The Institute of Electrical Engineers of Japan: Tokyo, Japan, 2017.
  28. Kintner-Meyer, M.C.W.; Balducci, P.J.; Jin, C.; Nguyen, T.B.; Elizondo, M.A.; Viswanathan, V.V.; Guo, X.; Tuffner, F.K. Energy Storage for Power Systems Applications: A Regional Assessment for the Northwest Power Pool (NWPP); Pacific Northwest National Laboratory: Richland, WA, USA, 2010.
  29. Gee, A.M.; Robinson, F.V.P.; Dunn, R.W. Analysis of Battery Lifetime Extension in a Small-Scale Wind-Energy System Using Supercapacitors. IEEE Trans. Energy Convers. 2013, 28, 24–33. [Google Scholar] [CrossRef]
  30. Alam, M.J.E.; Saha, T.K. Cycle-life degradation assessment of Battery Energy Storage Systems caused by solar PV variability. In Proceedings of the 2016 IEEE Power and Energy Society General Meeting (PESGM), Boston, MA, USA, 17–21 July 2016; pp. 1–5. [Google Scholar]
  31. Agency for Natural Resources and Energy. 2019. Available online: https://www.meti.go.jp/shingikai/santeii/pdf/049_01_00.pdf (accessed on 24 September 2020).
  32. International Renewable Energy Agency. Electricity Storage and Renewables for Island Power: A Guide for Decision Makers. 2012. Available online: https://irena.org/publications/ (accessed on 24 September 2020).
  33. Mongird, K.; Fotedar, V.; Viswanathan, V.; Koritarov, V.; Balducci, P.; Hadjerioua, B.; Alam, J. Energy Storage Technology and Cost Characterization Report; U.S. Department of Energy’s Water Power Technologies Office by Pacific Northwest National Laboratory: Washington, DC, USA, 2019.
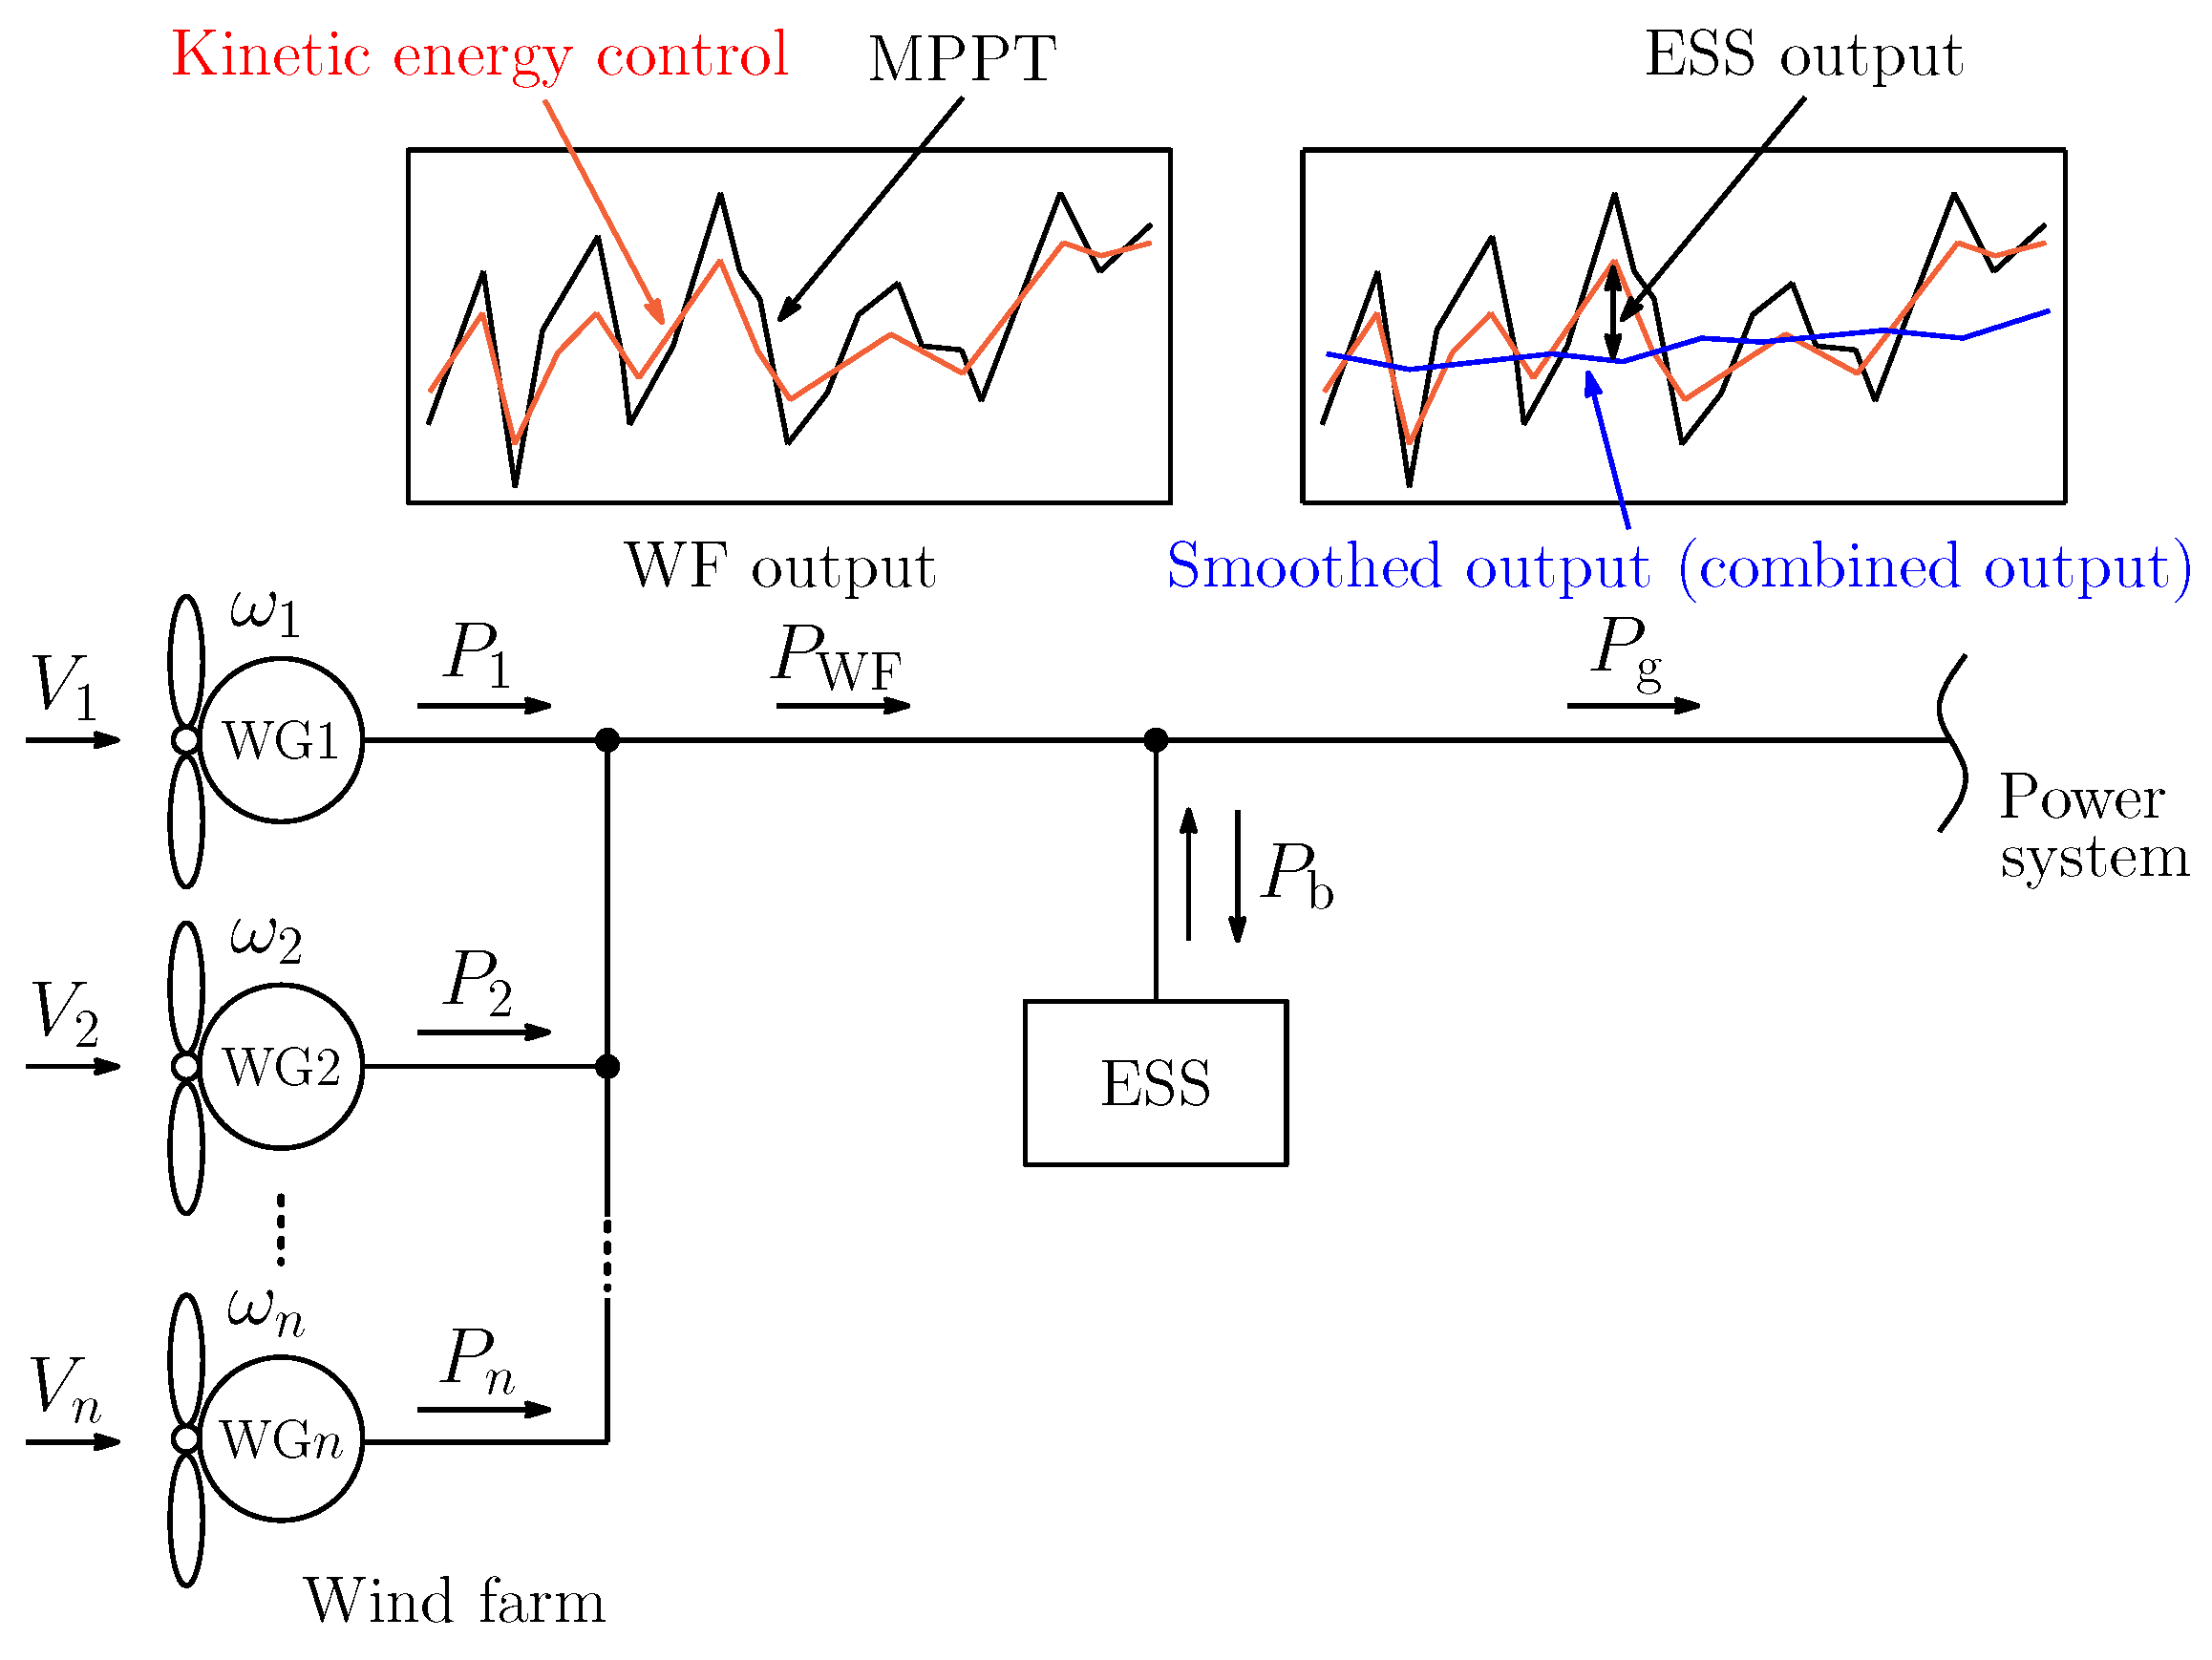
Figure 1. System configuration.
Applsci 10 07223 g001
Figure 2. C p - λ curve of wind turbine.
Applsci 10 07223 g002
Figure 3. ESS control system.
Applsci 10 07223 g003
Figure 4. The standard moving average kinetic energy control.
Applsci 10 07223 g004
Figure 5. Optimal kinetic energy control.
Applsci 10 07223 g005
Figure 6. q vs. Δ P WF pu .
Applsci 10 07223 g006
Figure 7. Life cycles vs. depth of discharge.
Applsci 10 07223 g007
Figure 8. Wind speed (Scenario 1).
Applsci 10 07223 g008
Figure 9. Wind farm (WF) output (Scenario 1).
Applsci 10 07223 g009
Figure 10. ESS output (Scenario 1).
Applsci 10 07223 g010
Figure 11. Combined output (Scenario 1).
Applsci 10 07223 g011
Figure 12. Fluctuation of WF output (Scenario 1).
Applsci 10 07223 g012
Figure 13. Fluctuation of combined output (Scenario 1).
Applsci 10 07223 g013
Figure 14. SOC of the Li-ion battery (Scenario 1).
Applsci 10 07223 g014
Figure 15. SOC of the NaS battery (Scenario 1).
Applsci 10 07223 g015
Figure 16. Cost (Li-ion battery).
Applsci 10 07223 g016
Figure 17. Cost (NaS battery).
Applsci 10 07223 g017
Figure 18. Average cost.
Applsci 10 07223 g018
Figure 19. Average profit.
Applsci 10 07223 g019
Table 1. Comparison between different smoothing methods.
MethodCostEfficiencyMechanical StressSmoothing Effect
ESSExpensiveGoodExcellent
Pitch angle controlInexpensivePoorPoorGood
Kinetic energy controlInexpensiveGoodExcellentPoor
Table 2. Characteristics of wind data.
Scenario 1Scenario 2Scenario 3Scenario 4Scenario 5
Avg.SDAvg.SDAvg.SDAvg.SDAvg.SD
V 1 7.301.368.451.618.341.7210.42.1510.42.15
V 2 9.591.818.931.788.661.858.091.798.091.79
V 3 8.361.848.901.376.510.958.511.188.511.18
V 4 10.132.037.621.6811.121.8310.401.5510.391.55
V 5 10.341.6010.111.609.961.594.820.774.820.77
V 6 5.261.995.162.194.561.9314.551.9214.551.93
V 7 8.021.7910.961.748.962.279.821.709.821.70
V 8 6.462.329.602.086.352.358.682.008.682.00
V 9 9.332.0210.641.839.852.537.021.447.021.44
V 10 7.002.564.872.126.352.337.151.447.151.44
V 11 11.991.1515.471.1711.50.9911.972.6111.972.61
V 12 13.681.9213.542.1614.551.989.121.489.121.48
V 13 15.011.0915.392.4914.681.5412.102.1612.102.16
V 14 15.451.7211.771.7815.61.847.051.507.051.50
V 15 19.481.3818.661.3419.451.2010.421.5210.421.52
Table 3. Analysis condition.
Rated power of WG [MW]5
Rated wind speed [m/s]12
Inertia constant H of WG [s]5.05
Number of WG15
Lifespan of WG [y]20
Wind power price [JPY/kWh]8
C WF I [100 Million JPY]150
Table 4. Parameters of energy storage systems (ESSs).
Li-Ion BatteryNaS Battery
C-rate30.13
Price [JPY/kWh]200,00025,000
Efficiency η [%]8585
L cal [y]1015
PCS price [JPY/kW]28,80028,800
Table 5. Controller parameters of wind generator (WG) and ESS.
Con. (MPPT)Pro. (MA)Pro. (Opt.)
Sampling period [s]0.50.50.5
Number of Steps for MA12001200
K q 120
α 5
K p 0.650.50.5
a 0 9 × 10 6 9 × 10 6 9 × 10 6
a 1 6 × 10 3 6 × 10 3 6 × 10 3
A111
Table 6. Simulation results.
Scenario 1Scenario 2Scenario 3Scenario 4Scenario 5
Conv.Pro. (MA)Pro. (Opt.)Conv.Pro. (MA)Pro. (Opt.)Conv.Pro. (MA)Pro. (Opt.)Conv.Pro. (MA)Pro. (Opt.)Conv.Pro. (MA)Pro. (Opt.)
Maximum 1-Min
fluctuation of P WF [%]
22.117.017.221.815.515.518.612.413.019.914.314.417.912.814.2
Average of 1-Min
fluctuation of P WF [%]
9.336.427.379.316.347.359.606.617.669.966.967.789.886.787.70
SD of P WF [p.u.]0.05070.04110.04450.04560.03450.03870.04210.03060.03530.04960.04000.04240.05230.04330.0461
Maximum 1-Min
fluctuation of P g [%]
9.869.659.978.248.218.357.286.727.258.509.109.197.227.207.68
Average of 1-Min
fluctuation of P g [%]
3.393.273.763.323.213.733.473.373.903.563.513.933.553.423.90
SD of P g [p.u.]0.03730.03440.03620.02570.02300.02520.01980.01800.02040.03070.02920.03030.03670.03510.0361
Maximum power
of ESS [kW]
7126.83592.03790.76713.43577.53707.36472.33294.93334.77844.94283.24310.57400.33902.83668.0
E WF loss [kWh/h]367.1192.0349.6162.9353.2166.8494.7345.3505.9292.9
E ESS loss [kWh/h]272.1154.0179.8265.1150.6178.3264.3147.3178.4279.65167.9188.6287.9167.1191.9
Integral of
WF output [MWh/h]
41.8641.4941.6744.5344.1844.3641.4241.0741.2537.4837.0037.1442.7542.2542.46
Battery life (Li-ion) [y]5.835.484.546.437.165.225.455.404.685.164.544.025.495.484.18
Battery life (NaS) [y]151515151515151515151515151515
Table 7. Average of simulation results.
Conv.Pro. (MA)Pro. (Opt.)
Maximum 1-Min fluctuation of P WF [%]20.114.4 ( 28.4 % )14.9 ( 25.9 % )
Average of 1-Min fluctuation of P WF [%]9.626.62 ( 31.2 % )7.57 ( 21.3 % )
SD of P WF [p.u.]0.04810.0379 ( 21.2 % )0.0414 ( 13.9 % )
Maximum 1-Min fluctuation of P g [%]8.228.18 ( 0.487 % )8.49 ( + 3.28 % )
Average of 1-Min fluctuation of P g [%]3.463.36 ( 2.89 % )3.84 ( 11.0 % )
SD of P g [p.u.]0.03000.0279 ( 7 % )0.0296 ( 1.33 % )
E WF loss [kWh/h]414.1232.0
E ESS loss [kWh/h]273.8157.4 ( 42.5 % )183.4 ( 33.0 % )
Integral of WF output [MWh/h]41.6141.20 ( 0.985 %)41.38 ( 0.553 % )
Battery life (Li-ion) [y]5.675.61 ( 1.06 % )4.53 ( 20.1 % )
Battery life (NaS) [y]151515
Cost (Li-ion) [100 million JPY]22.3818.40 ( 17.8 % )18.62 ( 16.8 % )
Cost (NaS) [100 million JPY]24.019.0 ( 20.8 % )16.9 ( 29.6 % )
Profit (Li-ion) [100 million JPY]410.81414.79 ( + 0.967 % )414.57 ( + 0.915 % )
Profit (NaS) [100 million JPY]409.24414.20 ( + 1.21 % )416.32 ( + 1.73 % )
Publisher’s Note: MDPI stays neutral with regard to jurisdictional claims in published maps and institutional affiliations.