Abstract
Replacement of refined wheat flour with milling fractions of quinoa seeds represents a useful way for the formulation of value-added baked products with beneficial characteristics to consumers. The aim of this study was to assess the chemical composition and physical properties of different particle sizes of quinoa flour on Falling number index (FN) and dough rheological properties determined by Mixolab in a planned research based on design of experiment by using full factorial design. The ash and protein contents were higher in medium particle size, whereas the carbohydrates presented a lower value, this fraction having also the highest water absorption and water retention capacity. The reduction of particles led to an increased swelling capacity and a decreased bulk density. The particle size significantly influenced the FN values in linear and quadratic terms (p < 0.05), showing a decrease with the particle size increasing. Particle size decrease significantly increased water absorption and the rate of protein weakening due to heat (C1–2), whereas starch gelatinization rate (C3–2), starch breakdown rate related to amylase activity (C3–4) and starch retrogradation speed (C5–4) decreased. By increasing the amount of quinoa flour (QF) in wheat flour, the dough stability and the torques C2, C3, C4 and C5 followed a decreased trend, whereas water absorption and dough development time rose. Optimization, determined by particle size and level of QF added in wheat flour based on which of the combination gives the best rheological properties, showed that the composite flour containing 8.98% quinoa flour of medium particle size was the most suitable.
1. Introduction
Quinoa (Chenopodium quinoa Willd) is a pseudocereal with large applications in the food industry and represent a current trend in the human diet because it has excellent nutritional and nutraceutical value and is a gluten-free grain [1,2]. It can be used for functional food development due to its functional and rheological properties, sensory characteristics, nutrient profile and stability [3]. This crop is considered a whole vegetable protein and whole grain carbohydrate [4] and contains high quality oil and high amounts of vitamins, minerals and a large diversity of bioactive compounds [5]. With respect to the distribution of nutritive compounds within quinoa seed tissues, carbohydrates can be found mostly in the perisperm, while proteins, fat and minerals are concentrated in the endosperm and germ or embryo, which represent approximately 30% of the whole seed [4,6]. The most important carbohydrate from quinoa seed is starch, which varies between 52.2–69.2% of the dry matter [4,7,8], and having as low as 11% amylose content [9]. Total fiber content in quinoa seeds varies from 7.0 to 26.5%, being mostly comprised of insoluble polysaccharides (78 of the total dietary fiber content) [10]. The protein content of quinoa varies from 8 to 22% depending on the varieties [11,12] and it is of very high quality compared to wheat. Proteins from quinoa seeds are rich in amino acids such as lysine, threonine and methionine, which are deficient in cereals [13], making them complete proteins [14]. Lipid levels from quinoa (4.0–7.6%) are much higher than those from wheat [15,16], unsaturated fatty acids being the predominant fatty acids (71–84.5% of total lipids) [16,17]. From the nutritional quality of the lipid fraction, quinoa oil presents a ω-6/ω-3 ratio of 4.7–19.6, with high quality and nutritious character [16,18]. Vitamins and minerals of quinoa seeds are among the features that make quinoa such an excellent nutrient source [19,20]. Vega-Galvez et al. (2010) [20] found that the total mineral content in quinoa seeds is about twice that of cereals, being particularly rich in calcium, magnesium, iron and zinc. Regarding bioactive compounds, the main phenolic compounds presented in quinoa seeds are gallic acid (167.2–308.3 mg/100 g dw) and flavonoids (rutin, quercitin and kaempferol) [21,22], and variation in levels exists between species, and depending on the growing conditions.
Nutritionally, quinoa is recognized as a super grain and can be used in the bakery industry to improve final product quality or to develop new products, and the properties of starch present in seeds is similar to those found in wheat [23]. Investigations on the substitution of wheat flour with quinoa flour at various levels has been made in many investigations [24,25,26], but no previous studies concerning how the variation in particle size can influence the composition, physical and rheological properties have been done.
Milling of quinoa seeds, a grinding process performed to produce flour or different flour fractions, is an important step that influences the product’s quality. Significant differences in the nutritional composition, especially ash, protein and starch levels were reported for different particle sizes of milled grains, which may be related to cell-wall materials [27]. Therefore, the processing techniques and final product quality is greatly dependent on the particle size of the flour used and its constituents. Particle fractions can improve water or oil-holding capacity, the release of enzymes and physical properties by exposing their surface area during processing stages such as mixing, fermenting or baking. Nutritionally, particle size has a significant impact on food digestibility in the gastrointestinal system [28], digestibility lowering with increased particle size [29]. Size reduction is also applied extensively in the grain milling industry to separate the endosperm from the undesirable components of the whole grain, such as saponins in quinoa hull.
Some studies reported that the intermediate particle size (250–500 μm) gave best results in the supercritical dioxide extraction of quinoa oil [30]. In another study, it was found that the development of a gluten-free pasta product improved nutritionally required grits of particles with sizes between 200 to 600 μm [31]. Solaesa et al. (2020) [4] showed that different particle fractions of quinoa flour showed wide variation in chemical composition and functionality with high impact on rheological properties. Flour particle size influences hydration and, in consequence, dough rheology, affecting the quality of the final product [32]. Ahmed et al. (2019) [28] showed that separated particle fractions of quinoa flour presented wide variations in chemical composition and functionality, influencing rheological properties. The effects of a range of particle sizes on the rheological properties of various flour doughs has been investigated previously [33,34,35,36] concluding that particle size and composition remarkably affect rheological properties, but there was no definite trend.
Different rheological tests are used in the cereal industry to measure rheological properties, providing information on the flour quality and performance during processing. A Mixolab device is used to assess the processing quality of the flour dough when subjected to simultaneous mechanical shear stress and temperature limitation. This device is able to measure the torque of the dough in real time during an increase in temperature in a single test. So far, there is no evidence of the use of different quinoa seeds milling fractions at different levels in wheat flour breads and their effect on the dough rheological behavior assessed by using Mixolab. Thus, the objective of this study was to investigate the impact of different quinoa flour particle size additions at different levels in refined wheat flour on dough rheological properties, and to find the optimal formulation of quinoa particle size level added, in order to predict the bread-making behavior of this composite formulation. Furthermore, the influence of particle size on the proximate composition and some physical properties of quinoa flour fractions were investigated. The formulation can be use to obtain new bread products with improved nutritional profiles.
2. Materials and Methods
2.1. Materials
A commercial wheat flour of 650 type was purchased from S.C. Mopan S.A. (Suceava, Romania). Quinoa flours were obtained by grinding white quinoa seeds acquired from S.C. SANOVITA S.R.L (Suceava, Romania) with a laboratory grinder (Grain Mill, KitchenAid, Model 5KGM, Whirlpool Corporation, USA) and sieved through a Retsch Vibratory Sieve Shaker AS 200 basic (Haan, Germany) to obtain quinoa flour (QF) at three different particle sizes: large, L > 300 μm, medium, M > 180 μm, < 300 μm and small fractions, S < 180 μm.
2.2. Proximate Composition
The wheat flour used in this study contained 14.00% moisture (ICC 110/1), 12.60% protein (ICC 105/2), 1.40% fat (ICC 105/1), 0.65% ash (ICC 104/1), 30.00% wet gluten (ICC 106/1), 6.00 mm gluten deformation index (SR 90:2007) and 312 s Falling number index (ICC 107/1). These characteristics, determined according to the Romanian standard SR 877:1996, revealed that the wheat flour had a strong quality and was good flour for bread making.
White quinoa seeds (Chenopodium quinoa) presented the following analytical characteristics: moisture content 13.28% (SR EN ISO 665:2003), fat content 5.61% (SR EN ISO 659:2009), protein content 14.12% (SR EN ISO 20483:2007) and ash content 2.00% (SR ISO 2171:2009). The protein content was calculated with a general factor of 6.25. Carbohydrate content of the flour samples was determined by difference by applying the equation described by Alonso-Miravalles and O’Mahaony (2018) [37] (Equation (1)):
The analyses were made at least in duplicate, and the values of the parameters were expressed as the average ± standard deviation.
2.3. Physical Properties of Quinoa Flour Fractions
The water absorption capacity, water retention capacity, swelling capacity and the bulk density for the three particle sizes of quinoa flour (QL, QM, QS) were determined at least in duplicate for each sample.
2.3.1. Water Absorption Capacity
The water absorption capacity (WAC) was determined by the method described by Sosulski et al. (1976) [38]. The sample (1 g) was mixed with 10 mL distilled water, kept at ambient temperature for 30 min and centrifuged for 10 min at 2000 rpm in a centrifuge model MPW-223e (MPW Med. Instruments, Warszaw, Poland). Water absorption capacity was expressed as percent water bound per gram of the sample.
2.3.2. Water Retention Capacity
The water retention capacity (WRC) of quinoa flour fractions was measured following the method of Onipe et al. (2017) [39] with slight modifications. Two grams of each quinoa flour sample was weighed into test tubes and 20 mL of distilled water was added. Samples were vortexed on a water bath with continuous stirring at 25 °C (Memmert Waterbath, Germany) and allowed to stand for 1 h at 25 °C before centrifuging at 1600 rpm for 25 min. Water excess (supernatant) was decanted and samples were allowed to drain. The weights of water bound were determined by difference (Equation (2)).
2.3.3. Swelling Capacity
The method of Olapade et al. (2011) [40], with some modifications, was used for determination of swelling capacity (SC). One gram (1 g) of quinoa flour sample from each particle size (QL, QM, QS) was mixed with 10 mL of water in a centrifuge tube. The weighed tube was heated in a water bath at 80 °C for 15 min. After this operation, the tube was centrifuged at 2000 rpm for 30 min and the supernatant was decanted and then weighed. Swelling capacity was expressed as percent swelled per gram flour (Equation (3)).
2.3.4. Bulk Density
Bulk density (BD) of quinoa flour fractions was determined according to the method suggested by Ikegwu (2009) [41]. The sample (50 g) was put in a 100 mL graduated cylinder and tapped 20–30 times. The bulk density was calculated as weight of flour (g) divided by flour volume (mL).
2.4. α-Amylase Activity
The α-amylase activity in wheat-quinoa composite flour formulated according to the experimental design (Table 1) was evaluated using the Falling number (FN) method (ICC standard method 107/1), based on viscosity, and FN index value was determined at least in duplicate for each sample.

Table 1.
Coded and real values of factors used in experimental design.
2.5. Mixolab Measurements
A Mixolab rheological device was used to measure rheological properties of composite flour dough samples formulated as the experimental design from Table 1 shows. The protocol used to assess the rheological behavior of composite quinoa-wheat flour as a function of mixing and temperature by means of the Mixolab device (Chopin, Tripette et Renaud, Paris, France) is established by ICC-Standard Method No. 173 (ICC, 2010) [42]. To characterize the dough behavior in this work, the standard option Chopin+ protocol was applied. The setting of the test was similar to the one presented in a previous paper by Coțovanu et al. (2020) [43] for amaranth flour supplementation and consisted of a dough mixing duration time of 8 min at constant mixing rate of 80 rpm and temperature of 30 °C, a heating rate of 4 °C/min up to 90 °C, a cooling rate of 4 °C/min up to 50 °C, and a total analysis time of 45 min. A few preliminary mixing tests were performed to determine the optimum hydration level to reach the maximum consistency of dough corresponding to the C1 torque value of 1.1 N·m, and then the complete test was made in order to determine the dough properties of the composite flour formulated. The parameters from the registered Mixolab curves were reported in previously research by Coțovanu et al. (2020) [43]. The parameters determined during mixing were water absorption, WA (%) dough development time, DDT (min) and stability, ST (min); then, when dough temperature increased due to protein reduction, the minimum consistency C2 (N·m) torque was recorded. When dough temperature increased to certain values, starch gelatinization was given by the values of maximum consistency C3 torque (N·m), the stability of starch gel by minimum consistency C4 torque (N·m) and starch retrogradation when cooling through maximum consistency, C5 torque (N·m). In addition, from the Mixolab curve, the following secondary parameters were determined: the difference between torques C1 and C2 (C1–2), which is a measure of the protein weakening; the difference between torques C3 and C2 (C3–2), which estimates the starch gelatinization; the difference between torques C3 and C4 (C3–4), which is related to starch breakdown and the difference between torques C5 and C4 (C5–4) corresponding to starch recrystallization when cooling the dough.
2.6. Design of Experiments and Statistics
In this study, the simultaneous effects of two factors, particle size at three fractions (L, M and S) and addition level of quinoa flour (QF) in wheat flour at five levels (0, 5, 10, 15 and 20%) on the Falling number (FN) index were investigated; water absorption of quinoa-wheat flour dough and rheological properties, as responses, were also investigated. The main and interaction effects of the factors, particle size and addition level of QF in wheat flour, on the responses were evaluated by using response surface methodology (RSM) by means of a general factorial design. RSM has been widely used in the design and formulations of new products, and optimization in conjunction with desirability function to find, the optimal condition during processing [44] or to obtain the optimum factors, describing the relationships between responses and factors [45]. A numerical optimization technique was used in the optimization process as showed in some studies [43,46,47,48] allowing us to find the optimal value of the factors in relation with dough rheology. In Table 1 shows the experimental design with the coded and real values of the factors used in this study, consisting of 15 combinations. For all responses a polynomial quadratic regression model (Equation (4)) was proposed.
In the model, Y represents the response variable and bo, b1, b2, b11, b22 and b12 are the regression coefficients represented as intercept, linear, quadratic and interaction effects of X1 (particle size of quinoa flour) and X2 (level of quinoa flour added in wheat flour) factors.
The most adequately predictive model for each response was chosen through sequential F-test, coefficients of determination (R2), adjusted coefficients of determination (Adj.-R2) and significant probabilities. For this purpose, a multiple linear regression analysis was applied to fit the data obtained for response to linear, two-factor interactions, quadratic and cubic models. The statistical significance of the coefficients in each predictive model were found by analysis of variance (ANOVA) and the experimental and predictive values were compared by paired t test (p < 0.05) to determine the validity of the model for each response. The polynomial response surfaces were generated to show the dependence between factors, particle size and addition level, and responses. Design-Expert software, trial version 12 (Stat-Ease, Inc., Minneapolis, MN, USA) was used to carry out the experimental design, the model analysis, generation of the response surface graphs, test of model adequacy and the optimum level of formulation factors finding.
For numerical optimization, the desired goal for each response was selected as follows: dough stability (ST) and starch gelatinization (C3–2) at maximum value, protein weakening (C1–2) and starch recrystallization during paste cooling (C5–4) were minimized, while all remaining responses were kept within range. Through one-way analysis of variance (ANOVA) the significant difference within means was tested at a 5% significance level.
3. Results and Discussion
3.1. Proximate Composition
The proximate composition for the three fractions, large (QL), medium (QM) and small (QS) of quinoa seeds flour is shown in Table 2. The moisture content of the samples ranged from 9.75 to 10.46%, a decrease in the moisture content with decreasing particle size occurring. According to the obtained results, there were no significant differences (p > 0.05) in the moisture content between the particle sizes. The same results of moisture of different particle sizes of quinoa flours in different fractions was observed by Ahmed et al. (2019) [28] and for rye and barley flours [49]. The decrease of moisture when quinoa particle size decreases can be explained by higher possible heat generation during the milling of the finer particle size flours [50]. The low moisture observed for the quinoa flours was a good indicator of their potential for longer shelf life. In agreement with Offia-Olua (2014) [51] materials such as flour and starch containing up to 12% moisture have higher storage stability than those with higher moisture contents.
Table 2.
Chemical composition and physical properties of the quinoa flours fractions: large particle size (QL), medium particle size (QM) and small particle size (QS).
The ash contents ranged between 1.75 and 3.2% and the values increased significantly with the reduction of particle size, but the highest values were observed at medium particle size (QM) (3.2%), followed by small particle size (QS) (2.53%). There were significant differences (p < 0.0001) between the samples regarding the ash content correlated with mineral content [52]. The ash content is closely related to the chemical composition of the quinoa seed and also to the morphological structure. Some studies reported that mineral content of quinoa seems to vary dramatically due to soil type, mineral composition and fertilizer application [20]. Minerals, such as P, K, and Mg are located in the embryo, while Ca and P are in the pericarp associated with pectic compounds of the cell wall [20], which may explain the variation in ash from different quinoa fractions. The cell wall material from broken endosperm may contribute significantly to the ash content [53]. Increasing ash content with reducing quinoa particle size was observed earlier by Ahmed et al. (2019) [28], by Alonso-Miravalles and O’Mahony (2018) [37] for quinoa (1.8 to 3.60%), for whole amaranth flour (2.4 to 6.86%), for buckwheat (1.51 to 3.05%) and also for barley [50]. Many minerals in quinoa are found at concentrations greater than those reported for most grain crops [23]. High ash content, resulting from quinoa flour addition to wheat flour, could involve an increased amount of minerals in the composite flour samples.
Crude protein content of quinoa flours with different particle sizes (11.96–18.86%) is comparable to the values (12.0–16.0%) reported in other studies [11,14,20,28]. The crude protein content of the flours was significantly different (p < 0.05) from each other. It can be seen from the data presented in Table 2 that the protein content from quinoa flours has the same trend as the ash content. The highest content of crude protein was observed for particle size QM (18.86%). Other authors found a direct increase of protein content with a decrease of particle size [31], but Sulivan et al. (1962) [53] opined that the change of protein with particle size is not universal and it depends on the structure of endosperm and type of endosperm cells. The data obtained by Ando et al. (2002) [54] indicated that proteins are found especially in the embryo (23.5%) whereas in perisperm are only 7.2%. D’Amico et al. (2019) [55] found higher concentrations of up to 38% in the embryo and less than 5% in the perisperm. The low amount of proteins in the perisperm was also confirmed by Lindeboom et al. (2005) [56] and Chauhan et al. (1992) [57]. These data suggest that quinoa seeds store proteins in the embryo to provide nutrients for growing and development [58]. This result indicates that the substitution of wheat flour with medium particle size of quinoa flour (QM) would increase the protein content of final products, producing more shelf stable products due to their lower moisture content.
The fat content of the quinoa flours fractions ranged from 6.36 to 6.44%, but the particle sizes did not show significant differences in lipid content (p > 0.05). The content of lipids increased with particle size increase. Small quinoa particle size (QS) has been considered an alternative oilseed crop due to its lipidic fraction [59]. Similar data for fat content, which ranged between 1.8 and 9.5%, were reported earlier in other studies [59,60]. Prego et al. (1998) [61] showed that lipids are stored in the cells of the endosperm and embryo tissues, which explains this variation.
The carbohydrate content ranged from 61.49 to 69.39%. The carbohydrate contents for quinoa particle size flours were significantly different (p < 0.05) from each other. The largest particle (QL) showed a very high percentage of carbohydrate content of 69.38%. While the protein and ash content of samples increased, a decrease in carbohydrate content for the flour samples was observed (Table 2).
3.2. Physical Properties
The water absorption capacity (WAC) of flours measures the water absorption ability by the starch after swelling in excess water. The results showed that WAC for quinoa flours fractions ranged between 2.50 and 2.92% (Table 2). The results were in accordance with the reported values by Wang et al. (2016) [26] and Rodriguez-Sandoval et al. (2012) [62]. The least WAC was observed for large particle (QL), and all three particle sizes presented significant difference (p < 0.0001) between them, the highest WAC being presented by the medium particle size (QM), making it desirable for use in bakery products. The increase of WAC in QM can be explained by its higher level of protein compared to small particle size (QS), amino acid composition, protein conformation and surface polarity affecting water-binding properties of flours [63]. Solaesa et al. (2020) [4] reported similar results on three different particle sizes of quinoa flour. WAC may be related to starch characteristics which are reflected by amylose content, granular structure and molecular structure of amylose and amylopectin [64].
Water retention capacity (WRC) allows assessment of the flour’s ability to retain water under a centrifugal gravity force, considering physically entrapped, capillary-bound and hydrodynamic water [65]. The results obtained showed that there were no statistically significant differences (p > 0.05) among the large and small particle sizes (Table 2), but significant differences between large and small particle fractions and medium particle size (p < 0.05) were found, which had the maximum WRC (4.91%). The increase of WRC in QM can be related to high protein content and ash, hydration properties being influenced by the particle fraction composition. The results were in range with those found by James (2009) [8] for quinoa flour. Approximate results observed between WRC and particle size have been reported in the literature [48] for rye and barley flours. The values were higher than the results reported by Ogungbenle et al. (2009) [66], who mentioned that quinoa flours were able to retain 1.47 g of weight of water. The relationship between WRC and the particle size was observed by other authors [67] and can be explained by the large surface area presented by finer flours. Nevertheless, other studies were either not able to establish a correlation between particle size and WRC, or no decrease in WRC was found with reductions in particle size [36]. These differences could be connected to different compositions of particles with different sizes and to the morphology and particle size distribution, which was not evaluated in other studies.
The results of the swelling capacity (SC) for each particle fraction are shown in Table 2. The values ranged between 5.26 and 6.21 mL/g. The SC values obtained for the small particles (QS) differed significantly (p < 0.05) from the other two particle sizes, QL and QM, because QS had the highest swelling capacity. These values can be explained by the extent of granular swelling during heating. Quinoa starch granules are approximately 1–3 µm and the small size of granules facilitates the penetration of water molecules into quinoa starch granules, thereby increasing the SC with particle size decrease. Similar results regarding SC of different quinoa particle size were found by Tang et al. (2015) [68] and Wang et al. (2016) [26].
Knowing the bulk density (BC) is essential when considering packaging and transport. The results of BC values obtained for quinoa flour fractions ranged from 0.46 for the small particle size, 0.52 for medium fraction to 0.55 for the large particle size (Table 2). Significant differences between samples (p < 0.05) were observed, bulk density decreasing with particle size decrease. This trend can be explained, probably, by the negative correlation between bulk density and lipids, and by the positive correlation between bulk density and carbohydrates. Similar findings were obtained by Ratnawati et al. (2019) [69]. Other authors have reported similar results for quinoa flour in different fractions [4]. The lowest moisture content (9.75%) of the small particles (QS) could contribute to their low bulk density due to the ability of water moisture to stick to flour particles, thus reducing their specific volume [69].
3.3. Fitting the Models
Based on the statistical processing of data regarding the effects of two factors, particle size and addition level, predictive models for FN index of quinoa-wheat composite flour and dough rheological properties in terms of Mixolab parameters were evaluated. The most fitting quadratic models were obtained for the following parameters: Falling number (FN), water absorption (WA), dough stability (ST), dough development time (DT), C2 torque as minimum consistency during protein weakening stage (C2), difference between torques C1 and C2 (C1–2), C3 torque as maximum consistency during starch gelatinization stage (C3), difference between torques C3 and C2 (C3–2), C4 torque as minimum consistency corresponding to hot starch stability gel (C4), C3–4—difference between torques C3 and C4, C5 torque as maximum consistency during starch retrogradation stage (C5) and difference between torques C5 and C4 (C5–4). The coefficients of determination (R2) values (0.69–0.97), indicated the fitted models represented the experimental data well, elucidating the relationships between factors and responses.
3.4. α-Amylase Activity
The α-amylase activity of the formulated quinoa-wheat composite flours, defined through the Falling number (FN) index, showed that FN values varied from 277 to 347 s. The regression model obtained for FN (s) is represented by Equation (5):
The results of the regression analysis for the FN index showed that the quadratic model was highly significant (p < 0.0001) and defined well the real α-amylase activity of the composite flour through FN index (R2 = 0.88). The particle size of quinoa flour added had a significant negative effect (p < 0.05) on the FN, while the level added had a nonsignificant effect (p > 0.05). Probably, the phenolic acids present in the small particle size bind to α-amylase changing its conformation and reducing its hydrolytic activity, thus determining an increase in FN index. FN was significantly negatively correlated (p < 0.05) with the interaction effect between QF addition level in wheat flour and particle size, and also with quadratic term of QF addition level. The negative coefficient of the QF addition level indicated that the FN index of quinoa-wheat composite flour decreased with substitution of quinoa seed flour level increase. The effects of particle size and QF addition level indicated a decrease of FN index with particle size and QF addition increase (Figure 1a), suggesting an increase of the α-amylase activity. It is well known that the FN index is inversely proportional with α-amylase activity in flour [70]. The increase of α-amylase activity of the composite mixture is related to the fact that α-amylase is a metalloenzyme which depends on the presence of calcium ions in its molecule for activity [71]. It is known that quinoa seeds contain a high level of calcium [59] and, therefore, an increased level of quinoa flour in the quinoa-wheat composite flour would result in an increase of α-amylase activity mixture, improving final product quality.
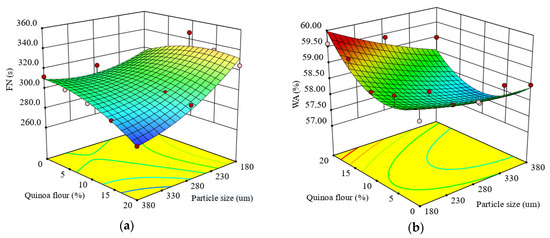
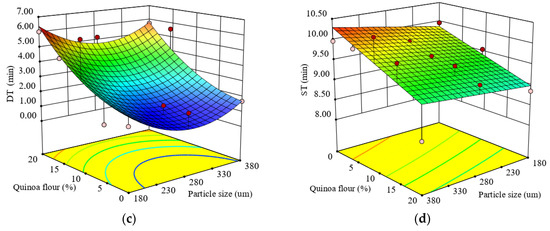
Figure 1.
Response surface graph for combined effects of quinoa flour particle size and levels added in refined wheat flour on: (a) Falling number index and Mixolab parameters during dough development stage: (b) water absorption (WA), (c) development time (DT), (d) dough stability (ST).
3.5. Dough Rheological Properties during Mixing Stage of the Mixolab
3.5.1. Water Absorption
The quadratic polynomial model describing water absorption (WA) as a simultaneously function of particle size and level of QF added in wheat flour is presented as follows:
This model is suitable to predict WA as a function of formulation factors (R2 = 0.78) defining the real behavior of the dough among water absorption. WA of quinoa-wheat composite flour dough ranged from 57.3 to 59.6%. The results of regression analyses for WA indicated that the linear terms of particle size and QF level had significant (p < 0.05) effects on WA. The model showed that the linear terms of particle size, and the interaction between particle size and QF level added, had a negative influence on WA, which indicated that the water absorption of quinoa-wheat composite flour dough increased when levels of QF added in wheat flour increased and particle size decreased. When the particle sizes of flours are smaller, they have a higher surface area to absorb more water. The effect of different addition levels of QF in wheat flour on WA of quinoa-wheat composite flour dough is shown in Figure 1b.
The response surface graph indicates that with the increase of QF addition level in wheat flour, WA increased. These results are in agreement with the results obtained by Ahmed et al. (2019) [28] and Drakos et al. (2017) [49]. It seems that water absorption value depends on quinoa particle size, a lower size increasing the values of dough water absorption in accordance with the findings of Ahmed et al. (2016) [36]. The medium particle fractions, followed by small particles, absorbed more water compared to the large particle sizes of QF, a result that can be related to water absorption capacity values (Table 2). This trend can be influenced by various factors, in particular particle size composition. According to Rao et al. (2016) [72], damaged starch could contribute to the increase of the WA of quinoa-wheat composite flours due to the interaction between starch and nonstarch components like proteins and cell wall matrices. A decrease in WA with an increase of particle size can be explained by the chemical structure of quinoa seed, which is rich in dietary fibers made up mostly of insoluble polysaccharides and cellulose [10] and mainly located in endosperm [73], while starch is situated in perisperm. Similar result was reported by Coțovanu et al. (2020) [43], Iuga et al. (2019) [34] and Mironeasa et al. (2019) [33] which demonstrated that the small particle size of nongluten flours increases the values of WA.
3.5.2. Dough Development Time
The regression model for dough development time (DT) is represented by Equation (7):
The test for precision of the model indicated that the quadratic model was suitable to predict DT as a function of the formulation factors. The R2 value of 0.70 was satisfactory to confirm the adequacy of the model. Dough DT was significantly affected (p < 0.05) by the level of QF added in wheat flour, while the particle size did not significantly (p > 0.05) influence DT which ranged from 1.28 to 6.13 min. DT increased remarkably in the composite flour as the QF level increased, showing that a long time was needed between the addition of water and the time when the dough reached the optimal rheological characteristics. The increase in DT can be explained by the addition of nongluten flour which diluted the gluten network. As DT represents a measure of dough strength, the higher it is the stronger the dough. The effect of particle size and QF level added in wheat flour on DT value represented by a response surface graph is shown in Figure 1c. The response surface graph revealed that DT increased as the level increased, depending on particle size. DT increased about 2.7–3.5 times in the composite flour with small particle size as the QF level increased above 10% compared to the control. This increase of DT could be due to the increase of water when the level of quinoa flour is higher thereby requiring more mixing time. Larger particles, which are rich in dietary fibers, need more time for hydration and, thus, a higher DT.
3.5.3. Dough Stability
The regression model for dough stability (ST) is represented by Equation (8):
Dough ST was significantly influenced (p < 0.05) by particle size and by the level of QF added in wheat flour. The quadratic model fitted to the experimental results of dough ST showed a good coefficient of determination (R2 = 0.69). The statistical analysis of the model coefficients showed that the linear terms were highly significant only for the level of QF added (p < 0.05), while the linear term of particle size, interaction coefficient and quadratic terms were nonsignificant (p > 0.05).
The dough ST ranged from 8.40 to 10.35 min for the composite flours’ formulations. An increase in QF addition level decreased significantly (p < 0.05) dough ST (Figure 1d). Compared to the control sample, it seemed that the weakening of dough caused by the addition of QF was not excessive, probably due to the percentage of lipids from the QF which are able to form lipoprotein complexes, leading to the stabilization of dough [74]. The decrease in dough ST with the increase of QF level may be related to the lower water availability in the dough system because it can be seen that the water absorption capacity of dough decreased with an increase of QF level. Gluten dilution, when nongluten flour was added, diminished the dough’s viscoelastic properties [75] and, therefore, the ST decreased. At a high QF level the gluten networks may be disrupted, which can lead to dough weakening.
3.6. Dough Rheological Properties during Heating
3.6.1. Protein Weakening
The quadratic model describing C2 torque variation during protein weakening related to mechanical shear and temperature constraint is presented in Equation (9):
The regression model was statistically significant at p < 0.005 and fitted the experimental data for C2, showing a high coefficient of determination (R2 = 0.82). It was found that particle size and QF level had a highly significant linear effect (p < 0.05 and p < 0.005) on C2. The results showed an increase of C2 as the particle size increased and a decrease of C2 when QF addition increased (Figure 2a). The decrease of C2 can be explained by the lower water availability in the dough system due to the fact that the water absorption capacity of dough increases when the QF addition level increases, or it may be related to gluten dilution or to the activity intensification of proteolytic enzymes. C2 torque decreased with particle size reduction, especially in the case of small particle sizes, and may be linked either to a release of water molecules in dough or to the presence of a high content of proteins and the quinoa flour interfering with the protein unfolding. An increase of protein content in medium particle size, followed by small particle size, compared to large particles was observed (Table 2). Therefore, the balance between protein and starch from quinoa-wheat composite flour could play an essential role for dough consistency, particularly the amylose to amylopectin ratio.
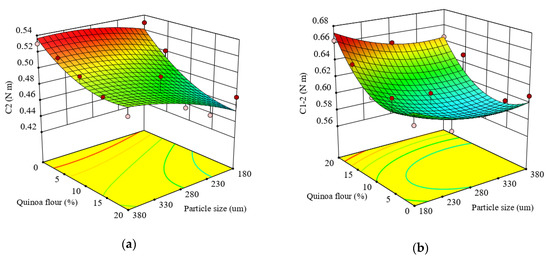
Figure 2.
Response surface graph for combined effects of quinoa flour particle size and level added in refined wheat flour on Mixolab parameters during protein weakening stage: (a) C2 torque (C2) and (b) difference between torques C1 and C2 (C1–2).
The protein network strength under increased heating, represented by the difference between torques C1 and C2 (C1–2), indicated that the quadratic model (Equation (10) was statistically significant at p < 0.01, and fitted adequately the experimental results of C1–2 with a high coefficient of determination (R2 = 0.78).
The linear effect of particle size and level of QF addition on C1–2 was significant (p < 0.05 and p < 0.005), while the interaction and quadratic effects of particle size and QF addition in wheat flour were not significant (p > 0.05).
It can be seen from Figure 2b that increasing the concentration of QF increased the C1–2 torque but increasing the particle size led to a decrease in C1–2. This decrease in C1-2 could be due mainly to the particles’ composition. As observed from Table 2, high carbohydrate content was found in the large particle size with a low level of proteins, compared to the medium and small fractions. With respect to the combined effect between particle size and QF addition level on protein network strength, it was observed that the protein network became weaker under increased heating. The addition of QF caused a decrease of protein weakening speed with temperature rise. This is probably due to the changes in protein network structure which favor the enzymatic attack resulting from less compact proteins and, therefore, increased speed of protein weakening at higher temperature. The protein network decrease may be related with increased dough proteolytic activity, the enzyme having an optimal activity within the temperature range of this Mixolab stage. This result could also be also associated with the area-specific surface of quinoa starch, that is larger than for wheat starches and makes them more sensitive to hydrolysis by α-amylase than wheat starch [76].
3.6.2. Starch Gelatinization
The regression model obtained for C3 torque, which represent maximum consistency during starch gelatinization process that occurs when dough is heated above 60 °C is presented in Equation (11):
The quadratic regression equation was fitted (p < 0.0001) for prediction of factors’ effects on C3 torque and showed a high coefficient of determination (R2 = 0.96).The linear coefficient of the QF addition level indicated a highly significant negative effect (p < 0.0001) on the torque C3, while particle size had a positive effect (p < 0.005). It was observed that interaction between PS and QF addition level had a significant effect (p < 0.05) on C3. Similar observations regarding particle size effect on the starch gelatinization process were reported by Ahmed et al. (2019) [28] for quinoa flour and may be due to low amylose content compared to the control. Collar et al. (2017) [77] showed that nonstarch components such as lipids, proteins and dietary fibers could restrict swelling and gelatinization during cooking, in addition to a diluting effect due to the interaction with starch polymers (lipids and proteins), and to the competition for water (proteins and dietary fiber), interfering with starch swelling. As observed in Figure 3a, C3 gradually decreased with the QF substitution increase, and a higher level of QF (20%) addition in wheat flour led to a decreased value for C3 torque (1.67 N · m) in the case of smaller particle size. This behavior could be related to the amylase activity of quinoa flour and the amylose-lipid complexes formed during heating of starch slurries. The results are in agreement with those obtained when amaranth was added in wheat flour [43]. The C3 torque decreased when the particle size of quinoa flour decreased. This was expected because the small particles fraction was a starch-rich particle and lead to a lower C3 torque compared to coarse particles that are fiber-rich particle fractions. Similar observations were reported by Martinez-Villaluenga et al. (2020) [1] and, Haros and Schoenlechner (2017) [76]. Additionally, the medium and small fractions had less carbohydrates content compared to large particle size fractions (Table 2). The small particle sizes presented large surfaces and competed with starch granules from wheat flour, contributing to lower dough viscosity. An opposite trend was reported by Ahmed et al. (2019) [28] for larger particles of QF which led to a higher pasting viscosity explained by the smaller surface area with lower swelling. The differences among studied particle fractions was affected by their composition and might be due to the particle microstructure of the quinoa-starch that govern water absorption and swelling.
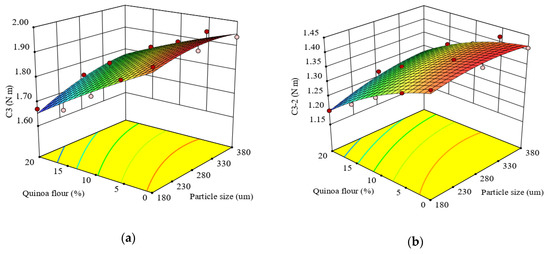
Figure 3.
Response surface graph for combined effects of quinoa flour particle size and level added in refined wheat flour on Mixolab parameters during starch gelatinization stage: (a) C3 torque (C3) and (b) difference between torques C3 and C2 (C3–2).
The effects of particle size and QF addition level in wheat flour on the difference between C3 and C2 torques (C3–2) is described by Equation (12):
The quadratic model represented the experimental data of C3–2 very well with a high R2 value (0.98). The linear terms of particle size and QF addition level in wheat flour on C3-2 were significant (p < 0.0001). C3–2 was significantly correlated (p < 0.05) with the quadratic effect of particle size and the interaction effect of particle size and QF addition level in wheat flour. The effect of particle size and QF dose added in wheat flour indicated an increase of C3–2 with particle size increase and an increase of this response with level decrease (Figure 3b). This behavior might be due to the combined effect of increased α-amylase activity in composite flour and to the compounds present in the particle fractions’ composition of quinoa flour, according to the observations reported by Wang et al. (2016) [26].
3.6.3. Hot Starch Stability Gel
The stability of hot-formed starch gel or cooking stability is represented by C4 torque. A quadratic regression equation (Equation (13)) was fitted to predict the effect of particle size and added QF level in wheat flour on the variation of C4 (Figure 4a).
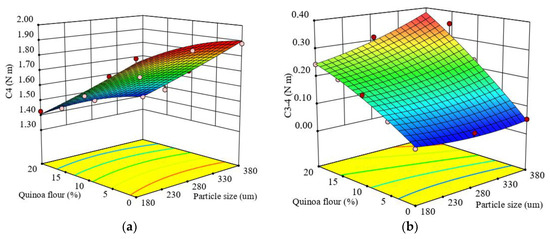
Figure 4.
Response surface graph for combined effects of quinoa flour particle size and level added in refined wheat flour on Mixolab parameters during cooking stage: (a) C4 torque (C4) and (b) difference between torques C3 and C4 (C3–4).
The regression model obtained was very good because the value of the coefficient of determination (R2) was high and close to 1 (0.98), which indicated that 98% of total variation was explained by the model and only 2% of the total variation was unexplained. The effects of the formulation factor of QF added in wheat flour on the C4 torque showed a highly significant (p < 0.0001) decrease with the QF level increase. The relationship with particle size decrease effect was not significant (p > 0.05). The stability of hot-formed starch gel can be related to the stability of the already broken starch granules under heating (Liu et al., 2016) [78]. The heating process at high temperature led to a decrease of viscosity associated with paste resistance to disintegration at high temperature, the lowest C4 value (1.39 N · m) being obtained for large particle sizes at a level of 20% QF added to wheat flour. For all formulations, the C4 torque had lower values compared to the control. The decrease of C4 torque with the amount of quinoa flour added can be explained by its high content of soluble fiber, mainly in small particle sizes, which can bind water by hydrogen bonds leading to a decrease of available water for the starch granules. On the other hand, Ahmed et al. (2019) [28] showed that the low amylose content of quinoa seeds can lead to a more fluid gel formation without such a defined three-dimensional structure, contributing to a decrease in C4 torque.
The difference of the points C3–4 was significantly affected by particle size and QF addition level in wheat flour at p < 0.01 and p < 0.0001, respectively. The regression model obtained (Equation (14)) fitted to the experimental results of the difference between torques C3–4 showed a high coefficient of determination (R2 = 0.97), and indicated that the model explained 97% of the observed data variation.
Figure 4b show the response surface graph for the combined effect of particle size and QF level addition in wheat flour on C3–4. It can be seen that as the particle size and QF level increased in samples, C3–4 increased.
All the samples with QF addition had higher values of C3–4 compared to the control sample, depending on the particle size, even if the quinoa flour did not add amylase to the dough system. An increase of C3-4 could be associated with reduced gel stability when hot and may be due to starch damage.
3.6.4. Starch Retrogradation
The regression equation obtained for C5 torque, which represents starch retrogradation during the cooling period of the Mixolab, is given by the Equation (15).
The ANOVA results show that the quadratic model fitted for C5 torque was well adjusted to the experimental data (R2 = 0.98).
The maximum consistency during starch retrogradation (C5) was significantly (p < 0.0001) affected by the particle sizes and different levels of QF added to wheat flour. It was found that there was a significant (p < 0.05) positive effect of increasing particle size and a significant (p < 0.0001) negative effect of QF level added to wheat flour on C5 torque. The response surface graph for the combined effect of particle size and level of QF added to wheat flour on C5 is given in Figure 5a. As the level of QF increased and the particle size decreased, the C5 torque decreased. This indicates that starch retrogradation depends on the starch proportions of amylose and amylopectin [79], amylose recrystallizing faster than amylopectin. The decreases of C5 torque suggested that particle size composition influenced α-amylase activity in quinoa-wheat composite flours, a high activity causing a lowering of C5 value.
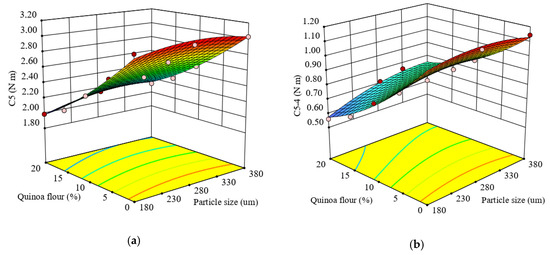
Figure 5.
Response surface graph for combined effects of quinoa flour particle size and level added in refined wheat flour on Mixolab parameters during starch retrogradation: (a) C5 torque (C5) and (b) difference between torques C5 and C4 (C5–4).
The quadratic regression model obtained from the ANOVA for the difference between C5 and C4 torques (C5–4) (Equation (16)) was found to be significant (p < 0.0001) and the R2 value of 0.97 confirmed the adequacy of the model.
Based on the obtained results, it was found that there was a significant effect of factors, particle size and QF level added to wheat flour (p < 0.005 and p < 0.0001), and of their interaction (p < 0.05), on the C5–4. All the formulations had a lower value for C5-4 torque compared with the control sample.
The response surface graph for combined effect of factors on C5–4 is given in Figure 5b. As the particle size decreased and QF addition increased, the C5–4 decreased, the lowest value (0.56 N·m) being achieved at 20% QF of small particle size which substituted the wheat flour. This decrease may be attributed to the quinoa flour addition to wheat flour limiting starch retrogradation and preserving bread freshness depending on particle size.
3.7. Optimization
The numerical optimization procedure revealed that the most suitable composite flour would have 8.98% quinoa flour of 280 μm particle size. Predicted values for responses are shown in Table 3 compared to the values for control samples. As can be seen, optimal values for water absorption, dough stability and protein weakening in terms of C2 and C1–2 were very close to the values of control samples and were not statistically different at the 95% confidence level. It can be said that during the early stage of bread, the optimal dough formulation can retain gas similar to the control sample.
Table 3.
Optimized quinoa-wheat flour dough compared to the wheat flour control sample.
Dough development time increased compared to the control, suggesting an increase of gluten network strength indicating that optimal dough can sustain the mechanical treatment for a longer period during the bread making process. A similar finding was reported for optimized amaranth-wheat composite flour [43].
During the pasting stage, a slight decrease was obtained for the Mixolab parameters which revealed that the optimal quinoa-wheat flour formulation could be adequate for bread-making and the final products could have a longer shelf-life without problems of going stale. The medium particle size of added QF could delay baked goods going stale.
4. Conclusions
Milling fractions of quinoa seeds revealed variations in chemical composition and functionality depending on particle size. Medium particle sizes, followed by small particle sizes, have high content of protein and ash, whereas large particle sizes are enriched with carbohydrates. A higher water absorption capacity and water retention capacity was found for medium particle sizes, while the small particle sizes had a higher swelling capacity. Dough rheological properties were remarkably influenced by particle size and level of quinoa flour added to wheat flour, all the regression models obtained for responses being significant (p < 0.05) and with high coefficients of determination (R2 > 0.69). A simultaneous optimization of multiple responses allowed us to obtain the optimal particle size and quinoa flour level added to wheat flour to achieve dough with the best rheological properties. For this purpose, the formulation with medium particle size, 8.98% quinoa flour and 91.02% wheat flour, was considered to be the most appropriate to develop new breadmaking products. It can be concluded that the processor should maintain a certain particle size to obtain a desired product consistency together with the appropriate rheological parameters. This optimal formulation does not alter the dough matrix, leads to the best technological parameters and can be used to enrich baked products due to their particle size composition.
Author Contributions
Conceptualization, I.C. and S.M.; methodology, I.C. and S.M.; software, I.C.; validation, I.C., A.B. and S.M.; formal analysis, I.C., A.B. and S.M.; investigation, I.C. and A.B.; resources, I.C., A.B. and S.M.; data curation, I.C., A.B. and S.M.; writing—original draft preparation, I.C.; writing—review and editing, I.C. and S.M.; visualization, I.C., A.B. and S.M.; supervision, S.M.; project administration, S.M.; funding acquisition, S.M. All authors have read and agreed to the published version of the manuscript.
Funding
This work was supported from contract no. 18PFE/16.10.2018 funded by Ministry of Research and Innovation within Program 1-Development of national research and development system, Subprogram 1.2-Institutional Performance-RDI excellence funding projects.
Acknowledgments
The authors thank Arcada Research laboratory, Arcada Mill, Romania for technical support.
Conflicts of Interest
The authors declare no conflict of interest.
References
- Martínez-Villaluenga, C.; Peñas, E.; Hernández-Ledesma, B. Pseudocereal grains: Nutritional value, health benefits and current applications for the development of gluten-free foods. Food Chem. Toxicol. 2020, 137, 111178. [Google Scholar] [CrossRef] [PubMed]
- Kahlon, T.S.; Avena-Bustillos, R.J.; Chiu, M.C.M. Sensory evaluation of gluten-free quinoa whole grain snacks. Heliyon 2016, 2, e00213. [Google Scholar] [CrossRef] [PubMed]
- Burgos, V.E.; López, E.P.; Goldner, M.C.; Del Castillo, V.C. Physicochemical characterization and consumer response to new Andean ingredients-based fresh pasta: Gnocchi. Int. J. Gastron. Food Sci. 2019, 16, 100142. [Google Scholar] [CrossRef]
- Solaesa, Á.G.; Villanueva, M.; Vela, A.J.; Ronda, F. Protein and lipid enrichment of quinoa (cv. Titicaca) by dry fractionation. Techno-functional, thermal and rheological properties of milling fractions. Food Hydrocoll. 2020, 105, 105770. [Google Scholar] [CrossRef]
- Pereira, E.; Encina-Zelada, C.; Barros, L.; Gonzales-Barron, U.; Cadavez, V.; Ferreira, I.C. Chemical and nutritional characterization of Chenopodium quinoa Willd (quinoa) grains: A good alternative to nutritious food. Food Chem. 2019, 280, 110–114. [Google Scholar] [CrossRef] [PubMed]
- Tanwar, B.; Goyal, A.; Irshaan, S.; Kumar, V.; Sihag, M.K.; Patel, A.; Kaur, I. Quinoa. In Whole Grains and their Bioactives: Composition and Health; Johnson, J., Walace, T., Eds.; John Wiley & Sons Ltd.: Hoboken, NJ, USA, 2019; pp. 269–305. [Google Scholar] [CrossRef]
- Repo-Carrasco-Valencia, R.; Arana, J.V. Carbohydrates of Kernels. In Pseudocereals: Chemistry and Technology; Haros, M., Schoenlechner, R., Eds.; Wiley: Oxford, UK, 2017; pp. 28–48. [Google Scholar]
- James, L.E.A. Quinoa (Chenopodium quinoa Willd.): Composition, chemistry, nutritional, and functional properties. Adv. Food Nutr. Res. 2009, 58, 1–31. [Google Scholar] [CrossRef]
- Ahamed, N.T.; Singhal, R.S.; Kulkami, P.R.; Palb, M. Physicochemical and functional properties of Chenopodium quinoa starch. Carbohydr. Polym. 1996, 31, 99–103. [Google Scholar] [CrossRef]
- Lamothe, L.M.; Srichuwong, S.; Reuhs, B.L.; Hamaker, B.R. Quinoa (Chenopodium quinoa W.) and amaranth (Amaranthus caudatus L.) provide dietary fibres high in pectic substances and xyloglucans. Food Chem. 2015, 167, 490–496. [Google Scholar] [CrossRef]
- Nowak, V.; Du, J.; Charrondière, U.R. Assessment of the nutritional composition of quinoa (Chenopodium quinoa Willd.). Food Chem. 2016, 193, 47–54. [Google Scholar] [CrossRef]
- Rosero, O.; Marounek, M.; Břeňová, N. Phytase activity and comparison of chemical composition, phytic acid P content of four varieties of quinoa grain (Chenopodium quinoa Willd.). Acta Agronómica 2013, 62, 13–20. [Google Scholar]
- Rizzello, C.G.; Lorusso, A.; Montemurro, M.; Gobbetti, M. Use of sourdough made with quinoa (Chenopodium quinoa) flour and autochthonous selected lactic acid bacteria for enhancing the nutritional, textural and sensory features of white bread. Food Microbiol. 2016, 56, 1–13. [Google Scholar] [CrossRef] [PubMed]
- Miranda, M.; Vega-Gálvez, A.; Quispe-Fuentes, I.; Rodríguez, M.J.; Maureira, H.; Martínez, E.A. Nutritional aspects of six quinoa (Chenopodium quinoa Willd.) ecotypes from three geographical areas of Chile. Chil. J. Agric. Res. 2012, 72, 175. [Google Scholar] [CrossRef]
- Joshi, D.C.; Sood, S.; Hosahatti, R.; Kant, L.; Pattanayak, A.; Kumar, A.; Yadav, D.; Stetter, M.G. From zero to hero: The past, present and future of grain amaranth breeding. Theor. Appl. Genet. 2018, 131, 1807–1823. [Google Scholar] [CrossRef] [PubMed]
- Tang, Y.; Li, X.; Chen, P.X.; Zhang, B.; Liu, R.; Hernandez, M.; Draves, J.; Marcone, M.F.; Tsao, R. Assessing the fatty acid, carotenoid, and tocopherol compositions of amaranth and quinoa seeds grown in Ontario and their overall contribution to nutritional quality. J. Agric. Food Chem. 2016, 64, 1103–1110. [Google Scholar] [CrossRef]
- Vera, E.P.; Alca, J.J.; Saravia, G.R.; Campioni, N.C.; Alpuy, I.J. Comparison of the lipid profile and tocopherol content of four Peruvian quinoa (Chenopodium quinoa Willd.) cultivars (‘Amarilla de Maranganí’, ‘Blanca de Juli’, INIA 415 ‘Roja Pasankalla’, INIA 420 ‘Negra Collana’) during germination. J. Cereal Sci. 2019, 88, 132–137. [Google Scholar] [CrossRef]
- Paucar-Menacho, L.M.; Dueñas, M.; Peñas, E.; Frias, J.; Martínez-Villaluenga, C. Effect of dry heat puffing on nutritional composition, fatty acid, amino acid and phenolic profiles of pseudocereals grains. Pol. J. Food Nutr. Sci. 2018, 68, 289–297. [Google Scholar] [CrossRef]
- Nascimento, A.C.; Mota, C.; Coelho, I.; Gueifão, S.; Santos, M.; Matos, A.S.; Gimenez, A.; Lobo, M.; Samman, N.; Castanheira, I. Characterisation of nutrient profile of quinoa (Chenopodium quinoa), amaranth (Amaranthus caudatus), and purple corn (Zea mays L.) consumed in the North of Argentina: Proximates, minerals and trace elements. Food Chem. 2014, 148, 420–426. [Google Scholar] [CrossRef]
- Vega-Gálvez, A.; Miranda, M.; Vergara, J.; Uribe, E.; Puente, L.; Martínez, E.A. Nutrition facts and functional potential of quinoa (Chenopodium quinoa Willd.), an ancient Andean grain: A review. J. Sci. Food Agric. 2010, 90, 2541–2547. [Google Scholar] [CrossRef]
- Han, Y.; Chi, J.; Zhang, M.; Zhang, R.; Fan, S.; Dong, L.; Huang, F.; Liu, L. Changes in saponins, phenolics and antioxidant activity of quinoa (Chenopodium quinoa Willd) during milling process. LWT Food Sci. Technol. 2019, 114, 108381. [Google Scholar] [CrossRef]
- Rocchetti, G.; Lucini, L.; Rodriguez, J.M.; Barba, F.J.; Giuberti, G. Gluten-free flours from cereals, pseudocereals and legumes: Phenolic fingerprints and in vitro antioxidant properties. Food Chem. 2019, 271, 157–164. [Google Scholar] [CrossRef]
- Gómez-Caravaca, A.M.; Segura-Carretero, A.; Fernández-Gutiérrez, A.; Caboni, M.F. Simultaneous determination of phenolic compounds and saponins in quinoa (Chenopodium quinoa Willd) by a liquid chromatography–diode array detection–electrospray ionization–time-of-flight mass spectrometry methodology. J. Agric. Food Chem. 2011, 59, 10815–10825. [Google Scholar] [CrossRef]
- Tamba-Berehoiu, R.M.; Turtoi, M.O.; Popa, C.N. Assessment of quinoa flours effect on wheat flour doughs rheology and bread quality. Ann. Univ. Dunarea Jos Galati. Fascicle Food Technol. 2019, 43, 173–188. [Google Scholar] [CrossRef]
- Codină, G.G.; Franciuc, S.G.; Todosi-Sănduleac, E. Studies on the influence of quinoa flour addition on bread quality. Food Environ. Saf. J. 2016, 15, 165–174. [Google Scholar]
- Wang, S.; Zhu, F. Formulation and Quality Attributes of Quinoa Food Products. Food Bioprocess Technol. 2016, 9, 49–68. [Google Scholar] [CrossRef]
- Sullivan, B.; Engebreston, W.E.; Anderson, M.L. The relation of particle size of certain flour characteristics. Cereal Chem. 1960, 37, 436–455. [Google Scholar]
- Ahmed, J.; Thomas, L.; Arfat, Y.A. Functional, rheological, microstructural and antioxidant properties of quinoa flour in dispersions as influenced by particle size. Food Res. Int. 2019, 116, 302–311. [Google Scholar] [CrossRef] [PubMed]
- Nguyen, A.; Pasquier, P.; Marcotte, D. Influence of groundwater flow in fractured aquifers on standing column wells performance. Geothermics 2015, 58, 39–48. [Google Scholar] [CrossRef]
- Benito-Román, O.; Rodríguez-Perrino, M.; Sanz, M.T.; Melgosa, R.; Beltrán, S. Supercritical carbon dioxide extraction of quinoa oil: Study of the influence of process parameters on the extraction yield and oil quality. J. Supercrit. Fluids 2018, 139, 62–71. [Google Scholar] [CrossRef]
- Joubert, M.; Morel, M.H.; Lullien-Pellerin, V. Pasta color and viscoelasticity: Revisiting the role of particle size, ash, and protein content. Cereal Chem. 2018, 95, 386–398. [Google Scholar] [CrossRef]
- Tsatsaragkou, K.; Kara, T.; Ritzoulis, C.; Mandala, I.; Rosell, C.M. Improving carob flour performance for making gluten-free breads by particle size fractionation and jet milling. Food Bioprocess Technol. 2017, 10, 831–841. [Google Scholar] [CrossRef]
- Mironeasa, S.; Iuga, M.; Zaharia, D.; Mironeasa, C. Rheological analysis of wheat flour dough as influenced by grape peels of different particle sizes and addition levels. Food Bioprocess Technol. 2019, 12, 228–245. [Google Scholar] [CrossRef]
- Iuga, M.; Mironeasa, C.; Mironeasa, S. Oscillatory rheology and creep-recovery behaviour of grape seed-wheat flour dough: Effect of grape seed particle size, variety and addition level. Bull. UASVM Food Sci. Technol. 2019, 76, 40–51. [Google Scholar] [CrossRef]
- Mironeasa, S.; Iuga, M.; Zaharia, D.; Dabija, A.; Mironeasa, C. Influence of particle sizes and addition level of grape seeds on wheat flour dough rheological properties. In Proceedings of the International Multidisciplinary Scientific GeoConference Surveying Geology & Mining Ecology Management, Vienna, Austria, 27–29 November 2017; Volume 17, pp. 265–272. [Google Scholar] [CrossRef]
- Ahmed, J.; Al-Attar, H.; Arfat, Y.A. Effect of particle size on compositional, functional, pasting and rheological properties of commercial water chestnut flour. Food Hydrocoll. 2016, 52, 888–895. [Google Scholar] [CrossRef]
- Alonso-Miravalles, L.; O’Mahony, J.A. Composition, protein profile and rheological properties of pseudocereal-based protein-rich ingredients. Foods 2018, 7, 73. [Google Scholar] [CrossRef] [PubMed]
- Sosulski, F.; Humbert, E.S.; Bui, K.; Jones, J.D. Functional propreties of rapeseed flours, concentrates and isolate. J. Food Sci. 1976, 41, 49–1352. [Google Scholar] [CrossRef]
- Onipe, O.O.; Beswa, D.; Jideani, A.I.O. Effect of size reduction on colour, hydration and rheological properties of wheat bran. Food Sci. Technol. 2017, 37, 389–396. [Google Scholar] [CrossRef]
- Olapade, A.A.; Aworh, O.C.; Oluwole, O.B. Quality attributes of biscuit from acha (Digitaria exilis) flour supplemented with cowpea (Vigna unguiculata) flour. J. Food Sci. Technol. 2011, 2, 198–203. [Google Scholar] [CrossRef]
- Ikegwu, O.J.; Nwobasi, V.N.; Odoh, M.O.; Oledinma, N.U. Evaluation of the pasting and some functional properties of starch isolated from some improved cassava varieties in Nigeria. Afr. J. Biotechnol. 2009, 8, 2310–2315. [Google Scholar]
- ICC. International Association for Cereal Sciences and Technology, ICC Standard No. 173; ICC: Vienna, Austria, 2010. [Google Scholar]
- Coțovanu, I.; Stoenescu, G.; Mironeasa, S. Amaranth influence on wheat flour dough rheology: Optimal particle size and amount of flour replacement. J. Microbiol. Biotechnol. Food Sci. 2020, 10, 1–10. Available online: https://www.jmbfs.org/in-next-issue/ (accessed on 16 September 2020).
- Katina, K.; Heiniö, R.L.; Autio, K.; Poutanen, K. Optimization of sourdough process for improved sensory profile and texture of wheat bread. LWT Food Sci. Technol. 2006, 39, 1189–1202. [Google Scholar] [CrossRef]
- Mironeasa, S.; Mironeasa, C. Dough bread from refined wheat flour partially replaced by grape peels: Optimizing the rheological properties. J. Food Process Eng. 2009, 42, e13207. [Google Scholar] [CrossRef]
- Iuga, M.; Mironeasa, S. Grape seeds effect on refined wheat flour dough rheology: Optimal amount and particle size. Ukr. Food J. 2019, 8, 799–814. [Google Scholar] [CrossRef]
- Mironeasa, S.; Iuga, M.; Zaharia, D.; Mironeasa, C. Optimization of grape peels particle size and flour substitution in white wheat flour dough. Sci. Study Res. Chem. Eng. Biotechnol. Food Ind. 2019, 20, 29–42. [Google Scholar]
- Mironeasa, S.; Iuga, M.; Zaharia, D.; Mironeasa, C. Optimization of white wheat flour dough rheological properties with different levels of grape peels flour addition. Bull. UASVM Food Sci. Technol. 2019, 76, 27–39. [Google Scholar] [CrossRef]
- Drakos, A.; Kyriakakis, G.; Evageliou, V.; Protonotariou, S.; Mandala, I.; Ritzoulis, C. Influence of jet milling and particle size on the composition, physicochemical and mechanical properties of barley and rye flours. Food Chem. 2017, 215, 326–332. [Google Scholar] [CrossRef]
- Prasopsunwattana, N.; Omary, M.B.; Arndt, E.A.; Cooke, P.H.; Flores, R.A.; Yokoyama, W.; Toma, A.; Chongcham, S.; Lee, S.P. Particle size effects on the quality of flour tortillas enriched with whole grain waxy barley. Cereal Chem. 2009, 86, 439–451. [Google Scholar] [CrossRef]
- Offia-Olua, B.I. Chemical, functional and pasting properties of wheat (Triticum spp)-Walnut (Juglansregia) flour. Food Nutr. Sci. 2014, 5, 1591–1604. [Google Scholar] [CrossRef]
- Schuck, P.; Jeantet, R.; Dolivet, A. Analytical Methods Food Dairy Powders; Blackwell: Hoboken, NJ, USA, 2012. [Google Scholar]
- Sullivan, J.T. Evaluation of Forage Crops by Chemical Analysis. A Critique. Agron. J. 1962, 54, 511–515. [Google Scholar] [CrossRef]
- Ando, H.; Chen, Y.C.; Tang, H.; Shimizu, M.; Watanabe, K.; Mitsunaga, T. Food components in fractions of quinoa seed. Food Sci. Technol. Res. 2002, 8, 80–84. [Google Scholar] [CrossRef]
- D’Amico, S.; Jungkunz, S.; Balasz, G.; Foeste, M.; Jekle, M.; Tömösköszi, S.; Schoenlechner, R. Abrasive milling of quinoa: Study on the distribution of selected nutrients and proteins within the quinoa seed kernel. J. Cereal Sci. 2019, 86, 132–138. [Google Scholar] [CrossRef]
- Lindeboom, N.; Chang, P.R.; Falk, K.C.; Tyler, R.T. Characteristics of starch from eight quinoa lines. Cereal Chem. 2005, 82, 216–222. [Google Scholar] [CrossRef]
- Chauhan, G.S.; Eskin, N.A.M.; Tkachuk, R. Nutrients and antinutrients in quinoa seed. Cereal Chem. 1992, 69, 85–88. [Google Scholar]
- Herman, E.M.; Larkins, B.A. Protein storage bodies and vacuoles. Plant Cell 1999, 11, 601–613. [Google Scholar] [CrossRef] [PubMed]
- Koziol, M.J. Quinoa: A potential new oil crop. In New Crops; Janick, J., Simon, J.E., Eds.; Wiley: New York, NY, USA, 1993; pp. 328–336. [Google Scholar]
- Oshodi, H.N.; Ogungbenle, M.O.; Oladimeji, A.A. Chemical composition, nutritionally valuable minerals and functional properties of benniseed (Sesamum radiatum), pearl millet (Pennisetum typhoides) and quinoa (Chenopodium quinoa) flours. Int. J. Food Sci. Nutr. 1999, 50, 325–331. [Google Scholar] [CrossRef]
- Prego, I.; Maldonado, S.; Otegui, M. Seed structure and localization of reserves in Chenopodium quinoa. Ann. Bot. 1998, 82, 481–488. [Google Scholar] [CrossRef]
- Rodriguez-Sandoval, E.; Sandoval, G.; Cortes-Rodríguez, M. Effect of quinoa and potato flours on the thermomechanical and breadmaking properties of wheat flour. Braz. J. Chem. Eng. 2012, 29, 503–510. [Google Scholar] [CrossRef]
- Fekria, A.M.; Isam, A.M.A.; Suha, O.A.; Elfadil, E.B. Nutritional and functional characterization of defatted seed cake flour of two Sudanese groundnut (Arachis hypogaea) cultivars. Int. Food Res. J. 2012, 19, 629–637. [Google Scholar]
- Pérez, S.; Bertoft, E. The molecular structures of starch components and their contribution to the architecture of starch granules: A comprehensive review. Starch Stärke 2010, 62, 389–420. [Google Scholar] [CrossRef]
- Joardder, M.U.H.; Mourshed, M.; Masud, M.H. State of Bound Water: Measurement and Significance in Food Processing; Springer: Berlin/Heidelberg, Germany, 2019. [Google Scholar] [CrossRef]
- Ogungbenle, H.N.; Oshodi, A.A.; Oladimeji, M.O. The proximate and effect of salt applications on some functional properties of quinoa (Chenopodium quinoa) flour. Pak. J. Nutr. 2009, 8, 49–52. [Google Scholar] [CrossRef]
- Protonotariou, S.; Batzaki, C.; Yanniotis, S.; Mandala, I. Effect of jet milled whole wheat flour in biscuits properties. LWT- Food Sci. Technol. 2016, 74, 106–113. [Google Scholar] [CrossRef]
- Tang, Y.; Li, X.; Chen, P.X.; Zhang, B.; Hernandez, M.; Zhang, H.; Marcone, M.F.; Liu, R.; Tsao, R. Characterisation of fatty acid, carotenoid, tocopherol/tocotrienol compositions and antioxidant activities in seeds of three Chenopodium quinoa Willd genotypes. Food Chem. 2015, 174, 502–508. [Google Scholar] [CrossRef] [PubMed]
- Ratnawati, L.; Desnilasari, D.; Surahman, D.N.; Kumalasari, R. Evaluation of physicochemical, functional and pasting properties of soybean, mung bean and red kidney bean flour as ingredient in biscuit. In IOP Conference Series: Earth and Environmental Science; IOP Publishing: Bristol, UK, 2019; Volume 251, p. 012026. [Google Scholar] [CrossRef]
- Struyf, N.; Verspreet, J.; Courtin, C.M. The effect of amylolytic activity and substrate availability on sugar release in non-yeasted dough. J. Cereal Sci. 2016, 69, 111–118. [Google Scholar] [CrossRef]
- Sundarram, A.; Murthy, T.P.K. α-amylase production and applications: A review. J. Appl. Environ. Microbiol. 2014, 2, 166–175. [Google Scholar] [CrossRef]
- Rao, B.D.; Anis, M.; Kalpana, K.; Sunooj, K.V.; Patiul, J.V.; Ganesh, T. Influence of milling methods and particle size hydration properties of sorghum flour and quality of sorghum biscuits. LWT Food Sci. Technol. 2016, 67, 8–13. [Google Scholar]
- Haros, C.M.; Sanz-Penella, J.M. Food uses of whole pseudocereals. In Pseudocereals: Chemistry and Technology; Haros, M., Schoenlechner, R., Eds.; Wiley: Oxford, UK, 2017; pp. 163–192. [Google Scholar]
- Carr, N.O.; Daniels, N.W.; Frazier, P.J. Lipid interactions in breadmaking. Crit. Rev. Food Sci. Nutr. 1992, 31, 237–258. [Google Scholar] [CrossRef]
- Mohammed, I.; Ahmed, A.R.; Senge, B. Effects of chickpea flour on wheat pasting properties and bread making quality. J. Food Sci. Technol. 2014, 51, 1902–1910. [Google Scholar] [CrossRef]
- Haros, C.M.; Schoenlechner, R. Pseudocereals: Chemistry and Technology; John Wiley & Sons: Hoboken, NJ, USA, 2017; pp. 163–192. [Google Scholar]
- Collar, C. Significance of heat-moisture treatment conditions on the pasting and gelling behaviour of various starch-rich cereal and pseudocereal flours. Food Sci. Technol. Int. 2017, 23, 623–636. [Google Scholar] [CrossRef]
- Liu, X.L.; Mu, T.H.; Sun, H.N.; Zhang, M.; Chen, J.W. Influence of potato flour on dough rheological properties and quality of steamed bread. J. Integr. Agric. 2016, 15, 2666–2676. [Google Scholar] [CrossRef]
- BeMiller, J.N. Starches: Molecular and granular structures and properties. In Carbohydrate Chemistry for Food Scientists, 3rd ed.; BeMiller, J.N., Ed.; Elsevier: Amsterdam, The Netherlands, 2019; pp. 159–189. [Google Scholar]


Publisher’s Note: MDPI stays neutral with regard to jurisdictional claims in published maps and institutional affiliations. |
© 2020 by the authors. Licensee MDPI, Basel, Switzerland. This article is an open access article distributed under the terms and conditions of the Creative Commons Attribution (CC BY) license (http://creativecommons.org/licenses/by/4.0/).