Article

Effect of Cu, Cr, S Doped TiO2 for Transparent Plastic Bar Reinforced Concrete

1
BK Waterproofing Technology Research Center, 232 Gongneung-ro, Nowon-gu, Seoul 01811, Korea
2
School of Architecture, Seoul National University of Science & Technology, 232 Gongneung-ro, Nowon-gu, Seoul 01811, Korea
*
Author to whom correspondence should be addressed.
Appl. Sci. 2020, 10(20), 7334; https://doi.org/10.3390/app10207334
Submission received: 15 September 2020 / Revised: 12 October 2020 / Accepted: 14 October 2020 / Published: 20 October 2020
(This article belongs to the Special Issue Design, Synthesis and Characterization of Hybrid Composite Materials)

Abstract

:

Featured Application

Optimum TiO2 incorporation in mix design of UHPC and application of doped TiO2 to improve the photocatalytic reactivity of transparent plastic bar reinforced concrete.

Abstract

In this study, after firing and powdering Cu, Cr, and S with NP-400 TiO2, an NOx removal rate test was performed according to the ISO test method to analyze the photocatalytic reactivity in visible light. The distribution of the photocatalyst and visible light reactivity on the surface of the test specimen were confirmed through SEM (Scanning electron microscope), EDS (Energy dispersive spectroscopy), XRD (X-ray diffraction), UV-visible absorption spectrum and energy band gap tests. The flowability of UHPC (Ultra high performance concrete) slightly decreased due to the increase in the photocatalyst mixing rate, but both J-Ring and L-Box test results showed that there is no problem when concrete is placed. As a result of SEM and EDS tests, good microstructure and peak values were confirmed in the test specimens doped with Cu, and as a result of the XRD test, anatase and rutile peaks were confirmed in the Cu, Cr, and S specimens. In the UV-visible absorption spectrum analysis, it was confirmed that only the specimen doped with Cu maintains a high absorption power of 0.8 up to 700 nm, and the inherent band gaps are reduced to 2.9 eV, thereby increasing the possibility of reaction in visible light. Finally, as a result of the NOx removal test by the ISO test method, about 15.8% was removed for 5 h in the specimen doped with Cu, and the removal efficiency is estimated to be possible up to about 25% when applied with the TPBRC (transparent plastic bar reinforced concrete).

1. Introduction

In the 1960s, Akira Fujishima et al. demonstrated that TiO2 photocatalyst was found to have a powerful oxidation effect by hydroxyl radical [1]. Although it has various advantages, such as anti-corrosion action, removal of harmful substances, and super-hydrophilicity, it is difficult to use indoors because it has a strong photocatalysis reaction in ultraviolet areas (under 380 nm). As a result, there is active research to develop photocatalytic compounds that can react in visible light areas around the world [2,3,4,5,6,7,8,9,10,11,12,13,14,15,16]. For example, a lot of research has been done, such as doping using the solgel method and calcination by mixing metal or non-metal with a photocatalyst. In the field of architecture, shortening construction periods and cost cutting are very important factors. Therefore, the minimum process required was to manufacture the doped photocatalyst through simple calcination and milling [2,3,4]. In Korea, research by Kim Hwa-Jung et al. reported that a photocatalyst doped with Cu, Cr, and S removes harmful substances such as nitrogen oxides in the visible light region [5,9,12]. A KA-100 photocatalyst and transition metals such as Cu, Cr, and Fe were calcined at 1000 °C to verify reactivity in the visible light region and performance of removing harmful substances. As mentioned earlier, in the field of construction, shortening the construction period and reducing costs are very important factors, so this study aimed to use relatively inexpensive doping materials such as Cu, Cr, S and manufacture the photocatalyst doped by the high temperature calcination method [9].
TPBRC (Transparent plastic bar reinforced concrete) is a kind of light transmitting concrete that was developed in Korea, by arranging plastic bars into concrete. They can be expressed in various ways, such as text, pictures, etc. [17]. However, for concrete reinforced with plastic bars, the difference between the sleek surface of the plastic bar and the concrete matrix caused the mechanical performance to deteriorate and the plastic bar in the interface to slip [18,19]. Furthermore, the flowability of concrete is an important problem because plastic bars are inserted into the concrete matrix. Therefore, the UHPC (Ultra high performance concrete) materials started to be applied to various indoor spaces [20,21,22,23,24]. Transparent plastic bar reinforced concrete can be filled with different kinds of plastic type. This means the loss of a section of photocatalyst-incorporated concrete. However, TPBRC can be said to increase the area and efficiency of the photocatalysis reaction because there is a light transmitted concrete surface as well as a light transmitting concrete surface.
In order to utilize this advantage, this study intends to secure a TiO2-incorporated UHPC mix and use it in the transparent plastic bar reinforced concrete. In addition, it is intended to produce a visible light-reactive photocatalyst whose process is through calcination at high temperature. The final purpose of the study is to find out the possibility of the utilization of TPBRC advantages by estimating the NOx removal performance.

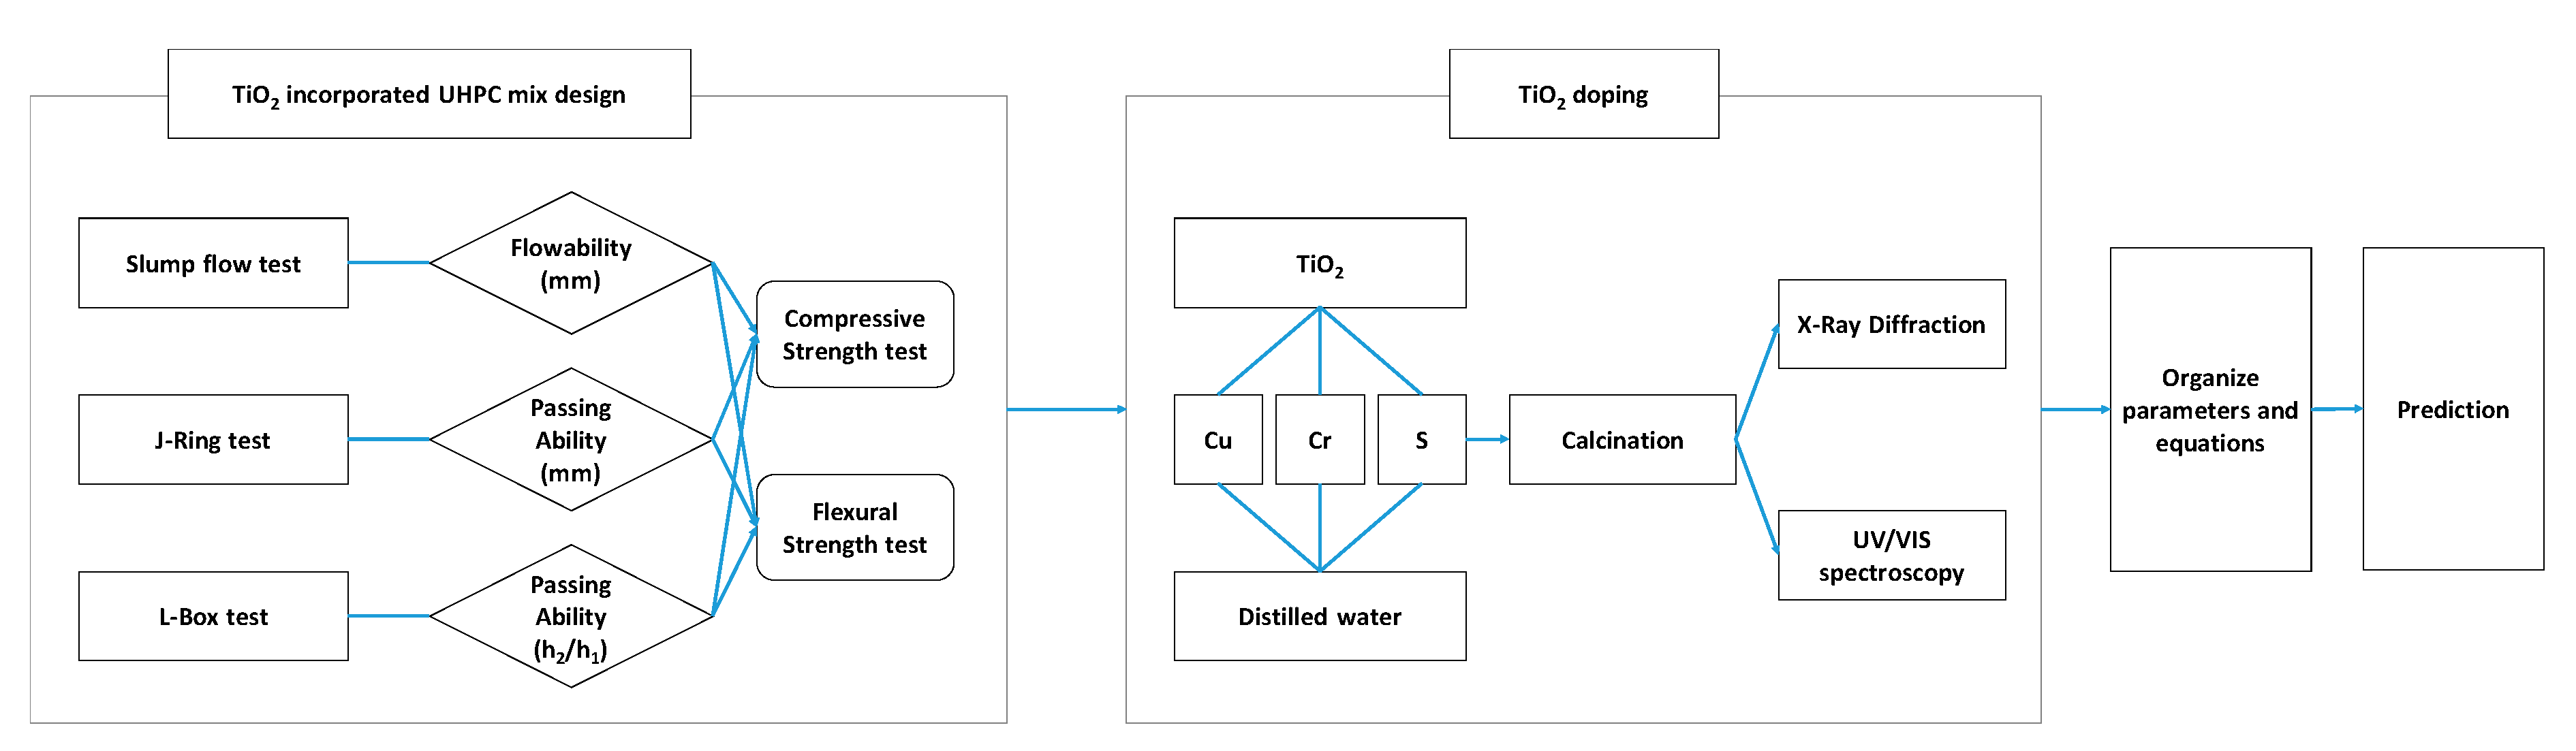
2. Experimental Programs

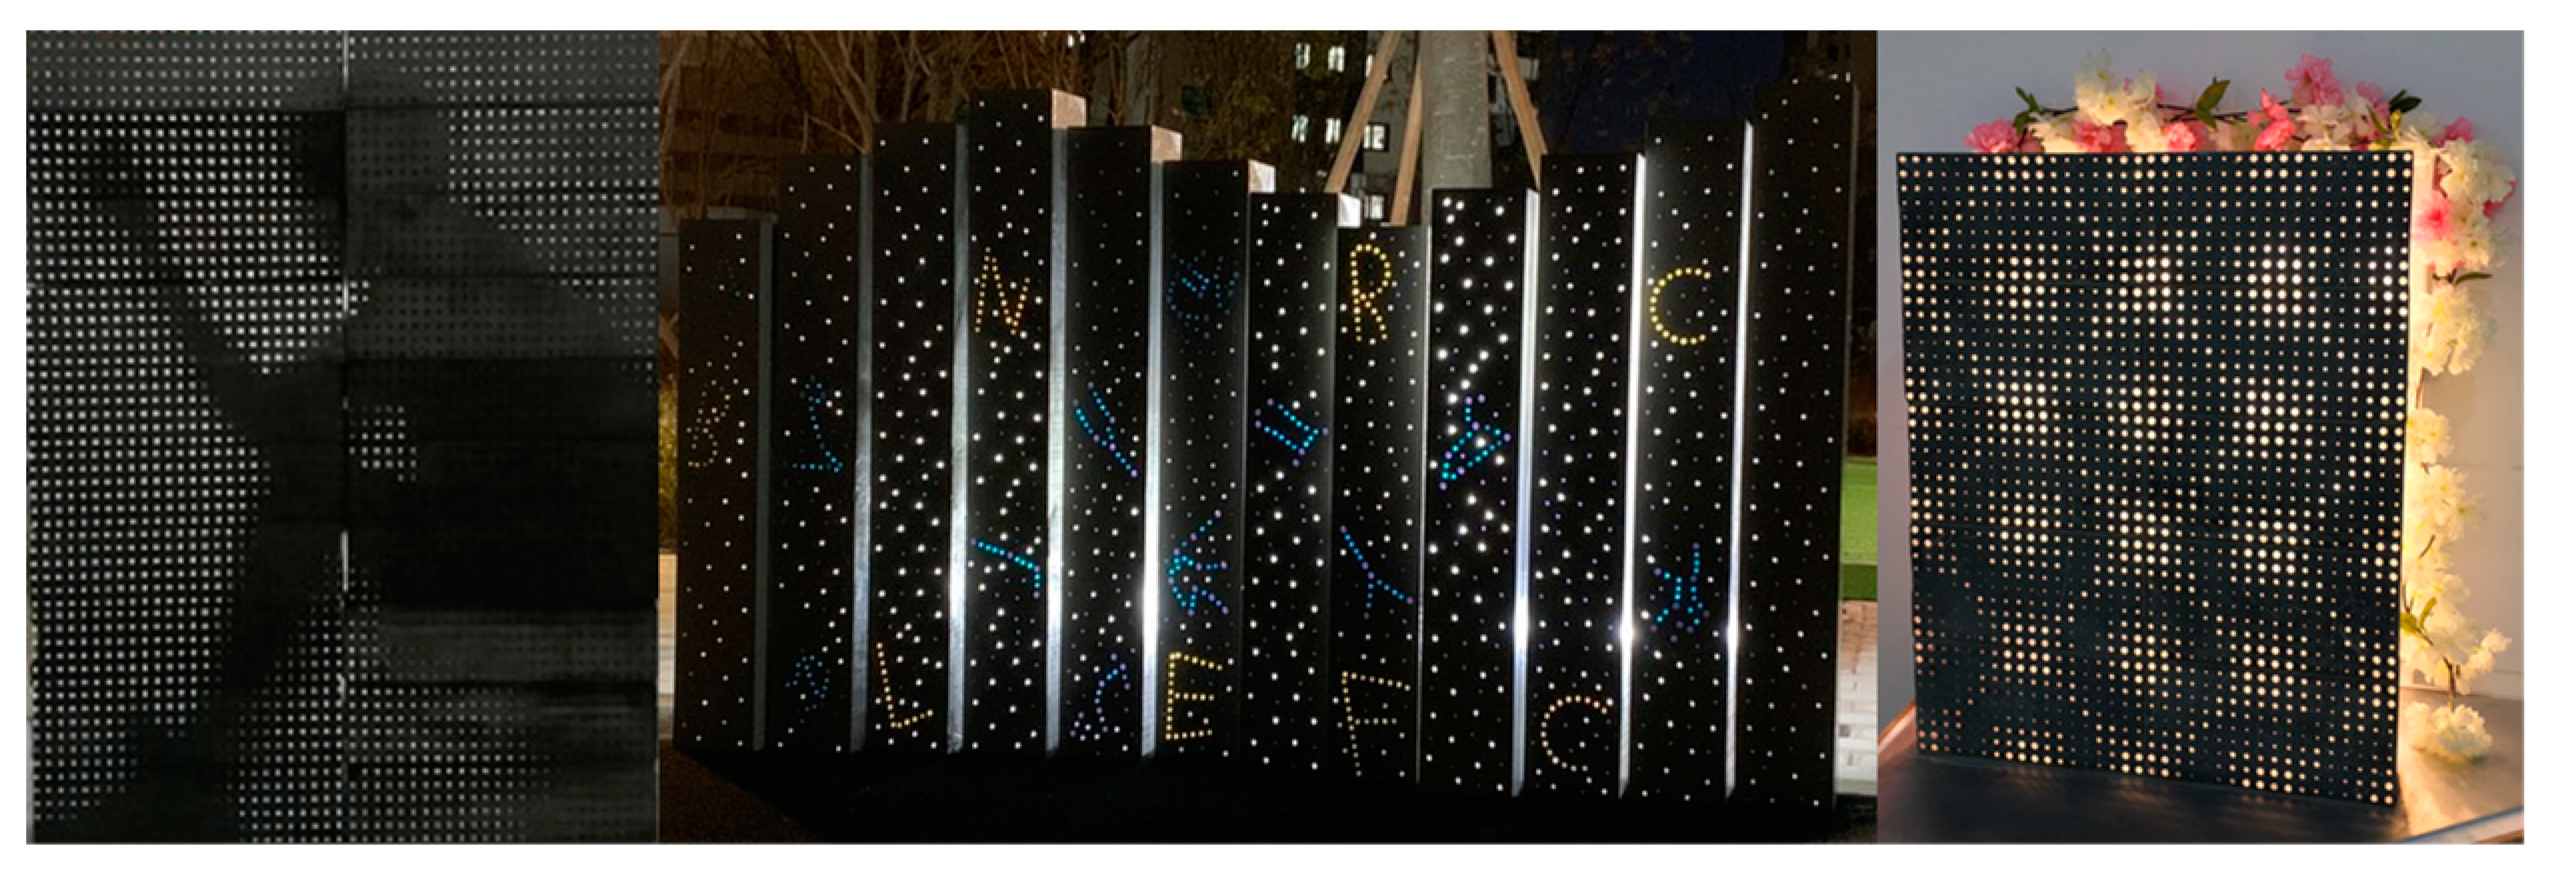
2.1. Procedure of Transparent Plastic Bar Reinforced Concrete
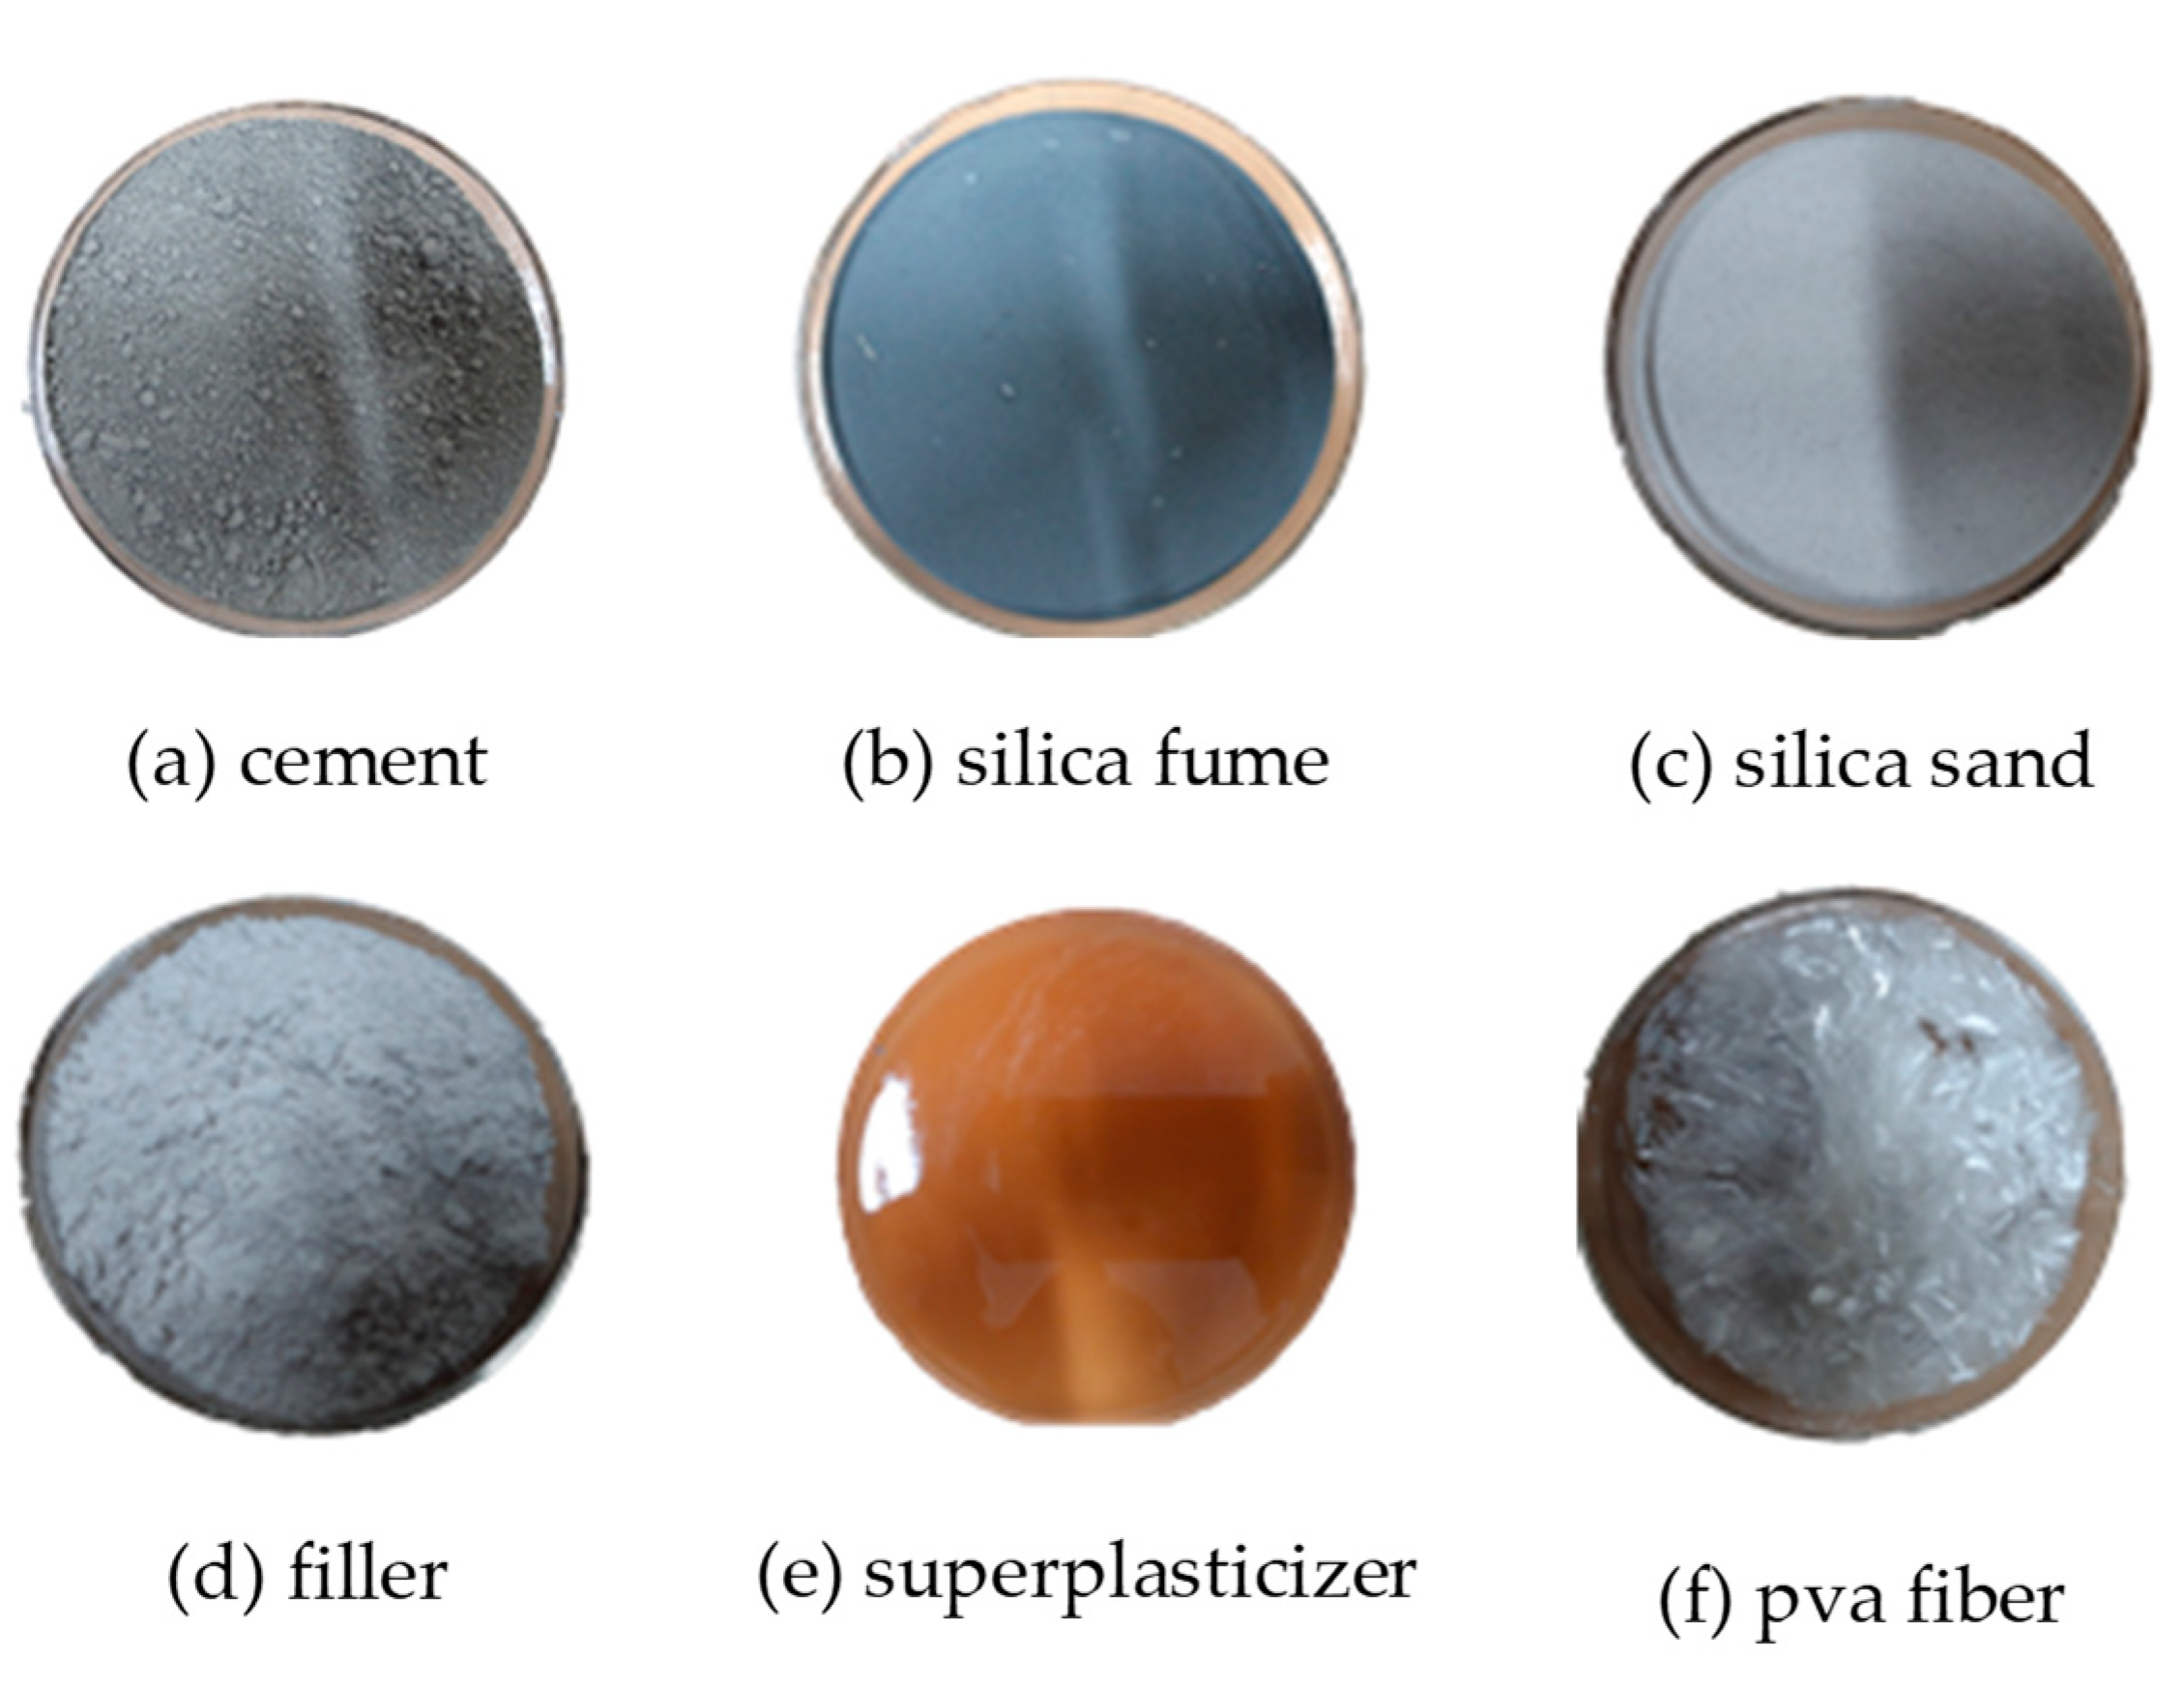
Transparent plastic bar reinforced concrete is produced through the process shown in Figure 1. Arranging hard plastic rods is an easier task than arranging soft optical fibers. Form assembly is completed by attaching plastic rods to the side plates and closing the magnetic plates. Figure 2 shows that it has excellent light transmittance and broad usability with the arrangement of plastic rods. However, as mentioned in the introduction, the strength and durability were significantly reduced. First, strength was reduced due to heterogeneous material properties at the adhesion interface of the plastic and concrete. Second, strength reduction could not be overcome with ordinary concrete materials. Therefore, UHPC was applied to restore the matrix strength of the concrete-transparent plastic bar.

2.2. Materials

UHPC materials (Figure 3) and methods of mixing are diversified, and the K-UHPC material developed by KICT (Korea Institute of Construction Technology) was utilized in this research [23,24]. Silica fume was used from Dongnam with a specific surface area of 200,000 cm3/g and a density of 2.10; due to the high specific surface area, which is about 70 times as large as cement, it affects long-term strength enhancement. Silica sand of ACS Corporation, which contains 99.5% or more SiO2 with an elevation of 100 to 600 μm without the use of coarse aggregate, was used. The high SiO2 component has an advantage in the adhesion between aggregates and paste. The filling material was also a silica-based product with a diameter of 5 to 25 mm. This has a slight reactivity and acts as a filler [24]. Using polycarbonic acid system superplasticizer, excellent dispersion of the particulates and workability were ensured, and consequently, the flowability and self-consolidating performance of concrete were sought [22]. PVA fibers (polyvinyl alcohol fiber) were 0.2% of the concrete volume in the previous study for the purpose of enhancing material separation prevention and durability. Therefore, it was decided that it would not adversely affect flowability or dispersion of materials, and an experiment was conducted by incorporating 0.2% of the concrete volume. Basically, NP-400 photocatalyst has an anatase phase and a similar weight to cement. Metal and non-metallic specimens were prepared for incorporation in NP-400 TiO2 and their properties are as follows in Table 1.

2.3. Test Procedure

The study was conducted in the order shown in Figure 4. First, for the purpose of application of transparent plastic bar reinforced concrete, the optimal mix design was carried out by incorporating NP-400 TiO2 into the UHPC mix. Flowability and self-consolidating performance were verified by performing the slump flow test, J-Ring test, and L-Box test. In addition, the compressive strength and flexural strength test were conducted to observe the variation in the mechanical performance according to the photocatalyst incorporating ratio. Secondly, photocatalyst doping tests were conducted. Microstructural characterization was carried out with an SEM (Scanning electron microscope) and X-ray diffractometer to confirm doping results and phase changes. In addition, using UV/VIS Spectrophotometer, absorbance and band-gap energy data were used to determine whether each doped photocatalyst was available in the visible light area. The air purification performance of the doped photocatalyst specimens in visible light irradiation was tested. Finally, as the parameters and equations of the transparent plastic bar reinforced concrete were arranged, NO removal of visible light-reactive TPBRC was estimated.

2.4. Mixing Design and Test Methods

In previous studies, the UHPC mix for use in transparent plastic bar reinforced concrete was determined to be 30% w/c and utilized excellent flowability. Thus, in this study, 30% w/c mix proportion was conducted by replacing the TiO2 photocatalyst with a weight ratio of 0 to 5% as shown in Table 2. The flowability of concrete was confirmed according to ASTM C 1611/C1611M [25]. J-Ring passing ability was measured in accordance with ASTM C1621/C1621M [26] and its measurement criteria are as follows in Table 3. The L-Box passing ability was measured in accordance with BS EN 12350-10:2010 [27]. The compressive strength test was conducted in accordance with KS F 2405:2010 [28]. The flexural strength test was measured according to KS F 2408:2016 [29].

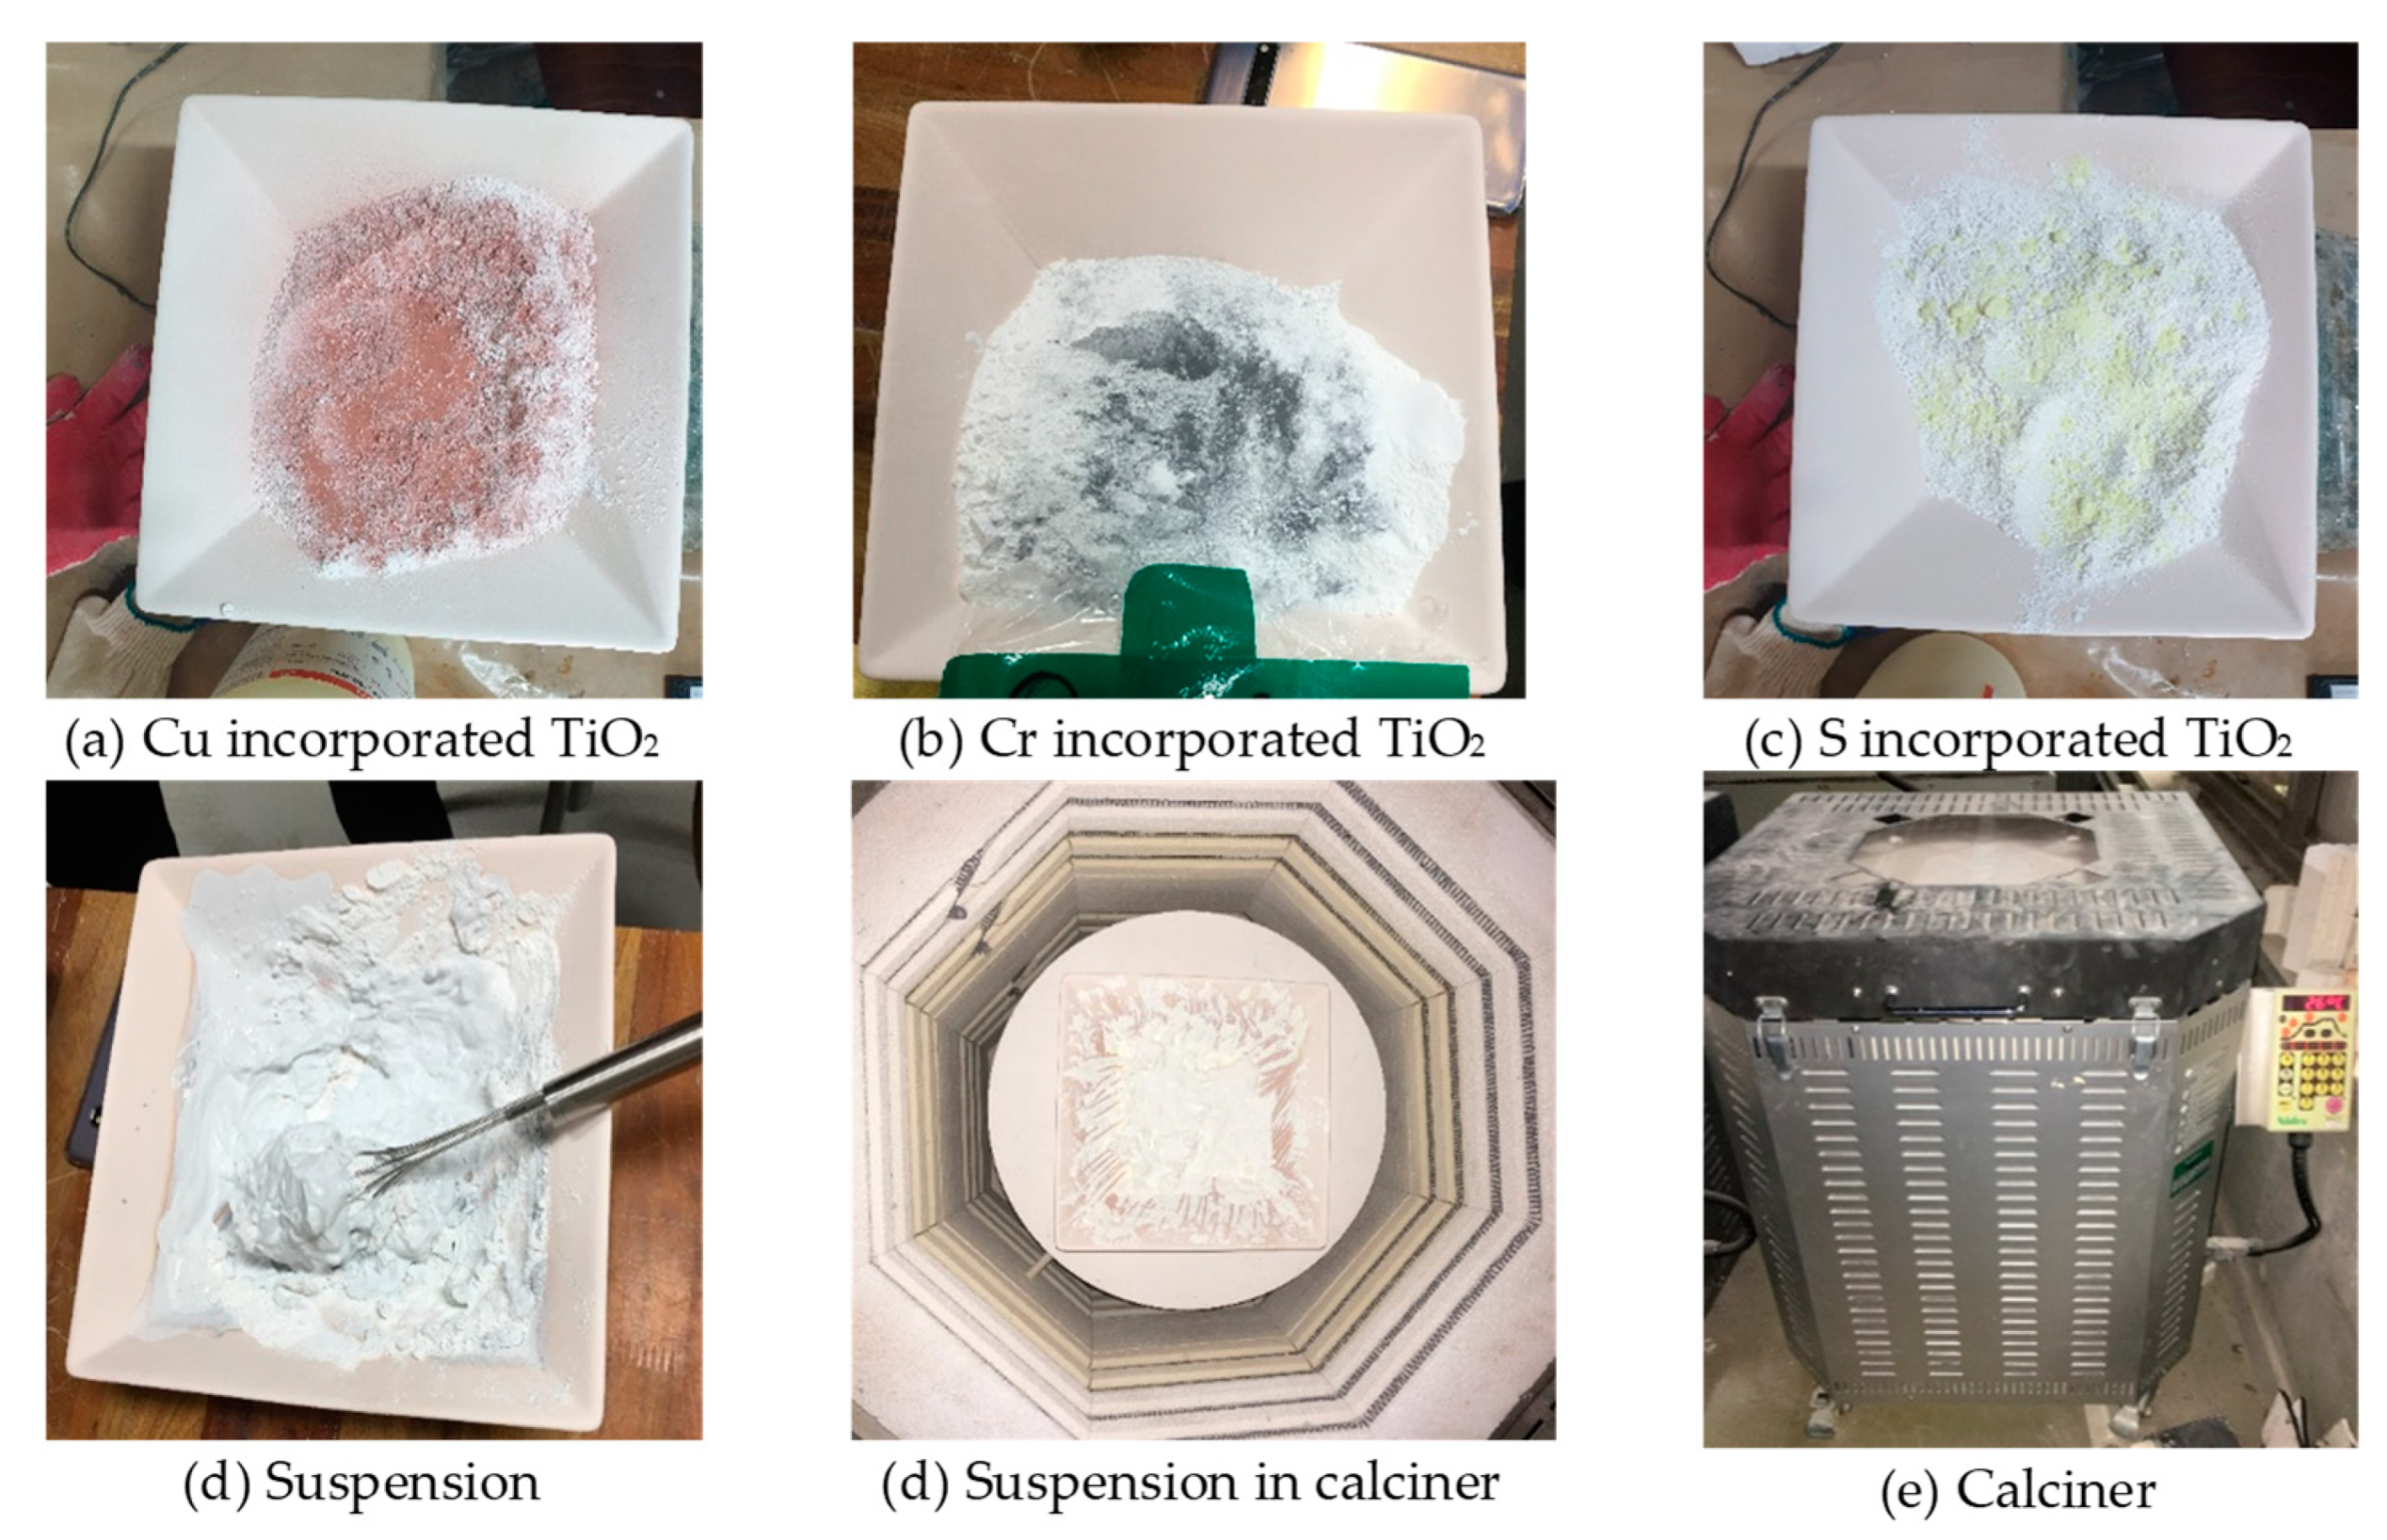
2.5. Doping TiO2 Photocatalyst

As shown in Figure 5a–c, each doping material was incorporated into TiO2. TiO2, doping materials (Cu, Cr, S), and distilled water were prepared as a weight ratio of 1:0.05:1. Then, it was stirred for five minutes to make the suspension and calcinated at 1000 °C for 24 h. After cooling for 24 h, the specimens were taken out of the calciner. The specimens were crushed into an iron mortar and then sieved with 75 μm as shown in Figure 5. X-ray diffraction (XRD) patterns were obtained using a Bruker D8 Advance X-ray diffractometer. The absorption spectra of specimens at 200 to 700 nm were measured using JASCO V-570 UV/VIS spectroscopy.

2.6. Photocatalytic NO Removal Performance Test

The doped TiO2-incorporated concrete specimen was placed in a 50 mm × 100 mm × 5 mm mold according to the ISO 17168-1—a test method for air purification performance of semiconducting photocatalytic materials under indoor lighting environments [30]. The chamber was configured to continuously supply the test gas, and the gas flow rate was adjusted to be 3.0 L/min. Pretreatment was performed as specified in the standard, and a nitrogen oxide removal test was conducted for 5 h.

3. Experimental Results

3.1. Optimum Mix Design Results

The results of the slump flow test confirmed a decrease in the level of the slump flow as the photocatalyst incorporation rate increased, as shown in Figure 6 and Table 4. This is believed to be due to the fineness of the photocatalyst and the small diameter, which reduced the micro-pore in the concrete and rolled as a filler. The J-Ring test (Figure 7 and Table 4) indicates that there was no problem with material dispersion, as it was considered that the J-Ring test had a good passing ability of no more than 25 mm in all specimens. The L-Box test (Figure 7 and Table 4) found that P-0 to P-4 showed a passing ability of no less than 0.8 but that P-5 had a passing ability of 0.57. This was considered to be a temporary phenomenon due to the high viscosity of concrete due to longer experimental times, and it was evaluated that it had excellent self-consolidation performance, such as the slump flow test and J-Ring test results. The results of the compressive strength test (Figure 8) confirmed that the compressive strength exceeds 100 MPa at the TiO2 incorporation rate of 0 to 5%. The compressive strength was also shown to increase slightly with the increase in TiO2 incorporation rate. It is suggested that this is because a photocatalyst with a 30 nm nanoparticle charged the micro-pore of concrete [24]. Flexural strength test results (Figure 8) show that the values are 7.0 to 8.4 MPa. It is considered that the photocatalyst incorporation did not significantly affect the flexural performance.

3.2. Doping TiO2 Photocatalyst Results

Calcination changed to TiO2 with mass, as shown in Figure 9a. As demonstrated in Figure 9b,c, the specimens were ground to 75 micrometers and 30 nm particles with an attrition mill. The microstructural characterization of doped TiO2 specimens was carried out via SEM. Figure 10 and Figure 11 show the SEM images and EDS (Energy dispersive spectroscopy) spectrum of the doped TiO2 specimens. As shown in Figure 10, the Cu-doped TiO2 sample appears to be the most homogeneous, followed by Cr-doped TiO2, then the S-doped TiO2 sample. It is confirmed that the Cu-doped TiO2 sample has a relatively good dispersibility of nanoparticles in Figure 10a. According to the EDS spectrum in Figure 11, it was found that the S-doped TiO2 sample had little sulfur content. As a result of the X-ray diffraction, TiO2 has not gone through any process and has been identified to represent the anatase peak as shown in Figure 12. An anatase peak and Cu peak were found in Cu-doped TiO2 specimens. On the other hand, the Cr-doped TiO2 and S-doped TiO2 specimens were composed of two types, an anatase peak and a rutile peak, and a Cr peak and S peak appeared. It was confirmed that TiO2 can be doped by a simple process for calcination at 1000 °C for 24 h. Figure 13 shows the UV-visible absorption spectrum and Figure 14 shows the energy band gap of TiO2 specimens by Tauc plot. Since Figure 13d is a non-doped anatase type TiO2, it was confirmed that the absorption rapidly decreased from 350 to 380 nm. Figure 13a–c all show an increase in absorbance compared to Figure 13d. Figure 13a has confirmed that Cu-doped TiO2 has strong absorption bands up to 700 nm. It was also confirmed that in Figure 14a, inherent band gaps of TiO2 were reduced from 3.3 to 2.8 eV. Cr-doped TiO2 confirmed a rise in absorbance at Figure 14b and a decrease in band gaps from 3.3 to 3.0 eV at Figure 14b. From 400 nm, the absorbance tended to gradually decrease, indicating a somewhat lower absorbance of 0.2. S-doped TiO2 showed somewhat minor visible light reactivity compared to other specimens in Figure 13c. As shown in Figure 14c, the bandgap was not much improved as 3.2 eV. Accordingly, it is expected that utilizing Cu in transparent bar reinforced concrete production in the future will improve indoor air quality due to its excellent visible light absorption performance.

3.3. Results of Photocatlaytic NO Removal Removal Test

A photocatalytic NO removal test was conducted with each doped TiO2 concrete specimen of 50 mm × 100 mm × 10 mm, as shown in Figure 15b. It was found that 15.8% of the total amount of NO was reduced by Cu-doped TiO2 specimen during 5 h of 455 nm blue LED visible light irradiation by removing 6.4 μmol out of 40.2 μmol supplied. For Cr-doped TiO2 and S-doped TiO2 specimens, 1% of the total amount of NO was reduced by removing 0.4–0.5 μmol. It was confirmed that the OPC (non-incorporated TiO2) specimen could hardly remove NO. This shows the Cu-doped TiO2 specimen has some apparent photocatalytic NO removal performance compared to that of Cr- and S-doped TiO2 specimens. The Cu-doped TiO2 test result is judged to be an active photocatalytic reaction from homogeneity of microstructure and well dispersed nanoparticles in the reaction surface (Figure 10) showing a well composed anatase phase and Cu peak (Figure 12). In Figure 13 and Figure 14, doping of Cu, Cr, and S contributed to reducing the difference between the conduction and valence bands of titanium dioxide. In particular, as the band gap energy of the Cu sample showed a large decrease, it was judged that it showed excellent NO removal performance in visible light irradiation.

4. Discussion

4.1. Photocatlaytic Reaction Mechanism of Transparent Plastic Bar Reinforced Concrete

According to Figure 16, ordinary photocatalytic concrete can only experience the decontamination effect of photocatalysts on the incident side (Si) of light. On the other hand, in the case of transparent plastic bar reinforced concrete, light can be transmitted through plastic bars so that light can be transmitted to the other side to maximize the photocatalyst reaction area [20]. The parameters and equations related to this are organized as shown in Figure 17 and Equations (1) and (2) below. The spacing of plastic bars is called Ii and the diameter is denoted by Di. The length of the concrete block incident cross section is L and the height is H. The number of bars according to the diameter of the bars was called NDi, and the photocatalyst reaction area was indicated as Pa. Since the plastics used in this study are PMMA (Poly methyl methacrylate) acrylics and generally have a light transmittance of 92%, the light transmittance of plastic bars, Tacrylic, applied 0.92 [31,32]. Taking 100 mm × 300 mm concrete blocks as an example, as shown in Figure 18, the ordinary photocatalytic concrete can undergo photocatalyst reaction in all areas of the incident side, resulting in a 100% Pa, but the transparent plastic bar reinforced concrete is inserted with 50EA 10 mm bars, accounting for 13% of the concrete cross section, reducing Pa to 87%. However, light can reach the transmission side (St), indicating that 87% of the incident surface and 80% of the transmission surface have a total of 160% or more Pa when Equation (1) is applied. Transparent plastic bar reinforced concrete will be able to exert photocatalyst efficiency beyond ordinary photocatalytic concrete by the presence of light transmittance, which will be a good example of utilizing light diffusion indoors in a positive direction.
P i n c i d e n t a = L × H N D i π ( D i 2 ) 2 L × H × 100
P t r a n s m i s s i o n a = L × H N D i π ( D i 2 ) 2 L × H × 100 × T _ a c r y l i c

4.2. Estimation of Efficiency of Visible Light Response Photocatalytic Transparent Bar Reinforced Concrete

As a result of the NO removal test of the Cu-doped TiO2-incorporated concrete specimen in Figure 15b, 15.8% of NO was removed. In comparison, in the case of the existing reference that manufactures cement test specimens based on P25 photocatalyst, materials such as solvent toluene and oleylamine are required, as well as a complicated manufacturing process. Since the photocatalytic cement has a similar ability to remove nitrogen oxides under visible light irradiation (approximately 15%) as the photocatalytic concrete in this study, it can be judged that the utilization of visible light photocatalytic concrete produced by an economical and simple method in this study is high [33]. Based on this, Figure 18 shows the effect of increasing the photocatalytic reaction area that occurs when 50 transparent plastic bars with a diameter of 10 mm are penetrated into a concrete block with a size of 100 mm × 300 mm. As described in Section 4.1, the 100 mm × 300 mm concrete block has a photocatalytic reaction area of 160%, so it is inferred that about 25.3% of NO can be removed. As a result of the NO removal test of the Cr-doped TiO2 and S-doped TiO2 concrete specimen, 1% of NO was removed. When plastic bars are penetrated into a concrete block having the same size as above, it is inferred that these specimens can remove about 1.6% of NO. It is considered that it is necessary to prove the theoretical value by conducting an NO removal test on the transparent plastic bar reinforced concrete specimen applied with a doped TiO2 photocatalyst in the future.

5. Conclusions

In this study, in order to increase the NOx removal efficiency from visible light, Cu, Cr, and S were mixed with NP-400 TiO2 for ultraviolet reaction, then calcined and powdered, and through the NO removal rate test, the possibility of utilizing the visible photocatalyst of TPBRC was analyzed and evaluated.
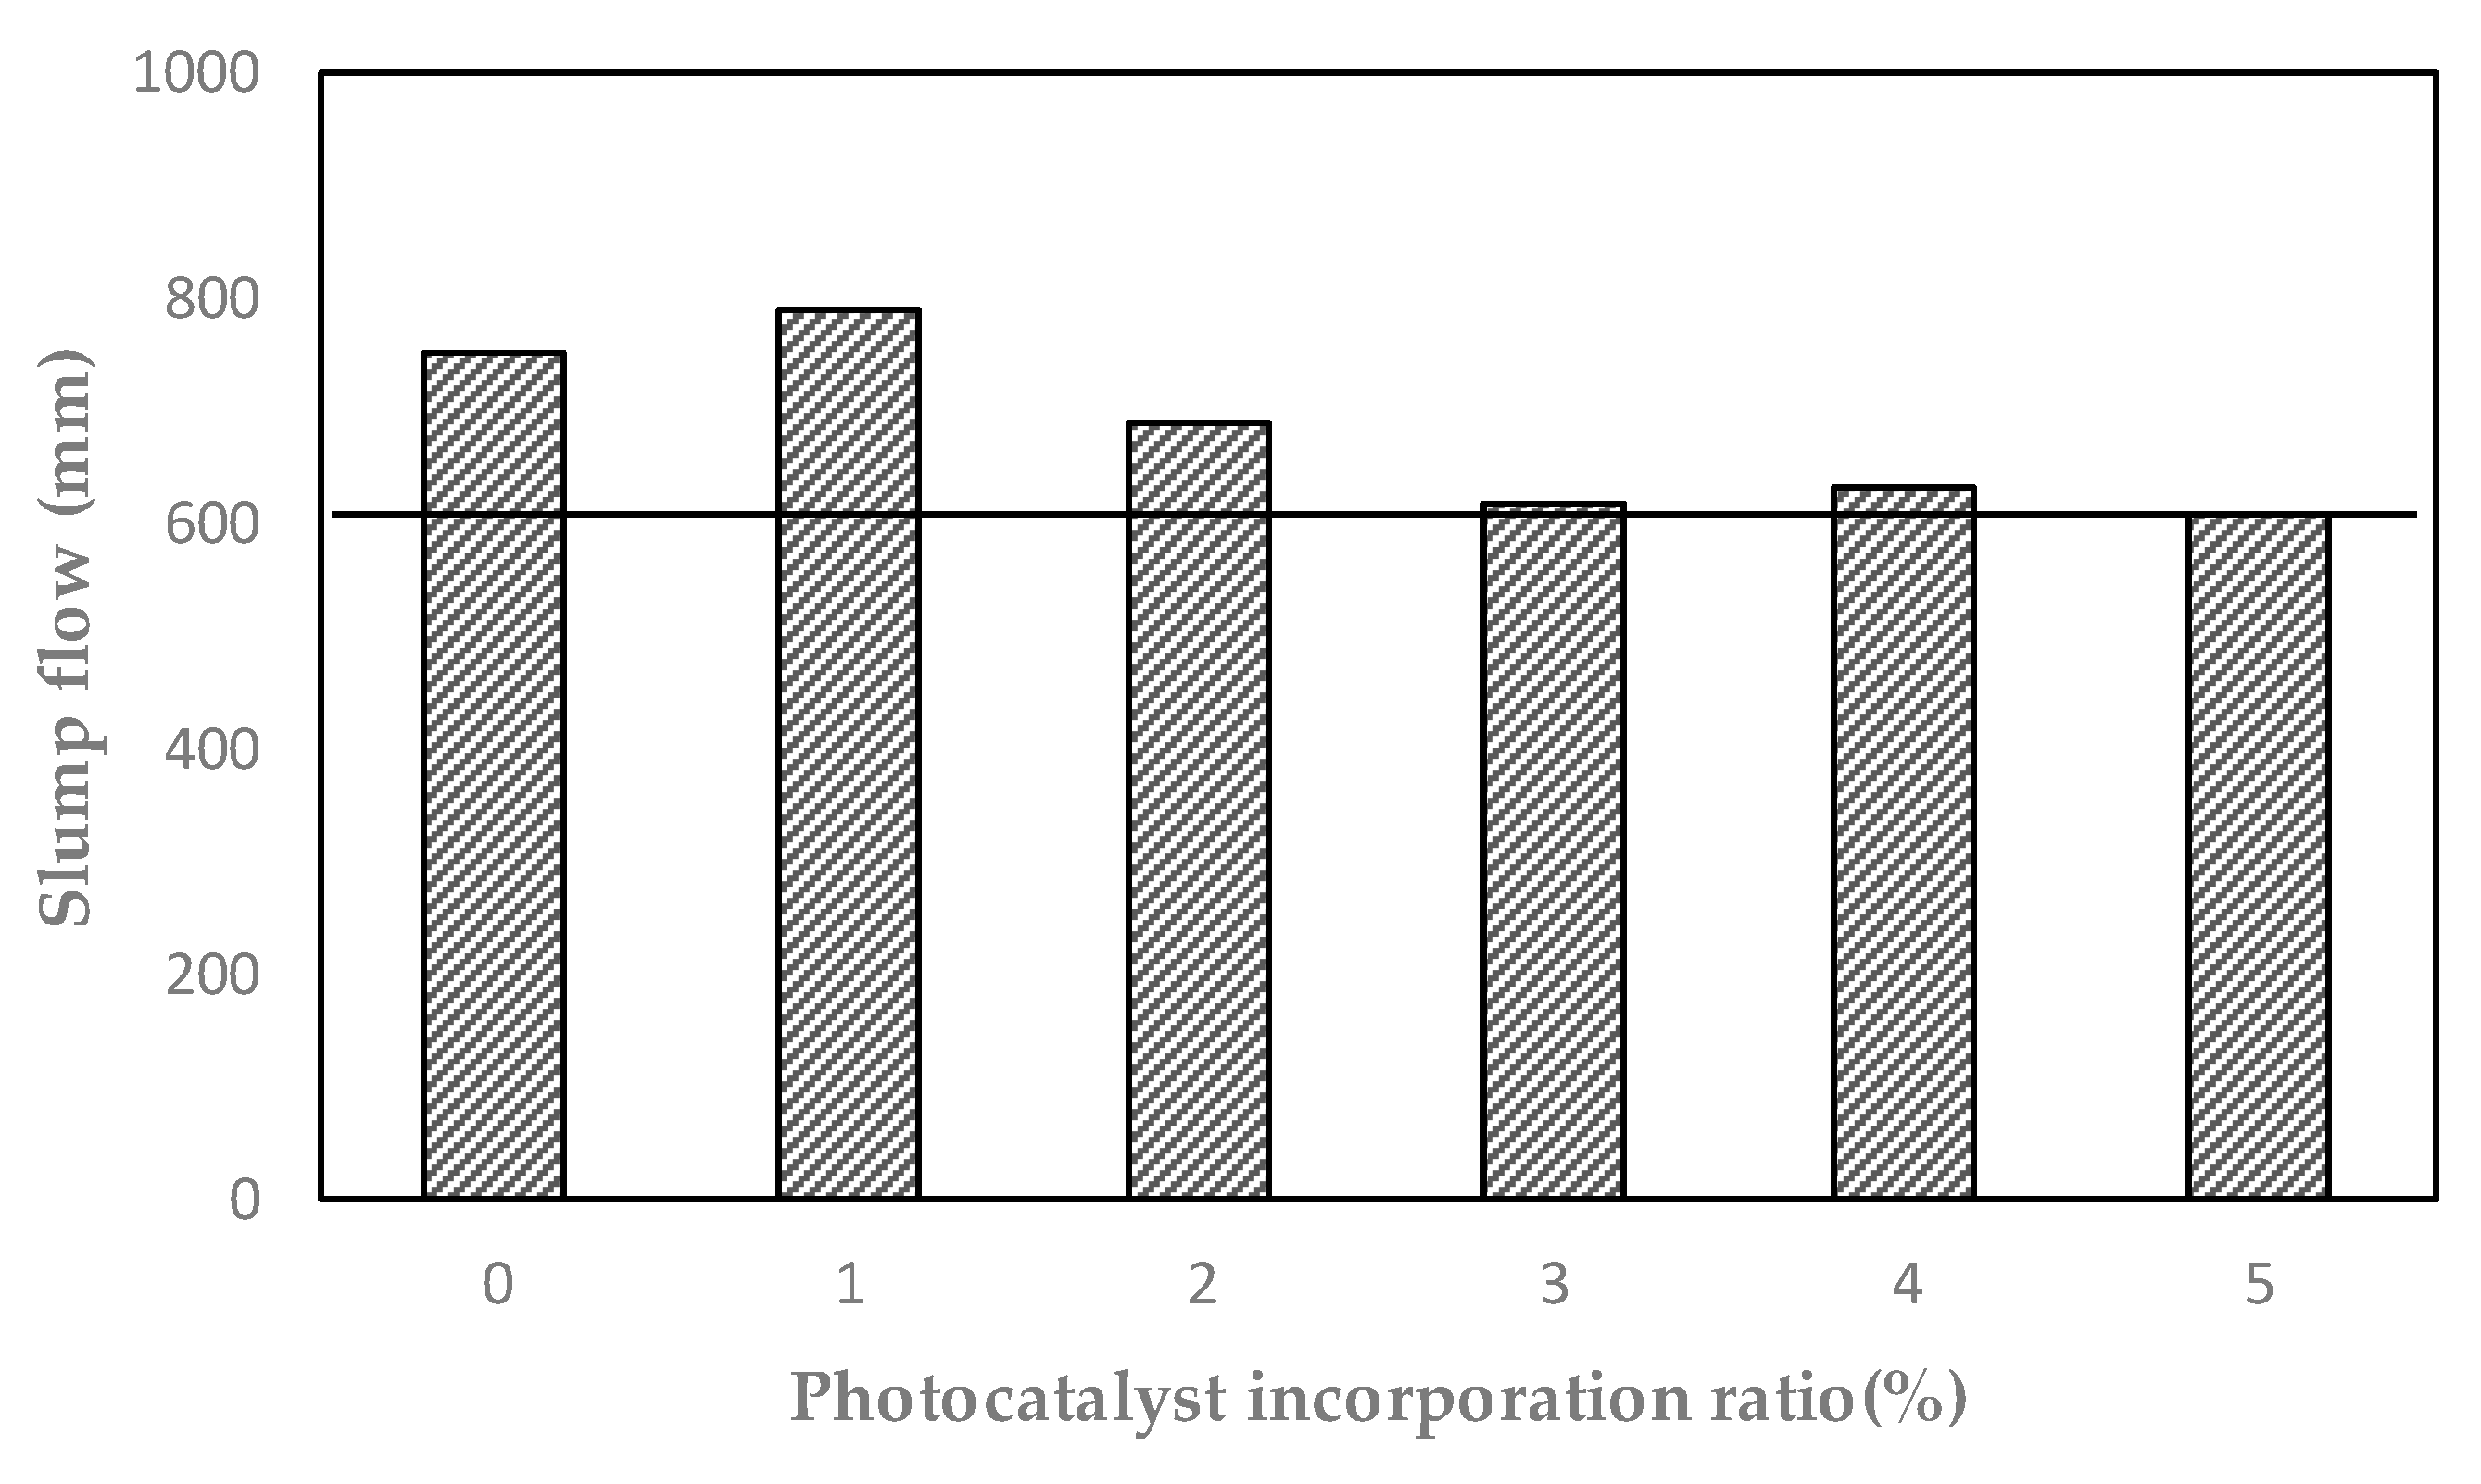
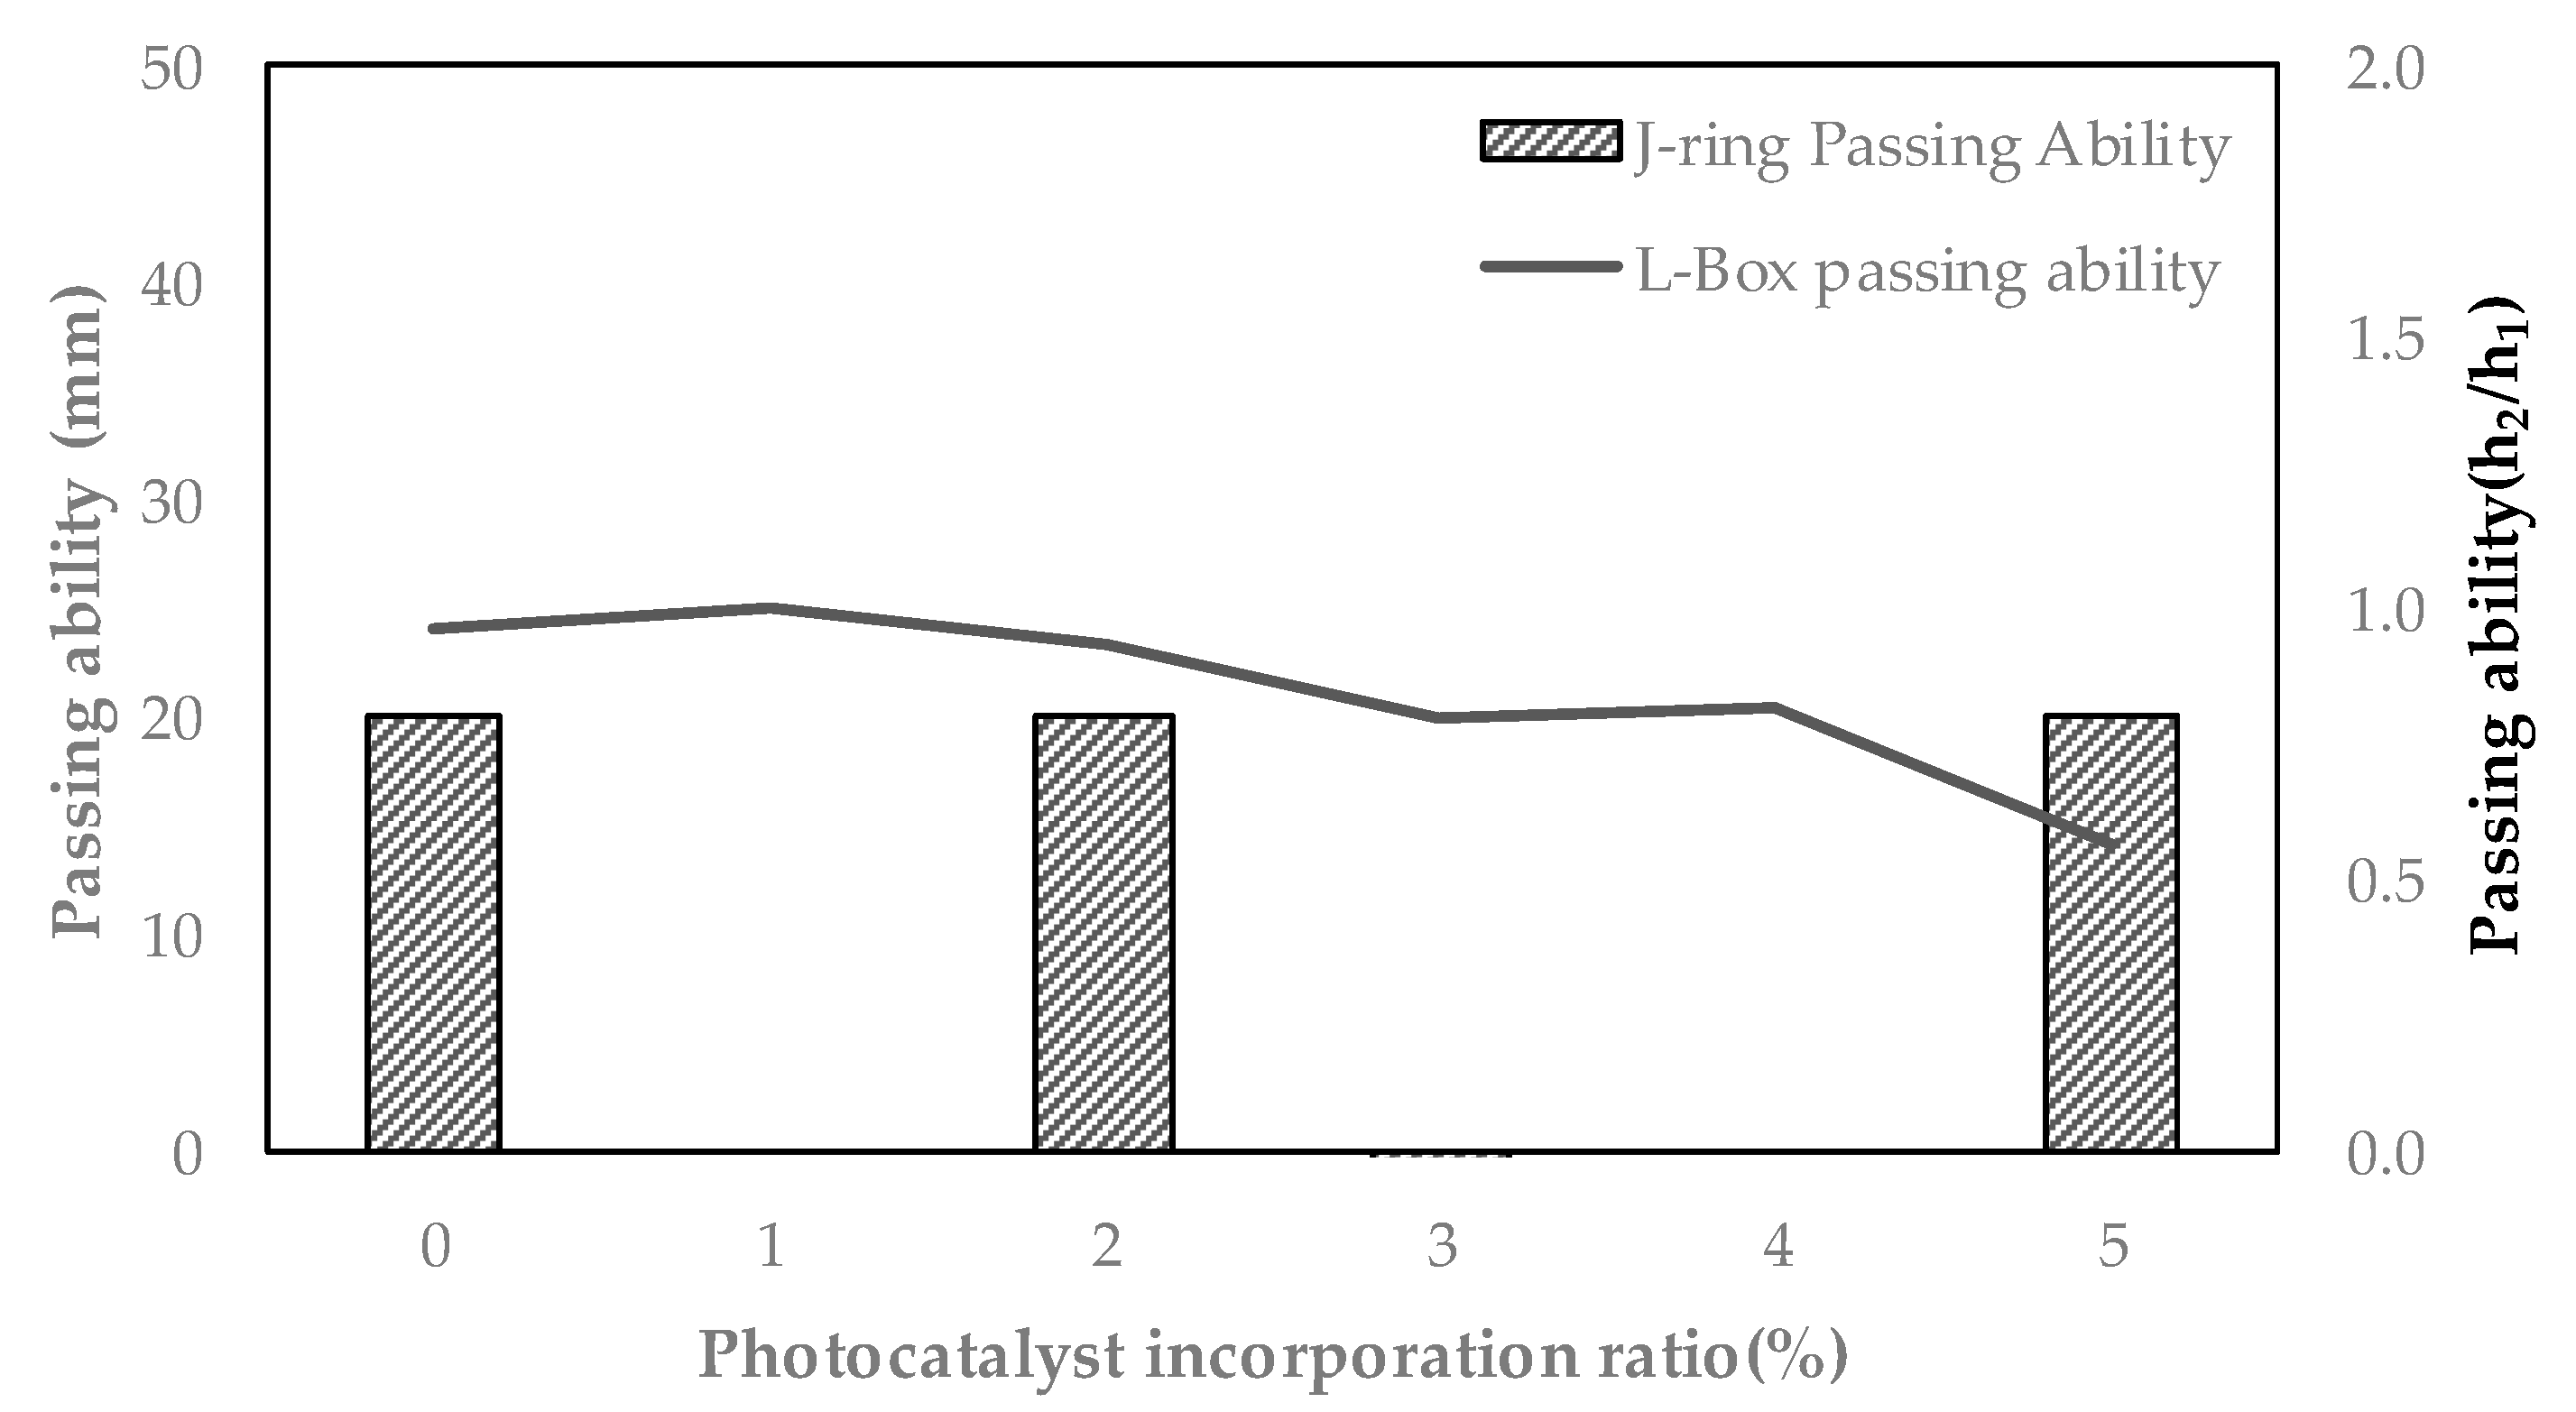
  • As the photocatalyst mixing rate increased, the slump flow of UHPC gradually decreased. It is believed that an increase in the amount of mixed photocatalyst fineness induces a decrease in slump flow. As a result of the J-Ring test, all test specimens showed a pass rate of less than 25 mm, and the L-Box test had a pass rate of 0.8 or higher, so it was judged that good material dispersion during the pouring process was possible.
  • Compressive strength is 100 MPa or more, and the flexural test has confirmed the test results of 7.0 to 8.4 MPa, and it is judged that there will be no major difficulties in manufacturing interior and exterior materials in the future.
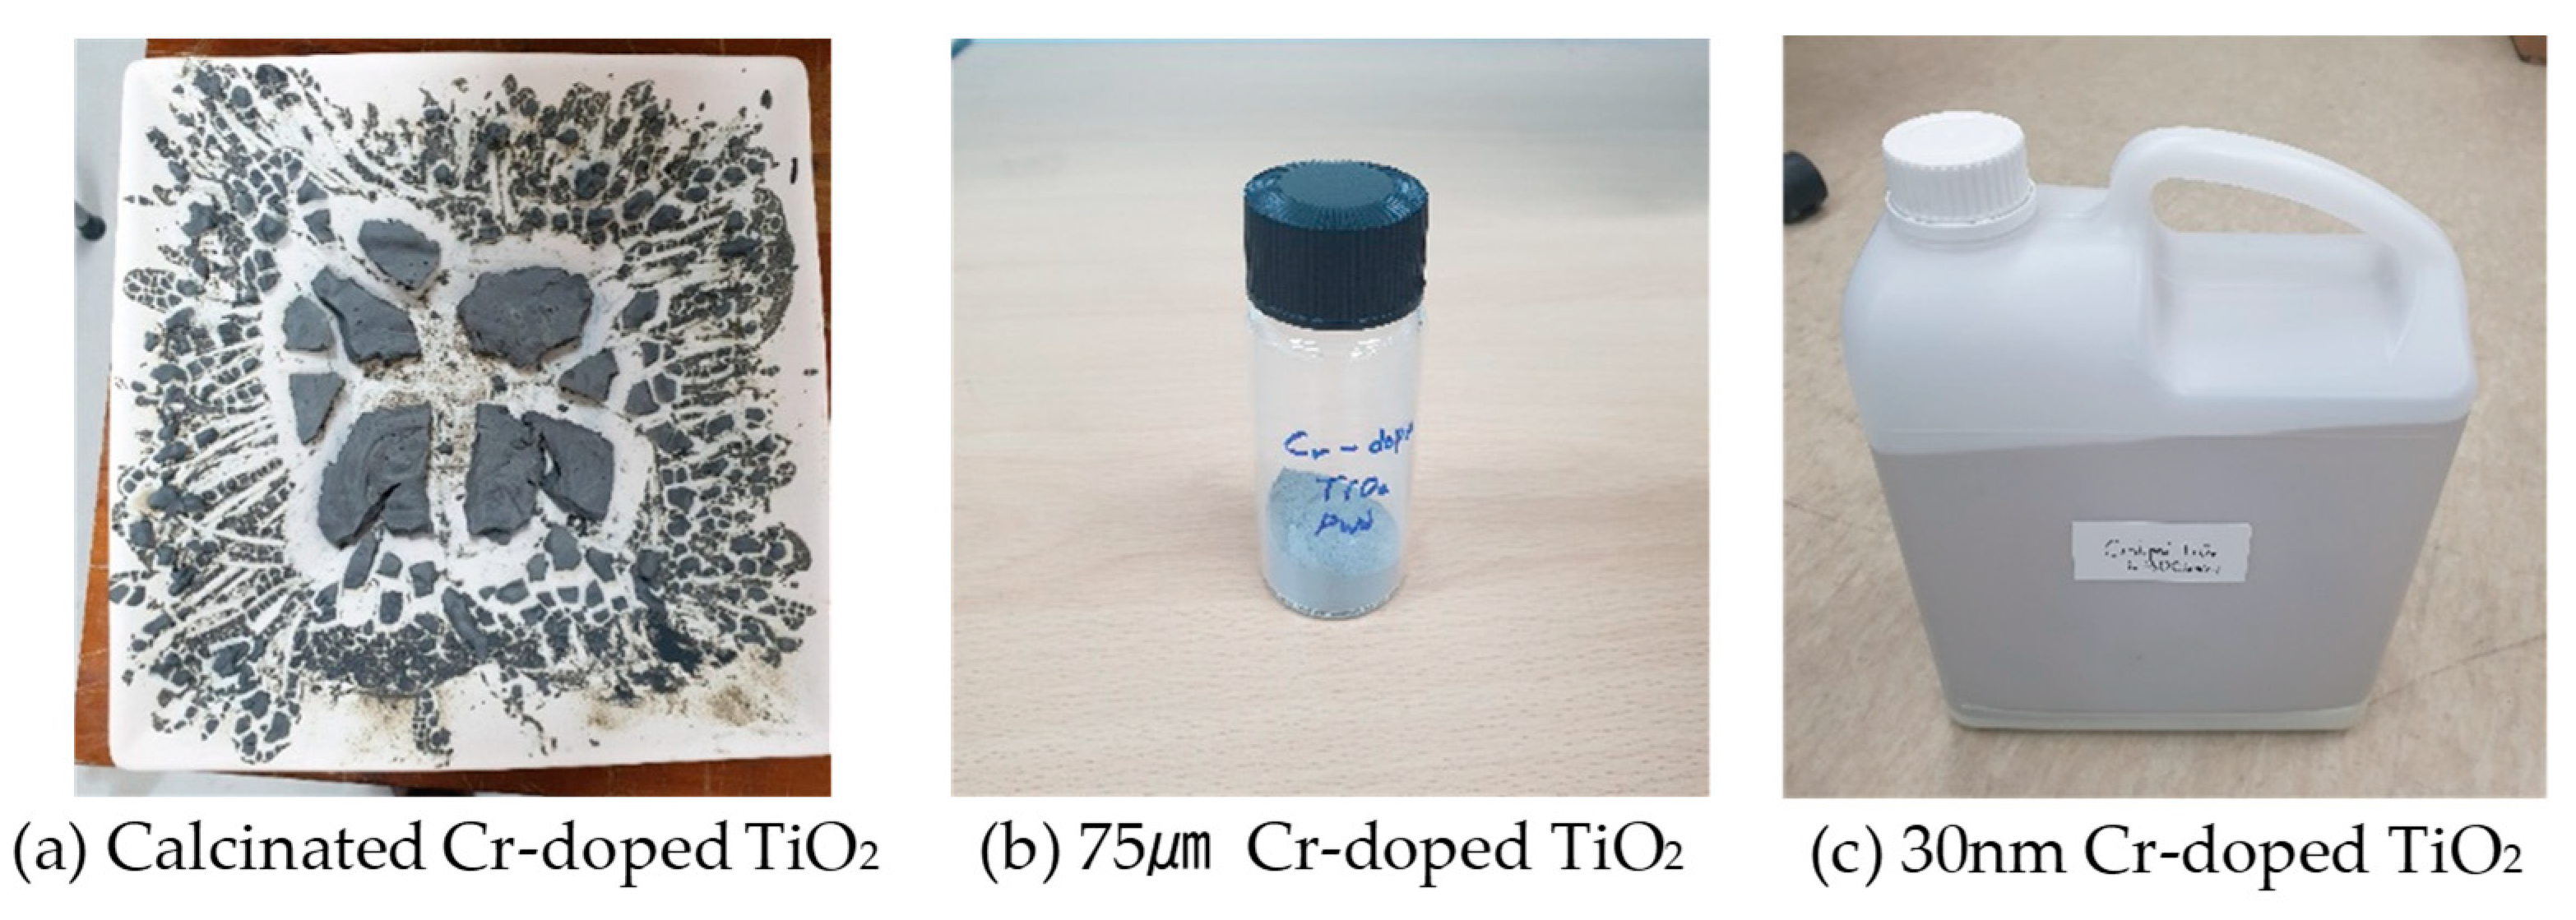
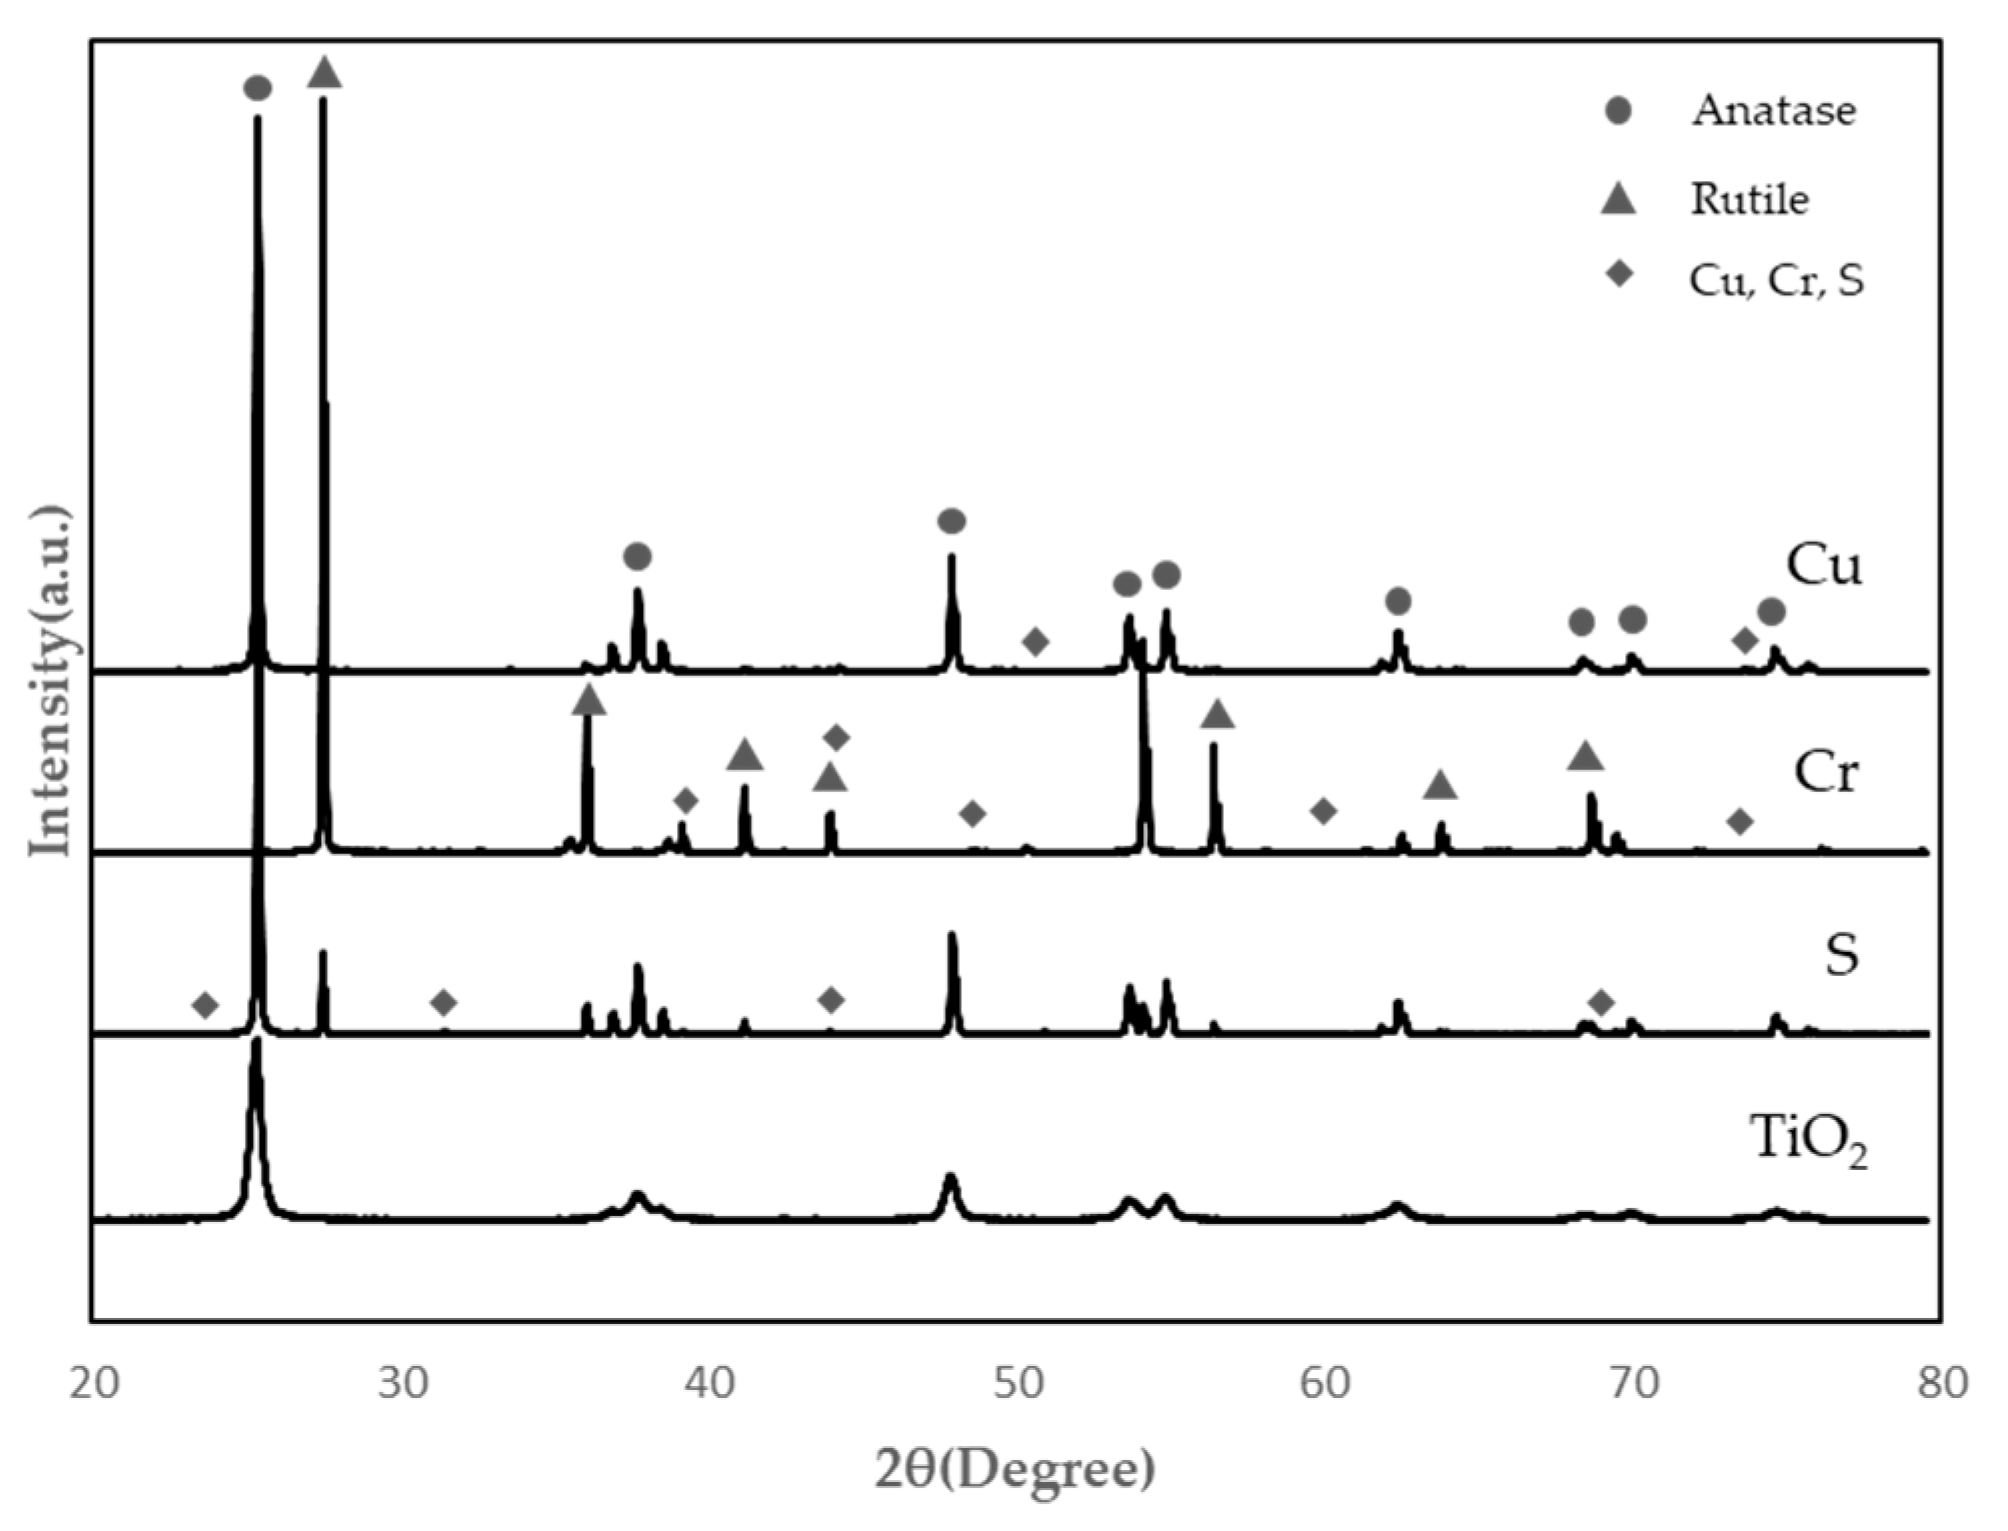
  • SEM and EDS analysis of TiO2 in powder form after calcination at 1000 °C for 24 h showed that TiO2 doped with Cu had the best microstructure and EDS peak value. In addition, as a result of the XRD test, anatase peaks were confirmed for Cu, Cr, and S.
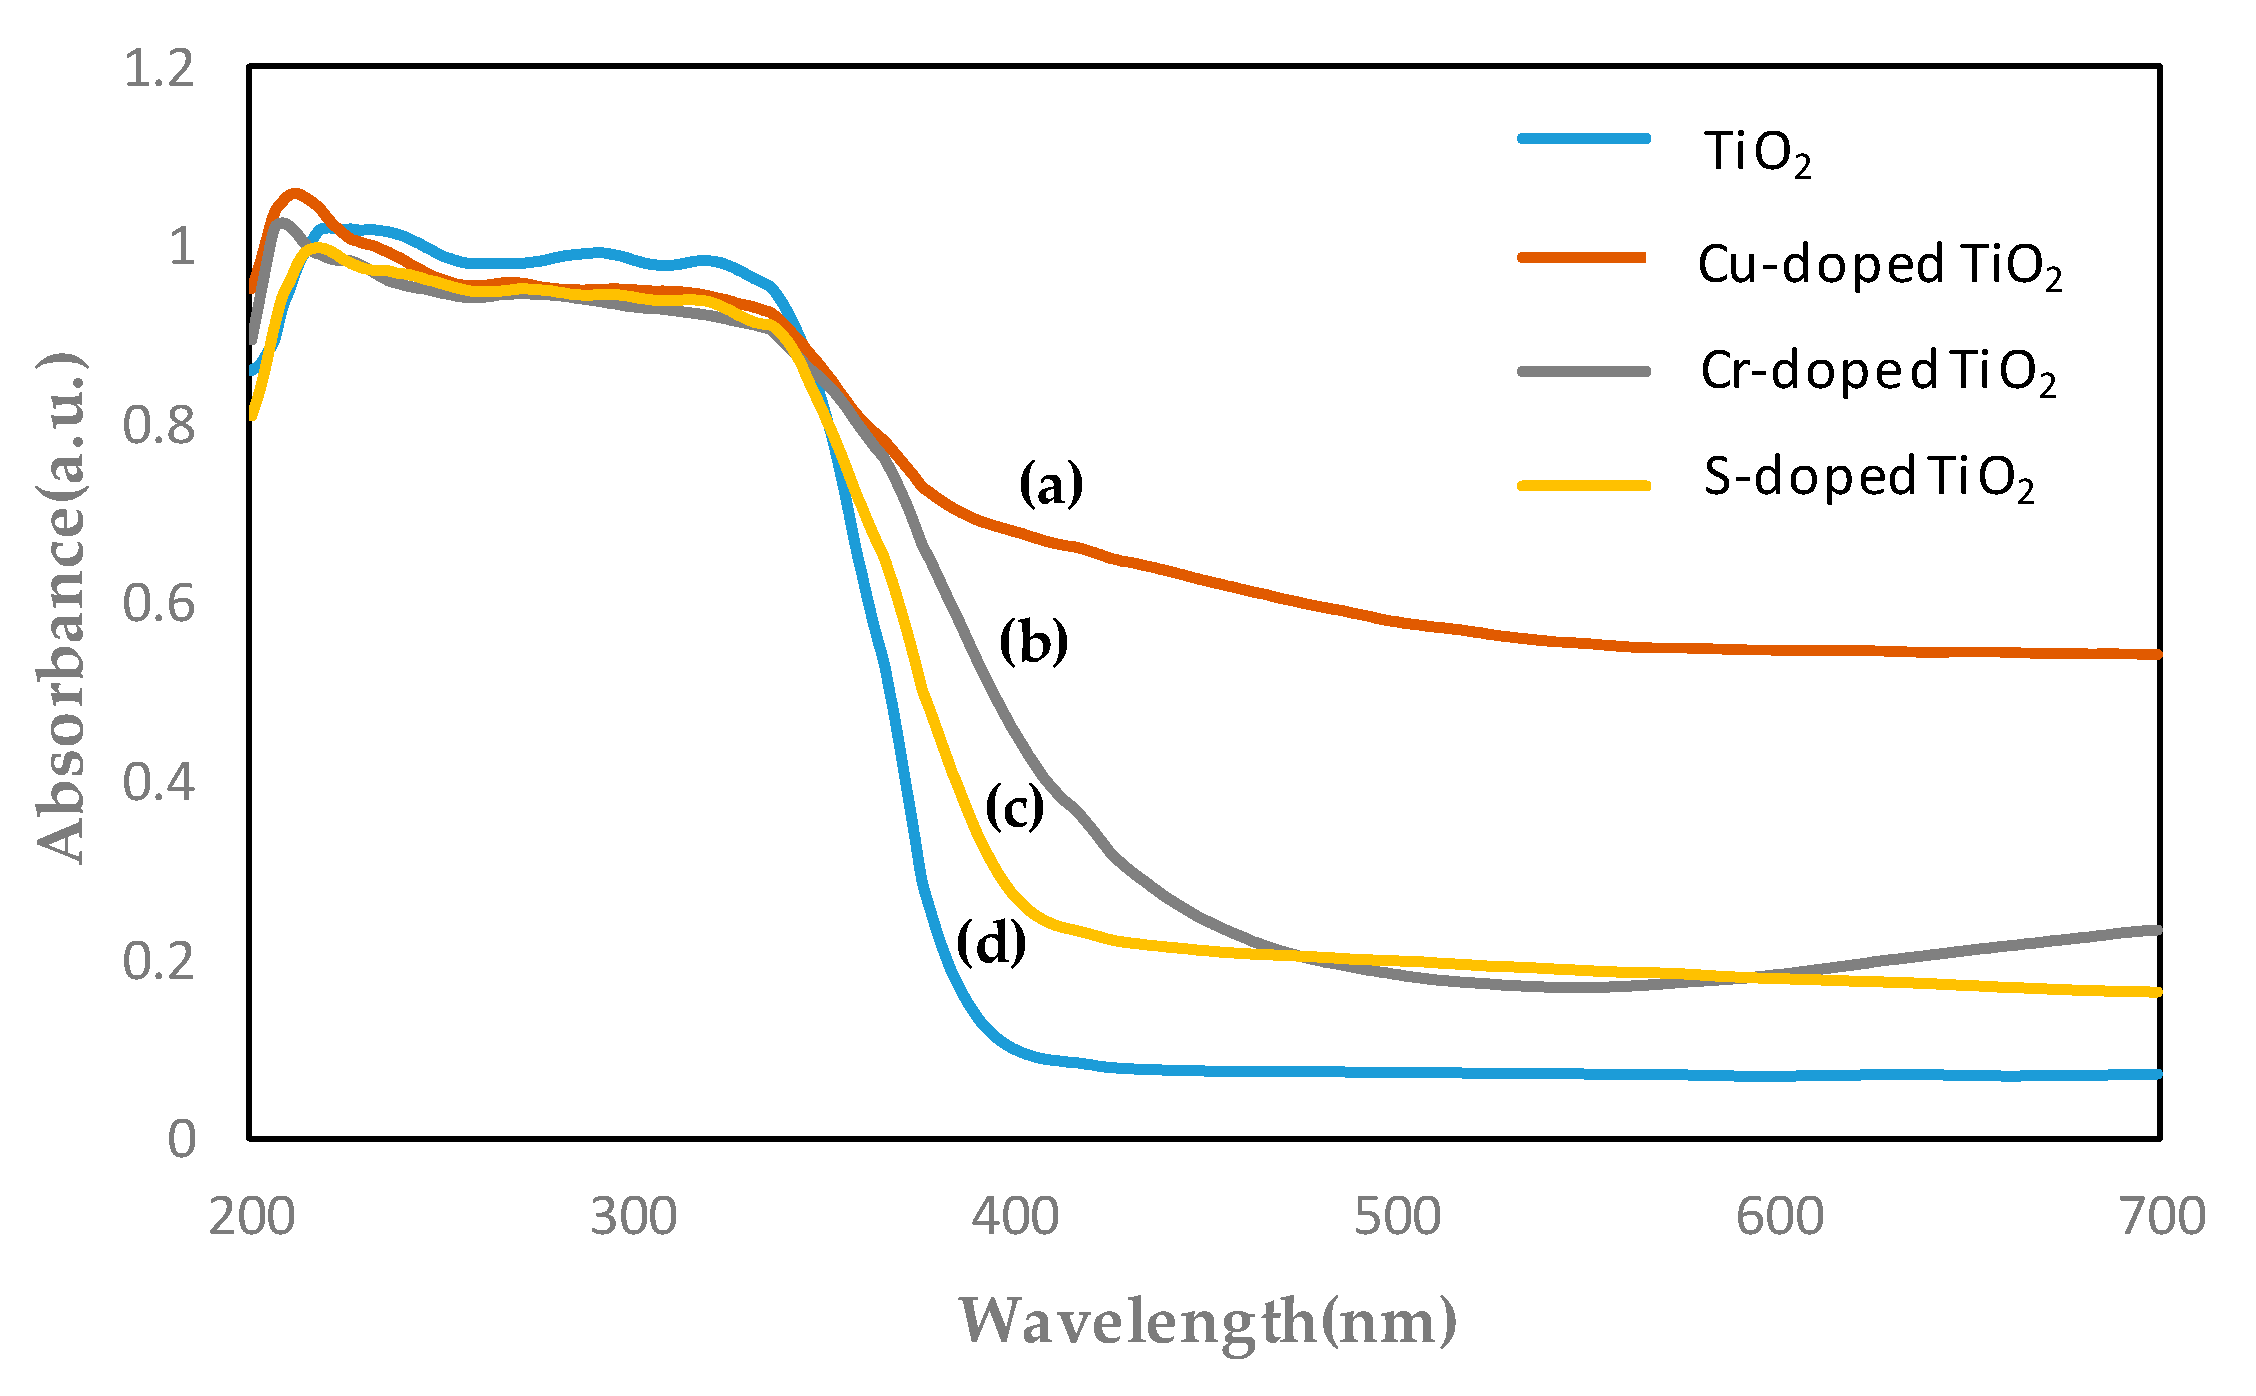
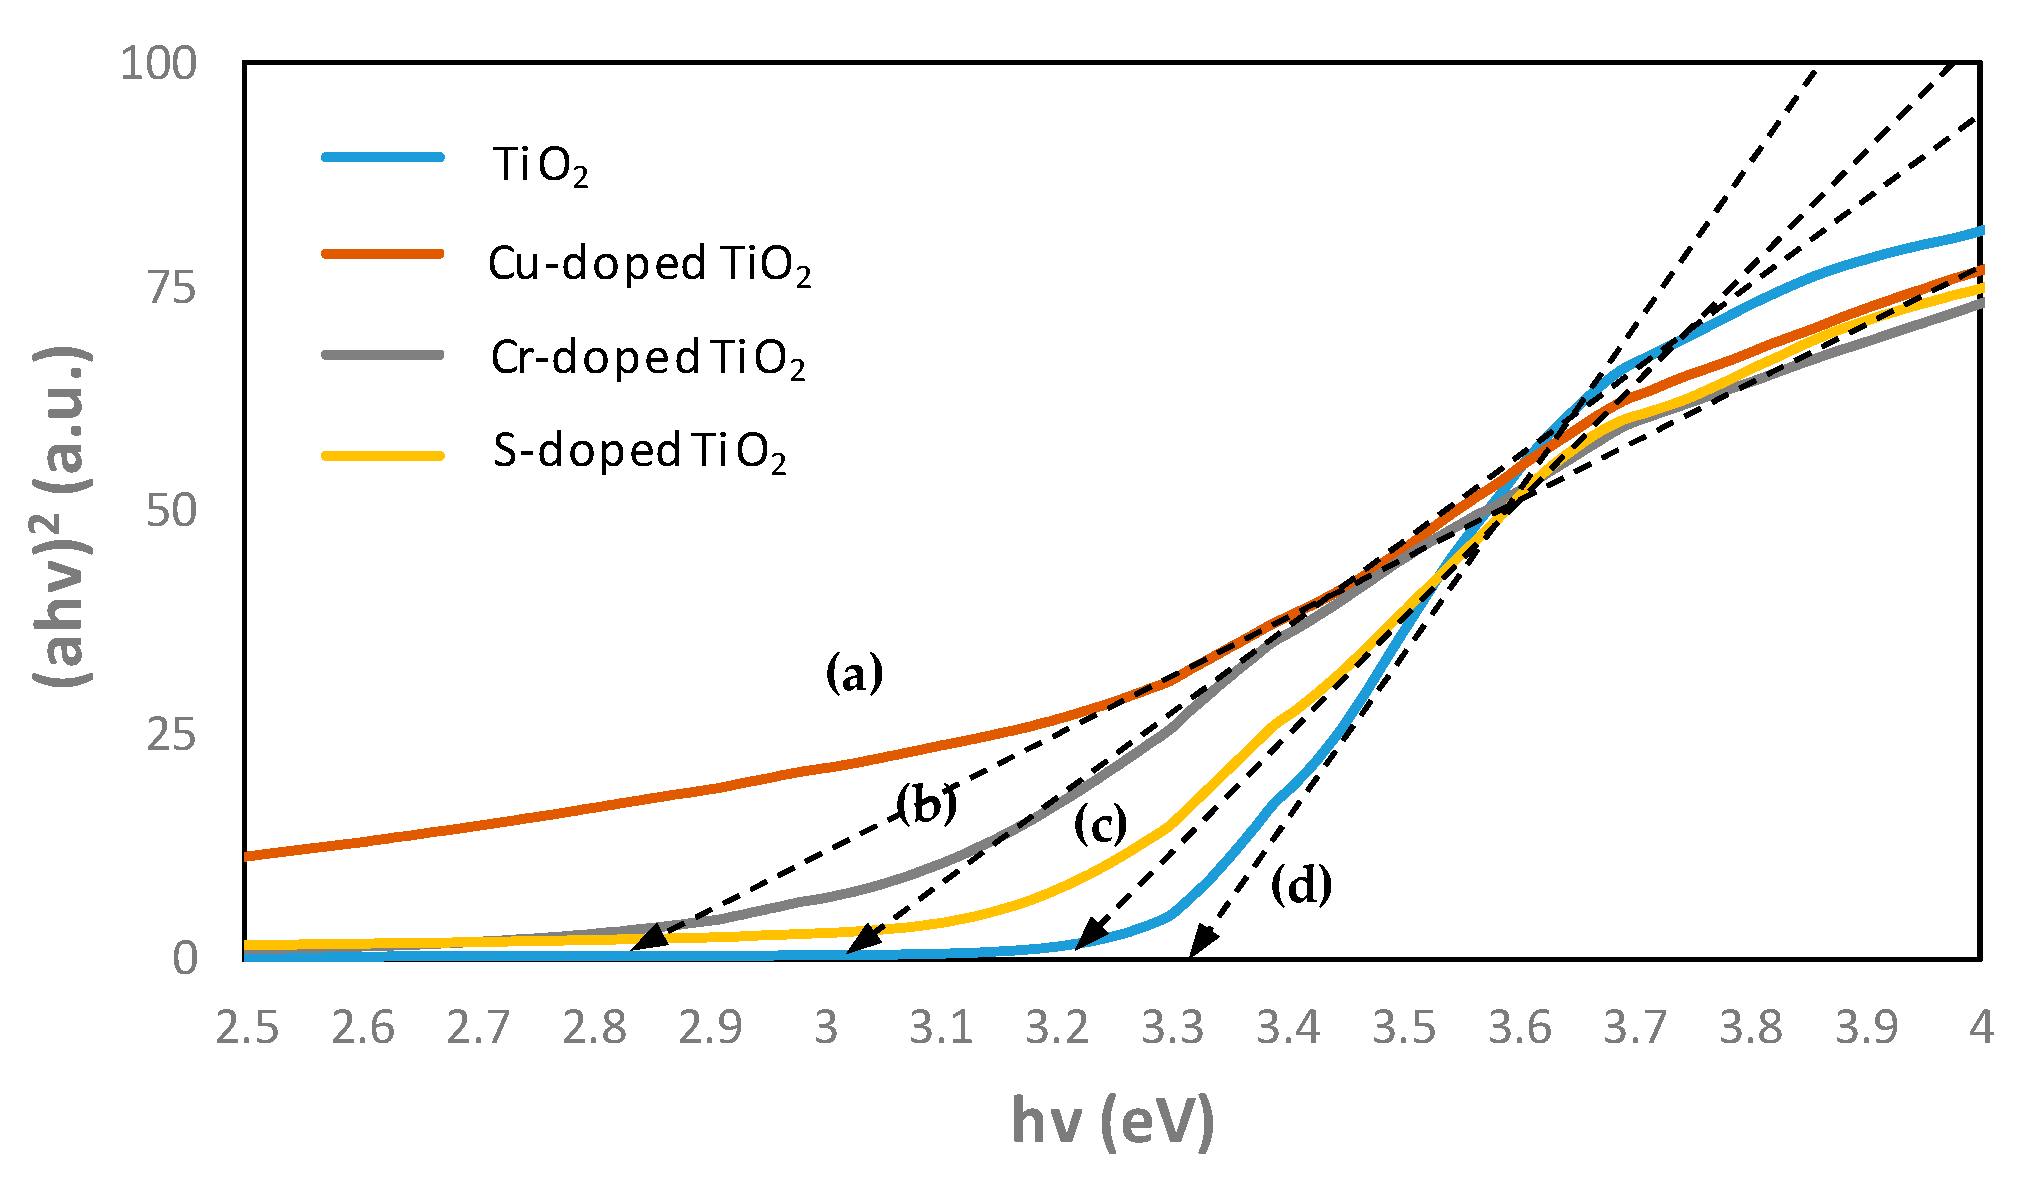
  • As a result of confirming the TiO2 energy band gap in the UV-visible absorption spectrum test, TiO2 doped with Cu has a strong absorption of 0.8 up to 700 nm, and the inherent band gaps have also decreased from 3.3 to 2.8 eV. It was confirmed that the TiO2 test specimen doped with Cr and S had a sharp drop in absorption from 400 nm.
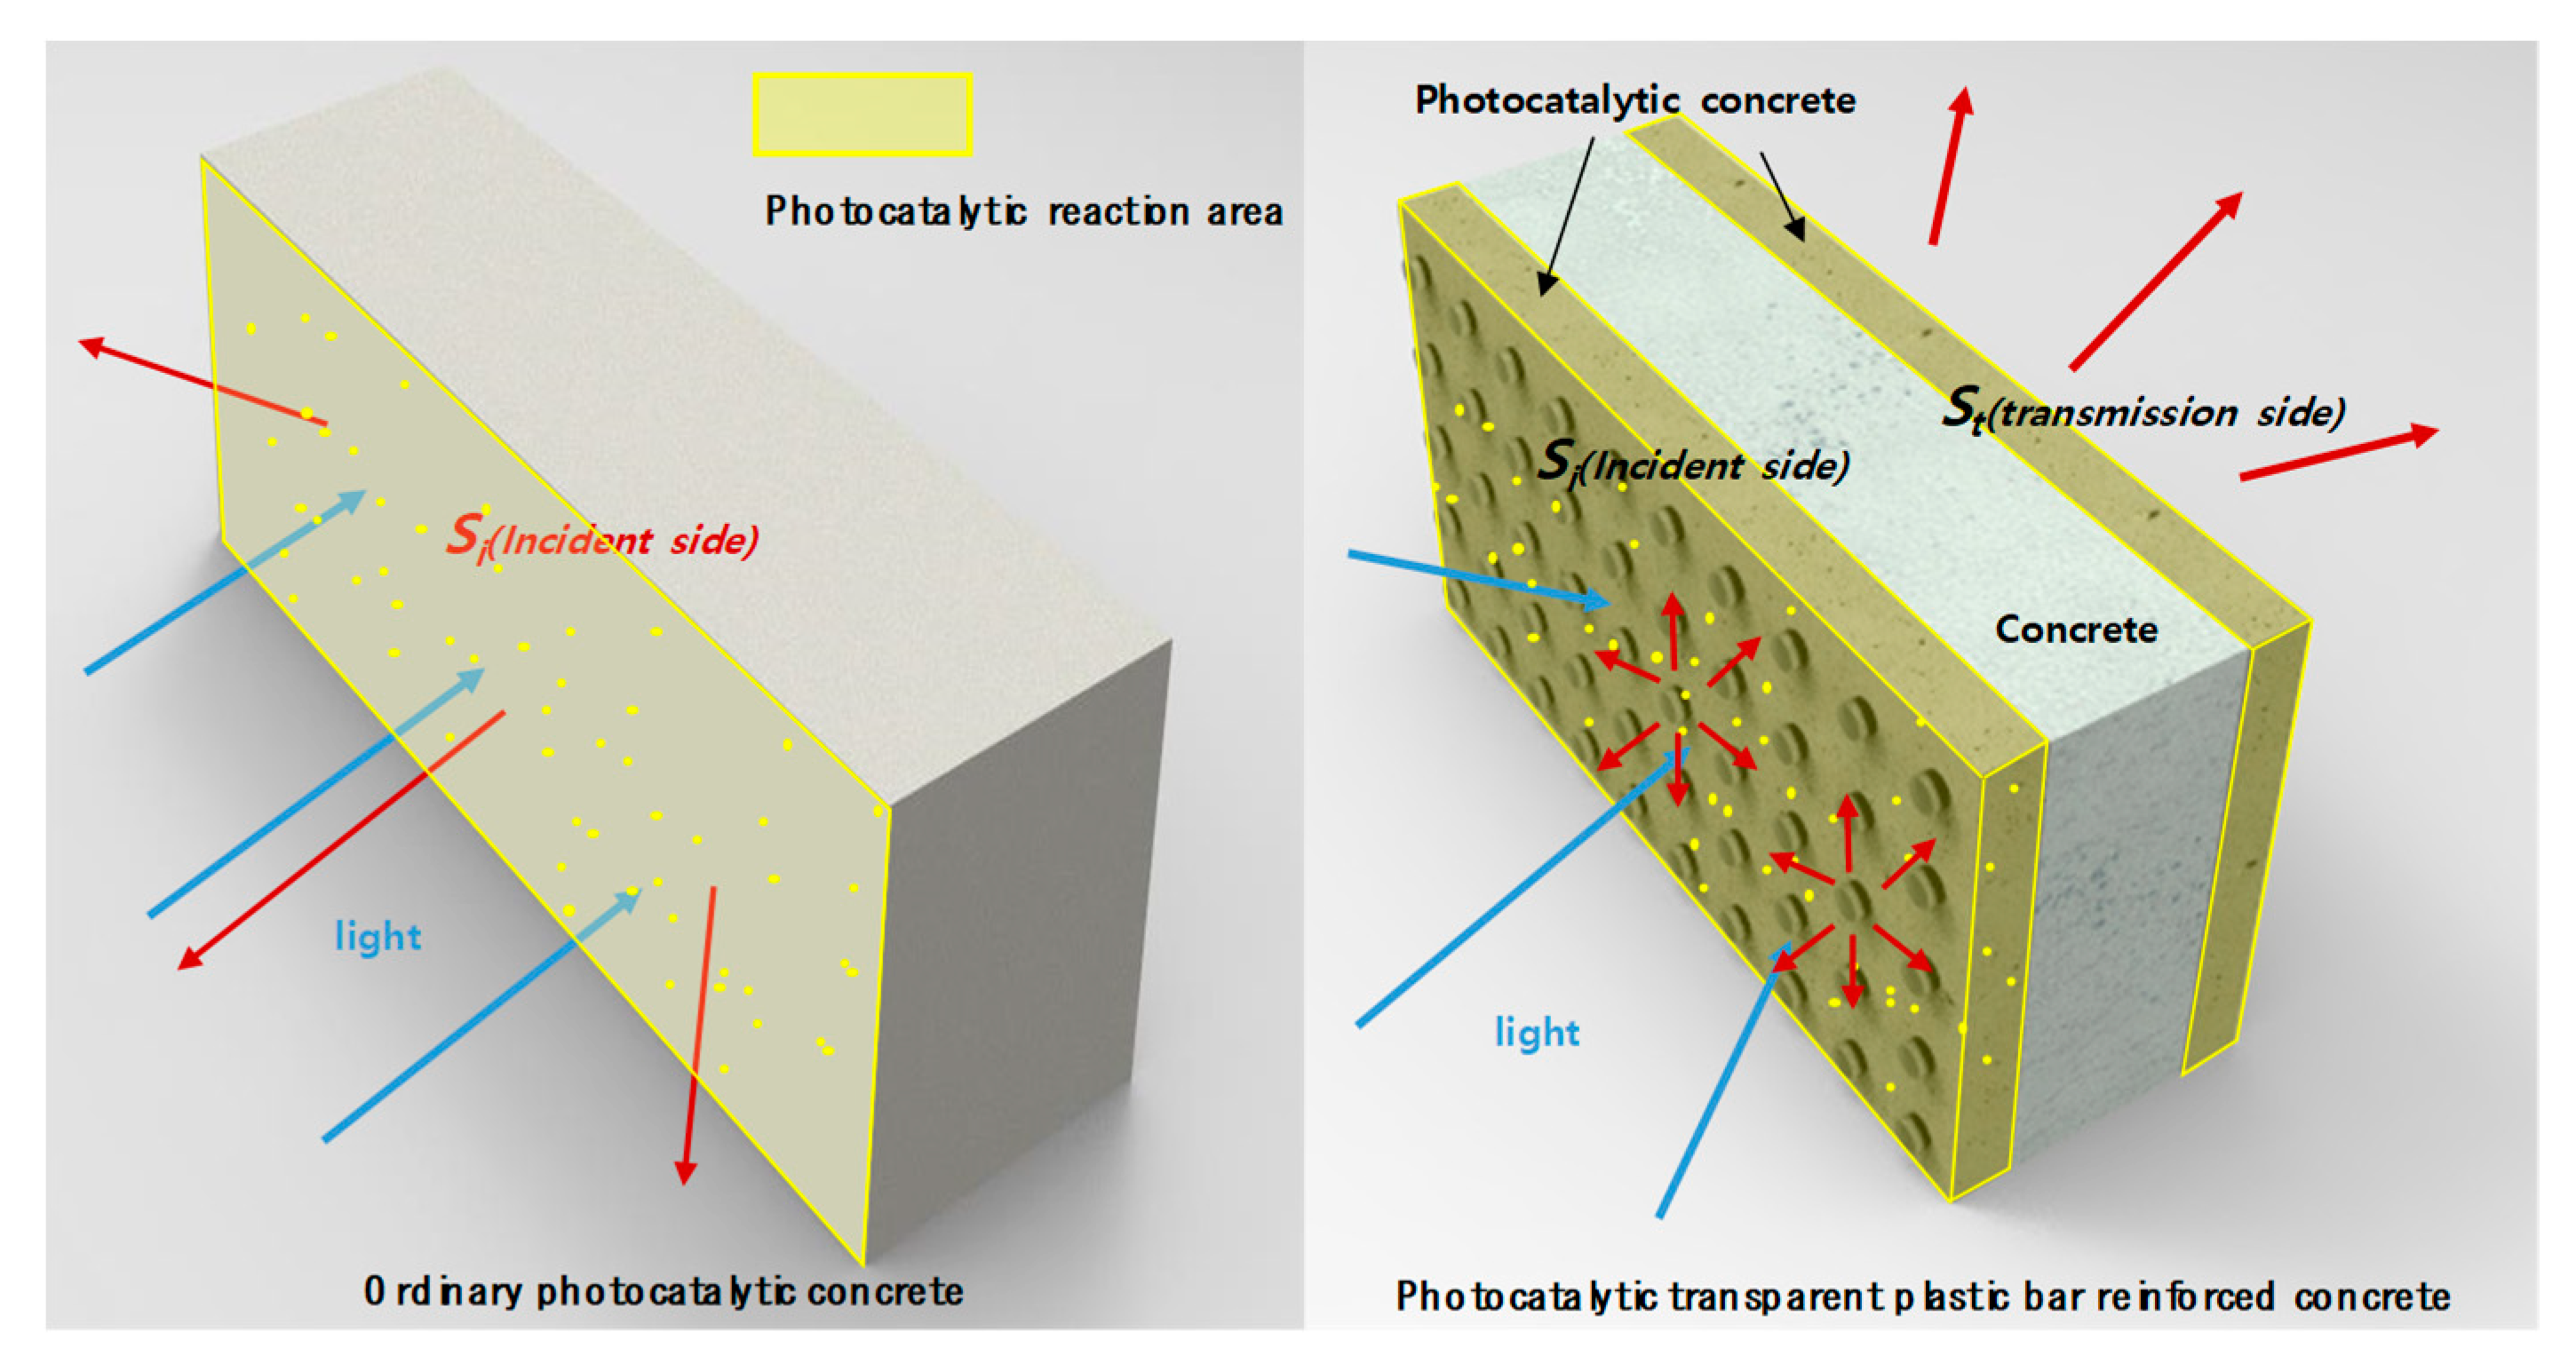
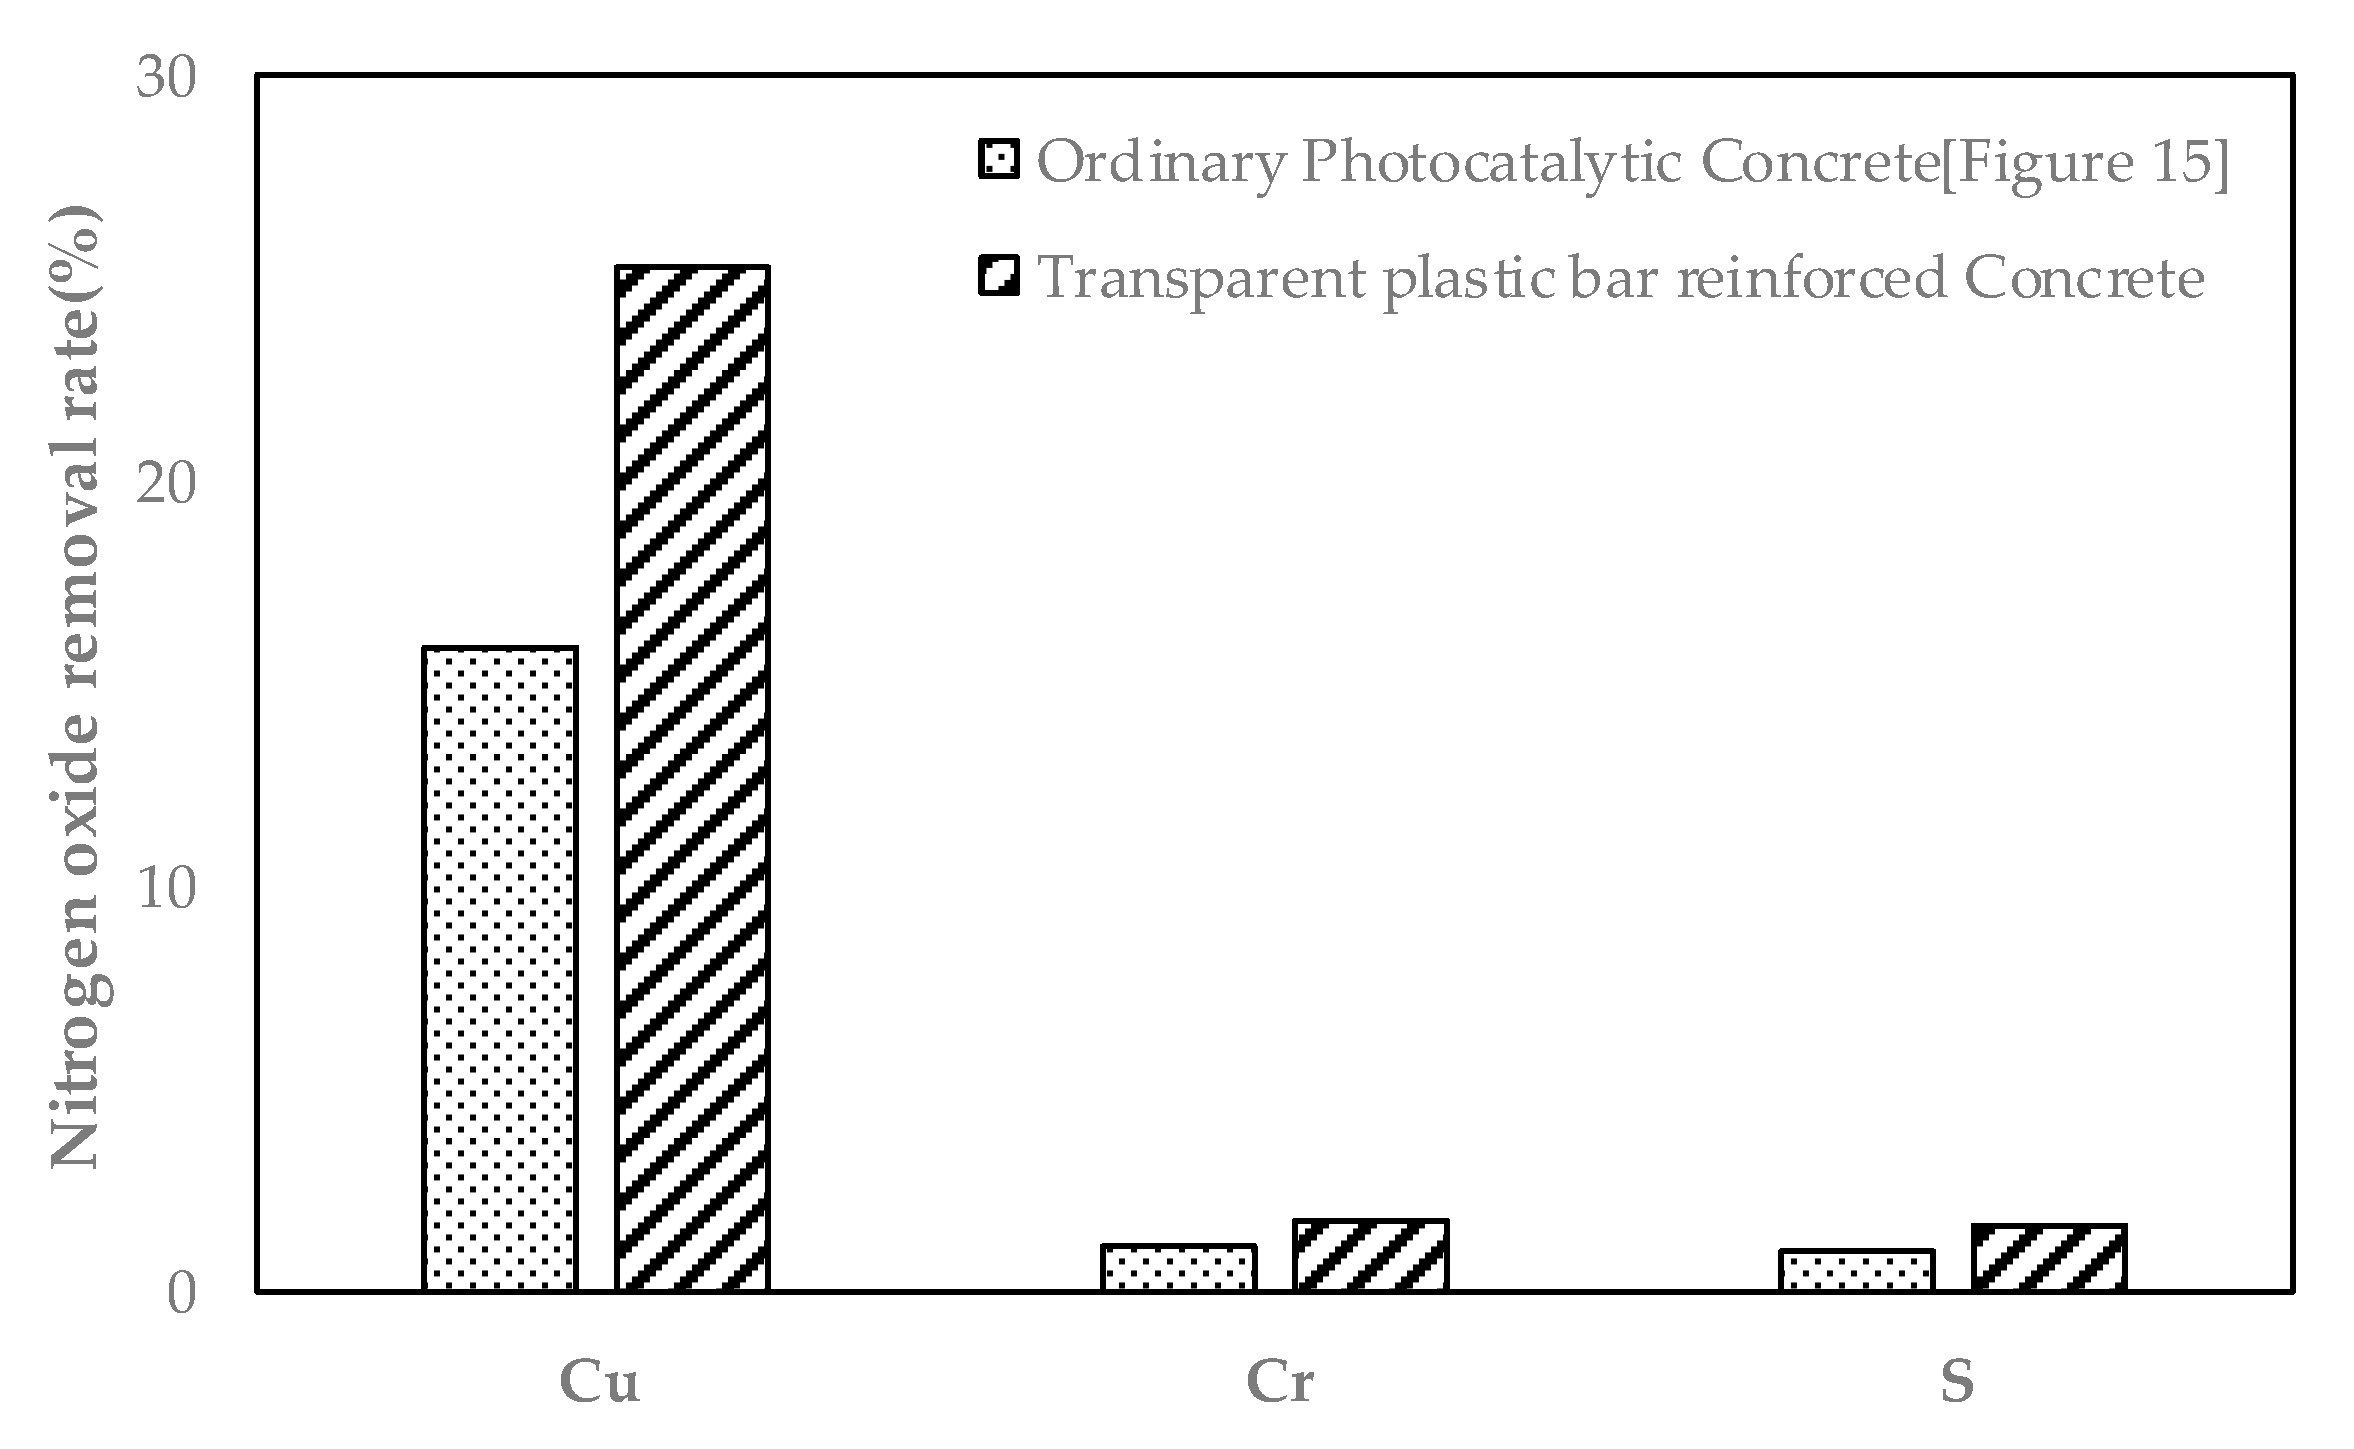
  • The specimen mixed with TiO2 doped with Cu showed a removal rate of about 15.8% for 5 h in the NO removal test, showing the best results among the specimens. When applied to TPBRC using this method, visible light is transmitted through the inside of the test specimen. Considering the photocatalytic effect on the other side of the specimen, it is believed that about 25.3% of NO removal efficiency can be secured.
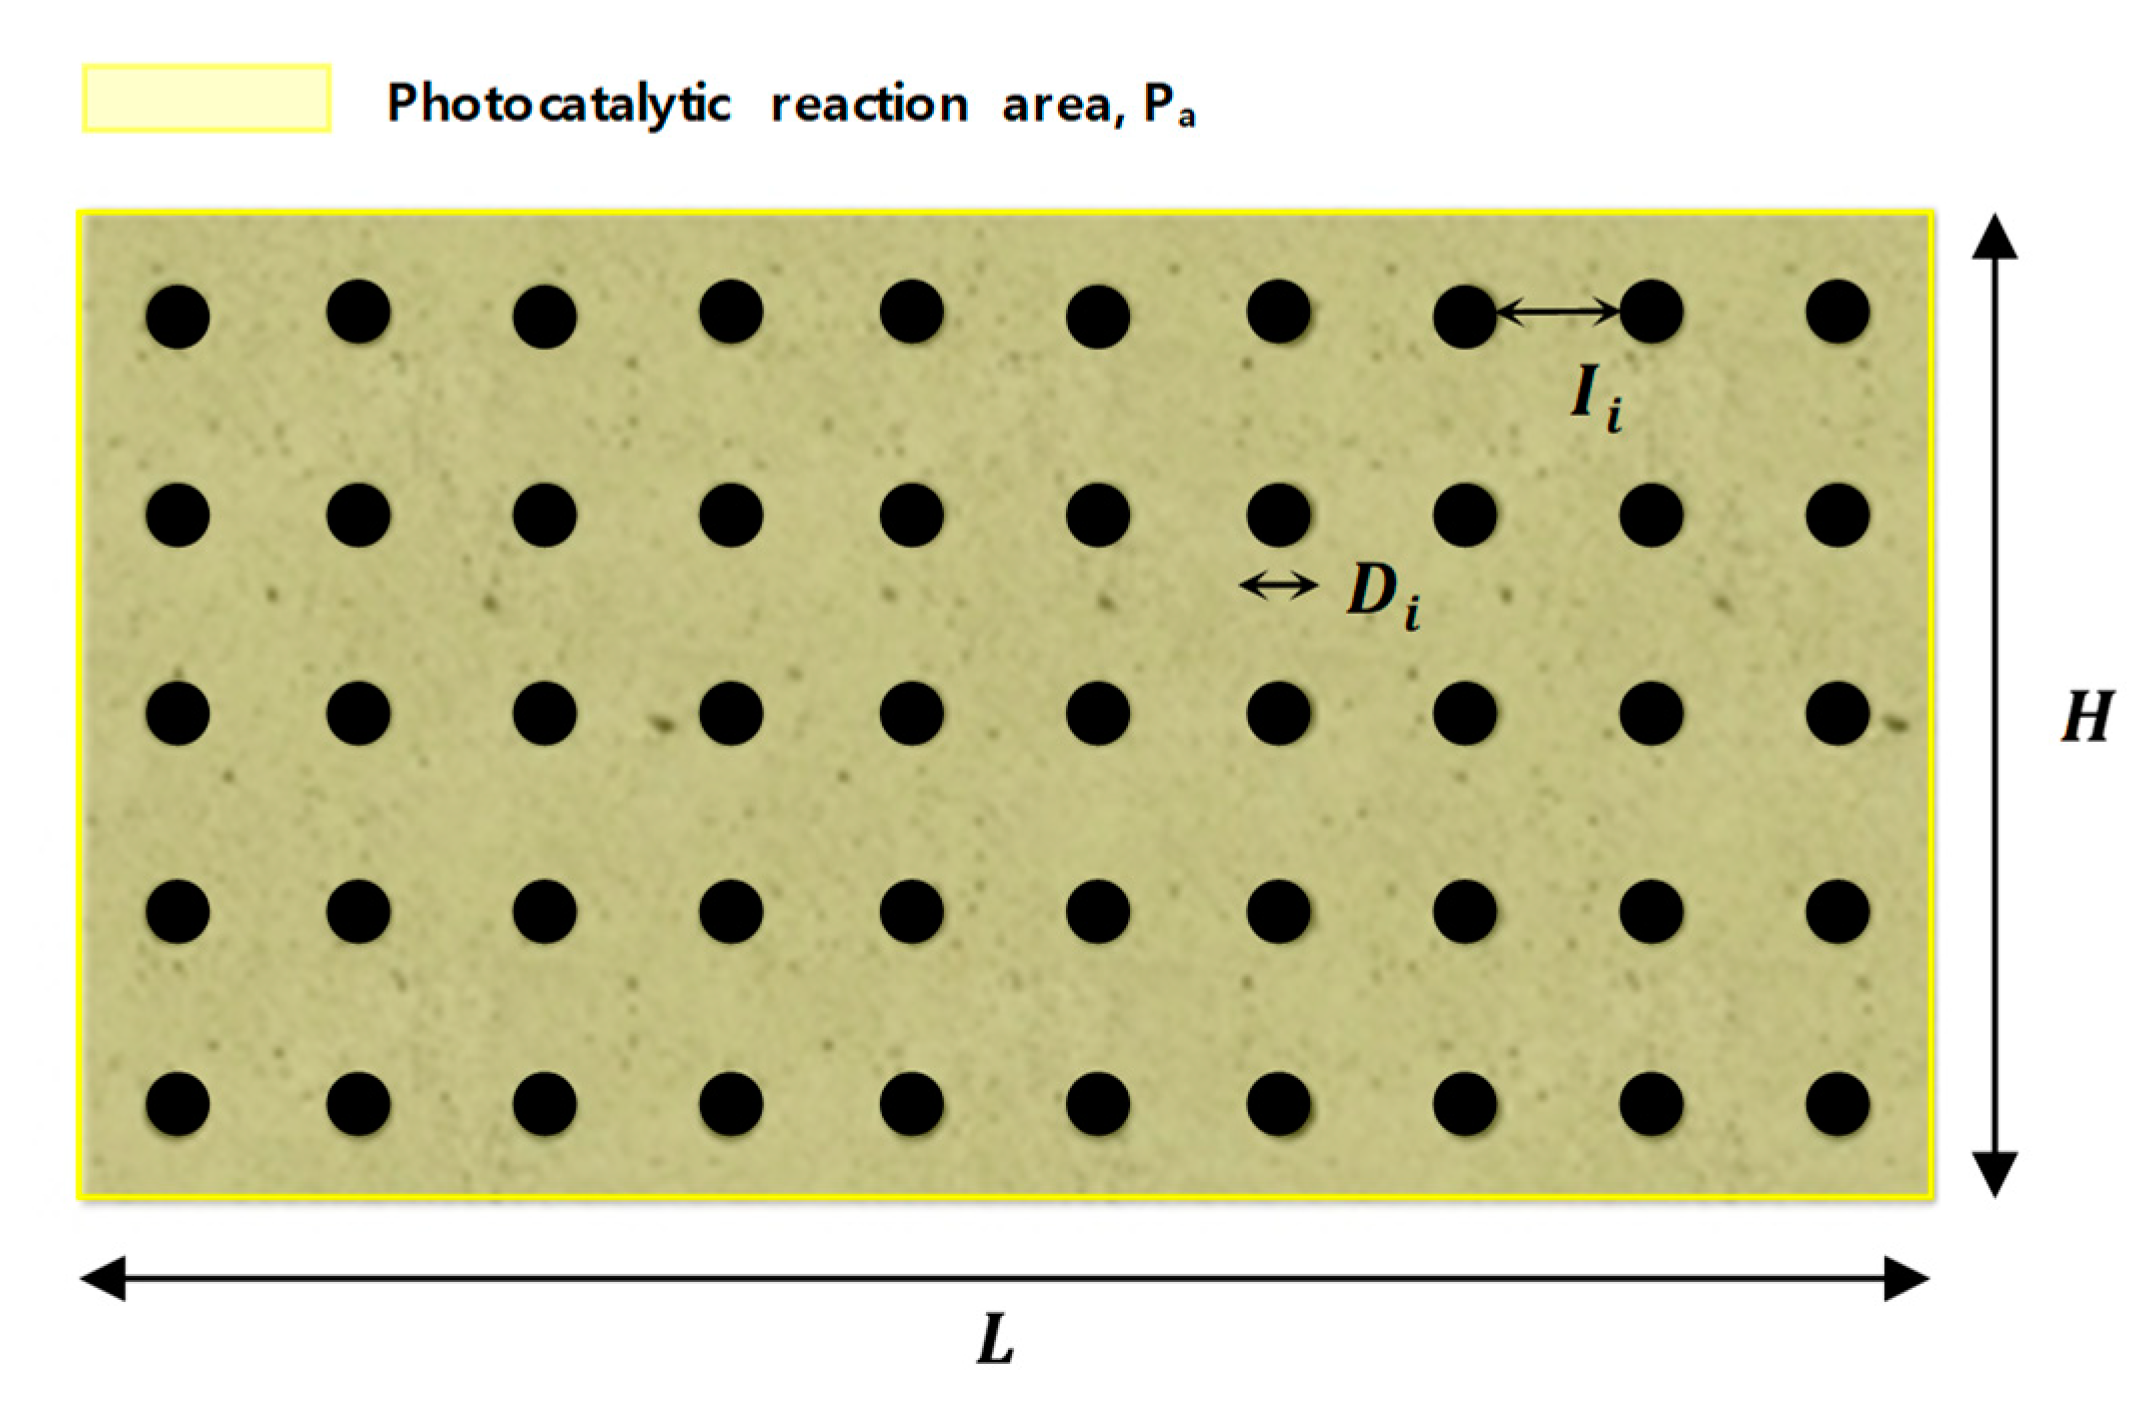
  • Although the test results for the NOx removal test could not be derived due to the lack of the test method for the TPBRC test body, it confirmed the possibility that harmful substances in the indoor space can be improved due to photocatalytic reaction under visible light when considering the light transmittance and the exposed area on the concrete surface.

Author Contributions

B.-I.K. conceived and designed the experiments; S.-H.S. and B.-I.K. performed the experiments; S.-H.S. and B.-I.K. analyzed the data; S.-H.S. and B.-I.K. wrote the paper. Both authors have read and agreed to the published version of the manuscript.

Funding

This research was funded by Ministry of Land, Infrastructure and Transport Construction Technology Research Project, grant number 20SCIP-B146255-03.

Conflicts of Interest

The authors declare no conflict of interest.

References

  1. Fujishima, A.; Honda, K. Electrochemical photolysis of water at a semiconductor electrode. Nature 1972, 238, 37–38. [Google Scholar] [CrossRef] [PubMed]
  2. Tian, B.; Li, C.; Zhang, J. One-step preparation, characterization and visible-light photocatalytic activity of Cr-doped TiO2 with anatase and rutile bicrystalline phases. Chem. Eng. J. 2012, 191, 402–409. [Google Scholar] [CrossRef]
  3. Li, C.; Ma, Z.; Zhang, L.; Qian, R. Preparation of Ni/TiO2 nanoparticles and their catalytic performance on the thermal decomposition of ammonium perchlorate. Chin. J. Chem. 2009, 27, 1863–1867. [Google Scholar] [CrossRef]
  4. Li, G.; Zhang, D.; Yu, J.C. Thermally stable ordered mesoporous CeO2/TiO2 visible-light photocatalysts. Phys. Chem. Chem. Phys. 2009, 11, 3775–3782. [Google Scholar] [CrossRef]
  5. Kim, D.; Kim, K.; Kim, W.; Jeon, K. Experimental research about photocatalyst heat treatment doping level analysis. J. Archit. Inst. Korea Struct. Constr. 2010, 26, 67–74. [Google Scholar]
  6. Colón, G.; Maicu, M.; Hidalgo, M.C.; Navío, J.A. Cu-doped TiO2 systems with improved photocatalytic activity. Appl. Catal. B Environ. 2006, 67, 41–51. [Google Scholar] [CrossRef]
  7. Mathew, S.; Ganguly, P.; Rhatigan, S.; Kumaravel, V.; Byrne, C.; Hinder, S.J.; Nolan, M.; Pillai, S.C. Cu-Doped TiO2: Visible light assisted photocatalytic antimicrobial activity. Appl. Sci. 2018, 8, 2067. [Google Scholar] [CrossRef] [Green Version]
  8. Praliaud, H.; Mikhailenko, S.; Chajar, Z.; Primet, M. Surface and bulk properties of Cu-ZSM-5 and Cu/Al2O3 solids during redox treatments. Correlation with the selective reduction of nitric oxide by hydrocarbons. Appl. Catal. B Environ. 1998, 16, 359–374. [Google Scholar] [CrossRef]
  9. Kim, W.; Jung, J.; Jeon, K. Development of visible ray photocatalyst for reinforcement of air cleaning function indoor and outdoors. J. Archit. Inst. Korea Struct. Constr. 2009, 25, 121–128. [Google Scholar]
  10. Ghicov, A.; Schmidt, B.; Kunze, J.; Schmuki, P. Photoresponse in the visible range from Cr doped TiO2 nanotubes. Chem. Phys. Lett. 2007, 433, 323–326. [Google Scholar] [CrossRef]
  11. Peng, Y.H.; Huang, G.F.; Huang, W.Q. Visible-light absorption and photocatalytic activity of Cr-doped TiO2 nanocrystal films. Adv. Powder Technol. 2012, 23, 8–12. [Google Scholar] [CrossRef]
  12. Kim, J.; Jung, J.; Lee, J.; Kim, W. An experiment research about a repository visible light reaction TiO2 development. Proc. Korea Concr. Inst. 2007, 5, 911–914. [Google Scholar]
  13. Ohno, T.; Akiyoshi, M.; Umebayashi, T.; Asai, K.; Mitsui, T.; Matsumura, M. Preparation of S-doped TiO2 photocatalysts and their photocatalytic activities under visible light. Appl. Catal. A Gen. 2004, 265, 115–121. [Google Scholar] [CrossRef]
  14. Nolan, M.; Elliott, S.D.; Mulley, J.S.; Bennett, R.A.; Basham, M.; Mulheran, P. Electronic structure of point defects in controlled self-doping of the TiO2 (110) surface: Combined photoemission spectroscopy and density functional theory study. Phys. Rev. B—Condens. Matter Mater. Phys. 2008, 77, 14–18. [Google Scholar] [CrossRef]
  15. Michalow, K.A.; Logvinovich, D.; Weidenkaff, A.; Amberg, M.; Fortunato, G.; Heel, A.; Graule, T.; Rekas, M. Synthesis, characterization and electronic structure of nitrogen-doped TiO2 nanopowder. Catal. Today 2009, 144, 7–12. [Google Scholar] [CrossRef]
  16. El Mragui, A.; Logvina, Y.; Pinto da Silva, L.; Zegaoui, O.; Esteves da Silva, J.C. Synthesis of fe-and co-doped TiO2 with improved photocatalytic activity under visible irradiation toward carbamazepine degradation. Materials 2019, 12, 3874. [Google Scholar] [CrossRef] [Green Version]
  17. Kim, B. Light Transmitting lightweight concrete with transparent plastic bar. Open Civ. Eng. J. 2017, 11, 615–626. [Google Scholar] [CrossRef]
  18. Kim, B.; Seo, S. Prediction model of flexural properties of LEFC using foaming agent. J. Korea Inst. Build. Constr. 2019, 19, 9–18. [Google Scholar] [CrossRef]
  19. Kim, B.; Han, Y. Flexural performance of transparent plastic bar reinforced concrete. Appl. Sci. 2018, 8, 325. [Google Scholar] [CrossRef]
  20. Kim, B.; Oh, S.; Seo, S. A Study on the development of light emotion friendly concrete block for efficient application of titan-oxide photocatalyst. J. Korea Inst. Struct. Maint. Insp. 2019, 23, 120–131. [Google Scholar] [CrossRef]
  21. Ryu, G.; Kim, S.; Ahn, G.; Koh, K. Evaluation of the direct tensile behavioral characteristics of UHPC using twisted steel fibers. Adv. Mater. Res. 2013, 602–604, 96–101. [Google Scholar] [CrossRef]
  22. Nazari, A.; Riahi, S. The effect of TiO2 nanoparticles on water permeability and thermal and mechanical properties of high strength self-compacting concrete. Mater. Sci. Eng. A 2010, 528, 756–763. [Google Scholar] [CrossRef]
  23. Yoo, D.; Kim, S.; Park, J. Comparative flexural behavior of ultra-high-performance concrete reinforced with hybrid straight steel fibers. Constr. Build. Mater. 2017, 132, 219–229. [Google Scholar] [CrossRef]
  24. Kang, S.; Park, J.; Ryu, G.; Kim, S. Influence of the filler’s size on the mechanical properties of ultra high performance concrete(UHPC). J. Korean Soc. Civ. Eng. A 2008, 28, 573–580. [Google Scholar]
  25. ASTM C1611/C1611M-18. Standard Test Method for Slump Flow of Self-Consolidating Concrete; ASTM International: West Conshohocken, PA, USA, 2018. [Google Scholar] [CrossRef]
  26. ASTM C1621/C1621M-17. Standard Test Method for Passing Ability of Self-Consolidating Concrete by J-Ring; ASTM International: West Conshohocken, PA, USA, 2017. [Google Scholar] [CrossRef]
  27. BS EN 12350-10:2010. Testing Fresh Concrete-Part 10: Selfcompacting Concrete-L Box Test; Technical Standard, British Standards Institution: London, UK, 2010. [Google Scholar]
  28. KS F 2405. Standard Test Method for Compressive Strength of Concrete; Korea Standards Associations: Seoul, Korea, 2017. [Google Scholar]
  29. KS F 2408. Standard Test Method for Flexural Strength of Concrete; Korea Standards Associations: Seoul, Korea, 2016. [Google Scholar]
  30. ISO 17168-1. Fine Cerimics—Test Method for Air-Purification Performance of Semiconducting Photocatalytic Materials under Indoor Light Environment—Part 1: Removal of Nitic Oxie; International Standards: Geneva, Switzerland, 2018. [Google Scholar]
  31. De Castro Monsores, K.G.; da Silva, A.O.; Oliveira, S.D.; Rodrigues, J.G.; Weber, R.P. Influence of ultraviolet radiation on polymethylmethacrylate (PMMA). J. Mater. Res. Technol. 2019, 8, 3713–3718. [Google Scholar] [CrossRef]
  32. Wang, B.; Lin, Q.; Shen, C.; Han, Y.; Tang, J.; Chen, H. Synthesis of MA POSS-PMMA as an intraocular lens material with high light transmittance and good cytocompatibility. RSC Adv. 2014, 4, 52959–52966. [Google Scholar] [CrossRef]
  33. Karapati, S.; Giannakopoulou, T.; Todorova, N.; Boukos, N.; Antiohos, S.; Papageorgiou, D.; Chaniotakis, E.; Dimotikali, D.; Trapalis, C. TiO2 functionalization for efficient NOx removal in photoactive cement. Appl. Surf. Sci. 2019, 319, 29–36. [Google Scholar] [CrossRef]
Figure 1. Procedure of transparent plastic bar reinforced concrete [17,19].
Applsci 10 07334 g001
Figure 2. Examples of transparent plastic bar reinforced concrete.
Applsci 10 07334 g002
Figure 3. Detailed image of materials.
Applsci 10 07334 g003
Figure 4. Research flow chart.
Applsci 10 07334 g004
Figure 5. Detailed images of doping TiO2.
Applsci 10 07334 g005
Figure 6. Slump flow test results.
Applsci 10 07334 g006
Figure 7. J-Ring and L-Box test results.
Applsci 10 07334 g007
Figure 8. Compressive and flexural strength results.
Applsci 10 07334 g008
Figure 9. Results of calcination and milling of TiO2.
Applsci 10 07334 g009
Figure 10. SEM (Scanning electron microscope) microstructure images of doped TiO2 specimens.
Applsci 10 07334 g010
Figure 11. EDS (Energy dispersive spectroscopy) spectrum of doped TiO2 specimens.
Applsci 10 07334 g011
Figure 12. XRD (X-ray diffraction) patterns of doped TiO2s.
Applsci 10 07334 g012
Figure 13. UV-visible absorption spectrum of specimens: (a) Cu-doped TiO2; (b) Cr-doped TiO2; (c) S-doped TiO2; (d) TiO2.
Applsci 10 07334 g013
Figure 14. Determination of energy band gap Eg for TiO2 specimens: (a) Cu-doped TiO2; (b) Cr-doped TiO2; (c) S-doped TiO2; (d) TiO2.
Applsci 10 07334 g014
Figure 15. Doped TiO2 concrete specimens and photocatalytic NO removal performance test of specimens.
Applsci 10 07334 g015
Figure 16. Comparison of ordinary photocatalytic concrete and photocatalytic transparent plastic bar reinforced concrete.
Applsci 10 07334 g016
Figure 17. An example of photocatalytic transparent plastic bar reinforced concrete.
Applsci 10 07334 g017
Figure 18. Estimation of nitrogen oxide removal rate of doped TiO2-incorporated transparent plastic bar reinforced concrete.
Applsci 10 07334 g018
Table 1. (Non)metallic material properties.
SubstanceCuCrS
Purity (%)999998
Formpowderpowderpowder
Mesh150150-
Density (g/cm3)8.967.192.07
Table 2. Mix design of TiO2-incorporated UHPC (Ultra high performance concrete).
SpecimenW/C (%)Unit Weight (kg/m3)
WaterCementSilica FumeSilica SandFillerSuper PlasticizerAntifoamerTiO2
P-0307.0523.515.8825.867.050.940.070
P-123.280.235
P-223.040.470
P-322.810.705
P-422.570.940
P-522.341.176
Table 3. J-Ring test blocking assessment.
Difference between Slump Flow and J-Ring FlowBlocking Assessment
0 to 25 mmno visible blocking
>25 to 50 mmminimal to noticeable blocking
>50 mmnoticeable to extreme blocking
Table 4. Results of flowability and self-consolidating tests of TiO2-incorporated UHPC.
SpecimenSlump Flow (mm)J-Ring Flow (mm)J-Ring Passing Ability (mm)L-Box Passing Ability (h2/h1)
P-0750730200.96
P-179079001.00
P-2690670200.93
P-3620630100.80
P-463063000.82
P-5610590200.57
Publisher’s Note: MDPI stays neutral with regard to jurisdictional claims in published maps and institutional affiliations.

