Article

Risk Factors Impacting the Project Value Created by Green Buildings in Saudi Arabia

1
Department of Civil Engineering, College of Engineering, Qassim University, Buraydah, Qassim 51452, Saudi Arabia
2
Faculty of Business and Law, The British University in Dubai, Dubai 345015, UAE
*
Author to whom correspondence should be addressed.
Appl. Sci. 2020, 10(21), 7388; https://doi.org/10.3390/app10217388
Submission received: 29 September 2020 / Revised: 17 October 2020 / Accepted: 19 October 2020 / Published: 22 October 2020
(This article belongs to the Special Issue Sustainable Re-Design of the Built Environment)

Abstract

:
Green buildings are playing a pivotal role in sustainable urban development around the world, including Saudi Arabia. Green buildings subject to various sources of risk that influence the potential outcomes of the investments or services added in their design. The present study developed a structured framework to examine various risks that may lead to green buildings’ value destruction in Saudi Arabia. The framework initiates with identification of 66 potential risk factors from reported literature. A questionnaire compiling a list of identified risk factors was hand-delivered to 300 practitioners (managers, engineers, and architects) having knowledge of value engineering in the construction industry, and an overall response rate of 29.7% was achieved. Subsequently, descriptive statistics ranked the risk factors based on scores given by the respondents. The principal component analysis extracted 16 components, based on the likelihood of risk factors impacting the value created by green building design. Finally, the factor analysis grouped the 35 most significant risk factors in 5 clusters—i.e., 8 in functional risk, 13 in financial risk, 3 in operational risk, 3 in environmental risk, and 8 in management risk cluster. The study enhances the understanding of the importance of the risk factors’ impact on value creation. Based on the results, the value management (or engineering) teams and the top-level management can identify, manage, and control the risk factors that have a significant impact on the project value created by green building design.

1. Introduction

Green buildings possess a wide range of advantages over the conventional buildings over their life cycle, e.g., minimal environmental impacts and low maintenance costs [1]. In the recent past, rapidly growing urbanization trends have undergone the world to unusual climate change and environmental deterioration [2]. Due to global warming, the urban heat island (UHI) phenomenon has already raised, in comparison to the rural proximities, the temperature from 2 to 5 °C in many cities around the globe [3]. The potential impacts of global warming on temperature and rainfall patterns are expected to be highly significant in warm and arid regions like Saudi Arabia [4]. Decision-makers need to take proactive measures to minimize the production of greenhouse gasses from all types of development activities, particularly the growing building sector in the country [5].
As per Shin et al. [6], certified green buildings reduce the UHI intensity by around half a degree. To further mitigate the impact of buildings on climate change, He [2] proposed a concept of Zero UHI impact building. In addition to revising the sustainability assessment standards and economic regulations, the idea needs serious efforts towards technological interventions in building envelopes, materials, and construction equipment. Dwaikat and Ali [7] estimated the economic benefits of green buildings in Malaysia. They found that, over the life cycle with an annual increase of 1% in the energy price, a green building saves up to 5756 kWh/m2 that corresponds to around 2.8 million US dollars. Using Harvard’s co-benefits calculator, MacNaughton et al. [8] reported significant social cost reductions in terms of health benefits due to decreasing carbon emissions from Leadership in Energy and Environmental Design (LEED) certified green buildings. Considering the variations in life cycle costs and associated environmental impacts, there is a need for region (or country) specific studies for assessing the value created by green buildings as well as risks that might influence the created value.
Modern construction projects, such as green buildings, contain inherent complexities due to the engagement and coordination of multiple stakeholders—e.g., consultants, designers, contractors, and suppliers of materials. Value management helps to improve the communication between various projects’ stakeholders, accommodate mutually agreed project objectives, provides a better quality project definition, builds innovation, and eliminates unnecessary costs [9]. Risk management improves construction projects in several ways by providing better control of uncertainties, helping the decision-maker to choose the right project during design phase, improving team communication and motivation, and protecting the project cost [10,11].
Value and risk are two of the main management concepts that improve both the quality and cost controls for the sustainability of the construction industry. Value management aims to achieve the desired value with lower prices without sacrificing the quality and functions, while risk management aims to identify, evaluate, and choose the strategies to maintain uncertainty and risk at a tolerable level for the organization to maximize its performance. The term ‘value’ can be understood in a multitude of ways including through economic, cultural, and social interpretations [12]. Gao et al. [13] stated that economic, technical, and education levels are the main factors influencing the development of green buildings in a country. The indicator for perceiving value in construction projects is obtaining success in those projects that involves tolerance levels of risk, affordability, timeliness, and safe completion within specific quality parameters while meeting normal requirements [14]. Past studies investigated how risk influences the perceived value [15]. Whole-life-cycle value exchange mechanisms are risky and complex, therefore, a deeper investigation of the risks associated with value exchange is needed to focus on developing value targets within the whole life-cycle agenda [16].
The construction industry in Saudi Arabia has not effectively incorporated the impact of risk factors on development projects [17], including green buildings. Value creation improves function longevity and operation and maintenance costs that enhance the performance reliability, quality, safety, and life-cycle cost of the green buildings. Based on the past work, further investigations are required to evaluate the impacts of perceived risk on the value exchange of green buildings [15,18].
Like other long-term investments, green buildings are also subject to various sources of risk that influence the potential outcome of investments or services provided throughout the lifecycle from inception to disposal. The low perceived risk adds high value from investments in green buildings. High risk is involved in investing capital value (both financial and human) in building assets during both the design and production operations; the primary perceived risk is the case when the project will not be completed and not all the anticipated value will be realized. Nevertheless, the potential for value destruction still exists even after the completion of the construction process. The risk to value returns from the green building operation stage is high [16].
In Saudi Arabia, organizations are also interested in the potential benefits of green buildings similarly to other high-income countries around the world. For improving value creation, there is a need of a framework that integrates both the value and risk in the development phase of green buildings projects in Saudi Arabia. In general, the practices towards risk management in construction projects are still at the earlier stages in the country [17]. Authors in their previous research developed the value creation drivers for the green buildings in Saudi Arabia [19]. The present study examines the risks that may lead to value destruction in green building development and operation. The purpose of identifying these risks is to evaluate the magnitude of their consequences on the value, should they occur, and the likelihood of their occurrence. The specific objectives are set to: (i) identify various risk factors that may influence the value creation, and (ii) analyze the influence of these risks on the project value created by the green buildings design.
The remainder of the paper is organized as follows. Section 2 defines 66 risk factors under five risk classifications based on an extensive review of literature. Section 3 describes the methodological framework and statistical methods used for selection of most important risk factors. Section 4 presents results and discussions, while Section 5 outlines conclusions of the research work and recommends future works for the continuation and practical implementation of the present research.

2. Risk Classification in Green Building Development

There is no clear consensus in the existing literature on how to classify the existing risks that may emerge from the development of green buildings. In an early study, Tiong [20] clustered risk into financial, political, and technical aspects of green buildings. Boussabaine and Kirkham [21] presented a systemic life cycle risk classification based on design, construction, operation, and disposal of building facilities. Medda [22] suggested additional classes to include, such as commercial, regulatory, and economic risks. Zou et al. [23] classified risks based on time, cost, quality, safety, and environmental aspects of performance. Yang et al. [24] classified previously defined risks into several categories and introduced the ethics/reputation risk cluster. Zou and Couani [25] classified a number of risks based on the perspective of the stakeholders involved in the process of green building supply chain.
Risk classification largely depends on the intended purpose of the investigation [26]. Based on the objectives of the present research, Table 1 groups the identified risks in, (i) functional risks related to how the building and its components will function in use; (ii) financial risks related to a project’s financing parameters, capital and operational costs, and return on investments; (iii) operational risks related to safety and how easy and efficient the green assets are to operate; (iv) environmental risks related to protecting the environment from the impacts of the development; and (v) management risks related to stakeholders’ interaction, knowledge, and contractual and organizational relationship. It should be noted that the purpose of our classification is to facilitate risk identification in value creation in green building development. These risks will aid the process of value engineering analysis. The sources of the identified risks in each cluster are described in the following sub-sections.

2.1. Functional Risks

Functionality in the green building’s use plays a pivotal role in the optimization of the operational cost of core services and the productivity of the occupant. From a value point of view, the function of a building and its components are related to the purpose of their design and existence. The design of green buildings must be subject to risk analysis in order to assess and understand the uncertainties that are associated with the function and design parameters. Changes in the assumption of these parameters may lead to different levels of performance and reliability. Functional risks can be attributed to the state of the product or services provided. If the service or product fails to fulfil its functional requirements as expected, then all or most of the invested value will be lost.
Table 1 lists the functionality risks that may impact the value creation in green building development. Physical risks are related to the building asset’s condition over the life span of the capital value investment. Typical risks include loss due to fire, corrosion, explosion, structural defect, war, etc. Technical risks are due to increased technology in manufacturing, communications, data handling, and interdependency of manufacturers, methods of storage, stock control, and distribution. These risks could also be associated with physical aspects of the green building’s development. Building components and their function are subject to obsolescence in terms of service life, design life, and functional purpose over time, leading to both tangible and intangible value. The monetary value generation from a building’s assets is directly related to quality and durability of the asset [27]. The building’s systems should be easy to operate, robust, and efficient. It is essential that a green building’s facilities should easily accommodate any changes in activity that are likely to occur throughout its life cycle, including when user requirements change in the future. This is essential to guard against risks of obsolesence.
Zou and Couani [25] compiled a list of key risk factors that may have a consequential impact throughout the green building’s supply chain. Al-Yousefi [28] had previously highlighted risks due to the lack of quality, reliability, and performance in sustainable development. Non-complying products and materials and change in technologies due to green building are the two major risks that can impact the green building development [25]. Isa et al. [29] pointed out that physical risks in green buildings might result from events such as earthquake, flood, wear and tear, and user damage. The authors report that these risks will have an impact on the economic value of a property. The Green Building Council [30] stressed the importance of the following regulatory risks: (i) property value decrease due to changes in planning/transport policy; (ii) inability to compete with newer, greener properties; (iii) decrease in value due to low energy rating; and (iv) inability to lease due to new regulations.
The risk of obsolescence of the asset function or it is components will result in larger operating expenditure cost and may undermine the value of the asset that may lead to lower income, smaller capital receipts, higher costs, and the possibility of legal action. Furthermore, new technologies that can change demand-side behavior (e.g., wireless measurement of energy use at appliance level) could increase the risk of obsolescence and missed opportunities for reduced operational costs [30].

2.2. Financial Risks

Financial risks attribute to inadequate inflation forecasts, incorrect marketing decisions, and credit policies. Zurich [31] defines financial risks as “the additional costs of green buildings may affect completing projects on time and on budget, but must be weighed against the cost of not going green”. Table 1 lists the financial risks that may found to have an impact on value creation in green building development. Haghnegahdar and Asgharizadeh [32] reported that 75% of the projects are not accomplished according to the allocated financial resources and time schedules. Zou and Couani [25] identified “higher investment costs to go green” and “costs of investment in skills development” as additional costs in the development of green buildings. Zurich [31] claimed that additional costs spent on design and construction of green buildings can be too costly for some companies and delay the completion of the projects within the specified budget. According to the NAO [33], buildings that consume large amounts of capital in their development and operation will end up having a negative impact on the user’s business and performance.
Thus, if the budgets for both capital and whole-life costs are not estimated correctly and justified in the business case to be sustainable and affordable over the life of the green building facility, it leads to the risks of failure to recognize cost–value mismatches, failure to identify cost–value relationships, and losing potential revenue from the investment. It is also important that operational and maintenance costs are evaluated and kept within the budget. The investment appraisal must address various options for creating the required value from green buildings. Failure to consider the implications of economic conditions and to recognize the cost as resource expenditure will certainly lead to the risk of affordability and to the risk that whole-life cost estimates are not realistic but based on unreliable evidence.
Indirect factors—like the inflation rate, liquidity, and financing risks—will impact the capital and operational costs of developing green buildings. Lower economic activities may influence both the asset’s economic value and the rental return [34]. Higher financing cost also results in value loss, leading to a longer period being required to recover the invested capital. Sustainability features in green buildings attract funding at competitive rates.
The investments in green buildings offer higher returns in the form of higher rent, capital appreciation, and cost savings [29]. It is becoming a standard procedure that real estate valuation take into consideration the value difference if environmental features are not incorporated into the construction and operation of the building estates [30]. The Council also suggest that the failure in meeting the benchmarking criteria of sustainability by the potential investment partners may result in the different potential market risks, including, (i) brown discounts (i.e., reduction in rent and asset value), (ii) increased speed of depreciation, (iii) lower occupancy rates, and (iv) shorter tenancies.
A marked link has been emerged between the market value and the associated performance of the green features of the building [35]. Ashuri and Durmus-Pedini [36] further compiled the following list of financial risks associated with green buildings:
  • Due to the common belief that “green cost [is] much higher”, lending amounts can be disproportionate to need resulting in needless debt;
  • Return on Investment needs more of a historical perspective to become more predictable;
  • Inexperienced teams might lack the skills to properly implement green-oriented technology, which could hinder its effectiveness;
  • Company budgets are not usually structured to track life cycle cost (LCC) for a project, making longer-term gains harder to record;
  • Costs associated with litigation between the architect/engineers and the owner if certification is not reached;
  • Loss of tax incentives if certification is not reached;
  • New green building materials might result in issues never encountered previously and be a source of litigation;
  • Loss of possible financial gain if the building does not perform as it was intended to; and
  • The possible unforeseen conditions of retrofitting existing buildings.

2.3. Operational Risks

Operational risks are concerned with maintaining, operating, and cleaning a green building facility once it is in use. Table 1 lists the operational risks that may found to have an impact on value creation in green building development. Operational performance of green buildings has a significant impact on their market value, both rental and capital. The project owners are starting to require additional contract provisions regarding the energy efficiency of green buildings; breaching of contract can increase the exposure to legal liabilities, such as tortuous, statutory, and contractual liabilities [31]. Lutkendorft and Lorenz [37] proposed that the value should be attributed to the quality of the indoor environment and its relationship with the efficiency in employees’ productivity. Low energy cost reduces the potential occupants’ operating cost that minimizes the vacancy risk and improves the rental value.

2.4. Environmental Risks

The whole endeavor of the green building ethos is to create facilities that must minimize waste and energy use during construction and operation stages. Investors are concerned with the inherent risk from the environmental perspective to the real estate portfolio [30]. The building should provide a comfortable and healthy working and living environment for people. The methods and materials used in construction should be selected based on their potential risk impacts on the environment [38]. The frequency by which building materials are replaced will have an influence/increase in carbon emissions over the life cycle of the green assets [39,40,41]. This stems from the fact that the replaced materials need to be disposed of, new materials have to be manufactured and transported, equipment must be utilized, and energy must be expended to rebuild or renovate the asset.
The waste from such activities increases the building’s environmental impacts, such as global warming—from the building machinery and the operation of the transport and construction vehicles; acidification—caused by emissions from burning of diesel by the building machinery and the operation of the transport and construction vehicles; eutrophication—caused by indirect emissions from the source of electricity supply, and the burning of diesel from the use of building machinery and transport; winter smog—from waste transportation and the production of natural gas; heavy metals—due to toxic effects of heavy metals from disposing and recycling materials; and energy—from electricity and oil usage and production impacts [42]. These risks can be mitigated through the design and specification of robust structures and construction. Therefore, failure to consider maintainability and reparability increases the environmental risk.
The performance of new products and technologies that are being developed for green construction can also pose a risk [31]. This view is based on the fact that green materials are developed rapidly without robust testing of their performance and environmental credentials. This might lead to litigation over specifications or materials that are unfit for purpose or product failure. The legal liability risks—related to tortuous, statutory, and contractual liabilities—eventually reduce the client investment clave. Risk of obsolescence due to a green building’s non-conformance with sustainability issues and consumption of resources may undermine the value of the green real estate [30].

2.5. Management Risks
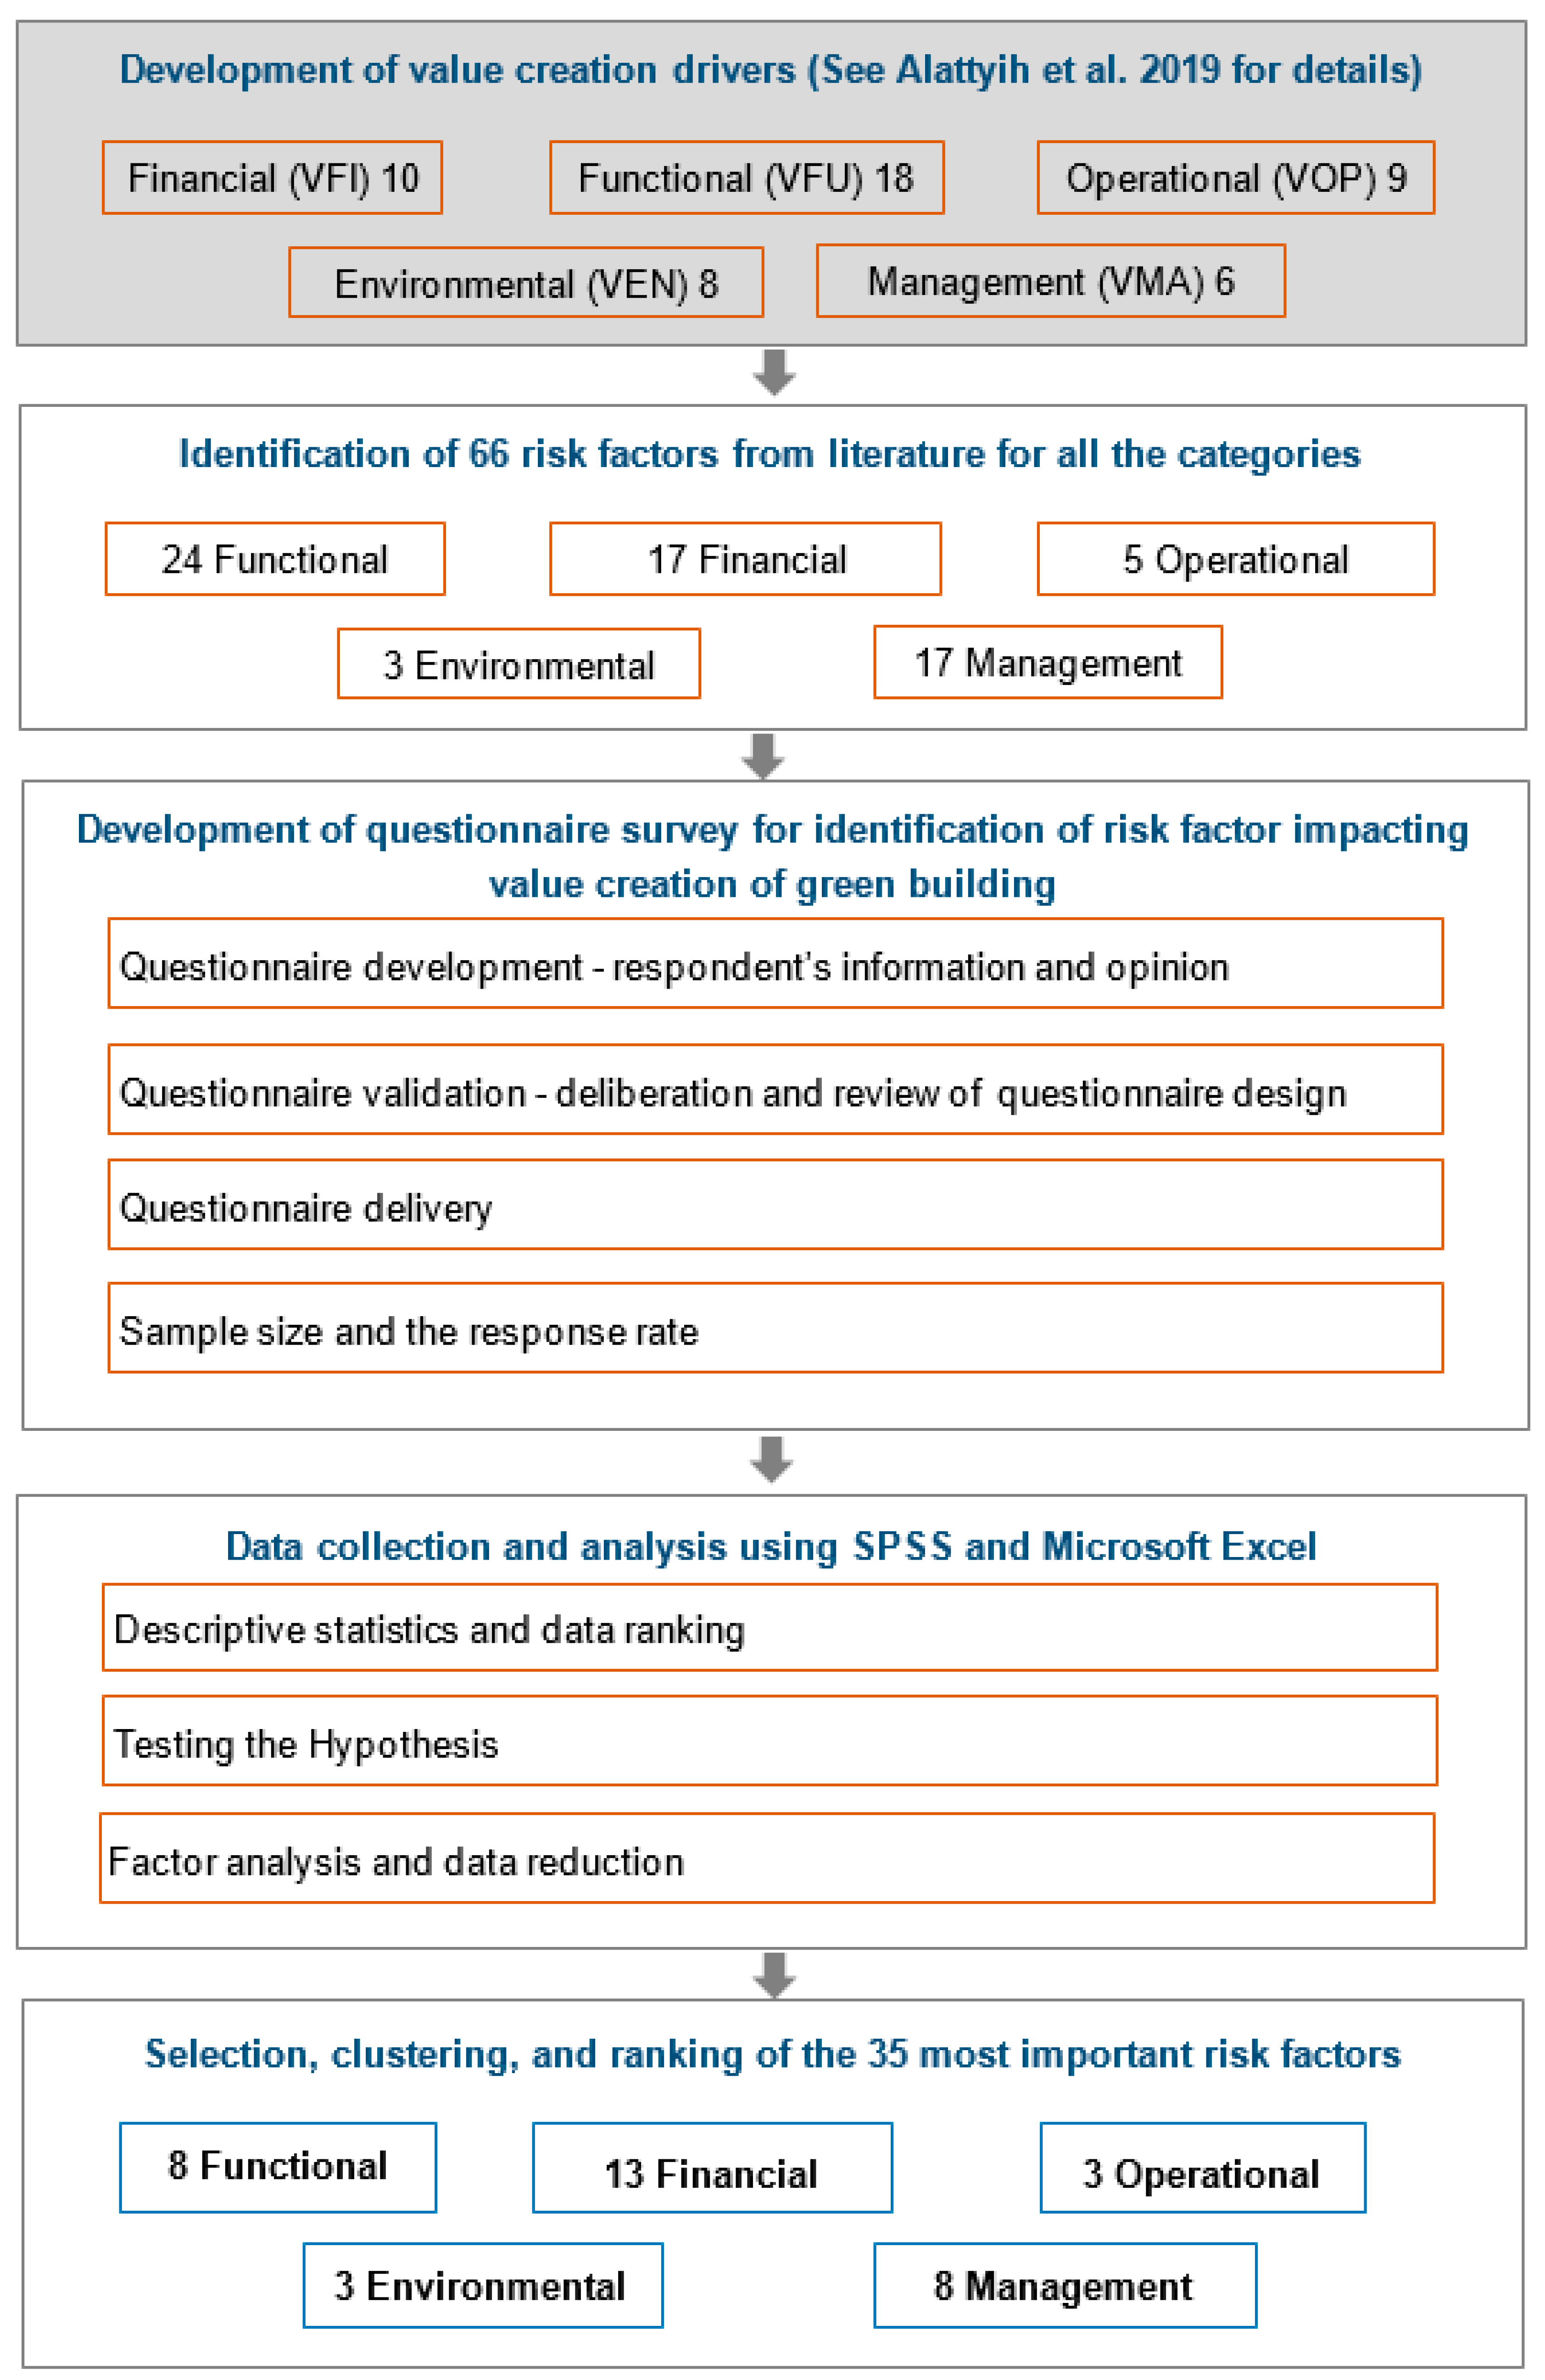
Effective management by an integrated project team is inevitable to create value in the development and operation of green and traditional facilities [43]. Risk management is an important aspect of designing and operating green buildings [44]. There are opportunities to maximize the value and minimize waste in each stage of a building project, i.e., planning, design, procurement, construction, and operations [33]. If the process of development is not well managed, risks may emerge from the lack of integration, coordination, and communication between the project team. The project team should have the foresight to develop and communicate a clear brief and make a realistic budget and cost estimation from the outset. Also, the team should be given enough time, as per the need during the whole project cycle, to plan and complete the project.
If the project execution plan is poorly conceived, it may lead to risks related to poor definition of scope and output specification, poor communication, and poor lines of decision-making. Other management risks include psychological risks associated to the choice of service or product selection and procurement. If the wrong product or service is chosen, capital value may be lost and it might have other negative effects on the whole life cycle chain. In addition, lack of coordination is considered one of the most prevalent endemic risks in a construction project’s development. Furthermore, stakeholder involvement and teamwork is essential for adding and creating value throughout the life cycle of green building development [45]. Table 1 lists 17 managerial risks that have an impact on value creation in green building development.
The identified risk factors in Table 1 were put forward for evaluation by industry professionals to test their impact on value creation in green buildings.

3. Methodology

3.1. Framework for Identification of Risk Factors

Figure 1 illustrates the methodological framework adopted in present research. Through a literature survey and expert judgment, 66 risk factors were found relevant to the context of Saudi Arabia and elsewhere (refer to Table 1). These risk factors were group under five main categories in Section 2, as described above. A questionnaire was developed to obtain the view of professionals in the country on the importance and likelihood of the identified risk factors. Subsequently, the significance of the selected risk factors was evaluated through a hand-delivered questionnaire survey. The responses were statistically analyzed with the help of Statistical Package for Social Sciences (SPSS). Finally, the risk factors with the highest importance were ranked and grouped into clusters to facilitate the shareholders and designers to enhance performance efficiency and obtain more value from investment in green building assets. All these steps are discussed in detail in the subsequent sub-sections.

3.2. Identification of Risk Factors

A detailed literature review developed a list of risks that may have a negative impact on value creation. The extracted risk factors were classified according to value driver groups. A set of 66 risk factors was classified into financial risks, functional risks, operational risks, environmental risks, and management risks. These risk factors, listed in Table 1, were used for developing the questionnaire to assess how each risk will impact value creation in green building development.

3.3. Questionnaire Design and Development

The questionnaire form began by giving an overview and objectives of the research. The first part of the questionnaire gathered the general information of the respondents, while the second part asked the respondents to evaluate and rate the list of identified risk factors. Part 1 obtained two types of information. In the first type, the respondents were asked to provide some general information (optional), such as their names, organization names, email addresses, phone numbers, and postal addresses. The second type of information was related to the job titles and the years of experience of the respondents. Based on the job titles, respondents were categorized into three groups, including manger, engineer, or architect. In order to facilitate subsequent statistical analysis, types of jobs were coded by ordinary numbers for discretion.
Table 1. Risk Factors impacting the project value created by the green buildings design.
GroupCodeRisk FactorsReferences
Functional RisksR20Failure to consider construction implications during designIsa et al. [29]
Al-Yousefi [28]
Zou and Couani [25]
Wiedemer et al. [27]
Green Building Council [30]
Boussabaine and Kirkham [21]
Muldavin [46]
Durmus-Pedini and Ashuri [36]
R19Failure to design to brief/specification
R17Failure to examine specifications due to unnecessary expense
R33Failure to integrate the various systems to achieve the lowest life cycle costs
R21Design changes
R22Redesign/rework
R35Failure to identify low-value, long-lead-time items
R36Failure to consider design risks
R15Failure to consider constructability issues
R16Failure to appreciate design uncertainty
R18Failure to translate specification into the design
R23Failure to consider changes to current design standards
R24Failure to examine attributes which have no useful function
R25Failure to identify and understand functions
R26Unsuitable functional analysis
R27Failure to identify appropriate alternative function
R29Unproven construction techniques
R30Failure to consider legislative/regulation issues
R31Failure to consider new/change in technology
R32Failure to meet performance or design standards
R34Failure to choose/specify reliable materials
R37Failure to consider inter-dependence between components in design
R40Insufficient space and capacity
R41Failure to consider construction health and safety
Financial RisksR11Failure to recognize cost–value mismatchesIsa et al. [29]
Zurich [31]
Zou and Couani [25]
NAO [33]
Haghnegahdar and Asgharizadeh [32]
Boussabaine and Kirkham [21]
Green Building Council [30]
Cajias and Bienert [47]
Eichholtz et al. [48]
Parker [49]
Davies [35]
Muldavin [46]
Durmus-Pedini and Ashuri [36]
R10Failure to identify cost–value relationships
R8Failure to consider the cost of losing potential revenue
R12Failure to appropriately locate cost-to-function allocation
R9Uncertainty about prices
R5Inappropriate cost evaluation criteria
R6Failure to consider future operational costs
R3Failure to consider implication of economic conditions
R1Insufficient funding
R7Failure to recognise cost as resource expenditure
R65Incorrect estimated cost of maintenance
R63Incorrect cost estimate
R66Incorrect estimated cost of energy used
R2Funding is unavailable
R4Inadequate inflation forecasts
R13Failure to identify cost-to-worth relationships
R14Failure to link or identify performance-to-cost relationships
Operational RisksR44Failure to consider increase in routine maintenance Lutkendorft and Lorenz [37]
Zurich [31]
Muldavin [46]
Boussabaine and Kirkham [21]
R45Failure to consider increase in life cycle replacement
R39Failure to consider design impact on operating efficiency
R42Failure to consider component repair and replacement
R46Limited knowledge of maintenance issues
Environmental RisksR38Failure to consider obsolescence of equipment impact Boussabaine and Kirkham [21]; Green Building Council [30]; Muldavin [46]; Zurich [31];
Lützkendorfa and Lorenza [37]
R43Failure to consider maintainability and reparability impact
R47Failure to consider implication of environmental risks
Management RisksR49Poor project management Wi and Junge [45]
Jha and Iyer [50]
NAO [33]
Gritzo et al. [44]
Muldavin [46]
Durmus-Pedini and Ashuri [36]
Shen and Liu [51]
Zou and Couani [25]
R50Poor definition of the scope and objectives of projects
R51Project scope unscheduled items
R57Improper project planning and budgeting
R53Lack of coordination and decision-making
R64Incorrect time estimate
R54Poor team relationships
R28Poor design that may lead to higher operation costs
R48Lack of background information
R52Failure to consider construction techniques
R55Programming issues
R56Failure to consider procurement method
R58Failure to build to design
R59Failure to identify complex items or processes with little or no value added to the facility
R60Failure to consider rate of deterioration of components
R61Lack of considering early failure of components and equipment
R62Failure to consider delay and higher cost due to bad weather conditions during construction
In part 2, a Likert scale ranging from 1 to 5 (very unlikely, unlikely, neutral, likely, and very likely) was used for rating the list of risk factors, because it is easy to construct, modify, and direct use for statistical inference of the numerical measurement for reliable results. The questionnaire acquired the rate the likelihood of risk factors impacting on the project value created by green building design. A sample of the questionnaire is given in Appendix A. Details on questionnaire development and validation can be seen in Alattyih et al. [19].
The population and the sample size were based on the number of professionals having knowledge about the application of value engineering approaches in the Saudi Arabian construction industry. As per SAVE International, more than 1356 people have obtained value engineering certificates in Saudi Arabia [52,53]. Approximately 30 of them are Certified Value Specialist (CVS), i.e., 16% of global certified population. Annually, 60–80 value engineering training workshops and more than 80 VE study programs are being offered in Saudi Arabia and the Arab Gulf countries. Using a confidence interval of 10% and confidence level of 95% from the population of 1356, the research needs at least 76 respondents. Based on the perceived response of less than 50%, the questionnaires were hand-delivered, in person, to a sample size of 300 professionals with value engineering knowledge and experience in the Saudi Arabian construction industry. The participants were randomly selected from various cities in Saudi Arabia, in order to develop research data covering all the country’s major cities.

3.4. Statistical Analysis

SPSS software and Microsoft Excel software performed factor analysis and data reduction. The collected data were processed through two statistical procedures, (i) the data ranking process, that is based on mean weighted rating, standard deviation, severity index and coefficient of variation for the risk factors; and (ii) factor analysis and the data reduction process were utilized to decrease the number of variables in order to handle the task more easily and efficiently.

3.4.1. Descriptive Statistics and Data Ranking

The degree of significance on risk factors, in the context of value created by green building designs in construction projects, is described in the following sections. The comparison of the data ranking took place based on severity indices, average weighted mean, and standard deviation of each risk factor. Further analysis of the data were conducted for ranking based on respondents’ answers and their experience (0–5 years, 6–10 years, and more than 10 years of experience) and their professional job (manager, engineer, or architect).
A mean weighted rating for each value attribute and risk factor was computed to indicate the importance of each indicator, using Equation (1). Meanwhile, the range varies from 1 to 5, therefore, the moderate point for value attributes and natural point for risk factors is 3.
M e a n   w e i g h t e d   r a t i n g =   R × F n
where R is the rating of each value attribute and risk factor (1, 2, 3, 4, 5), F is the frequency of responses, and n is the total number of responses (n = 89).
A severity index (S.I.) measure is employed in order to rank the indicators according to their significance, which is the higher the percentage (%), the more significant the attribute/factor. Equation (2) shows how the S.I. is calculated
S . I .   =   ( W × F n ) × 100
where W is the weight of each rating (1/5, 2/5, 3/5, 4/5, 5/5).
The coefficient of variation (COV) is an expression of standard deviation as a percentage (%) of the mean, which is for comparison of the relative variability of various responses. Better variability is shown by a lower variation coefficient. The COV was computed as a ratio between standard deviation and mean.

3.4.2. Testing the Hypotheses

The means and standard deviations and the coefficient of variations’ values were quite close together for the three groups of respondents (mangers, engineers, and architects). Therefore, SPSS software was used for further analysis. ANOVA test analysis was conducted in order to justify the statistical differences between the groups’ responses.
The SPSS software was used with a significance level of 0.05 to examine the differences between the groups regarding the likelihood of the risk impacting on the project value creation of green building development using the following hypothesis testing:
H0: 
p > 0.05—There is no significant difference among the respondents’ ratings for the likelihood of risk factors impacting the value created by green building design.
H1: 
p < 0.05—There is significant difference among the respondents’ ratings for the likelihood of risk factors impacting the value created by green building design (at least one of the groups is significantly different from other groups).
After that, a follow-up test was conducted to make multiple comparisons if there is significant difference among the respondents. The follow-up test used in this research was the post hoc multiple comparison test. The Turkey test is one of the post hoc tests used as the sample size is uneven.

3.4.3. Factor Analysis and Data Reduction

A number of risk factors with the highest degree of likelihood of risk factors impacting on project value creation might be considered as representative of the whole set of data. Therefore, the most significant factors are extracted and treated as representative of the whole set of risk indicators. Based on the factors’ relationship and correlations, the outcome of the data reduction develops a few clusters that consist of the most important risk factors of the original large group of 66 risk factors. A clear understanding of new risk clusters and their implications will be instrumental in assessing and evaluating the value creation and their performances in green building design.
The factor analysis technique investigated if there is an underlying relationship between the different factors within a questionnaire. Figure 2 illustrates the overall analysis process. The factor analysis process determines the strength of the relationship between the variables, extracts a matrix of correlation coefficients, and finally extracts the components that have an eigenvalue of 1 or more from this matrix, which is the most common method of extraction in principal component analysis. The data reduction process identifies the variables that correlate highly with a set of other variables for clustering them in a meaningful way. The next stage generates a rotated component matrix to find out the risk factors that have a more effective influence on each component. Through identifying redundant data, the existing 66 risk factors were reduced down to 35 most important risk factors for green building design. Figure 2 shows that, through the use of data reduction in SPSS, the risk factors have been categorized into five clusters.
Usually, a few components account for most of the variation, and these components can be considered to replace the original variables [54,55,56]. The results presented in the following section extract the most important risk factors that are essentially the representatives of the whole set of risk factors. The degree of significance of each risk factor in green building design varies according to its impact on a construction project.
Reliability analysis practically validates the properties of a measurement scale and checks the reliability of the items. Low reliability shows that the items that make up the scale do not correlate strongly enough; thus, they might not be selecting the same construct domain. As a measure of reliability, Cronbach’s Alpha was calculated to check the consistency of the research items and to identify problem items that need to be excluded from the scale [57]. Based on George and Mallory’s [58] measures, Cronbach’s Alpha is assessed in Table 2. The reliability of the data was checked for the risk factors by using Cronbach’s test. The Cronbach’s Alpha values of risk factors was 0.969 and shows good to excellent internal consistency of the components.

4. Results and Discussion

4.1. Descriptive Statistics and Data Ranking

Identification of risk factors, associated with value and evaluation of their level of influence, plays a pivotal role in the project value created by the green building design. The risk factors were ranked based on their likelihood of impacting the project value created. Out of 300 professionals, 89 returned their fully completed questionnaire. This is an acceptable response rate (29.7%) as the typical response rate for a postal questionnaire survey in the construction industry is 20–30% [59]. The survey response revealed than 45% of the respondents were managers, 38% were engineers, and 17% were architects. Around 16% of the respondents were young, having 0–5 years of experience, 28% had experience ranged between 6 and 10, while the largest contribution was from senior respondents possessing more than 10 years of experience in the profession. Among the top 30 factors, the following discussion is limited to the top 3 and the bottom 10 risk factors.
As the detailed statistical ranking results cannot be presented due to space limitations, a summary of the overall ranking and the ranking by each expert along with their years of experience is presented in Appendix B. The appendix shows that the average weighted mean for the risk factors varies from 3.33 to 4.24, with an overall mean of 3.78. The severity indices range within 66.52% to 84.72%. The highest-ranked factor is R35 (failure to identify low-value, long-lead-time items) with a mean of 4.24 and severity index of 84.72%. An overall examination of the first 30 ranked risk factors indicates that all of them have a minimum mean value of 3.81 (which is higher than the average overall mean of 3.78) and severity indices of 76.18%. This means that the first 30 ranked risk factors seem to be important as viewed by the respondents. They are namely: R1, R3, R5, R6, R7, R8, R9, R12, R17, R20, R21, R22, R28, R33, R35, R36, R39, R44, R45, R49, R50, R51, R53, R54, R57, R63, R64, R65, and R66.
Factor R64 (i.e., incorrect time estimate) has the second highest rank for the risk factors with a mean of 4.18 and a severity index of 83.60% and it is ranked as first out of 66 by the engineers and architects, and also by the experts with more than 10 years’ experience. The managers ranked it fifth out of 66, and the other rankings based on years of experience are: 0 to 5 and 6 to 10 years ranked it ninth and second out of 66 respectively. The third overall ranking was for R28 (i.e., poor design that may lead to higher operation costs), and the six groups of respondents also ranked it as one of their top 20 highest-ranked risk factors. R28 has a mean of 4.10, severity index of 82.02% and low coefficient of variation of 22.97%.
The last 10 factors, amongst the top 30, have average weighted means for the risk factors that vary from 3.81 to 3.84 and severity indices that range between 76.18% and 76.85%. They have the following overall ranking, R54 (poor team relationships) is ranked 21st out of 66; r50 (poor definition of the scope and objectives of projects) is ranked 22nd; r20 (failure to consider construction implications during design) is ranked 23rd; r9 (uncertainty about prices) is ranked 24th; r33 (failure to integrate the various systems to achieve the lowest life-cycle costs) is ranked 25th; r66 (incorrect estimated cost of energy used) is ranked 26th; r12 (failure to appropriately locate cost-to-function allocation) is ranked 27th; r45 (failure to consider increase in life cycle replacement) is ranked 28th; R3 (failure to consider implication of economic conditions) is ranked 29th; and factor R11 (failure to recognize cost–value mismatches) is ranked 30th out of 66.

4.2. Testing the Hypothesis

The section examines the mind-sets of construction project professionals who were involved in value management/engineering in relation to how they value and perceive the likelihood of the risk factors having an impact on value creation in the green building design.
Overall, the ANOVA results showed no significant difference (p > 0.05) amongst different participants (i.e., managers, engineers, and architects) for all the factors and there is no need for the H1 hypothesis. Figure 3 shows the overall perspectives of the average rating for the likelihood of risk factors having an impact on the project value created by green building design. The architects give a higher ranking for the overall average mean than the engineers and managers. All of the top 20 factors ranked by the architects have a mean of over 4.13 and the average overall mean for all the factors is 3.91. In contrast, the mean average for the managers’ responses is 3.79, and for the engineers it is 3.72. Based on these results, it is clear that all three groups of respondents agree that most of the risk factors have a high impact on the project value created by green building design.

4.3. Factor Analysis

Two statistical tests were carried out on data before conducting factor analysis to indicate the suitability of the data for structure detection. The first test is Kaiser–Meyer–Olkin (KMO) that measures sampling accuracy to indicate the proportion of variance of the variables that might cause by the underlying factors. High values close to 1.0 in the KMO test indicate that a factor analysis is useful for the data while the values less than 0.50 indicate that the results of the factor analysis are not useful. Also, KMO values between 0.5 and 0.7 are good, between 0.7 and 0.8 are very good, and above 0.8 are excellent. The Bartlett Test of Sphericity tests the hypothesis that the correlation matrix is an identity matrix, i.e., a small significance level of less than 0.05 indicates the need for factor analysis [55,56,57]. Field [55] mentions that a value close to 1 indicates that the patterns of correlations are relatively compact and the factor analysis will provide distinct and reliable factors. Kaiser [60] recommended accepting values greater than 0.5 as acceptable. In the present research, the corresponding value for KMO was 0.702 and Bartlett test found significance value of ‘0’. As the KMO value was found close to 1, the factor analysis is likely to be appropriate and acceptable.
Bartlett’s test measures the null hypothesis (H0: p > 0.05) and shows that the original correlation matrix is an identity matrix. Therefore, factor analysis needs some relationships between variables and the significance value to be (p < 0.05). By considering the significance level of 0.05, Bartlett’s test showed the p-values for the likelihood of risk impact were highly significant. This test shows that the correlation matrix is not an identity matrix, so there are some relationships between the variables. Both KMO and Bartlett tests demonstrated that factor analysis is appropriate for these data.
Table 3 presents the components extracted by the principal component analysis (PCA). The likelihood of risk factors impacting on the value created by green building design shows that just 16 components carry an eigenvalue of more than 1 and account for nearly 79.939% of the whole variance. Consequently, the 16 components can be considered as representative of the 66 factors included in this study.
In the subsequent phase of factor analysis, a rotated component matrix was extracted to find out the risk factors with the highest level of influence on project value creation. Table 4 presents the summary of factor analysis results. The matrix loading scores in Table 3 extracted the most effective factors of each component. The factors with the highest scores and correlation values were chosen for each component. For example, the risk factor (R1; 0.808) has greater influence on component 13 compared to other components, whereas the risk factor R46 (0.843) has more influence on component 4 in relation to other components, and R57 (0.762) has more influence on component 9 in relation to other components.
Table 3 also shows the strength of the relationship between the variables and the extracted matrix of correlation coefficients, and then extracts the components that have an eigenvalue of more than 1 from the matrix of correlation coefficients. The results present the variables that highly correlate with a set of other variables. The eigenvalues for the components varied between 33.91 and 1.54, and the rotated variance load varied between 9.13% and 2.63%. Each component has more than two factors with a loading score of more than 0.4. The value attributes that have a loading score of more than 0.4 were reduced and redundant data were eliminated in the clustering stage in order to obtain a few variables that present the risk characteristics and their impacts on value created by green building design. Further reduction was carried out in the subsequent section based on their ranking by the professionals.
Table 4 presents the factor analysis and data reduction results for the five new clusters that were molded based on the 16 extracted components and their most important risk factors in Table 3. The new clusters were considered as risk indicator clusters that impact the value creation and can be used for managing the project risks at tolerance level. The variance percentage of each risk factor was extracted from Table 3 while the variance of each cluster was calculated by summation of each component’s variance in the same generated cluster. For example, the functional risk cluster in Table 4 is one of five clusters for impact of risk factors on value creation. The cluster encompasses component 8 (variance of 4.76%) that presents R20, R19, and R17; component 11 (variance of 3.69%) that presents R21 and R22; component 10 (variance of 4.34%) that presents R33; and component 14 (variance of 3.501%) that presents R35 and R36 as the main indicators of its set. Consequently, the percentage of variance for this cluster (Functional risk) in Table 5 was calculated as 4.762 + 3.686 + 4.338 + 3.501 = 15.876%.
In Table 5, the risk factors grouped in five clusters are highly manageable without losing a large amount of data, and therefore just 100% − 79.9% = 20.1% of the existing information was compromised. Using the method of factor analysis and data reduction, the questionnaire’s 66 factors were reduced to 16 components and then grouped/categorized into five fundamental clusters. The five fundamental clusters include just 35 original factors from the questionnaire that represent the most relevant data on risk indicators that impact value creation.

4.3.1. Cluster 1: Financial Risk

The cluster of financial risk comprises components 1, 3, 7, 13, and 15 and represents 28.44% of the total explained variance. The cluster represents 13 risk indicators. The likelihood of the impact of these risks would have a large influence on financial investment, especially the capital expenditure cost (CAPEX) and operating expenditure cost (OPEX). The risk indicators in this cluster should be considered during the early stage of a design because they reflect the impact on economic and monetary aspects for the project’s life. The selected indicators are, failure to recognize cost–value mismatches, failure to identify cost–value relationships, failure to consider the cost of losing potential revenue, failure to appropriately locate cost to function allocation, and failure to consider future operational costs and economic conditions as well as incorrect estimated cost and/or insufficient funding.

4.3.2. Cluster 2: Functional Risk

The functional risk cluster identifies the risk indicators that impact the functional performance and affect the asset’s functional reliability. The cluster consists of eight risk indicators distributed into four components—i.e., 8, 10, 11, and 14—with a total variance of 15.876%. The risks relate to design considerations such as construction implication, specification, systems, and/or changes in design.

4.3.3. Cluster 3: Operational Risk

The operational risk cluster variance is 6.613% and comprises three risk indicators, including failure to increase routine maintenance, failure to consider increase in life cycle replacement and failure to consider design impact on operating efficiency. The impacts of these indicators might have a large effect on project life efficiency.

4.3.4. Cluster 4: Environmental Risk

The environmental risk cluster consists of components 2, 5, and 12 with a variance of 17.259% and three risk indicators. These risks could have a negative effect on the building’s efficiency and might also have an unsafe environmental impact. The selected risk indicators in the environmental cluster include failure to consider implication of environmental risks, failure to consider the impact of maintainability and reparability, and failure to consider the impact of obsolete equipment.

4.3.5. Cluster 5: Management Risk

The management risks influence the project management performance, which reduces the project’s ability to deliver within the required objectives. In this cluster, eight risk indicators were distributed into components 6, 9, and 16 with a total variance of 12.295%. The management risk indicators should be considered at an early stage of a project in order to avoid any obsolescence and to manage the risk at tolerance level. The risk indicators in this cluster concern poor project management, project definition, planning, team relationships, and design; incorrect time estimates; as well as lack of coordination and decision-making.

4.4. Impact of Risk Factors to Value Creation

4.4.1. Financial Risks

The financial value or economic value from green assets can be undermined if the risk factors are not factored into the design and operation of these assets [30]. Furthermore, financial risks in green buildings are attributed to the additional capital cost for the inclusion of green strategies in the design. From a value engineering analysis point of view, financial risks relate to the fact that stakeholders are unable to take into consideration the risks and the opportunities associated with the risks shown in Figure 4. The figure indicates that engineers perceived R11 “Failure to recognize cost–value mismatches”, R10 “Failure to identify cost–value relationships”, and R12 “Failure to appropriately locate cost-to-function allocation” risks are less important in identifying value. This result is not in keeping with the literature because these three risks are the foundation on which value engineering analysis is based. One plausible explanation of this anomaly is that, compared to Western practices, the Kingdom of Saudi Arabia (KSA)’s practices do not consider this as important.
The results in Figure 4 show that managers did not highly rank R7 “Failure to recognize cost as resource expenditure”, R8 “Failure to consider the cost of losing potential revenue”, R66 “Incorrect estimated cost of energy used” risks. Although these risks are important in value entering analysis, the KSA managers perceived these risks differently. This could be attributed to the fact that most buildings in KSA are publicly owned, hence issues like revenue and energy costs are not considered important. Although future energy cost, performance of new green technologies and functional performance are uncertain, architects thought R9 “Uncertainty about prices” risk may not have much impact on value. All respondents agreed that R1 “Insufficient funding”, R65 “Incorrect estimated cost of maintenance”, and R63 “Incorrect cost estimate” risks will influence value analysis. Other risk factors such as R5 “Inappropriate cost evaluation criteria, R6 “Failure to consider future operational costs”, and R3 “Failure to consider implication of economic conditions” were perceived as important by the respondents. This reiterate the view expressed in the literature that the investment appraisal must address various options for creating the value required from green buildings. Failure to consider implications of economic conditions and to recognize cost as a resource expenditure will certainly lead to the risk of affordability and to the risk that whole-life cost estimates are not realistic and are based on unreliable evidence or assumptions. This in turn will lead to income and the future value of real estate assets being affected.

4.4.2. Functional Risks

Functional risks are associated to the building asset condition over its life span. The building design function and its components’ specifications are generally based on assumptions. Changes in the assumptions of these parameters may lead to different levels of performance and reliability. Thus, the design of green buildings must be subject to risk analysis to assess the uncertainties associated with the function and design parameters. Figure 5 portrays the respondents’ perceptions about the functionality risks. The figure below clearly indicates that architects’ views on R19 “Failure to design to brief/specification”, R20 “Failure to consider construction implications during design”, R21 “Design changes”, R22 “Redesign/rework”, and R36 “Failure to consider design risks” are in keeping with the other respondents’ views. This result may suggest that because these risk factors are design-related and architects generally tended to approach their design with the bias.
The results also showed that there is total agreement on the importance of R35 “Failure to identify low-value, long-lead-time items”. However, the engineers’ view was in accordance with that of the architects for R33 “Failure to integrate the various systems to achieve the lowest life-cycle costs”. Again, this result is not in keeping with literature regarding Western economies, where lowest life cycle costs are considered an important value generator [21]. This reaffirms that the risk of obsolescence of the green building functions or those of its components will result in larger OPEX and may undermine the value of the asset, leading to lower income, smaller capital receipts, higher costs, and the possibility of legal action [30].

4.4.3. Operational Risks

The operational performance of green buildings has a significant impact on their rental and market value. The investors are protecting and increasing the value of their investment in green real estates by incorporating initiatives to improve the energy efficiency and sustainability of their portfolios [30]. Nevertheless, many in the construction industry view the performance of green products, systems, and buildings as a risk [31]. Thus, considering operational features during the early stages of value planning will probably go a long way to protect and increase the investment value in green real estate by taking into consideration risks and initiatives to improve the energy efficiency and sustainability of assets throughout their entire life cycle. Figure 6 below portrays the respondents’ perceptions about the operational risks that might have an impact on value creation in green building development if not taken into consideration during the value engineering analysis process.
Figure 6 shows that only R45 “failure to consider increase in life cycle replacement”, R44 “failure to consider increase in routine maintenance”, and R39 “failure to consider design impact on operating efficiency” risks were scored highly by the respondents, whereas R42 “failure to consider component repair and replacement” and R46 “limited knowledge of maintenance issues” risks were viewed as not important. In fact, it is surprising to see that risk R42 is ranked 64 out of 66 risks. Component repair and replacement is an integral part of whole life cycle management strategies. Both have an impact on OPEX budget and asset availability (directly associated with vacancy and the rental value risks).

4.4.4. Environmental Risks

The environmental risks are associated with minimizing the impacts on the environment throughout the development and operation of green building facilities. The ethos behind green building development is to create facilities that must minimize waste and energy use throughout their life cycle stages. To cope with the rapid development in the green building sector, green materials were developed without robust testing of their performance and environmental credentials that may lead to liability litigation over unfit for purpose specification, material or product failure, obsolescence, durability, etc.
Figure 7 illustrates that architects thought R47 “failure to consider implication of environmental risks” risk ought to be taken into consideration in value engineering analysis, whereas engineers and managers considered R38 “failure to consider obsolescence of equipment impact” as an important risk to consider. The results might have been influenced by the professional bias. Architects ranked R43 “failure to consider maintainability and reparability impact” slightly higher than the other respondents. The way in which green buildings are conceived, constructed, operated, and disposed of will influence (or increase) the environmental impacts during their lifecycle, including global warming, acidification, eutrophication, winter smog, heavy metals, and energy [42]. The ANOVA results in Table 6 show that there were significant differences between the respondents regarding R38: failure to consider obsolescence of equipment impact risk.

4.4.5. Management Risks

There is ample evidence in the literature to suggest that it is essential to have a skills and integration project team coupled with effective management processes to unlock value during the early stage of value planning as well as during the development operation of green facilities. The endeavor of the project should be geared towards identifying risks and opportunities to maximize value and minimize waste at every stage of the construction and procurement process, from the minute that the need for a building is identified to when it is ready for operation [33,61]. Figure 8 illustrates the respondents’ perceptions about the management risks that might have an impact on value created by green building development if not taken into consideration during the value engineering analysis process. Out of the 17 managerial risk factors identified in the literature, only half of them were found to be having a negative impact on value creation attributes of green buildings, i.e., R28, R49, R50, R51, R53, R54, R57, and R64.
All respondents agree on considering R28 and R49 risks during the appraisal of green buildings. However, engineers viewed R51 and R50 risks different to other participants. This might suggest that engineers in KSA are not often involved in the very early stages of the design process. However, the findings here are consistent with Shen and Liu [51] who listed the factors that might influence the success of using value analysis in construction projects.

5. Conclusions

Present research analyzed various aspects of risk to optimize the value creation in the development of green buildings. Sixty-six (66) risk factors were classified in 5 risk categories, including functional, financial, operational, environmental, and management, with an objective to evaluate the impacts of these risks on the value creation of green buildings design. A questionnaire compiling a list of identified risk factors was hand-delivered to 300 practitioners working for value engineering of the construction industry in Saudi Arabia. The overall response rate was 29.7%. Among the respondents, 45% were managers, 38% were engineers, and 17% were architects who participated in the survey. The participation from young professionals with 0–5 years of experience was 16%, and from the middle-career professionals with 6–10 years of experience was 28%. Interestingly, senior professionals with more than 10 years of experience held the largest contribution (56%) among all the respondents.
Based on the participants responses, descriptive statistics identified important risk factors with a minimum mean value of 3.81 (i.e., higher than the average overall mean of 3.78) and severity indices of 76.18%. Furthermore, the principal component analysis (PCA) extracted 16 components, based on the likelihood of risk factors impacting the value created by green building design, that carry an eigenvalue of more than 1 and account for nearly 79.939% of the whole variance. Finally, the factor analysis grouped 35 most significant risk factors in 5 clusters, i.e., 8 in functional risk, 13 in financial risk, 3 in operational risk, 3 in environmental risk, and 8 in management risk cluster.
Due to the differences in perception regarding the risk factors, there is a need for improved communication between the decision-makers’ groups for developing a shared understanding of project value creation and associated risks. Absence of such understanding may raise the possibility of conflicts amongst different groups that ultimately effects the expected outcomes of the project. Future work can establish the interaction between various value drivers (identified in the authors’ previous work) and the risk factors (selected in the present study) using an effective framework to enhance value creation in green buildings. Furthermore, the impact of the risk factors on project constrains—i.e., quality, cost, and time—can also be investigated.
A clear understanding of new risk clusters and their implications will be instrumental in assessing the design indicators and evaluating the impact of risk factors on value creation of green building in Saudi Arabia and elsewhere in the world.

Author Contributions

W.A.—conceptualization, methodology, survey, performed detailed data collection and analysis, software, and original manuscript. H.H.—conceptualization, methodology, and paper writing. H.B.—conceptualization, methodology, administration, supervision, visualization, and paper review. All authors have read and agreed to the published version of the manuscript.

Funding

The research was sponsored by Qassim University, Ministry of Education, Saudi Arabia.

Acknowledgments

The author gratefully acknowledges respondents from the construction industry in Saudi Arabia. The first author acknowledges the financial support secured at Qassim University that was provided by the Saudi Cultural Bureau in United Kingdom under the Higher Education Scholarship Program of Saudi Arabia. Authors also like to thank the School of Engineering, Faculty of Science and Engineering, University of Liverpool, UK for providing the technical support for this research.

Conflicts of Interest

The authors declare no conflict of interest.

Appendix A

Sample of the second part of the design questionnaire for the risk factor
What is the likelihood of the following risk factors having an impact on the project value created by green building design?
No.Risk FactorsRate the Likelihood Impact of the Risk Factors on Project Value Creation (Please Tick One Box)
Very LikelyLikelyNeutralUnlikelyVery Unlikely
1Funding is unavailable
2Failure to consider implication of economic conditions
3Inadequate inflation forecasts
4Inappropriate cost evaluation criteria
...

Appendix B

Rating the likely impact of the risk factors
CodeMeanStd. DeviationSeverity indexCoefficient of variationRanking
ManagerEngineerArchitect0 to 5 years6 to 10 yearsMore than 10 yearsOverall Ranking
R14.090.86181.8021.0667818464
R23.631.27472.5835.1059354424366256
R33.810.94076.1824.683528313513329
R43.760.96675.2825.6554172633413235
R53.940.87178.8822.08226254534513
R63.961.06579.1026.931718321181612
R73.850.99577.0825.813925444351519
R83.850.88677.0822.9934162429501220
R93.831.06976.6327.8920344243461424
R103.781.02075.5127.0128492342542033
R113.810.95276.1824.9926531320591830
R123.820.86076.4022.5223431822452127
R133.720.96574.3825.9530603541632341
R143.630.98172.5827.0445634159623555
R153.541.13970.7932.1756663451655261
R163.701.17273.9331.7038484840404543
R173.880.93977.5324.233311172263017
R183.690.98473.7126.7018596150255648
R193.790.95975.7325.3321156239432432
R203.830.99176.6325.8719145725312723
R214.040.92880.9022.954840233117
R224.040.95280.9023.5531339121096
R233.690.93773.7125.4137406038374746
R243.760.96675.2825.653230505585134
R253.531.09870.5631.1353526565526062
R263.431.09668.5431.9965576366296565
R273.561.02271.2428.6962385957226359
R284.100.94282.0222.97741217743
R293.640.94472.8125.9458275332395854
R303.331.10666.5233.2466655462486666
R313.690.98473.7126.7052461631215947
R323.581.00971.6928.1649625261614058
R333.820.96076.4025.1312474311382825
R343.741.02874.8327.4840235137443438
R354.240.73984.7217.441521131
R364.030.88580.6721.942193856138
R373.800.89475.9623.5416335636302931
R383.651.07873.0329.5129326658474453
R393.920.94478.4324.081412336202215
R403.541.15970.7932.7361376456536160
R413.601.06371.9129.5657514716645357
R423.440.95368.7627.7264615860586464
R433.510.97870.1127.9163565547665763
R443.870.85577.3022.13253611894118
R453.820.88676.4023.2013424910323128
R463.701.00573.9327.185529364564644
R473.760.93075.2824.7050221535283936
R483.731.04274.6127.9336581419245439
R494.000.95380.0023.841010102811810
R503.830.98076.6325.5715502215144222
R513.890.84577.7521.7411412130152516
R523.721.08774.3829.2344453253195042
R533.960.83879.1021.198212014131711
R543.841.01076.8526.292724304855721
R553.651.03573.0328.3341643713604852
R563.750.94575.0625.1847262946164937
R573.921.06878.4327.25319726171914
R583.720.95374.3825.6343541952234340
R593.660.96573.2626.3442554649335551
R603.660.91673.2625.0260312864423750
R613.660.98873.2626.9748444563572649
R623.691.08373.7129.3851392754493645
R634.080.81581.5719.98929341225
R644.180.89983.6021.515119212
R654.010.87280.2221.752436275109
R663.821.06176.4027.78462057273826

References

  1. Green Building. What is Green Building. Available online: https://greenbuildingcanada.ca/green-building-guide/what-is-green-building (accessed on 15 October 2020).
  2. He, B.J. Towards the next generation of green building for urban heat island mitigation: Zero UHI impact building. Sustain. Cities Soc. 2019, 50, 101647. [Google Scholar] [CrossRef]
  3. Zinzi, M.; Agnoli, S. Cool and green roofs. An energy and comfort comparison between passive cooling and mitigation urban heat island techniques for residential buildings in the Mediterranean region. Energy Build. 2012, 55, 66–76. [Google Scholar] [CrossRef]
  4. Alotaibi, K.; Ghumman, A.R.; Haider, H.; Ghazaw, Y.M.; Shafiquzzaman, M. Future predictions of rainfall and temperature using GCM and ANN for arid regions: A case study for the Qassim Region, Saudi Arabia. Water 2018, 10, 1260. [Google Scholar] [CrossRef] [Green Version]
  5. Alkolibi, F.M. Possible effects of global warming on agriculture and water resources in Saudi Arabia: Impacts and responses. Clim. Chang. 2020, 54, 225–245. [Google Scholar] [CrossRef]
  6. Shin, M.H.; Kim, H.Y.; Gu, D.; Kim, H. LEED, its efficacy and fallacy in a regional context—An urban heat island case in California. Sustainability 2017, 9, 1674. [Google Scholar] [CrossRef] [Green Version]
  7. Dwaikat, L.N.; Ali, K.N. The economic benefits of a green building–Evidence from Malaysia. J. Build. Eng. 2018, 18, 448–453. [Google Scholar] [CrossRef]
  8. MacNaughton, P.; Cao, X.; Buonocore, J.; Cedeno-Laurent, J.; Spengler, J.; Bernstein, A.; Allen, J. Energy savings, emission reductions, and health co-benefits of the green building movement. J. Expo. Sci. Environ. Epidemiol. 2018, 28, 307–318. [Google Scholar] [CrossRef]
  9. Connaughton, J.N.; Green, S.D. Value Management in Construction: A Client’s Guide; CIRIA: London, UK, 1996. [Google Scholar]
  10. Banaitiene, N.; Banaitis, A. Risk Management in Construction Projects. Risk Management–Current Issues and Challenges. In Risk Management–Current Issues and Challenges; Banaitiene, N., Ed.; IntechOpen: London, UK, 2012; pp. 429–448. [Google Scholar]
  11. Godfrey, P.S. Control of Risk a Guide to the Systematic Management of Risk from Construction; CIRIA: London, UK, 1996. [Google Scholar]
  12. Langford, D. Revaluing Construction-Hard and Soft Values. In CIB Priority Theme-Revaluing Construction: A W065 ‘Organisation and Management of Construction’ Perspective; Sexton, M., Kaehkoenen, K., Lu, S., Eds.; Ciblibrary: Ottawa, ON, Canada, 2007; pp. 66–75. [Google Scholar]
  13. Gao, Y.; Yang, G.; Xie, Q. Spatial-Temporal Evolution and Driving Factors of Green Building Development in China. Sustainability 2020, 12, 2773. [Google Scholar] [CrossRef] [Green Version]
  14. ICE. Design and Practice Guide, Creating Value in Engineering; LoThomas Telford: London, UK, 1996. [Google Scholar]
  15. Leek, S.; Christodoulides, G. A framework of brand value in B2B markets: The contributing role of functional and emotional components. Ind. Mark. Manag. 2012, 41, 106–114. [Google Scholar] [CrossRef]
  16. Boussabaine, A. Cost Planning of PFI and PPP Building Projects; Taylor & Francis: Abingdon, UK, 2007. [Google Scholar]
  17. Alalshikh, M. The Development of a Value Management Approach for the Saudi Public Sector. Unpublished. Ph.D. Thesis, University of Leeds, Leeds, UK, 2010. in press. [Google Scholar]
  18. Snoj, B.; Pisnik Korda, A.; Mumel, D. The relationships among perceived quality, perceived risk and perceived product value. J. Prod. Brand Manag. 2004, 13, 156–167. [Google Scholar] [CrossRef]
  19. Alattyih, W.; Haider, H.; Boussabaine, H. Development of Value Creation Drivers for Sustainable Design of Green Buildings in Saudi Arabia. Sustainability 2019, 11, 5867. [Google Scholar] [CrossRef] [Green Version]
  20. Tiong, R.L. BOT projects: Risks and securities. Constr. Manag. Econ. 1990, 8, 315–328. [Google Scholar] [CrossRef]
  21. Boussabaine, H.A.; Kirkham, R.J. Whole Life-Cycle Costing: Risk and Risk Responses; Blackwell Publishing Ltd.: Oxford, UK, 2008. [Google Scholar]
  22. Medda, F. A game theory approach for the allocation of risks in transport public private partnerships. Int. J. Proj. Manag. 2007, 25, 213–218. [Google Scholar] [CrossRef]
  23. Zou, P.X.; Zhang, G.; Wang, J. Understanding the key risks in construction projects in China. Int. J. Proj. Manag. 2007, 25, 601–614. [Google Scholar] [CrossRef]
  24. Yang, J.; Zou, P.; Keating, B. Analysing Stakeholder-Associated Risks in Green Buildings: A Social Network Analysis Method. In WBC13; Queensland University of Technology: Brisbane, Australia, 2013; pp. 1–12. [Google Scholar]
  25. Zou, P.; Couani, P. Risks in green building development: A supply chain perspective. In Proceedings of the 36th Australasian University Building Educators Association (AUBEA) Conference, Gold Coast, Queensland, Australia, 27–29 April 2011. [Google Scholar]
  26. National Research Council. The Owner’s Role in Project Risk Management; The National Academies Press: Washington, DC, USA, 2005. [Google Scholar]
  27. Wiedemer, J.P.; Goeters, J.E.; Graham, J.E. Real Estate Investment: South.-Western Cengage Learning; South-Western Educational Pub: Mason, OH, USA, 2011. [Google Scholar]
  28. Al-Yousefi, A. Value Management: Concept & Techniques, 4th ed.; Twaig Publishing: Riyadh, UAE, 2004. [Google Scholar]
  29. Isa, M.; Rahman, M.M.G.M.A.; Sipan, I.; Hwa, T.K. Factors Affecting Green Office Building Investment in Malaysia. Procedia Soc. Behav. Sci. 2013, 105, 138–148. [Google Scholar] [CrossRef] [Green Version]
  30. Green Building Council. The Bussine Case Green Building: A Review of the Costs and Benefits for Developers Investors and Occupants. Available online: http://www.worldgbc.org/files/1513/6608/0674/Business_Case_For_Green_Building_Report_WEB_2013-04-11.pdf (accessed on 20 August 2015).
  31. Zurich Green Building: What are the Risks? Zurich Services Corporation: Schaumburg, IL, USA, 2011.
  32. Haghnegahdar, L.; Asgharizadeh, E. The Risk and Value Engineering Structures and their Integration with Industrial Projects Management (A Case Study on IK Corporation). World Acad. Sci. Eng. Technol. 2008, 40, 375–383. [Google Scholar]
  33. NAO. Getting Value for Money from Construction Projects through Design: How Auditors Can. Help, Guidelines to Help Auditors Take Account of Good Design in Public Sector Built Environment Projects; Davis Langdon & Everest. Stairway Communications Ltd.: London, UK, 2004. [Google Scholar]
  34. Kim, S.; Lim, B.T.H.; Kim, J. Green Features, Symbolic Values and Rental Premium: Systematic Review and Meta-analysis. Procedia Eng. 2017, 180, 41–48. [Google Scholar] [CrossRef]
  35. Davies, R. Green Value Report: Green Building, Growing Assets; Royal Institution of Chartered Surveyors: London, UK, 2005. [Google Scholar]
  36. Ashuri, B.; Durmus-Pedini, A. An overview of the benefits and risk factors of going green in existing buildings. Int. J. Facil. Manag. 2010, 1, 1. [Google Scholar]
  37. Lützkendorf, T.; Lorenz, D. Integrating Sustainability Issues into Property Risk Assessment–An Approach to Communicate the Benefits of Sustainable Design. In Proceedings of the Rethinking Sustainable Construction Conference, Sarasota, FL, USA, 19–22 September 2006. [Google Scholar]
  38. Zhao, R.J.; Moh, W.H. Value management practices on major construction projects and green building. Front Eng. Manag. 2016, 3, 147–157. [Google Scholar] [CrossRef]
  39. Novais, R.M.; Senff, L.; Carvalheiras, J.; Labrincha, J.A. Bi-Layered Porous/Cork-Containing Waste-Based Inorganic Polymer Composites: Innovative Material towards Green Buildings. Appl. Sci. 2020, 10, 2995. [Google Scholar] [CrossRef]
  40. Mutani, G.; Azzolino, C.; Macrì, M.; Mancuso, S. Straw Buildings: A Good Compromise between Environmental Sustainability and Energy-Economic Savings. Appl. Sci. 2020, 10, 2858. [Google Scholar] [CrossRef] [Green Version]
  41. Shao, B.; Du, X.; Ren, Q. Numerical investigation of energy saving characteristic in building roof coupled with PCM using lattice Boltzmann method with economic analysis. Appl. Sci. 2018, 8, 1739. [Google Scholar] [CrossRef] [Green Version]
  42. Fawaz, A.N.; Ruparathna, R.; Chhipi-Shrestha, G.; Haider, H.; Hewage, K.; Sadiq, R. Sustainability assessment framework for low rise commercial buildings: Life cycle impact index-based approach. Clean Technol. Environ. Policy 2016, 1, 2579–2590. [Google Scholar]
  43. Orsi, A.; Guillén-Guillamón, I.; Pellicer, E. Optimization of Green Building Design Processes: Case Studies within the European Union. Sustainability 2020, 12, 2276. [Google Scholar] [CrossRef] [Green Version]
  44. Gritzo, L.; Doerr, W.; Bill, R.; Nong, S.; Krasner, L. The Influence of Risk Factors on Sustainable Development; FM Global: Boston, MA, USA, 2009. [Google Scholar]
  45. Wi, H.; Jung, M. Modeling and analysis of project performance factors in an extended project-oriented virtual organization (EProVO). Expert Syst. Appl. 2010, 37, 1143–1151. [Google Scholar] [CrossRef]
  46. Muldavin, S.R. Value beyond Cost Savings: How to Underwrite Sustainable Properties; Green Building FC: Fort Collins, CO, USA, 2010. [Google Scholar]
  47. Cajias, M.; Bienert, S. Does sustainability pay off for European listed real estate companies? The dynamics between risk and provision of responsible information. J. Sustain. Real Estate 2011, 3, 211–231. [Google Scholar] [CrossRef] [Green Version]
  48. Eichholtz, P.; Kok, N.; Quigley, J.M. Sustainability and the Dynamics of Green Building: New Evidence of the Financial Performance of Green Office Buildings in the USA; Research Report by RICS: London, UK, 2010. [Google Scholar]
  49. Parker, D. Valuation of Green Buildings: Is Greed Becoming Fear? Aust. N. Z. Prop. J. 2008, 1, 552–560. [Google Scholar]
  50. Jha, K.; Iyer, K. Critical determinants of project coordination. Int. J. Proj. Manag. 2006, 24, 314–322. [Google Scholar] [CrossRef]
  51. Shen, Q.; Liu, G. Critical success factors for value management studies in construction. J. Constr. Eng. Manag. 2003, 129, 485–491. [Google Scholar] [CrossRef]
  52. Al-Yousefi, A. Application of Value Engineering in Saudi Arabia and Arabian Gulf Countries; Powerpoint Slides; Ministry of Water and Electricity: Riyadh, Saudi Arabia, 2010. [Google Scholar]
  53. Al-Yousefi, A. Total Value Management; Powerpoint Slides; Alyousefi Value Engineering: Riyadh, Saudi Arabia, 2011. [Google Scholar]
  54. Punch, K.F. Introduction to Social Research: Quantitative & Gualitative Approaches, 2nd ed.; SAGE Publications: London, UK, 2005. [Google Scholar]
  55. Morgan, G.A.; Leech, N.L.; Gloeckner, G.W.; Barret, K.C. SPSS for Introductory Statistics: Use and Interpretation, 2nd ed.; Lawrence Erlbaum Associate Publishers: Mahwah, NJ, USA, 2004. [Google Scholar]
  56. Field, A. Discovering statistics using SPSS, 2nd ed.; SAGE Publications: London, UK, 2005. [Google Scholar]
  57. SPSS 22. 0.0.1. SPSS 22.0.0.1 for Windows; SPSS Inc.: Chicago, IL, USA, 2014. [Google Scholar]
  58. George, D.; Mallery, P. SPSS for Windows Step by Step: A Simple Guide and Reference, 4th ed.; Allyn & Bacon: Boston, MA, USA, 2003. [Google Scholar]
  59. Akintoye, A. Analysis of factors influencing project cost estimating practice. Constr. Manag. Econ. 2000, 18, 77–89. [Google Scholar] [CrossRef]
  60. Kaiser, H. An index of factorial simplicity. Psychometrika 1974, 39, 31–36. [Google Scholar] [CrossRef]
  61. Nykamp, H. Policy Mix for a Transition to Sustainability: Green Buildings in Norway. Sustainability 2020, 12, 446. [Google Scholar] [CrossRef] [Green Version]
Figure 1. Framework for development of risk factors impacting value creation of green buildings.
Applsci 10 07388 g001
Figure 2. Factor analysis and data reduction process.
Applsci 10 07388 g002
Figure 3. Average rating for the likelihood of risk factors having an impact on value creation.
Applsci 10 07388 g003
Figure 4. Ranking the financial risk factors impacting on the project value.
Applsci 10 07388 g004
Figure 5. Ranking the functional risk factors impacting on the project value.
Applsci 10 07388 g005
Figure 6. Ranking the operational risk factors impacting on the project value.
Applsci 10 07388 g006
Figure 7. Ranking the environmental risk factors impacting on the project value.
Applsci 10 07388 g007
Figure 8. Ranking the management risk factors impacting on the project value.
Applsci 10 07388 g008
Table 2. Cronbach’s Alpha measures (source: George and Mallory [58]).
Cronbach’s AlphaInternal Consistency
>0.90Excellent
0.80–0.89Good
0.70–0.79Acceptable
0.60–0.69Questionable
0.50–0.59Poor
<0.50Unacceptable
Table 3. Total variance explained for risk factors.
ComponentInitial EigenvaluesExtraction Sums of Squared LoadingsRotation Sums of Squared Loadings
Total% of VarianceCumulative %Total% of VarianceCumulative %Total% of VarianceCumulative %
122.38033.90933.90922.38033.90933.9096.0279.1329.132
24.1546.29440.2034.1546.29440.2035.4998.33217.464
33.4185.17945.3823.4185.17945.3825.0367.63025.094
42.9884.52749.9092.9884.52749.9094.3646.61331.707
52.6404.00053.9092.6404.00053.9093.5065.31237.019
62.5993.93857.8462.5993.93857.8463.3415.06242.081
72.2003.33461.1802.2003.33461.1803.1954.84146.921
81.9752.99364.1731.9752.99364.1733.1434.76251.683
91.7212.60866.7811.7212.60866.7813.0394.60556.289
101.5402.33369.1131.5402.33369.1132.8634.33860.627
111.4032.12671.2401.4032.12671.2402.4323.68664.312
121.3121.98873.2281.3121.98873.2282.3863.61567.927
131.2731.93075.1571.2731.93075.1572.3113.50171.428
141.1011.66876.8261.1011.66876.8262.0393.09074.518
151.0401.57678.4011.0401.57678.4011.8442.79377.311
161.0151.53879.9391.0151.53879.9391.7352.62879.939
170.9181.39081.330
180.8321.26082.590
....
....
....
650.0090.01499.991
660.0060.009100.000
Table 4. Summary of factor analysis for risk factor components.
Risk Factor ComponentsExtracted EigenvalueExtraction Sum of Squared Loadings: Variance %Rotation Sum of Squared Loadings: Variance %Factor Loading ScoreCodeRisk Factor
122.38033.9099.1320.801R13Failure to identify cost-to-worth relationships
0.796R11Failure to recognize cost–value mismatches
0.781R10Failure to identify cost–value relationships
0.780R14Failure to link or identify performance-to-cost relationships
0.600R8Failure to consider the cost of losing potential revenue
0.598R12Failure to appropriately locate cost-to-function allocation
0.528R9Uncertainty about prices
0.425R5Inappropriate cost evaluation criteria
24.1546.2948.3320.858R27Failure to identify appropriate alternative function
0.788R26Unsuitable functional analysis
0.744R25Failure to identify and understand functions
0.691R24Failure to examine attributes which have no useful function
0.539R23Failure to consider changes to current design standards
0.481R59Failure to identify complex items or processes with little or no value added to the facility
0.529R47Failure to consider implication of environmental risks
33.4185.1797.6300.822R61Lack of considering early failure of components and equipment
0.726R60Failure to consider rate of deterioration of components
0.709R65Incorrect estimated cost of maintenance
0.641R62Failure to consider delay and higher cost due to bad weather conditions during construction
0.626R63Incorrect cost estimate
0.527R66Incorrect estimated cost of energy used
42.9884.5276.6130.843R46Limited knowledge of maintenance issues
0.734R48Lack of background information
0.639R44Failure to consider increase in routine maintenance
0.592R45Failure to consider increase in life cycle replacement
0.540R39Failure to consider design impact on operating efficiency
52.6404.0005.3120.723R42Failure to consider component repair and replacement
0.717R41Failure to consider construction health and safety
0.602R43Failure to consider maintainability and reparability impact
0.423R40Insufficient space and capacity
62.5993.9385.0620.724R50Poor definition of the scope and objectives of projects
0.699R51Project scope unscheduled items
0.580R58Failure to build to design
0.494R52Failure to consider construction Techniques
0.465R49Poor project management
72.2003.3344.8410.785R4Inadequate inflation forecasts
0.649R6Failure to consider future operational costs
0.598R3Failure to consider implication of economic conditions
0.454R15Failure to consider constructability issues
81.9752.9934.7620.789R20Failure to consider construction implications during design
0.732R19Failure to design to brief/specification
0.502R18Failure to translate specification into the design
0.497R17Failure to examine specifications due to unnecessary expense
91.7212.6084.6050.762R57Improper project planning and budgeting
0.728R56Failure to consider procurement method
0.586R64Incorrect time estimate
0.493R53Lack of coordination and decision making
101.5402.3334.3380.633R31Failure to consider new/change in technology
0.597R33Failure to integrate the various systems to achieve the lowest LCC
0.577R29Unproven construction techniques
0.498R16Failure to appreciate design uncertainty
0.407R32Failure to meet performance or design standards
111.4032.1263.6860.773R21Design changes
0.702R22Redesign/rework
121.3121.9883.6150.614R38Failure to consider obsolescence of equipment impact
0.589R37Failure to consider inter-dependence between design components
131.2731.9303.5010.808R1Insufficient funding
0.499R2Funding is unavailable
141.1011.6683.0900.762R35Failure to identify low-value, long-lead-time items
0.550R36Failure to consider design risks
151.0401.5762.7930.612R7Failure to recognize cost as resource expenditure
0.456R30Failure to consider legislative/regulation issues
161.0151.5382.6280.625R54Poor team relationships
0.468R28Poor design that may lead to higher operation costs
Table 5. Factor reduction for the risk factors: five new categories.
Cluster Variance %ComponentCodeRisk Factors
Financial Risks27.8971R11Failure to recognize cost–value mismatches
R10Failure to identify cost–value relationships
R8Failure to consider the cost of losing potential revenue
R12Failure to appropriately locate cost-to-function allocation
R9Uncertainty about prices
R5Inappropriate cost evaluation criteria
7R6Failure to consider future operational costs
R3Failure to consider implication of economic conditions
13R1Insufficient funding
15R7Failure to recognize cost as resource expenditure
3R65Incorrect estimated cost of maintenance
R63Incorrect cost estimate
R66Incorrect estimated cost of energy used
Functional Risks15.8768R20Failure to consider construction implications during design
R19Failure to design to brief/specification
R17Failure to examine specifications due to unnecessary expense
10R33Failure to integrate the various systems to achieve the lowest life-cycle costs
11R21Design changes
R22Redesign/rework
14R35Failure to identify low-value, long-lead-time items
R36Failure to consider design risks
Operational Risks6.6134R44Failure to consider increase in routine maintenance
R45Failure to consider increase in life cycle replacement
R39Failure to consider design impact on operating efficiency
Environmental Risks17.25912R38Failure to consider obsolescence of equipment impact
5R43Failure to consider maintainability and reparability impact
2R47Failure to consider implication of environmental risks
Management Risks12.2956R49Poor project management
R50Poor definition of the scope and objectives of projects
R51Project scope unscheduled items
9R57Improper project planning and budgeting
R53Lack of coordination and decision making
R64Incorrect time estimate
16R54Poor team relationships
R28Poor design that may lead to higher operation costs
Table 6. Environmental risks and hypothesis test.
Research QuestionEnvironmental Risks:
Hypothesis H0: p > 0.05; H1: p < 0.05;
ResultsThe (ANOVA) results indicated that:
There were significant differences between the survey participants regarding Risk factors:
R38: Failure to consider obsolescence of equipment impact
Researcher’s observationIt appears that architects in KSA are not acquainted with the fact that whole-life performance of green buildings is highly linked to the obsolescence of equipment and components.
ConclusionThe null hypothesis was rejected for R38 risk.
The null hypothesis (Hypothesis 1: 1 = 0)—(H0: p > 0.05) was retained for other risks.
Publisher’s Note: MDPI stays neutral with regard to jurisdictional claims in published maps and institutional affiliations.

