Abstract
The use of smartphones for accurate navigation in underground spaces, such as subway stations, poses several challenges. This is because it is difficult to obtain a sure estimate of user location due to the radio signal interference caused by the entry and exit of trains, the infrastructure of the subway station installation, and changes in the internal facility environment. This study uses quick response markers and augmented reality to solve these difficulties using an error correction method. Specifically, a hybrid marker-based indoor positioning system (HMIPS) which provides accurate and efficient user-tracking results is proposed. The HMIPS performs hybrid localization by using marker images as well as inertial measurement unit data from smartphones. It utilizes the Viterbi tracking algorithm to solve the problem of tracking accuracy degradation that may occur when inertial sensors are used by adopting a sensor error correction technique. In addition, as an integrated system, the HMIPS provides a tool to easily carry out all the steps necessary for positioning. The results of experiments conducted in a subway station environment confirm that the HMIPS provides accurate and practical navigation services. The proposed system is expected to be useful for indoor navigation, even in poor indoor positioning environments.
1. Introduction
In recent times, subway stations have evolved into increasingly complex spatial structures. This has been caused by the connection of adjacent buildings, special expansion for various activities such as shopping, tourism, meetings, and meals as well as an increase in the number of platforms for train use. These environmental changes have accelerated the need for indoor navigation systems in subway stations to support mobility and increase user convenience, particularly for the underprivileged. To provide indoor navigation services at subway stations, several issues need to be solved, such as the accuracy of location information, the cost of building indoor maps, and the maintenance of infrastructure such as Wi-Fi. Unlike ordinary buildings, subway stations have a structure in the form of an open space with high floor height. This structure results in a decrease in positioning accuracy when positioning methods that utilize a characteristic in which the strength of a signal varies due to walls and obstacles, such as Wi-Fi-based positioning, is used. In addition, various issues need to be addressed, such as radio interference problems caused by the entry and exit of trains, infrastructure installation problems, frequent internal facility changes in subway stations, and the maintenance costs of railroad operating institutions. Consequently, in order to provide indoor navigation services in subway stations, there is a need for a plan that can solve these issues and appropriately apply the solutions.
Indoor positioning technologies for providing indoor navigation services are themselves very diverse. Using Wi-Fi or Bluetooth technologies, typical indoor positioning techniques make use of natural phenomena such as geomagnetic data, and inertial measurement unit (IMU) sensors installed in smart devices. Such resources are used for absolute positioning, which calculates the location of an object or person in fixed coordinates, and for relative positioning, which tracks changes in relative position. Absolute positioning enables a reasonably accurate position calculation because the distribution of signals can be learned in advance or a large amount of data can be gathered when learning data are collected in the offline phase. However, when IMU sensors are used for relative positioning, errors may accumulate due to sensor biases and fluctuations, and therefore an appropriate response to these errors is required.
One of the methods for estimating the absolute location of the user is fingerprinting-based positioning. The fingerprinting method compares a received signal strength list measured at the positioning time with a signal map constructed during the training phase to determine the position of a device on the signal map. Among the devices that can be applied to the fingerprinting method are Wi-Fi [1,2], Bluetooth [3,4], and magnetometer sensors [5]. In particular, the fingerprinting method is widely used in commercial Wi-Fi positioning systems, and many methods for overcoming disadvantages such as an increase in collection costs are being actively studied [6]. However, the multilateration method uses the received signal strength or roundtrip time of the signal. The received-signal-strength–based multilateration positioning means that the received signal strength is converted into a distance using signal propagation modeling, and then the device location is calculated from the distance information of a plurality of transmitting device connection points. The round-trip-time–based multilateration of the signal removes the delay time at the transmission signal connection point from the pulse request time to the transmission signal connection point and the difference of the pulse arrival time from the device after the round trip. Subsequently, the result is converted into a distance to perform multilateration positioning [7]. In addition to Wi-Fi, many other technologies such as the GPS, WSNs [8], and cellular networks [9], use this approach. In particular, the GPS module is widely used for outdoor positioning. However, GPS is not typically used for indoor positioning because the signal attenuates considerably in indoor spaces. In addition, there are many absolute positioning approaches, which represent fixed coordinates, using various sources such as RFID [10], LED [11], and ultrasound technologies [12].
Sensor-based positioning, which is widely used for estimating a relative position change, can be independently used to compare positioning technology based on wireless communication infrastructure. Independent positioning is possible even in an infrastructure-free environment. Moreover, relative positioning has complementary characteristics with existing wireless-communication-infrastructure— based positioning technology as this method provides high positional accuracy within a short space of time. Accelerometer, gyroscope, compass, magnetometer, barometer, etc., sensors can be used in this field. In particular, an approach called the pedestrian dead reckoning (PDR) method can be used, whereby the accelerometer, gyroscope, compass, or magnetometer are grouped together and used to estimate relative position changes. The PDR method, which uses the sensor data of the gyroscope, accelerometer, and magnetometer embedded in smart devices, is used for tracking the user’s location [13,14,15]. Depending on the research, the sensors for heading detection may be gyroscope, compass, or magnetometer sensors,. The PDR method uses the acquired data of these sensors to measure step count, stride, and heading estimation. Although research on pedestrian tracking using the PDR method is underway, it is difficult to develop a complete approach because of the numerous variables such as user height, walking pattern, and behavior habits. Because the PDR method cannot be used alone to find the initial location, it is a typical way of combining other sensors, which are then used for the absolute position estimation.
As we have seen thus far, the technologies and methods used for indoor positioning are diverse and actively studied. However, it is difficult to apply these technologies to special environments such as subway stations due to the uncertainty of environmental factors, which may negatively affect sensor readings. To address these difficulties, we propose a hybrid-marker–based indoor positioning system (HMIPS) that uses quick response (QR) and augmented reality (AR) techniques that provide AR-based indoor navigation services for pedestrians through viewing on smartphone camera screens. By using a marker such as a QR code, the positioning can be free from environmental factors caused by the specificity of subway stations, and various application services can be provided. In this regard, we will take a closer look at vision- and QR-based indoor positioning in the next section. In the proposed HMIPS, when a subway station is identified requiring the provision of such a service, it is possible to perform activities such as marker installation, printing, and positioning algorithm modeling using a planning tool provided by the system. In addition, an indoor navigation application without an indoor map provides a UI that displays location information on the screen and provides visual recognition when the user reaches a specific destination. In this app, differentiated navigation is possible according to disabled or general users. An experiment was conducted on an actual subway station to verify the improvement in tracking accuracy and its practical use in the real world. The proposed system achieved a 20% improvement in the subway station compared to the un-corrected inertial sensor data. With more accurate user tracking, these results can be applied to provide practical indoor navigation services for subway station users.
The remainder of this paper is organized as follows: Section 2 introduces related research on various image-based and marker-based indoor positioning methods. Section 3 presents the proposed HMIPS and its functions. Section 4 presents and analyzes the evaluation results obtained for the proposed system. Section 5 provides a discussion of the results and future work. Finally, Section 6 concludes this paper.
2. Related Work
The techniques and methods used for indoor positioning use a wide variety of resources and methods, as discussed in Section 1. In these studies, a large amount of data or additional infrastructure such as proximity sensors are required to increase the positioning accuracy. In addition, errors caused by biases of inertial sensors are still a problem to be resolved. This section introduces marker-based and vision-based positioning, which are relatively free from infrastructure installation and the collection of large amounts of data. In addition, we describe how these studies proceed with regard to positioning, strengths, and limitations.
2.1. Marker-Based Indoor Localization
Indoor positioning technologies using QR codes or markers primarily show positioning results based on AR and develop and use various markers by themselves. Romli et al. [16] used the Vuforia system to provide marker-based indoor navigation services in libraries. In this study, after registering photos of major locations in the library and AR objects corresponding to them in the system, the AR object guides the users when they project the registered photos. In the Vuforia system, multiple markers can be recognized simultaneously, and objects can be registered without creating additional markers. However, when there are multiple target images, only AR object expression experiments and surveys are conducted, and additional experiments are needed for the availability of actual navigation services.
Khan et al. [17] proposed an indoor navigation framework using ARToolKit markers developed in previous research. The provided application was Android-based, with two operating modes: an administrator mode that registered a marker on an indoor map after attaching a marker to the ceiling, and a user mode that searched for directions while recognizing the marker by means of a mobile device. This system is easy to install, use, manage, and expand Android applications, and provides convenience through voice and text guidance. However, the direction of the marker must always be parallel to the direction of the corridor, and the mobile device must always face the ceiling as the marker itself is ceiling-installed. Therefore, this system may experience difficulties in installing markers and place an undesirable burden on users.
Navigation services for people with visual impairments have also been studied [18,19]. In [18], adaptive artificial potential field (AAPF) path planning was proposed to enable more efficient and safer path planning. In addition, haptic gloves were used to communicate between the user and the smartphone to provide stable guidance—while the left glove guided the road, and the right glove informed obstacles. However, in addition to the inconvenience of wearing a haptic device, there were limitations in that the system required a digital map. In [19], IP cameras were installed on the ceilings of major places, and remote systems were built. The installed IP cameras recognized the marker attached to a user’s head, estimated the location, and guided the user. It was possible to set the destination by voice, increasing the convenience for the visually impaired. In this system, there was no need to search for markers because the directions were guided by voice and sound, the system recognizing various obstacles and guiding the user through the modified route. However, it was costly to build the required infrastructure (such as an IP camera).
Engfi Gate [20] is a building guidance system created by combining three systems. The marker-based cyber-physics interaction system receives input from the user through visible and invisible markers and operates the device according to the input. The indoor positioning system estimates the user’s location using markers, and the AR system provides information necessary for guidance to the user’s mobile phone or head-mounted display (HMD). The reliability was improved by using two types of markers, and convenience was improved by providing an application that supported 3-D and HMD. However, there were no experimental results for the entire system, and the accuracy of positioning using the received signal strength indicator value of the Bluetooth low energy module was lowered.
Hübner et al. [21] processed the augmentation and placement of the indoor environment into virtual indoor model data in an AR device (HoloLens) using marker-based localization. After determining the pose of the AR device for the coordinate system of the real physical world, building information modeling data were overlaid. Heya et al. [22] proposed an indoor positioning system based on image processing using OpenCV and Python. In this study, each user was assigned a unique color and users displayed it on a smartphone, which was attached to their shoulders. A method of measuring the user’s location was used by recognizing colors through a camera attached to the ceiling and converting the location into a location matrix. Meanwhile, Lightbody et al. [23] proposed a new marker and introduced a positioning system that applied it. The new marker added encoded information based on the concept of binary necklaces to the existing WhyCon circular marker. In the process of recognizing the marker, the ID of the marker and the rotated angle could be established simultaneously. These studies highlighted advantages such as high accuracy and low computational cost, but exhibited limitations such as computational overhead and high installation costs due to the decoding process.
In addition to marker-based positioning for pedestrians, various studies using markers have also been conducted in robotics [24,25]. Li et al. [24] proposed an indoor positioning system for mobile robots based on a newly designed marker. In the proposed system, the robots moved and captured markers attached to the ceiling. Subsequently, the captured image was processed to obtain location and direction information, and a marker map was constructed based on this. The generated marker map was optimized through a graph-based algorithm, and the graph edge was updated using the Bayes estimation method. In this study, markers could be installed somewhat freely, and the accuracy and recognition rate of the marker maps were improved by utilizing the G20 framework. However, when the proximity of the lighting was close to the robot, the recognition rate was reduced.
Meanwhile, researchers in [25] proposed a robot localization system based on a QR code. When the robot moved and recognized a QR code, the robot decoded it and delivered the information to the local server, and the server performed positioning in a way that informed the shortest route to the destination based on the transmitted information. At this stage, if the proximity sensor built into the robot detected an obstacle, the robot avoids it and returned to the original path. In this study, security was improved by using an encrypted network. Furthermore, because the robot itself could avoid obstacles, its dependence on the server was reduced, and the server computational cost could be reduced. However, because the QR code is arranged to match unique coordinates, the initial cost may be high. It is also difficult to estimate the performance of this system as the study did not provide any experimental methods or results.
2.2. Vision-Based Indoor Localization
Vision-based indoor positioning requires the user to actively participate in positioning using a camera, and is characterized by using a visual landmark to derive stable results compared to other methods such as Wi-Fi-based positioning. However, landmarks can be recognized differently even in the same place due to variables such as lighting, block of view, and landscape changes caused by passersby. This may cause the degradation of positioning accuracy. In the case of photos other than markers, the amount of computation and memory usage increases as the image processing and storage capacity is enormous.
In [26], characteristic parts of the interior space, such as store logos and murals, are registered as reference objects. Consequently, when the user photographs three objects close to their location, positioning is performed by matching them to the registered reference objects. After object matching, the user’s position is measured by triangulation using the position of each object and the angle information of the gyroscope. This method does not require additional infrastructure, and the maintenance costs can be lowered as it is based on an object that has little movement compared to methods in which the signal environment can change frequently. However, if there are many unregistered reference objects, the positioning process and continuous positioning becomes impossible.
Dong et al. [27] proposed a system called ViNav that could be used without installing indoor maps, radio maps, or additional hardware. It collected photos or videos through crowdsourcing and 3-D modeling of the interior structure using structure-from-motion technology. At the time, the location labeling of the photo or video was performed by estimating the movement path of the user with the IMU, and geo-referencing the Wi-Fi fingerprint according to the movement path. The barometer estimated the location of the connection among the floors, such as stairs or elevators. This system had the advantage of being able to build maps through crowdsourcing and to be continuously updated so that no additional infrastructure was required. However, active participation of the user was required and the image data were large, so the required memory and computational complexity increased.
Methods that utilize vision, such as [26,27], often process queries on the server because the required memory and computational requirements of the image data are large. This makes it difficult to scale up the system and reduce the positioning response time. In addition, network connections must be made continuously, and there could be controversy over issues of privacy. To overcome this problem, Niu et al. [28] proposed a system called HAIL that automates the image verification step. HAIL is an offline feature selection that reduces memory and computational complexity as it only stores and utilizes characteristic features for landmarks. Because the capacity is not large, positioning is performed on the user’s smartphone rather than on the server, so it can be used without a network connection. In addition, it reduces matching errors by using only characteristic features. Although it has the advantage of overcoming capacity and computational problems, which are the characteristic disadvantages of vision-based methods, it could be difficult to use effectively in places where characteristic features are weak.
There are many indoor areas with less texture, such as walls, ceilings, floors, and windows. InLoc [29] uses dense feature extraction based on a convolutional neural network (CNN) instead of sparse feature extraction in order to find and utilize meaningful features in this environment. InLoc has the advantage of reducing positioning confusion in complex indoor structures by considering negative evidence as well as positive evidence during feature matching. However, RGB-D data are indispensable and have limitations in that users must actively intervene while taking pictures. See-Your-Room [30] is a 3-D localization system that utilizes public cameras such as CCTV. In the detection phase, the position and pose of the people are captured. Mask Recurrent-CNN (R-CNN) distinguishes between human pixels and non-human pixels. In the mapping step, projection transformation using a perspective matrix is used to convert the position of a person into a position on the indoor map. Because it uses a public camera, there is no need for the participation of the positioning targets, but since it does not distinguish individual people, only the system knows that a person is in a certain location. Therefore, because the positioning targets are not assumed to be users and positioning is performed through a public camera, privacy issues may arise. Much the same way that selecting partitions for image matching using a Wi-Fi fingerprint reduces complexity in [27], the movement distance and direction are estimated using an IMU sensor and Wi-Fi channel state information (CSI) for feature matching in [31]. When a user takes two pictures of the same place at slightly different locations, spatial information is derived by obtaining data on the location and direction in which the two pictures were taken through the IMU and CSI. Using this method, images are compared based on the point of interest (POI), not at a pixel-level.
There are studies that have tried to improve accuracy by combining vision and PDR techniques [13,32]. Poulose et al. [32] compared two algorithms, ORB-SLAM and UcoSLAM, for vision-based positioning through a camera. Robustness was improved by mixing vision and PDR techniques, and the possibility of confusion in positioning was low when using a marker. iPAC [13] uses images obtained through public cameras, as shown in [5], and combines PDR and vision with a motion-sequence–based matching algorithm. While not identifying individuals in [30], this study tracks people by assigning a unique ID to each person in a real-time video. Positioning services can be provided without user participation, and if a surveillance camera is already available, a separate infrastructure installation is not required. Although computing time is reduced by using an algorithm with low computational complexity, privacy issues can arise as the server side can identify individuals along with their appearance, location, and movement.
Travi-Navi [33] is a navigation service built with user participation. This system records landmarks such as photographs obtained by taking images of the paths that the guider passes, sensor values during walking, and radio signals and uses them for positioning. To acquire a clear photographic image during walking, an accelerometer is used to automatically take a picture at stable moments. The robustness is improved by using various types of data together, and the user can build a navigation service on their own without a floor plan or pre-deployed localization system. Therefore, the proposed system can be used to build an effective positioning system using crowdsourcing. However, because a user needs to carry the smartphone in a state in which it is possible to take pictures continuously, the proposed method may cause inconvenience for them. In addition, the amount of computational complexity and energy consumption increases due to frequent data processing.
3. The Proposed HMIPS
Prior to describing the HMIPS, we formulate the process of installing an HMIPS in a subway station. Distributing the HMIPS to subway stations requires a number of steps. Figure 1 illustrates the overall process of deploying a marker-based indoor positioning system in a subway station. In the first step, an indoor map of the subway station is prepared to provide an indoor positioning service and it is then registered in the system. In the second step, indoor space modeling proceeds using more advanced techniques for marker generation and installation, after which markers are generated and printed for the modeled area using a marker-making tool (step three). Once the generation of markers has been completed, a positioning engine is installed in step four. Afterward, testing and evaluation are performed to ensure the quality of the provided indoor positioning system (step five). The following sections describe the detailed activities required at each step.
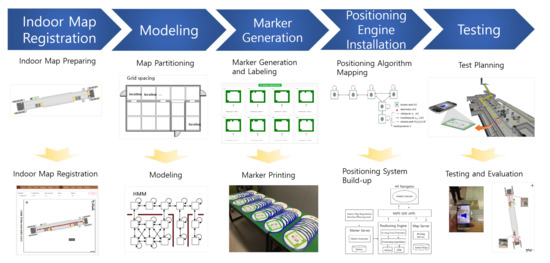
Figure 1.
Process of hybrid marker-based indoor positioning system.
3.1. Indoor Map Registration and Modeling
3.1.1. Indoor Map Preparing and Registration
Indoor maps are the most fundamental material for developing a marker-based indoor positioning system. Because we use AR when servicing marker-based indoor navigation, we do not display an indoor map on the user UI. However, because activities such as the marker installation location are performed based on it, it is essential to prepare the indoor map. However, it may be practically impossible to prepare all indoor maps of the service area desired by users who want to use the proposed system as a system administrator. To solve this problem, we made it possible to replace the indoor map simply by registering an image. In other words, if a user cannot obtain an indoor map for a service area, if the user can simply draw an indoor layout this can be used to play the role of an indoor map. The indoor map is registered by assigning an ID for each floor of the building, and the movement between floors is displayed on the routing using link information between markers. Of course, the positioning accuracy in such a case cannot be expected to match that of an accurate indoor map; however it is adequate since the proposed system calculates the pixels of the registered image for positioning.
After the indoor map registration has been completed, as shown in Figure 2, the user needs to use the planning tool to determine and mark the location of markers to place them on the registered indoor map. In the planning tool, a marker is registered as a node and has a unique ID. After the marker is registered, each node is connected using the link menu of the planning tool, and the link connecting a node is given a unique ID. When the node and link registration for each indoor map has been completed, the basic activity of the marker-based positioning is complete. In addition, the HMIPS provides interfaces to register the POI, such as elevators, escalators, toilets, and information centers. Users can easily register a desired POI and set it as a destination using this function.
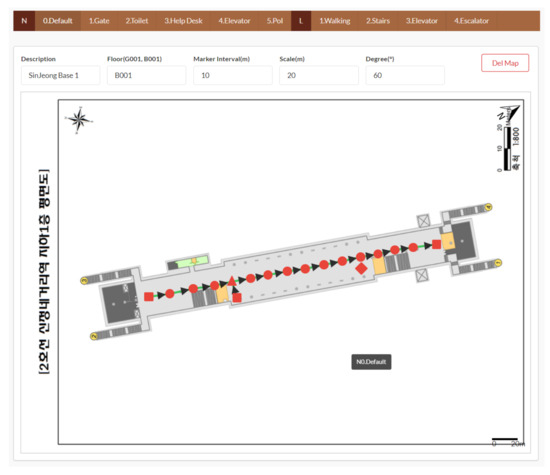
Figure 2.
Planning tool of the HMIPS.
3.1.2. Modeling of Indoor Spaces
To install markers and represent them in relation to locations, modeling of the indoor space is required. By using information such as spaces and walls obtained from the registered indoor map, it is possible to determine separate spaces, walls, and connection spaces. Subsequently, spatial modeling work is performed that divides each separated space into smaller spaces for marker-based positioning. The Voronoi tessellation technique is used for this spatial division [34].
- Voronoi tessellation
In mathematics, the Voronoi diagram is a technique that divides a space based on the distance of specific points on a plane. The location of the seeds corresponding to the number of spaces to be divided is pre-arranged, and for each seed, an area composed of all the points closer to the seed than to the other seeds is created. Each of these areas is called a Voronoi cell. In this case, the Euclidean distance is used as the distance to the point, as in Equation (1).
where, x and y denotes coordinates of the seed.
However, if only this Voronoi spatial segmentation technique is applied to the spatial modeling work, there is a large difference in the expanse of each area depending on the initial location of the seeds. This can also be seen in Figure 3a. Additional corrections are required.
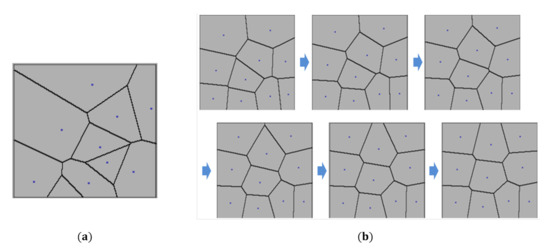
Figure 3.
Modeling of indoor spaces: (a) Voronoi diagram; (b) Process of Lloyd’s relaxation.
- Lloyd’s relaxation
This algorithm, also known as Lloyd’s algorithm or Voronoi iteration, is an algorithm for dividing the Euclidean space into uniform shapes and sizes [35]. The algorithm uses a Voronoi diagram and is performed by repeating the task of moving the seeds of each Voronoi cell to the corresponding centroid after calculating each Voronoi cell’s centroid. This repetition is stopped when the center of gravity of each Voronoi cell and the seed match. As can be seen in Figure 3b, Lloyd’s relaxation can be used as a spatial model because it is possible to divide a region of an even size to some extent. In addition, even if the initial seed location is not uniform, the result can be divided evenly through correction if the seed location is randomly selected. Finally, it can be easily applied to buildings with complex shapes other than simple rectangles because this method is based on the center of gravity calculation.
- Connection space calculation and route finding
If the spatial division is completed through Voronoi tessellation and Lloyd’s relaxation, the spatial connection process is performed. Two adjacent Voronoi cells are connected as a movable space, and the space, wall, and connection space obtained from the registered indoor map are connected to the moving path based on this information. The space where pedestrians can move can be obtained from indoor map information. In other words, the movable space refers to a path through which pedestrians can pass without being obstructed by obstacles such as walls. The connection data are then used for path finding.
3.2. Marker Generation
3.2.1. QR Marker and Marker Recognition Method in HMIPS
The markers used in the HMIPS are composed of squares, as shown in Figure 4, the structure of the marker including the border area, pattern area, and finder pattern in accordance with the QR code international standard. Compared to this standard, the cells inside the border area are simplified to to augment the recognition rate with the pattern area, which contains the direction of the marker and the ID information of the marker. The inner area of the marker is composed of a display area that can provide visual information to pedestrians, an added circular border to improve aesthetics, and the same information as that of the current subway station. The proposed marker comprises a green square—containing various information—with a blue border. The marker is made in sticker form so that it can be easily installed, and it is coated with matt to reduce the influence of illumination in recognition. The marker color HSB is 230/89%/99%, and the material is LG-spc030/Im40000.
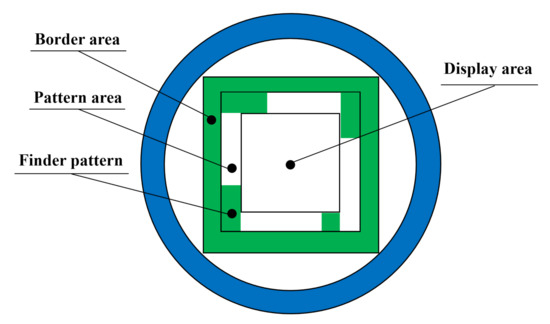
Figure 4.
Marker structure of the HMIPS.
The function of each area of the marker is summarized as follows:
- Border area: The criteria by which the camera recognizes markers.
- Pattern area: Marker-specific identification number display.
- Finder pattern area: Located at the four corners of the pattern area. Contains marker rotation information.
- Display area: Provide visual information to pedestrians.
Smartphone applications with integrated marker recognition technology recognize the marker (shown in Figure 4) through the smartphone camera and then analyze it. The marker’s unique ID is extracted, and the user’s position is estimated using this information. Marker recognition technology uses an image processing library, which is essential for transforming and analyzing various camera screen images. The smartphone app drives the smartphone camera to recognize markers and captures the camera screen at approximately 1–3 fps. The captured image is used to estimate the user’s location through image processing and analysis, as shown in Figure 5.
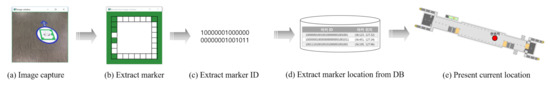
Figure 5.
Marker recognition process for positioning.
The first step in using a navigation service at a subway station is for a user to run the application on their smartphone and to select a destination. The selected destination is saved while the application is running. When the selected application screen is converted to the camera screen, the user scans the marker with the camera, and the marker recognition program recognizes it. Once the marker is recognized, the app captures an image of it, as shown in Figure 5a. As illustrated in Figure 5b, the captured image is converted into the HSV color model to reduce the influence of light and extract the outline of the marker. Here, a grayscale image of the marker is obtained when the marker boundary is first detected. The HMIPS uses well-known techniques to convert captured images to grayscale formats in RGB. Equation (2) depicts the relationship between the grayscale value and the RGB color component.
Border area thresholds are used to find potential markers in binary images using the methods proposed by [36] and edge detection methods [37] are used to identify marker boundaries. The adaptive thresholding method was used to determine the changes in image illumination. This technique allows objects to be classified according to their likelihood of becoming a marker region after identifying changes in image illumination. To extract the unique ID of the marker, as shown in Figure 5c, the pattern area of the marker is divided into 10 × 10 cells and converted into a binary matrix. When the conversion is complete, the recognized marker ID and destination are passed to the database. The database stores the binary information of the analyzed marker ID along with the marker ID and marker location. We check whether the recognized marker ID exists in the database, and then extract the marker location from the database (see Figure 5d) to express its current position, as shown in Figure 5e.
If the marker ID does not exist, no information is output and the application waits until the marker is recognized again. If the recognized marker ID does exist in the database, the database calculates the distance and direction from the location information of the recognized marker ID to the corresponding destination and delivers it to the application. The application recalculates the direction information among the received destination data and continues with directions to the destination.
3.2.2. Marker Detection Method for AR Applications
The HMIPS recognizes the marker ID and passes the destination with the marker ID information to the database when the user selects a destination and places a marker on the camera, as shown in Figure 6. The AR-based navigation app provided to the user allows the user to enter a destination, as shown in Figure 6a. When the destination input is completed, the direction of progress is guided by arrows, as shown in Figure 6b, and the remaining distance to the destination is displayed along with the POI guide of the place to proceed to, via text. The database uses the received information to return the direction to the destination based on the front of the marker. At this point, each marker provides a direction for consecutive markers that are passed by the user approaching the destination. Each marker does not point in the direction of the destination but is indicative of another marker in the direction of the destination relative to itself. (Note that user tracking between markers uses PDR to indicate the direction of progress with arrows, but this points to the next marker.) This direction information is provided from the HMIPS to AR, and the direction of movement from the marker at the current position to the next marker is indicated by an arrow.
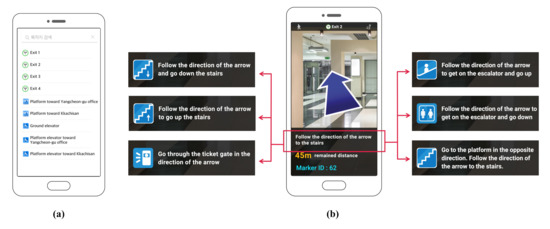
Figure 6.
AR-based navigation application of HMIPS: (a) destination setting; (b) destination guide.
In AR-based indoor navigation, two reference axes are required to display the moving direction of a user with a rotating arrow. One is the axis based on the marker, as shown in Figure 7a and the other is the axis based on the camera screen, as shown in Figure 7b. Because pedestrians do not always use the camera in front of the markers, dynamically calculating the direction of the next marker on a pedestrian basis is necessary. The direction calculation for navigation uses the angle information of the y-axis of the marker, direction of the next marker, y’ axis of the camera, and y-axis of the marker, as shown in Figure 7. When guiding to the destination, the angle of the marker is calculated clockwise to provide the direction of the next marker. If the y’ axis of the camera and the y-axis of the markers do not match, the angle difference is dynamically calculated to reset the destination direction. Without this resetting, the system will navigate in the direction of the red arrow on the marker, instead of the direction of the black dashed arrow, as shown in Figure 7c. The HMIPS calculates the angles of y and y’ using (3) to solve this misalignment problem. As shown in Figure 7d, the value is used for angle correction to provide moving directions.
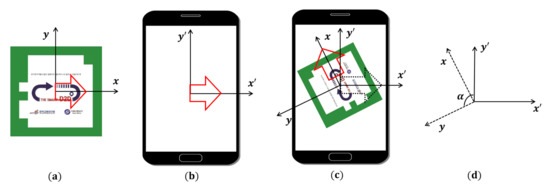
Figure 7.
Direction re-calculation procedure of the HMIPS: (a) marker-based arrow; (b) camera screen-based arrow; (c) difference of the arrows; (d) angle correction.
As previously described, the HMIPS extracts the inclination angle of the marker and corrects the direction angle between the stored markers. This provides the user with the correct direction to the destination based on AR, regardless of the recognition direction of the marker.
3.3. Positioning Algorithm
The proposed HMIPS uses the method devised in our previous work, extended Viterbi tracking using the hidden Markov model (HMM) [38] and a study [39] which corrects errors when using PDR. An HMM modeling for marker-based indoor localization, the hidden states represent possible location cells in the divided area, which is constrained by the indoor map layout. The marker online measurements of a user trace are treated as an emitted observation sequence from the hidden states. A HMM modeling can be described with five elements , which include two state sets: location-state space L, and observation state space O, and three probability matrices: initial probability distribution , transition probability A, and a set of emission probabilities B, respectively. (Note that, in the positioning methods using the signal distribution, these signal distributions are learned, and the probability is calculated, but the emission probability B in the HMIPS is 1 because we use markers.) We assume that all states can be a starting point, which describes the initial probability distribution . Theoretically, was set equally in our model to provide initial information at each point. However, as with the emission probability B, the initial location is also started with a marker, which is different from the general calculation method for predicting the initial location from the probability distribution.
The transition probability A shows how a user moves between any two hidden states in a space. Because a pedestrian can only walk at one interval in a limited way, they cannot move too far from the previous state or move through walls or any other barriers. As discussed in [38,40], gyroscope data are used for estimating the user moving direction, and an accelerometer is used for detecting the user’s steps. The current state s can be calculated using the emission probability B at , the conditional probability of the moving direction, and the moving distance. The indoor layout and human mobility setting can be used to calculate the transition probability A as prior information. As a result, pedestrians can move from a previous location only to their nearby locations in the time interval of two successive observations. The model parameter is set from the marker-based location estimation and transition probability calculation. These calculations allow us to perform user tracking. In our study, tracking using the Viterbi algorithm is to find the optimal hidden state sequence . The aforementioned model parameter and observation vector O are given, and the most likely state sequence, that is, the Viterbi path , can be derived as:
When inducing , transition probability A uses data from inertial sensors, which is a value that includes errors due to bias and fluctuation. The factors that are user-specific and depend on the tracking environment that cause sensor reading errors are very diverse. That is why it is not easy to accurately identify and apply the reliability of each sensor. Therefore, these environmental factors are generally ignored, and it is common to optimize the probabilistic model or set the reliability of the sensors to the nearest optimal solution. In our previous work [39], an error correction method was proposed and studied to solve this problem. In the HMIPS, the error correction method of this study was used to compensate for the error of the inertial sensor to enable more accurate user tracking.
The inertial sensor data containing errors can cause degradation of the HMIPS positioning accuracy when used as an input as follows:
where t is time, i represents sensor type, is the sensor reading containing error, and is the estimated result derived from .
Therefore, we use error correction to derive to be minimal. At this time, the correction value can be derived using filter f, and the revised estimation error can be calculated as follows:
where, EI is the expected ideal result. However, the correction value of filter f converges to a negative bias value over time. This is expressed as an equation:
Equation (7) expresses the situation in which the bias converges to a negative number because the bias becomes the same within the homogenous section of environmental factors. In the HMIPS, both the error factor and bias for the sensor input value are corrected, and only fluctuation errors remain in the end, so accurate tracking becomes possible.
4. Result
4.1. Experimental Setup
Figure 8 depicts the field experiment that was conducted at Sinjeongnegeori Station in Korea, on Subway Line 2 for the verification of the HMIPS. A total of 60 markers were installed on the first basement floor, 20 markers on the second basement floor, and 18 markers on the third basement floor. These markers were placed on the floor in the form of square stickers with dimensions of 20 × 20 cm. The distance between the consecutive markers was set to 10 m. A total of 540 road guide scenarios were set up with 17 intersection points, 17 attribute change points, and 17 final destinations. In order to get on and off the train and connect with other transportation options, the platform and each exit number were set as the destination. The route network was configured such that it provided a guide from the marker to the final destination. When selecting the final destination, it was set to provide indoor navigation using elevators or escalators. It avoided the stairs on the assumption that users would choose elevator- or escalator-connected exits and platforms.
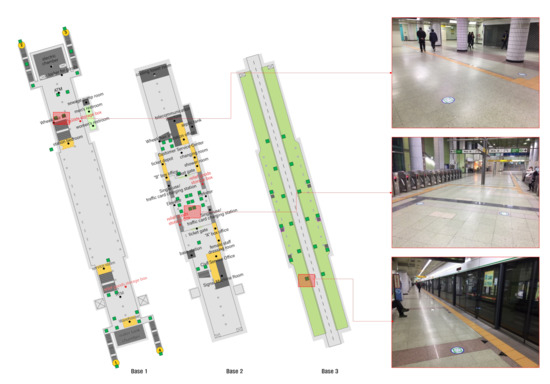
Figure 8.
Testbed subway station for HMIPS test.
4.2. Marker Recognition Test
The most important elements of image processing indoor positioning technology are the response speed and recognition rate. We found that the HMIPS provides more than 95% of the way-to-walk information in under 1 s, under the conditions of : a 1.2 m/s walking speed; a distance of 2 m from the marker; in approximately 500 directions. Problems such as damage due to marker contamination and durability were solved by manufacturing the marker and the attachment location. It was confirmed that the HMIPS could be put to practical use via a pilot operation for one year in 2019 in order to assess its feasibility for a practical navigation service. The system was used for pilot operation and stabilization work is in progress.
Figure 9a illustrates the guide screen that is displayed when a marker is recognized by a smartphone. Figure 9b displays the screen when moving along the sections between markers. The distance from the point of recognition of the marker to the destination is displayed on the screen, and a section such as the stairs is highlighted for the user by the spatial characteristics of the direction of approach through an icon so that the user can select another path if desired. This is a characteristic of the HMIPS that can provide potential users with a distinct path from ordinary pedestrians by utilizing information stored in markers and expressing different results according to the recognition conditions. Figure 9c shows a contaminated marker; if the level of contamination is not enough to completely cover the pattern area, it does not affect the recognition of the marker. As shown in Figure 9d, the marker without contaminants exhibited the same recognition rate of 30 to 500 lux illuminance.
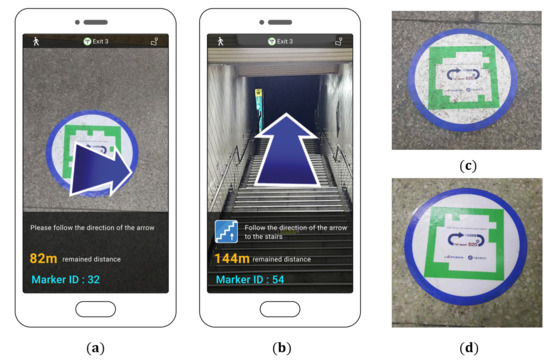
Figure 9.
Guide screen of the HMIPS: (a,b); installed marker: (c,d).
Before finally determining the size of the marker, we experimented with the recognition rate at a height of approximately 1 m by varying the size of the marker. The marker size was increased in 5 cm increments from the smallest size of 5 cm to the largest of 25 cm, and marker recognition was attempted 100 times for each size. Figure 10 shows the recognition rate according to the marker size. As can be seen in Figure 10, a marker size of 5 cm was not practical because it showed a recognition rate of just 27%. It can be seen that the recognition rate gradually increased up to a marker size of 20 cm, but there was little difference above that. Based on this result, we decided to make the final marker size 20 cm and set it as such in the experiment.
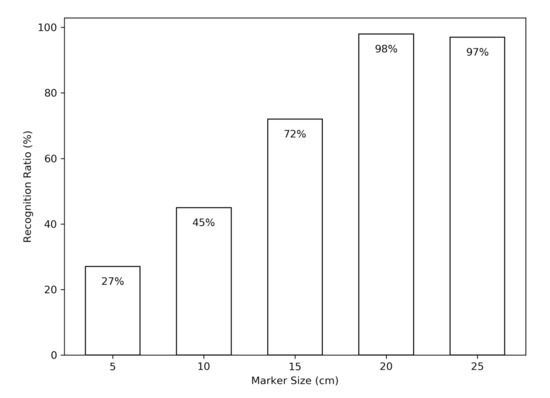
Figure 10.
Marker recognition test.
4.3. Tracking Accuracy Test
We compared the tracking accuracy achieved by the HMIPS with that of a model built in a supervised manner using the ground truth location labels. The error distances were measured according to the time sequences of the test data. In the tracking accuracy test, four scenarios were set, and approximately 30 markers were used for each scenario. The marker tracking experiment was conducted by dividing it as follows: the case of using only the marker; the case of using the marker and PDR together; and the case of performing error correction. In addition, for comparison between the marker- and radio-signal–based positioning, the most widely used Wi-Fi-based localization was performed so that readers could refer to it. These notations are listed in Table 1.

Table 1.
Notation summary of tracking accuracy test.
Figure 11 shows the positioning accuracy of each positioning technique for each test path. In Figure 11a,b, the tester frequently changed direction. However, in Figure 11c,d, the direction changed occasionally during mainly linear movement. The y-axis of each graph of Figure 11 represents the error distance, and the number on the x-axis represents the marker. The MP and MPE graphs show the results of positioning using PDR between consecutive markers. In each scenario, in the case of MP without inertial sensor correction, the accuracy degraded to a maximum of 2.5 m, but in the case of MPE with inertial sensor correction, the error distance did not exceed 2 m, showing an improvement of about 20%. In each graph, we can see that a red triangle rises above the blue circle.
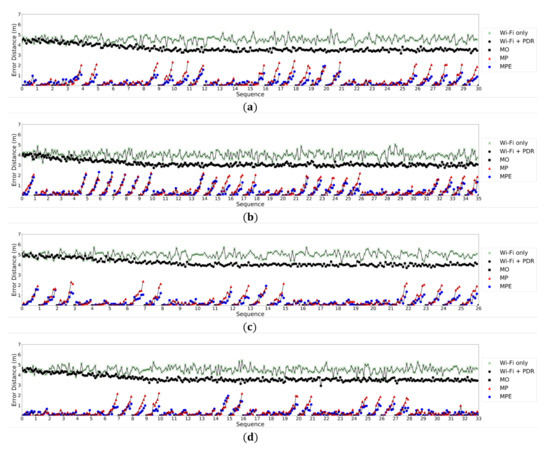
Figure 11.
Tracking accuracy test of the HMIPS: (a) test path 1; (b) test path 2; (c) test path 3; (d) test path 4.
When the direction is changed, the accuracy gradually decreased due to gyro drift, and when the tester reached the next marker, the error distance converged back to zero. Because the MPE uses distance information and location information between successive markers, the gyro drift phenomenon is alleviated, thus showing better accuracy than MP. In the case of MO using only a marker, the error distance was 0, and because PDR was not used, a black square was continuously displayed at the 0 point of the graph. The positioning using only Wi-Fi showed an average accuracy of 4.4 m, and the positioning results fluctuated and were not stable. In contrast, on using PDR and Wi-Fi together, it can be seen that the tracking accuracy converged at approximately 3.5–4 m. However, owing to the unstable Wi-Fi environment, a sudden drop in accuracy was observed in the MPE. Table 2 compares the experimental results shown in Figure 11. Note that the experimental results for MO have not been included in this table because the error distance is always 0.
Table 2.
Comparison of experimental results shown in Figure 11.
5. Discussion
The main purpose of the system proposed in this paper is to serve an AR-based navigation service to the public by providing a marker- and error-corrected PDR-based localization system. This aim was accomplished by developing a real-time navigation service and error correction model. In addition, we have shown through experimentation that the proposed system can operate more accurately using various techniques. In contrast, other methods using marker-based positioning have left doubts because they simply introduced the concept of a system or reviewed a questionnaire, rather than sharing their full experimental results. The proposed system enables the entire process of marker-based positioning, from specifying a marker installation location, to printing a marker, from the map registration stage. In other words, the system developed in this study enables a navigation service to be used more accurately in various subway stations.
In experiments, it was confirmed that the HMIPS had improved tracking accuracy over existing methods. In a subway station, the tracking accuracy was improved by 20% in the 3-D space during tracking. Compared to the method using radio signals, our method shows approximately 37.5% better positioning results. However, this result cannot be of great significance because the approaching techniques were quite different. Nevertheless, for places with many environmental variables, such as subway stations, it may be better to provide services using markers rather than using radio signals. In other words, these results imply that an indoor navigation service is possible through the HMIPS, even in places where there are factors that can affect sensor data, such as numerous electrical wiring installations such as those found in subway stations, and frequent entry and exit of trains. Since the system we propose is based on markers, navigation services are not limited to subway stations only. That is, the system can be applied without any limitations to any other classical indoor scenario, such as a supermarket or an underground parking lot, if a marker is installed.
Although our proposed system works well in subway stations, there are still problems to be solved. We manufactured high-quality materials to minimize marker contamination but could not completely block it (contamination). Furthermore, because high-quality materials were used, it was inevitable that the production cost of the marker proved to be expensive. We provided an image for printing markers on the HMIPS, but the print quality was up to the user. Moreover, if we want to provide practical service for an extended period of time, we will not be able to use ordinary paper. Although these limitations exist, we have confirmed that large-scale services for the public are possible if supported by government departments or companies. We plan to research the possibility of more accurate positioning along with measures to minimize marker contamination and reduce manufacturing costs in future studies.
6. Conclusions
This study investigates customized walking navigation using the HMIPS for subway stations. It explores the location of users using smartphone cameras and markers. The proposed system communicates guidance information based on AR. It was implemented at the Sinjeongnegeori Station in Korea by for use by the public. We confirmed the practicality of the proposed system through a one-year pilot project, and we are now developing the system for the purpose of providing a web-based integrated system in the form of an open API called I Lead You.
Author Contributions
In this work, G.L. conceived, designed, and wrote the paper, and H.K. performed the experiments and analyzed the experiment data. All authors have read and agreed to the published version of the manuscript.
Funding
This work is supported by the Korea Agency for Infrastructure Technology Advancement (KAIA) grant funded by the Ministry of Land, Infrastructure and Transport of Korean government (Grant 20CTAP-C151789-02). This was supported by Korea National University of Transportation in 2020.
Conflicts of Interest
The authors declare no conflict of interest.
References
- Huang, B.; Xu, Z.; Jia, B.; Mao, G. An online radio map update shceme for wifi fingerprint-based localization. IEEE Internet Things J. 2019, 6, 6909–6918. [Google Scholar] [CrossRef]
- Zhao, F.; Huang, T.; Wang, D. A probabilistic approach for wifi fingerprint localization in severely dynamic indoor environments. IEEE Access 2019, 7, 116348–116357. [Google Scholar] [CrossRef]
- Luo, R.C.; Hsiao, T.J. Indoor localization system based on hybrid Wi-Fi/BLE and hierarchical topological fingerprinting approach. IEEE Trans. Veh. Tech. 2019, 68, 10791–10806. [Google Scholar] [CrossRef]
- Dinh, T.M.T.; Duong, N.S.; Sandrasegaran, K. Smartphone-based positioning using BLE iBeacon and reliable lightweight fingerprint map. IEEE Sens. J. 2020, 20, 10283–10294. [Google Scholar] [CrossRef]
- Yeh, S.C.; Hsu, W.H.; Lin, W.Y.; Wu, Y.F. Study on an indoor positioning system using earth’s magnetic field. IEEE Trans. Inst. Meas. 2020, 69, 865–872. [Google Scholar] [CrossRef]
- Jung, S.H.; Moon, B.C.; Han, D.S. Unsupervised learning for crowdsourced indoor localization in wireless networks. IEEE Trans. Mob. Comput. 2016, 15, 2892–2906. [Google Scholar] [CrossRef]
- Jo, C.; Lee, C. Multilateration method based on the variance of estimated distance in range-free localization. Electron. Lett. 2016, 52, 1078–1080. [Google Scholar] [CrossRef]
- Wu, Y.I.; Wang, H.; Zheng, X. WSN localization using rss in three-dimensional space—A geometric method with closed-form solution. IEEE Sens. J. 2016, 16, 4397–4404. [Google Scholar] [CrossRef]
- Peral, J.A.; Raulefs, R.; Lopez, J.A.; Seco, G. Survey of cellular mobile radio localization methods: From 1 g to 5 g. IEEE Commun. Surv. Tutor. 2018, 20, 1124–1148. [Google Scholar] [CrossRef]
- Liu, M.; Wang, H.; Yang, Y.; Zhang, Y.; Ma, L.; Wang, N. RFID 3-d indoor localization for tag and tag-free target based on interference. IEEE Trans. Instr. Meas. 2019, 68, 3718–3732. [Google Scholar] [CrossRef]
- Zhuang, Y.; Hua, L.; Qi, L.; Yang, J.; Cao, P.; Cao, Y.; Wu, Y.; Thompson, J.; Haas, H. A survey of positioning systems using visible LED lights. IEEE Commun. Surv. Tutor. 2018, 20, 1963–1988. [Google Scholar] [CrossRef]
- Esslinger, D.; Oberdorfer, M.; Zeitz, M.; Tarín, C. Improving ultrasound-based indoor localization systems for quality assurance in manual assembly. In Proceedings of the 2020 IEEE International Conference on Industrial Technology (ICIT), Buenos Aires, Argentina, 26–28 February 2020. [Google Scholar] [CrossRef]
- Li, D.; Lu, Y.; Xu, J.; Ma, Q.; Liu, Z. iPAC: Integrate pedestrian dead reckoning and computer vision for indoor localization and tracking. IEEE Access 2019, 7, 183514–183523. [Google Scholar] [CrossRef]
- Tiwari, S.; Jain, V.K. HILS: Hybrid indoor localization system using Wi-Fi received signal strength and inertial sensor’s measurements of smart-phone. IET Commun. 2019, 13, 1595–1606. [Google Scholar] [CrossRef]
- Tong, X.; Su, Y.; Li, Z.; Si, C.; Han, G.; Ning, J.; Yang, F. A double-step unscented kalman filter and hmm-based zero-velocity update for pedestrian dead reckoning using mems sensors. IEEE Trans. Ind. Electron. 2020, 67, 581–591. [Google Scholar] [CrossRef]
- Romli, R.; Razali, A.F.; Ghazali, N.H.; Hanin, N.A.; Ibrahim, S.Z. Mobile augmented reality (AR) marker-based for indoor library navigation. In Proceedings of the IOP Conference Series: Materials Science Engineering, Perlis, Malaysia, 23 December 2019. [Google Scholar] [CrossRef]
- Khan, D.; Ullah, S.; Nabi, S. A generic approach toward indoor navigation and pathfinding with robust marker tracking. Remote Sens. 2019, 11, 3052. [Google Scholar] [CrossRef]
- Zhang, X.; Yao, X.; Zhu, Y.; Hu, F. An ARCore based user centric assistive navigation system for visually impaired people. Appl. Sci. 2019, 9, 989. [Google Scholar] [CrossRef]
- Chaccour, K.; Badr, G. Computer vision guidance system for indoor navigation of visually impaired people. In Proceedings of the 2016 IEEE 8th International Conference on Intelligent Systems, Sofia, Bulgaria, 4–6 September 2016. [Google Scholar] [CrossRef]
- Subakti, H.; Tolle, H.; Aswin, M. Engfi Gate: An indoor guidance system using marker-based cyber-physical augmented-reality. Int. J. Electr. Comput. Eng. 2018, 8, 34–42. [Google Scholar] [CrossRef][Green Version]
- Hübner, P.P.; Weinmann, M.; Wursthorn, S. Marker-based localization of the microsoft hololens in building models. Int. Arch. Photogramm. Remote Sens. Spat. Inf. Sci. 2018, 621, 195–202. [Google Scholar] [CrossRef]
- Heya, T.A.; Arefin, S.E.; Chakrabarty, A.; Alam, M. Image processing based indoor localization system for assisting visually impaired people. In Proceedings of the 2018 Ubiquitous Positioning, Indoor Navigation and Location-Based Services (UPINLBS), Wuhan, China, 22–23 March 2018. [Google Scholar] [CrossRef]
- Lightbody, P.; Krajník, T.; Hanheide, M. An efficient visual fiducial localisation system. ACM SIGAPP Appl. Comput. Rev. 2017, 17, 28–37. [Google Scholar] [CrossRef]
- Li, Y.; Zhu, S.; Yu, Y.; Wang, Z. An improved graph-based visual localization system for indoor mobile robot using newly designed markers. Int. J. Adv. Robot. Syst. 2018, 15, 1–15. [Google Scholar] [CrossRef]
- Babu, S.; Markose, S. IoT enabled robots with QR code based localization. In Proceedings of the 2019 International Conference on Emerging Trends and Innovations in Engineering and Technological Research, Ernakulam, India, 11–13 July 2018. [Google Scholar] [CrossRef]
- Gao, R.; Tian, Y.; Ye, F.; Luo, G.; Wang, Y.; Wang, T. Sextant: Towards ubiquitous indoor localization service by photo-taking of the environment. IEEE Trans. Mob. Comput. 2016, 15, 460–474. [Google Scholar] [CrossRef]
- Dong, J.; Noreikis, M.; Xiao, Y.; Yla, A. ViNav: A vision-based indoor navigation system for smartphones. IEEE Trans. Mob. Comput. 2019, 1461–1475. [Google Scholar] [CrossRef]
- Niu, Q.; Li, M.; He, S.; Gao, C.; Chan, S.; Luo, X. Resource-efficient and automated image-based indoor localization. ACM Trans. Sens. Netw. 2019, 15, 1–31. [Google Scholar] [CrossRef]
- Taira, H.; Okutomi, M.; Sattler, T.; Cimpoi, M.; Pollefeys, M.; Sivic, J.; Torii, A. InLoc: Indoor visual localization with dense matching and view synthesis. In Proceedings of the 2018 IEEE/CVF Conference on Computer Vision and Pattern Recognition, Salt Lake City, UT, USA, 18–23 June 2018. [Google Scholar] [CrossRef]
- Sun, M.; Zhang, L.; Liu, Y.; Miao, X.; Ding, X. See-your-room: Indoor localization with camera vision. In Proceedings of the ACM Turing Celebration Conference—China (ACM TURC ’19), Association for Computing Machinery, New York, NY, USA, 17–19 May 2019. [Google Scholar] [CrossRef]
- Zhao, Y.; Xu, J.; Wu, J.; Hao, J.; Qian, H. Enhancing camera-based multimodal indoor localization with device-free movement measurement using wifi. IEEE Internet Things J. 2020, 7, 1024–1038. [Google Scholar] [CrossRef]
- Poulose, A.; Han, D.S. Hybrid indoor localization using IMU sensors and smartphone camera. Sensors 2019, 19, 5084. [Google Scholar] [CrossRef]
- Zheng, Y.; Shen, G.; Li, L.; Zhao, C.; Li, M.; Zhao, F. Travi-Navi: Self-deployable indoor navigation system. IEEE/ACM Trans. Netw. 2017, 25, 2655–2669. [Google Scholar] [CrossRef]
- Lee, M.; Han, D. Voronoi tessellation-based interpolation method for wi-fi radio map construction. IEEE Commun. Lett. 2012, 16, 404–407. [Google Scholar] [CrossRef]
- Katsavounidis, I.; Kuo, C.; Zhen, Z. A new initialization technique for generalized Lloyd iteration. IEEE Signal Proc. Lett. 1994, 1, 144–146. [Google Scholar] [CrossRef]
- Chowdhury, M.H.; Little, W.D. Image thresholding techniques. In Proceedings of the IEEE Pacific Rim Conference on Communications, Computers, and Signal Processing, Victoria, BC, Canada, 17–19 May 1995. [Google Scholar] [CrossRef]
- Rao, K.R.; Ben-Arie, J. Optimal edge detection using expansion matching and restoration. IEEE Trans. Pattern Anal. Mach. Intell. 1994, 16, 1169–1182. [Google Scholar] [CrossRef]
- Lee, G.; Moon, B.; Han, D. Fusion of the slam with wi-fi-based positioning method for mobile robot-based learning data collection, localization, and tracking in indoor spaces. Sensors 2020, 20, 5182. [Google Scholar] [CrossRef]
- Lee, G.; Moon, B.; Park, M. Crowdsourcing-based learning data collection for real-time sensor error correction in indoor environments. IEEE Access 2020, 8, 127353–127367. [Google Scholar] [CrossRef]
- Chen, Z.; Zou, H.; Jiang, H.; Zhu, Q.; Chai, Y.; Xie, L. Fusion of wifi, smartphone sensors and landmarks using the kalman filter for indoor localization. Sensors 2015, 15, 715–732. [Google Scholar] [CrossRef] [PubMed]
Publisher’s Note: MDPI stays neutral with regard to jurisdictional claims in published maps and institutional affiliations. |
© 2020 by the authors. Licensee MDPI, Basel, Switzerland. This article is an open access article distributed under the terms and conditions of the Creative Commons Attribution (CC BY) license (http://creativecommons.org/licenses/by/4.0/).