Featured Application
Our method can be applied to AFAM imaging, which helps to analyze cell structure.
Abstract
Atomic force acoustic microscopy (AFAM) is a measurement method that uses the probe and acoustic wave to image the surface and internal structures of different materials. For cellular material, the morphology and phase images of AFAM reflect the outer surface and internal structures of the cell, respectively. This paper proposes an AFAM cell image fusion method in the Non-Subsampled Shearlet Transform (NSST) domain, based on local variance. First, NSST is used to decompose the source images into low-frequency and high-frequency sub-bands. Then, the low-frequency sub-band is fused by the weight of local variance, while a contrast limited adaptive histogram equalization is used to improve the source image contrast to better express the details in the fused image. The high-frequency sub-bands are fused using the maximum rule. Since the AFAM image background contains a lot of noise, and improved segmentation algorithm based on the Otsu algorithm is proposed to segment the cell region, and the image quality metrics based on the segmented region will make the evaluation more accurate. Experiments with different groups of AFAM cell images demonstrated that the proposed method can clearly show the internal structures and the contours of the cells, compared with traditional methods.
1. Introduction
Atomic force acoustic microscopy (AFAM) [1] is an imaging technology combining acoustic detection and atomic force microscopy (AFM), which can image nondestructively the internal structures, as well as the surface topography of the samples in high resolution. In AFAM, the transducer of the pedestal emits sound echo to the sample as the probe scans on the sample. The probe response signal is collected by the light spot detector mounted on the cantilever of the probe and analyzed during the scan. The morphology and phase images were obtained simultaneously after the scanning of the sample in 2D. When AFAM is applied to image cells, the morphology images could only show cytoplasmic regions, while their phase images showed the cytoplasmic internal structures, but without the cell boundaries clearly [1]. To see the cells in detail, image fusion is needed to fuse both images so that the fused image can contain both information of the morphology contour and the internal structures of the cell. To our knowledge, there is no such research on AFAM image fusion yet.
Image fusion is a process combining two or more source images of the same scene to obtain a single fused image which is more suitable for human visual perception or computer vision processing. The fused image requires to dig the duplicate Supplementary Materials in the source images and remove the redundant information. The selection of source image information is critical in image fusion. One of the important methods in image fusion is to separate the information in the source images and then fuse different types of information separately. For instance, the fusion method based on multi-scale transformation decomposes the source images at different scales to obtain the information, such as edges, details, and base contours, and applies suitable fusion rules to different kinds of information to obtain a better fused image.
Multi-scale transform (MST) is an important tool in image fusion, and many MSTs have been proposed, such as wavelet transform [2], contourlet transform [3], curvelet transform [4], shearlet transform [5], and the nonsubsampled contourlet transform (NSCT) [6,7]. Non-subsampled shearlet transform (NSST) [8,9] is an improved multi-scale geometric analysis tool based on shearlet transform, which has the advantages of simple calculation and less Gibbs effect, and therefore, is widely used in multi-scale image fusion [10,11,12]. NSST can separate image information, such as edges and base layers, so that different fusion rules can be applied to different kinds of information. Guo et al. [11] presented a multi-focus image fusion method based on NSST and the human vision system. Vishwakarma et al. proposed a variable coefficient Meyer window for constructing a shearing filter, which is used for image fusion [12]. However, these methods only work well for certain types of image fusion, such as optical images with an inconsistent focus in the same scene.
Contrast limited adaptive histogram equalization (CLAHE) can effectively enhance the local contrast of images, and the variance reflects the local information richness of the image, which is an effective indicator for information selection in image fusion [13,14]. Because the local variance of an image by CLAHE could reflect the local image information efficiently, therefore, it is used in our image fusion to preserve more information of low-contrast images.
In this paper, a cell image fusion method with AFAM based on the local variance in the NSST domain is proposed. The proposed method decomposes the image into low-frequency sub-band and a series of high-frequency sub-bands using NSST and fuses the low-frequency and high-frequency sub-bands using a weight map based on CLAHE-enhanced variance and maximum rule, respectively. The results of the experiments showed that the proposed method can effectively protect both edge and geometric structures by combining the morphology and phase images.
2. Materials and Methods
2.1. Non-Subsampled Shearlet Transform (NSST)
NSST is an improvement method, based on shearlet transform combining with a non-subsampled Laplacian pyramid (NSLP). Wang et al., proposed a method to implement NSST on time-domain directly [8], which divides the implementation of NSST into two steps: Multi-scale decomposition and directional filtering. In NSST, NSLP filters replace the Laplacian pyramid filters used in the shearlet transform to scale the image. The source image is decomposed into sub-bands, which have the same size of the source image, using -class non-subsampled pyramid. The sub-bands include a low-frequency sub-band and k high-frequency sub-bands {}, which are represented by:
where denotes the low-frequency sub-band at resolution level k and denotes the high-frequency sub-bands. and represent low pass and high pass filters, respectively.is the identity matrix, and is the kth filter after down sampling.
The high-pass image would convolve with a directional filter, which has a large flexibility in the choice. For instance, it can be calculated simply in pseudo-polar grid with Meyer window function and translated into the Cartesian grid. The NSST coefficients can be calculated by the following equation:
where denotes a directional filter in the time domain.
2.2. Contrast Limited Adaptive Histogram Equalization (CLAHE)
Contrast limited adaptive histogram equalization is a classic method in image contrast enhancement [15]. To perform CLAHE, the original image is split into equally-sized rectangular partitions, while on each partition, the same transformation function will be applied.
Contrast-limited gray level transformation is the main procedure in CLAHE, which is similar to the traditional histogram equalization (HE), but limits the contrast by a clip point to cut off the peak value in the histogram. For a given image with L discrete gray levels, denoted as , the probability density function (PDF) in each partition is defined as:
where denotes the number of pixels with the gray level and is the total number of pixels in the partition. Crop above the clip point and distribute the cropped part evenly to to get a new , as shown in Figure 1a. The gray level transformation function is showed in Equation (6). It should be noted that the transformation functions on different partitions will be different.
where is the probability distribution function, which is the integral of .
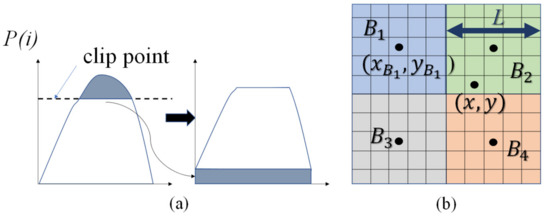
Figure 1.
The probability density function (PDF) redistribution and bilinear interpolation within blocks. (a) Clip point and redistribution; (b) Bilinear interpolation.
To remove the possible block artifacts, a bilinear interpolation between the partitions was used to smooth the final pixel values. The transformation is appropriate for the center pixel of each partition, while the other pixel values are interpolated from the transformation functions in the surrounding partitions.
where denotes the value of the pixel at and is the transformed image. Pixel is surrounded by the center of four partitions . is transform function in the block , is the center of the block and is the length of the partitions (see Figure 1b).
2.3. The Framework of Proposed Fusion Method
The framework of our proposed fusion method was depicted in Figure 2. It was composed of the following steps.
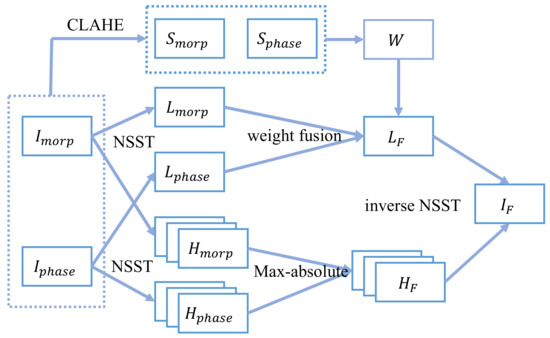
Figure 2.
Framework of the proposed method.
2.3.1. Decomposition
The morphology and phase images are first decomposed with NSST into a low-frequency sub-band and multiple high-frequency sub-bands, respectively. Then, they are fused using different fusion rules separately.
2.3.2. Low-Frequency Sub-Band Fusion
The low-frequency sub-band fusion adopts the weight fusion rule with a weight map. To enhance local information, CLAHE is calculated on the initial image, and its local variance is adopted to calculate the weight map .
where denotes the image processed with CLAHE and denotes the position of the pixel, denotes a region centered on with the size of, denotes the number of the pixels in region . denotes local variance, and the weight map is calculated by Equation (10) with the local variance , and weight coefficient . The fused image is fused by Equation (11) for each pixel by the weight . With the increase of , the fusion effect is gradually improved and finally tends to be flat. In the experiment, is a value suitable for the fusion.
2.3.3. High-Frequency Sub-Bands Fusion
The energy of high-frequency sub-bands is low, and the key information in high-frequency sub-bands of two source images do not overlap. Among them, the part with larger absolute value will dominate the feature. Therefore, the max rule is selected to fuse the high-frequency sub-bands:
2.3.4. Image Quality Metrics
In cellular imaging, cellular information is more important in the fused image. Therefore, background information should be ignored when evaluating the quality of the fused image. To remove the background, a method based on the Otsu algorithm is used. Otsu [16] is an image segmentation method based on the principle of inter-class variance maximization, which is shown as:
where is the gray level and denotes the inter-class variance of . Equation (13) shows that the otsu maximizes the inter-class variance.
Due to there are not just one cell in the image, a single Otsu segmentation cannot accurately obtain all cell boundaries. To solve this problem, the improved Otsu algorithm was proposed. To get the ROIs of different cell parts, the morphology image is segmented with the Otsu algorithm repeatedly, and the parts below the threshold are discarded until a relatively consistent region is obtained. Then, dilate the part to include the cell boundary. The detail steps are described as follows:
- Initialize ,,;
- Repeat
- /* get the histogram of the part greater than the threshold*/
- /* use otsu algorithm to get the new threshold */
- Until
- ROI=dilate (ROI).
Figure 3a shows the multiple peaks in the image histogram, and Figure 3b (green) shows the remaining background areas after only once Otsu segmentation. But, with continuously segmenting the remaining regions, the background part is discarded, and the ROI converges to the cell regions.
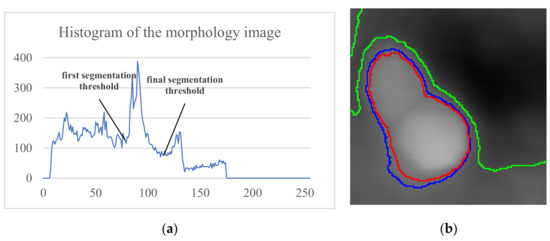
Figure 3.
Segmentation result: (a) Histogram and segmentation threshold of the morphological image; (b) segmentation boundaries. The green, blue, and red lines are the first, second, and final segmentation result boundaries, respectively.
Fusion steps:
All the fusion steps are shown in Figure 2.
- Step 1: Decompose the morphology and phase images using 3 level NSST to obtain their low-frequency sub-bands {, } and a series of high-frequency sub-bands {} at each K-scale and J-direction.
- Step 2: Use CLAHE for the source images, and use Equations (8) and (9) to calculate and . Get the weight map using Equation (10), and fuse the low-frequency sub-bands using Equation (11) to obtain . The weight coefficient in our experiment is set as and the size of the region to calculate the variance is .
- Step 3: Equation (12) is utilized to deal with the high-frequency sub-bands.
- Step 4: Perform the inverse NSST of the low-frequency and the high-frequency sub-bands to obtain the fused image.
- Step 5: Segment the image ROI and evaluate the results.
3. Results and Discussion
The schematic diagram of the AFAM and the image acquisition have been clearly presented in Ref. [1], where AFAM was used to successfully and accurately image the morphology and internal structures of cells in a facile and non-invasive manner. Sixteen groups of morphology and phase images were used from 2 scans in Ref. [1] for testing, which were provided by the Medical Ultrasonic Laboratory of Huazhong University of Science and Technology, Wuhan, China. From Figure 4b,d, it is obvious that the backgrounds in the phase images are complicated. To show the cells more clearly, we segmented the cell image from their corresponding morphology images and ignored the background.
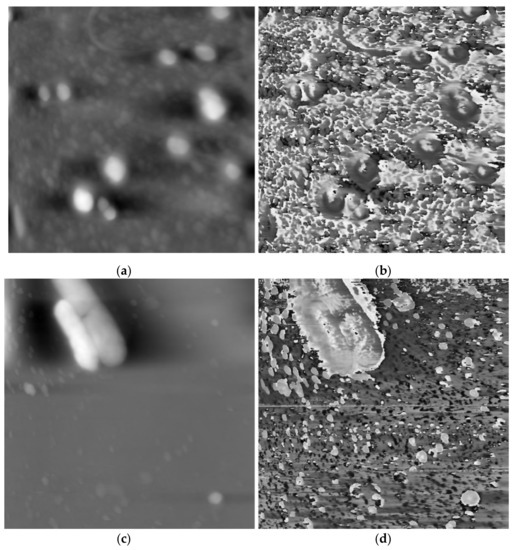
Figure 4.
Different scan results of atomic force acoustic microscopy (AFAM) in our experiments. (a) morphology image of scan 1; (b) phase image of scan 1; (c) morphology image of scan 2; (d) phase image of scan 2.
Our fusion method is compared with five different fusion methods, including Laplacian pyramid (LP) [17], curvelet transform (CVT) [18], NSST-VGG [19], gradient transfer fusion (GFT) [20], and FusionGAN [21]. In the experiments, for the sake of fairness, the resolution level samples in LP, CVT, and NSST-VGG are set as 3, which are the same as our proposed method. The rest of the parameters were set to produce the best results of the experimental results of their methods.
3.1. Quality Evaluation
Those quantitative evaluation metrics, including MI [22], QAB/F [23], QLLSIM [24], and VIFF [25] are often used to evaluate the performances of different fusion methods. A cell ROI region segmentation method based on the improved Otsu algorithm in Section 2 is applied to make the results more convincing.
3.1.1. MI
Mutual information (MI) [22] shows the correlation between two events, which can be used for evaluating image fusion performance. The higher score of MI is, the richer the information is obtained from the source images. The MI of two images is defined as follows:
where is the fused image and , are the source images., and are the entropies of images A, B, and F, respectively.
3.1.2.
reflects the quality of edge information obtained from the fusion of input images and can be used to compare the performance of different image fusion algorithms [23], which is defined as follows:
where , and are the edge strength and orientation preservation value at the location . and are the weight maps which are equal to the edge strength in the source image. N×M are the size of the source images. The higher value of is, the less edge information of fused image loss.
3.1.3.
: A quality metric of fused image according to the structural similarity between the source images. The closer the value to 1, the better the fusion performance. is calculated from SSIM between fused image and two source images. SSIMM is defined as follow:
where lSSIM are obtained by using the method in [24], is the size of ,and is local weight coefficient which is calculated as .
3.1.4. VIFF
VIFF is a quality metric of fused image using visual information fidelity. Fused image and two source images are decomposed into different scales using Laplacian Pyramid. At each scale, the image is divided into different blocks. Then, evaluate the visual information of each block with and without distortion. Evaluate the VIFF for each scale. Finally, calculate the overall metric based on the above result [25].
3.2. Experimental Results
Three pairs of morphology and phase images of Staphylococcus aureus, called “Data-1”,” Data-2”,” Data-3”, respectively, are selected as the representative results for subjective evaluation. In the results of using LP, CVT, and NSST-VGG, although the internal structure of the cell is very clear, the cell boundary is very blurred, and the surrounding phase image noise is mixed together. All the results using FusionGAN have clear boundary information, but in “Data-1” and “Data-3”, the results using FusionGAN have a lack of internal structure information, as shown in Figure 5g and Figure 6g. And in Figure 7g, the result shows only the boundaries of the internal structure. This shows that the FusionGAN fusion effect is not stable. In “Data 3”, the contrast of GFT results is low, but it performs better in “Data-1” and “Data-2”. This means that GFT has similar problems with FusionGAN. The results of the proposed method could clearly show the internal structures and contours of the cells, and the intracellular structures and cytoplasmic regions are with high contrast. But in terms of visual sense, its performance is not as good as the better results in GFT and FusionGAN.
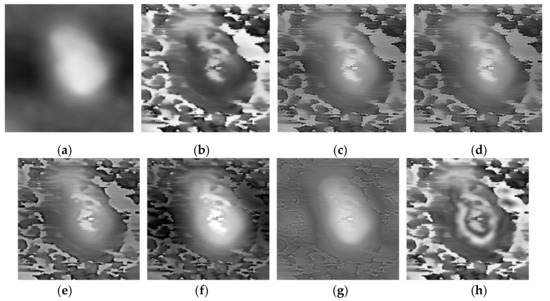
Figure 5.
Fusion results of the ‘‘Data-1’’ image set with different methods. (a) Morphology; (b) Phase; (c) Laplacian pyramid (LP); (d) curvelet transform (CVT); (e) Non-Subsampled Shearlet Transform (NSST)-VGG; (f) gradient transfer fusion (GFT); (g) FusionGAN; (h) proposed.
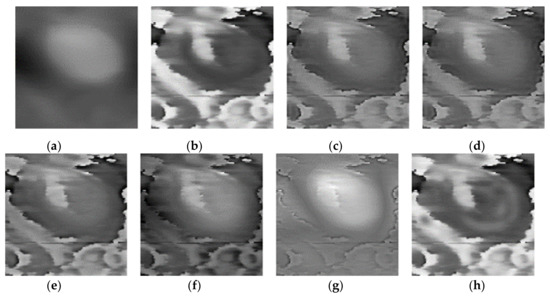
Figure 6.
Fusion results of the ‘‘Data-2’’ image set with different methods. (a) Morphology; (b) phase; (c) LP; (d) CVT; (e) NSST-VGG; (f) GFT; (g) FusionGAN; (h) proposed.
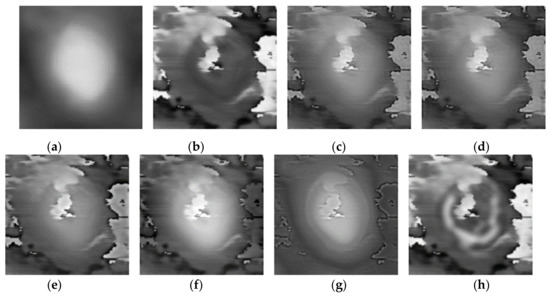
Figure 7.
Fusion results of the ‘‘Data-3’’ image set with different methods. (a) Morphology; (b) Phase; (c) LP; (d) CVT; (e) NSST-VGG; (f) GFT; (g) FusionGAN; (h) proposed.
Table 1 showed the quantitative comparisons of the four metrics for six methods, and shows the p-values of the proposed method for different metrics of each comparison method. It was demonstrated that the proposed method is the best in almost all metrics except GFT, and the t-test showed that there is a significance difference to the other methods. Although GFT has the highest score on , the p-values in Table 2 showed that there is no significant difference from the proposed method. The quantitative analysis results are consistent with the subjective visual comparison results. LP, CVT, and NSST-VGG are all scale fusion methods, the performance of the three methods is relatively close, and there is a large gap with the proposed method. The GFT method performs better when the morphology image and the phase image have large gray levels, such as “data-1”, but when the two are close, the fusion image will be blurred. indicates the fusion effects of edge information, GFT results are the worst. FusionGAN requires a lot of data for training, and AFAM cell images cannot meet this requirement. The network comes from an infrared image fusion project [21] with similar targets, which cannot achieve good results for AFAM cell image fusion, and the result is unstable. The FusionGAN method is very difficult to train and not easy to converge. It is difficult to achieve a good fusion effect even with a large number of images.

Table 1.
Mean values of Quality metric for different methods with 16 cell images.
Table 2.
p-values of the proposed method compared to other methods in different metrics.
4. Conclusions
This paper proposed a novel fusion method for AFAM cell images to solve the problem that the phase image cannot show the surface structure information. The proposed method utilizes NSST to decompose the source images into low-frequency and high-frequency sub-bands. A weight map calculated by the variance of the image, which is applying CLAHE to enhance the contrast, is performed for low-frequency sub-bands fusion—while the max rule is used for high-frequency fusion. Experiments have been performed on 16 groups of morphology and phase images, which are compared to five methods, including LP, CVT, NSST-VGG, GFT, FusionGAN, and only the cell area is segmented for the evaluation. Both subjective evaluations and objective quality metrics, including , and VIFF, showed that our method has a clearer intracellular structure and cellular contour, compared with other methods, which is beneficial to the analysis of cell structures.
Supplementary Materials
The following are available online at https://www.mdpi.com/2076-3417/10/21/7424/s1, Previously reported AFAM scan data were used to support this study and are available at [doi:10.3390/cells8040314]. These prior studies (and dataset) are cited at relevant places within the text as references [1].
Author Contributions
Conceptualization, M.D.; methodology, P.C.; software, P.C.; validation, X.L.; formal analysis, P.C.; investigation, P.C.; resources, M.D.; data curation, P.C.; writing—original draft preparation, P.C.; writing—review and editing, X.L. and M.D.; visualization, P.C.; supervision, M.D.; project administration, M.D.; funding acquisition, M.D. All authors have read and agreed to the published version of the manuscript.
Funding
This research was funded by the National Natural Science Foundation of China with the grant No. 81571754 and partly funded by the Major National Scientific Instrument and Equipment Development Project under the grant No 2013YQ160551.
Conflicts of Interest
The authors declare no conflict of interest.
References
- Li, X.; Lu, A.; Deng, W.; Su, L.; Wang, J.; Ding, M. Noninvasive Subcellular Imaging Using Atomic Force Acoustic Microscopy (AFAM). Cells 2019, 8, 314. [Google Scholar] [CrossRef] [PubMed]
- Wang, M.; Zhou, S.; Yang, Z.; Liu, Z.; Ren, S. Image fusion based on wavelet transform and gray-level features. J. Mod. Opt. 2019, 66, 77–86. [Google Scholar] [CrossRef]
- Li, Z.Y.; Zhou, J.M.; Wang, Y. Visibility-enhanced dual-band infrared image fusion based on nonsubsampled contourlet transform. AOPC 2017 Opt. Sens. Imaging Technol. Appl. 2017, 10462, 104621F. [Google Scholar]
- Agrawal, D.; Karar, V. Generation of enhanced information image using curvelet-transform-based image fusion for improving situation awareness of observer during surveillance. Int. J. Image Data Fusion 2019, 10, 45–57. [Google Scholar] [CrossRef]
- Kutyniok, G.; Labate, D. Resolution of the wavefront set using continuous shearlets. Trans. Am. Math. Soc. 2009, 361, 2719–2754. [Google Scholar] [CrossRef]
- Anandhi, D.; Valli, S. An algorithm for multi-sensor image fusion using maximum a posteriori and nonsubsampled contourlet transform. Comput. Electr. Eng. 2018, 65, 139–152. [Google Scholar] [CrossRef]
- He, K.; Zhou, D.; Zhang, X.; Nie, R.; Wang, Q.; Jin, X. Infrared and visible image fusion based on target extraction in the nonsubsampled contourlet transform domain. J. Appl. Remote Sens. 2017, 11, 015011. [Google Scholar] [CrossRef]
- Easley, G.; Labate, D.; Lim, W. Sparse directional image representations using the discrete shearlet transform. Appl. Comput. Harmon. Anal. 2008, 25, 25–46. [Google Scholar] [CrossRef]
- Lim, W.Q. The Discrete Shearlet Transform: A New Directional Transform and Compactly Supported Shearlet Frames. IEEE Trans. Image Process. 2010, 19, 1166–1180. [Google Scholar]
- Wu, W.; Qiu, Z.; Zhao, M.; Huang, Q.; Lei, Y. Visible and infrared image fusion using NSST and deep Boltzmann machine. Optik Int. J. Light Electron. Opt. 2018, 157, 334–342. [Google Scholar] [CrossRef]
- Luping, X.; Guorong, G.; Dongzhu, F. Multi-focus image fusion based on non-subsampled shearlet transform. IET Image Process. 2013, 7, 633–639. [Google Scholar]
- Vishwakarma, A.; Bhuyan, M.K. Image Fusion Using Adjustable Non-subsampled Shearlet Transfor. IEEE Trans. Instrum. Meas. 2018, 68, 3367–3378. [Google Scholar] [CrossRef]
- Deng, C.; Wang, Z.; Li, X.; Li, H.N.; Cavalcante, C.C. An Improved Remote Sensing Image Fusion Algorithm Based on IHS Transformation. KSII Trans. Internet Inf. Syst. 2017, 11. [Google Scholar] [CrossRef]
- Jin, Z.; Min, L.; Ng, M.K.; Zheng, M. Image colorization by fusion of color transfers based on DFT and variance features. Comput. Math. Appl. 2019, 77, 2553–2567. [Google Scholar] [CrossRef]
- Chang, Y.; Jung, C.; Ke, P.; Song, H.; Hwang, J. Automatic contrast-limited adaptive histogram equalization with dual gamma correction. IEEE Access 2018, 6, 11782–11792. [Google Scholar] [CrossRef]
- Otsu, N. A Threshold Selection Method from Gray-Level Histograms. IEEE Trans. Syst. Man Cybern. 1979, 9, 62–66. [Google Scholar] [CrossRef]
- Burt, P.J.; Adelson, E.H. The Laplacian pyramid as a compact image code. IEEE Trans. Commun. 1983, 31, 532–540. [Google Scholar] [CrossRef]
- Nencini, F.; Garzelli, A.; Baronti, S.; Alparone, L. Sensing image fusion using the curvelet transform. Inf. Fusion 2007, 8, 143–156. [Google Scholar] [CrossRef]
- Hou, R.; Zhou, D.; Nie, R.; Liu, D.; Ruan, X. Brain CT and MRI medical image fusion using convolutional neural networks and a dual-channel spiking cortical model. Med. Biol. Eng. Comput. 2018, 57, 887–900. [Google Scholar] [CrossRef]
- Ma, J.; Chen, C.; Li, C.; Huang, J. Infrared and visible image fusion via gradient transfer and total variation minimization. Inf. Fusion 2016, 31, 100–109. [Google Scholar] [CrossRef]
- Ma, J.; Yu, W.; Liang, P.; Li, C.; Jiang, J. FusionGAN: A generative adversarial network for infrared and visible image fusion. Inf. Fusion 2019, 48, 11–26. [Google Scholar] [CrossRef]
- Hossny, M.; Nahavandi, S.; Creighton, D. Comments on Information measure for performance of image fusion. Electron. Lett. 2008, 44, 1066–1067. [Google Scholar] [CrossRef]
- Xydeas, C.; Petrovic, V. Objective image fusion performance measure. Electron. Lett. 2000, 36, 308–309. [Google Scholar] [CrossRef]
- Yang, C.; Zhang, J.Q.; Wang, X.R.; Liu, X. A novel similarity based quality metric for image fusion. Inf. Fusion 2008, 9, 156–160. [Google Scholar] [CrossRef]
- Han, Y.; Cai, Y.; Cao, Y.; Xu, X. A new image fusion performance metric based on visual information fidelity. Inf. Fusion 2013, 14, 127–135. [Google Scholar] [CrossRef]


Publisher’s Note: MDPI stays neutral with regard to jurisdictional claims in published maps and institutional affiliations. |
© 2020 by the authors. Licensee MDPI, Basel, Switzerland. This article is an open access article distributed under the terms and conditions of the Creative Commons Attribution (CC BY) license (http://creativecommons.org/licenses/by/4.0/).