Article

Hydrogen Recovery from Waste Gas Streams to Feed (High-Temperature PEM) Fuel Cells: Environmental Performance under a Life-Cycle Thinking Approach

1
Departamento de Ingenierías Química y Biomolecular, Universidad de Cantabria, Avda. de Los Castros s/n, 39005 Santander, Spain
2
Departamento de Ingeniería Química, Universidad de Santiago de Chile, Av. Libertador Bernardo O’Higgins 3363, Estación Central, Santiago 9170019, Chile
3
ICGM–Aggregates, Interfaces and Materials for Energy, UMR 5253, Université de Montpellier, 34095 Montpellier CEDEX, France
*
Author to whom correspondence should be addressed.
Appl. Sci. 2020, 10(21), 7461; https://doi.org/10.3390/app10217461
Submission received: 23 September 2020 / Revised: 17 October 2020 / Accepted: 20 October 2020 / Published: 23 October 2020

Abstract

:
Fossil fuels are being progressively substituted by a cleaner and more environmentally friendly form of energy, where hydrogen fuel cells stand out. However, the implementation of a competitive hydrogen economy still presents several challenges related to economic costs, required infrastructures, and environmental performance. In this context, the objective of this work is to determine the environmental performance of the recovery of hydrogen from industrial waste gas streams to feed high-temperature proton exchange membrane fuel cells for stationary applications. The life-cycle assessment (LCA) analyzed alternative scenarios with different process configurations, considering as functional unit 1 kg of hydrogen produced, 1 kWh of energy obtained, and 1 kg of inlet flow. The results make the recovery of hydrogen from waste streams environmentally preferable over alternative processes like methane reforming or coal gasification. The production of the fuel cell device resulted in high contributions in the abiotic depletion potential and acidification potential, mainly due to the presence of platinum metal in the anode and cathode. The design and operation conditions that defined a more favorable scenario are the availability of a pressurized waste gas stream, the use of photovoltaic electricity, and the implementation of an energy recovery system for the residual methane stream.

1. Introduction

As the rural population is progressively moving to urban areas and cities, more and more people are being exposed to pollution levels that exceed the recommended levels for air quality. This situation is more critical in undeveloped and developing countries, but even in developed countries, more than 50% of the cities cannot achieve the air quality levels declared by the World Health Organization [1]. Energy-related activities, such as industrial sectors or buildings, are significant stationary sources of air pollution, specifically for CO2 emissions [2,3]. Energy consumption of buildings is among the largest of society, accounting for around 40% of the total energy consumptions and 36% of greenhouse gases (GHG) emissions in Europe [4]. Within this sector, residential buildings constitute about 75% of the total European building floor area, and suppose a worldwide energy consumption of approximately 30% [5]. This makes this sector an attractive target for the use of more environmentally friendly fuels and energy technologies. These cleaner fuels to replace traditional fossil fuels, are expected to play an essential role in the achievement of healthy urban air quality standards, and reduce pollutant emissions [6].
Hydrogen fuel cells are efficient electrochemical energy conversion devices with very low emissions; therefore, they must be taken into consideration to implement alternatives for clean power generation for stationary applications. A hydrogen fuel cell works by consuming oxygen and hydrogen as reactants, using electrochemical processes to produce electrical energy as the output, meaning water is the only emission. Among hydrogen fuel cells, the Polymer Electrolyte Membrane (PEM) fuel cell is a highly promising technology thanks to its high power density, high efficiency, low emissions, rapid start, and additional advantages [7,8]. Therefore, although hydrogen is still extensively used as chemical feedstock (refinery processes, ammonia production, coal refinement, organic and inorganic synthesis, metallurgy, etc.), hydrogen demand as an energy carrier is expected to rise significantly in the near future in all economy sectors (road transport, buildings, and industry) [9], within a new energy scenario based on the implementation of a hydrogen economy. The definitive characteristics of this new hydrogen economy will depend on the solutions provided to the pending challenges, since considerable improvements are still needed to guarantee the competitiveness of hydrogen conversion devices. Nevertheless, the resolution of these aspects does not look unrealistic in the mid-term, which explains the increasing research interest and policy support for these technologies worldwide [10]. Among the challenges, hydrogen production is a critical cornerstone of this new hydrogen economy [11].
As in the case of electricity, since hydrogen is a secondary source of energy, it can be obtained from different primary sources, including fossil resources (oil, coal, natural gas) or renewable energies (biomass, wind, solar, etc.) [12]. Based on the nature of the chemical process, the hydrogen production methods can be categorized into thermochemical, electrochemical, and biological methods [13]. The well-established industrial hydrogen production methods include steam methane reforming, auto-thermal reforming, gasification of coal, and partial oxidation of hydrocarbons, but electrolysis of water into hydrogen and oxygen using electricity has gained relevance in the last few years [14,15,16]. An interesting alternative source of hydrogen, not fully developed yet, is its recovery from industrial waste gas streams. Several examples of waste gas streams rich in hydrogen can be identified, and this work has focused on two different options. On the one hand, ammonia-based production can be a promising sector to obtain safe and affordable hydrogen [17]. In the synthesis section of ammonia plants, the unconverted synthesis gas that involves methane as inert gas is recirculated to the reactor. To avoid conversion, decrease (due to methane accumulation, a fraction of unconverted synthesis gas) is purged. These ammonia purge gases (APG) consist mainly of H2 (54–58%), N2 (23–26%), CH4 (14–16%) and Ar (<5%) [18,19]. The hydrogen is mostly recovered and recycled to the synthesis loop via membrane contactors or cryogenic systems, but some part of the cleaned purge gas is usually added to the reformer, or even directly released to the atmosphere [20]. On the other hand, coke oven gas (COG) is a typical by-product in the coking process of coal and can be considered as a potential feedstock for hydrogen recovery. During the coking process, the volatile coal matter is transferred to form COG, leaving carbon-intensive coke behind [21]. The obtained COG consists mainly of H2 (58–60%), CH4 (23–27%), CO (5–8%), and CO2 (<3%) [22,23]. Through this recovery method, these waste streams can be upgraded instead of burnt off in torches or, in the worst, directly emitted into the atmosphere [24]. Although sometimes COG is employed as fuel in the actual coke ovens or in alternative processes, this practice represents seriously ineffective use of energy when compared to the recovery of hydrogen. However, the recovery of hydrogen from these waste streams requires additional separation stages, which may imply significant amounts of energy and additional economic costs.
Although hydrogen is a clean carbon-free fuel, the environmental performance of the production processes depends on the primary sources (fossil fuels or renewable energy) and the specific process [25,26]. The primary energy inputs and the raw materials required in each process determine the environmental impact and sustainability of hydrogen production. Therefore, comprehensive analyses are needed to evaluate the suitability of each process to contribute to the hydrogen economy scenario. Life-cycle assessment (LCA) is a well-defined methodology to assess the environmental aspects and potential impacts associated with energy production [27,28,29], which has been extensively applied to hydrogen production options, such as steam methane reforming, gasification or ethanol reforming, so a relatively high number of LCA studies of hydrogen energy systems can be found in the scientific literature [30]. However, from our understanding, there is no study focused on the environmental evaluation of the upgrading of industrial waste gas streams to obtain high-quality hydrogen.
Therefore, the main objective of this work is to realize an LCA of the recovery of hydrogen from residual gas streams from two industrial processes to use it as feed in a high-temperature PEM fuel cell (HT PEMFC). HT PEMFC typically operates at ≥160 °C and atmospheric pressure, with dry feed gases, and they have the advantage that they are tolerant of higher concentrations of carbon monoxide (ca. 2%) in hydrogen than low-temperature PEMFC. Although reducing costs and improving durability are two well-known challenges to implement fuel cells, a challenge that should never be neglected is precisely the origin of the need to change the energy production system: The production of energy with minimal environmental impact. Consequently, evaluating the environmental impact of innovative energy technologies is required, and LCA is the best tool to achieve the goal. The assessment of the environmental impact of emerging technology, such as the proposed recovery process, is not an easy task [31]. Therefore, this purpose implies the development of the LCA methodology, including the definition of the objective and scope, description of the limits of the systems, and consideration of different functional units. The inputs and outputs of the system were compiled to obtain the corresponding life-cycle inventory, based on material and energy balances to develop the modeling of the system. Finally, the environmental impacts associated with the proposed processes were evaluated, paying special attention to identifying the critical stages and adequate design and operation conditions, and compared to alternative hydrogen production processes.

2. Methodology

2.1. Goal and Scope

This work covered the environmental evaluation of hydrogen recovery processes from two residual gas streams obtained in the production of coke and ammonia to use the recovered gas as feed to an HT PEMFC stack for stationary applications. Therefore, the main objective was the quantification of the environmental impacts and hot spots of the complete system and the loads attributable to the different stages of the process to identify the ones with greater environmental effects.
In addition, the hydrogen recovery was compared to other conventional hydrogen production options to have a better understanding of the most sustainable options and try to improve the competitiveness of the hydrogen recovery. Within this framework, the scope of this work included the processes for recover hydrogen with the purity level required to be used as feed for HT PEMFC from waste gases obtained in industrial production of coke and ammonia and the recovery of electric energy from the gases discarded during the recovery process. The two streams considered for hydrogen recovery were the tail gas of a coke oven (COG) and the ammonia purge gas (APG). This study followed the LCA methodology according to the ISO 14040 [32] and 14044 [33] requirements.

2.1.1. Function and Functional Unit

The overall function of the system is the recovery and purification of hydrogen from two waste streams, and the use of this product for electricity production. The functional unit (FU) should reflect this function allowing the comparison in the life-cycle inventory [34]. The FU is the measurement of the function of the systems analyzed that enables these to be totally comparable among them. Due to the fact that a separation process was included here, so hydrogen is an intermediate product for the final electricity generation, it is reasonable to perform a fair comparison to other previous published references, which entails the definition of three different output-based and process-based functional units to reach all the intended functions:
  • Function 1: Generation of one unit of mass of the hydrogen at the requested purity of 99.97%, imposed on feeding a PEM fuel cell for stationary applications (Type I, Grade D) [35]. Based on this function, 1 kg of hydrogen with a molar purity of 99.97% was selected as a functional unit. This FU enabled direct comparison versus conventional hydrogen production processes to evaluate the possible environmental benefits associated with the recovery of the compound from waste gases.
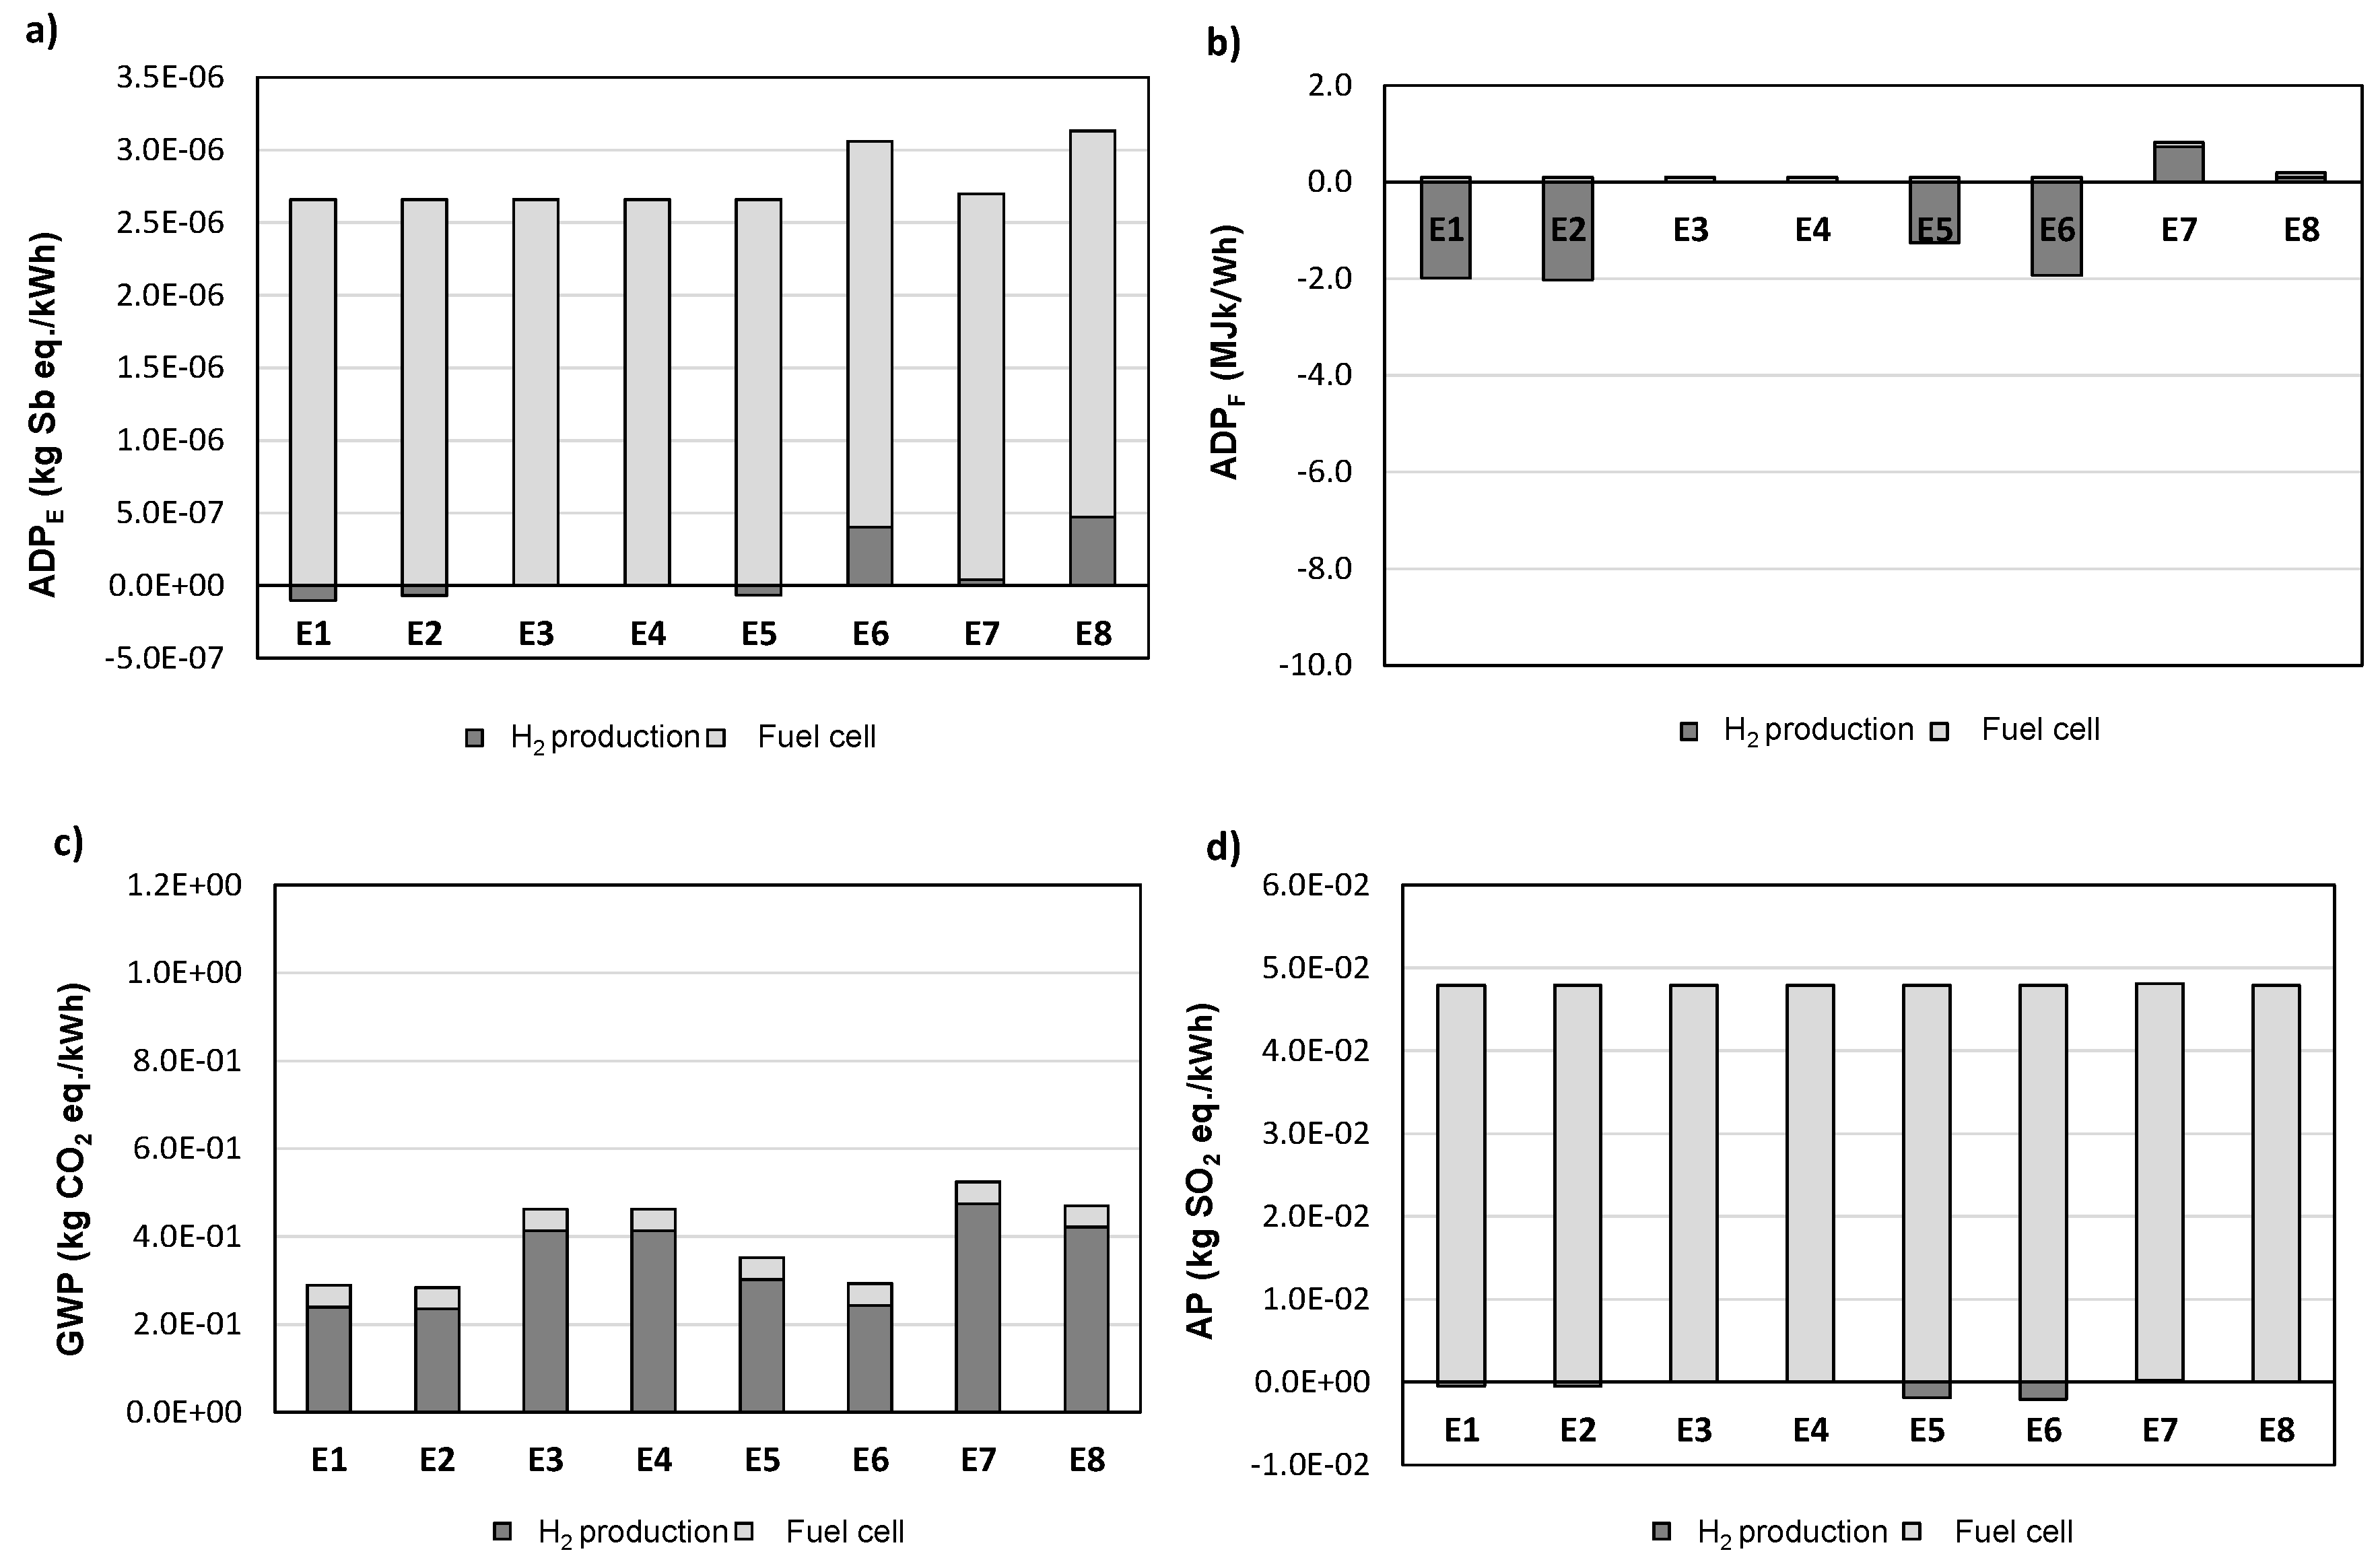
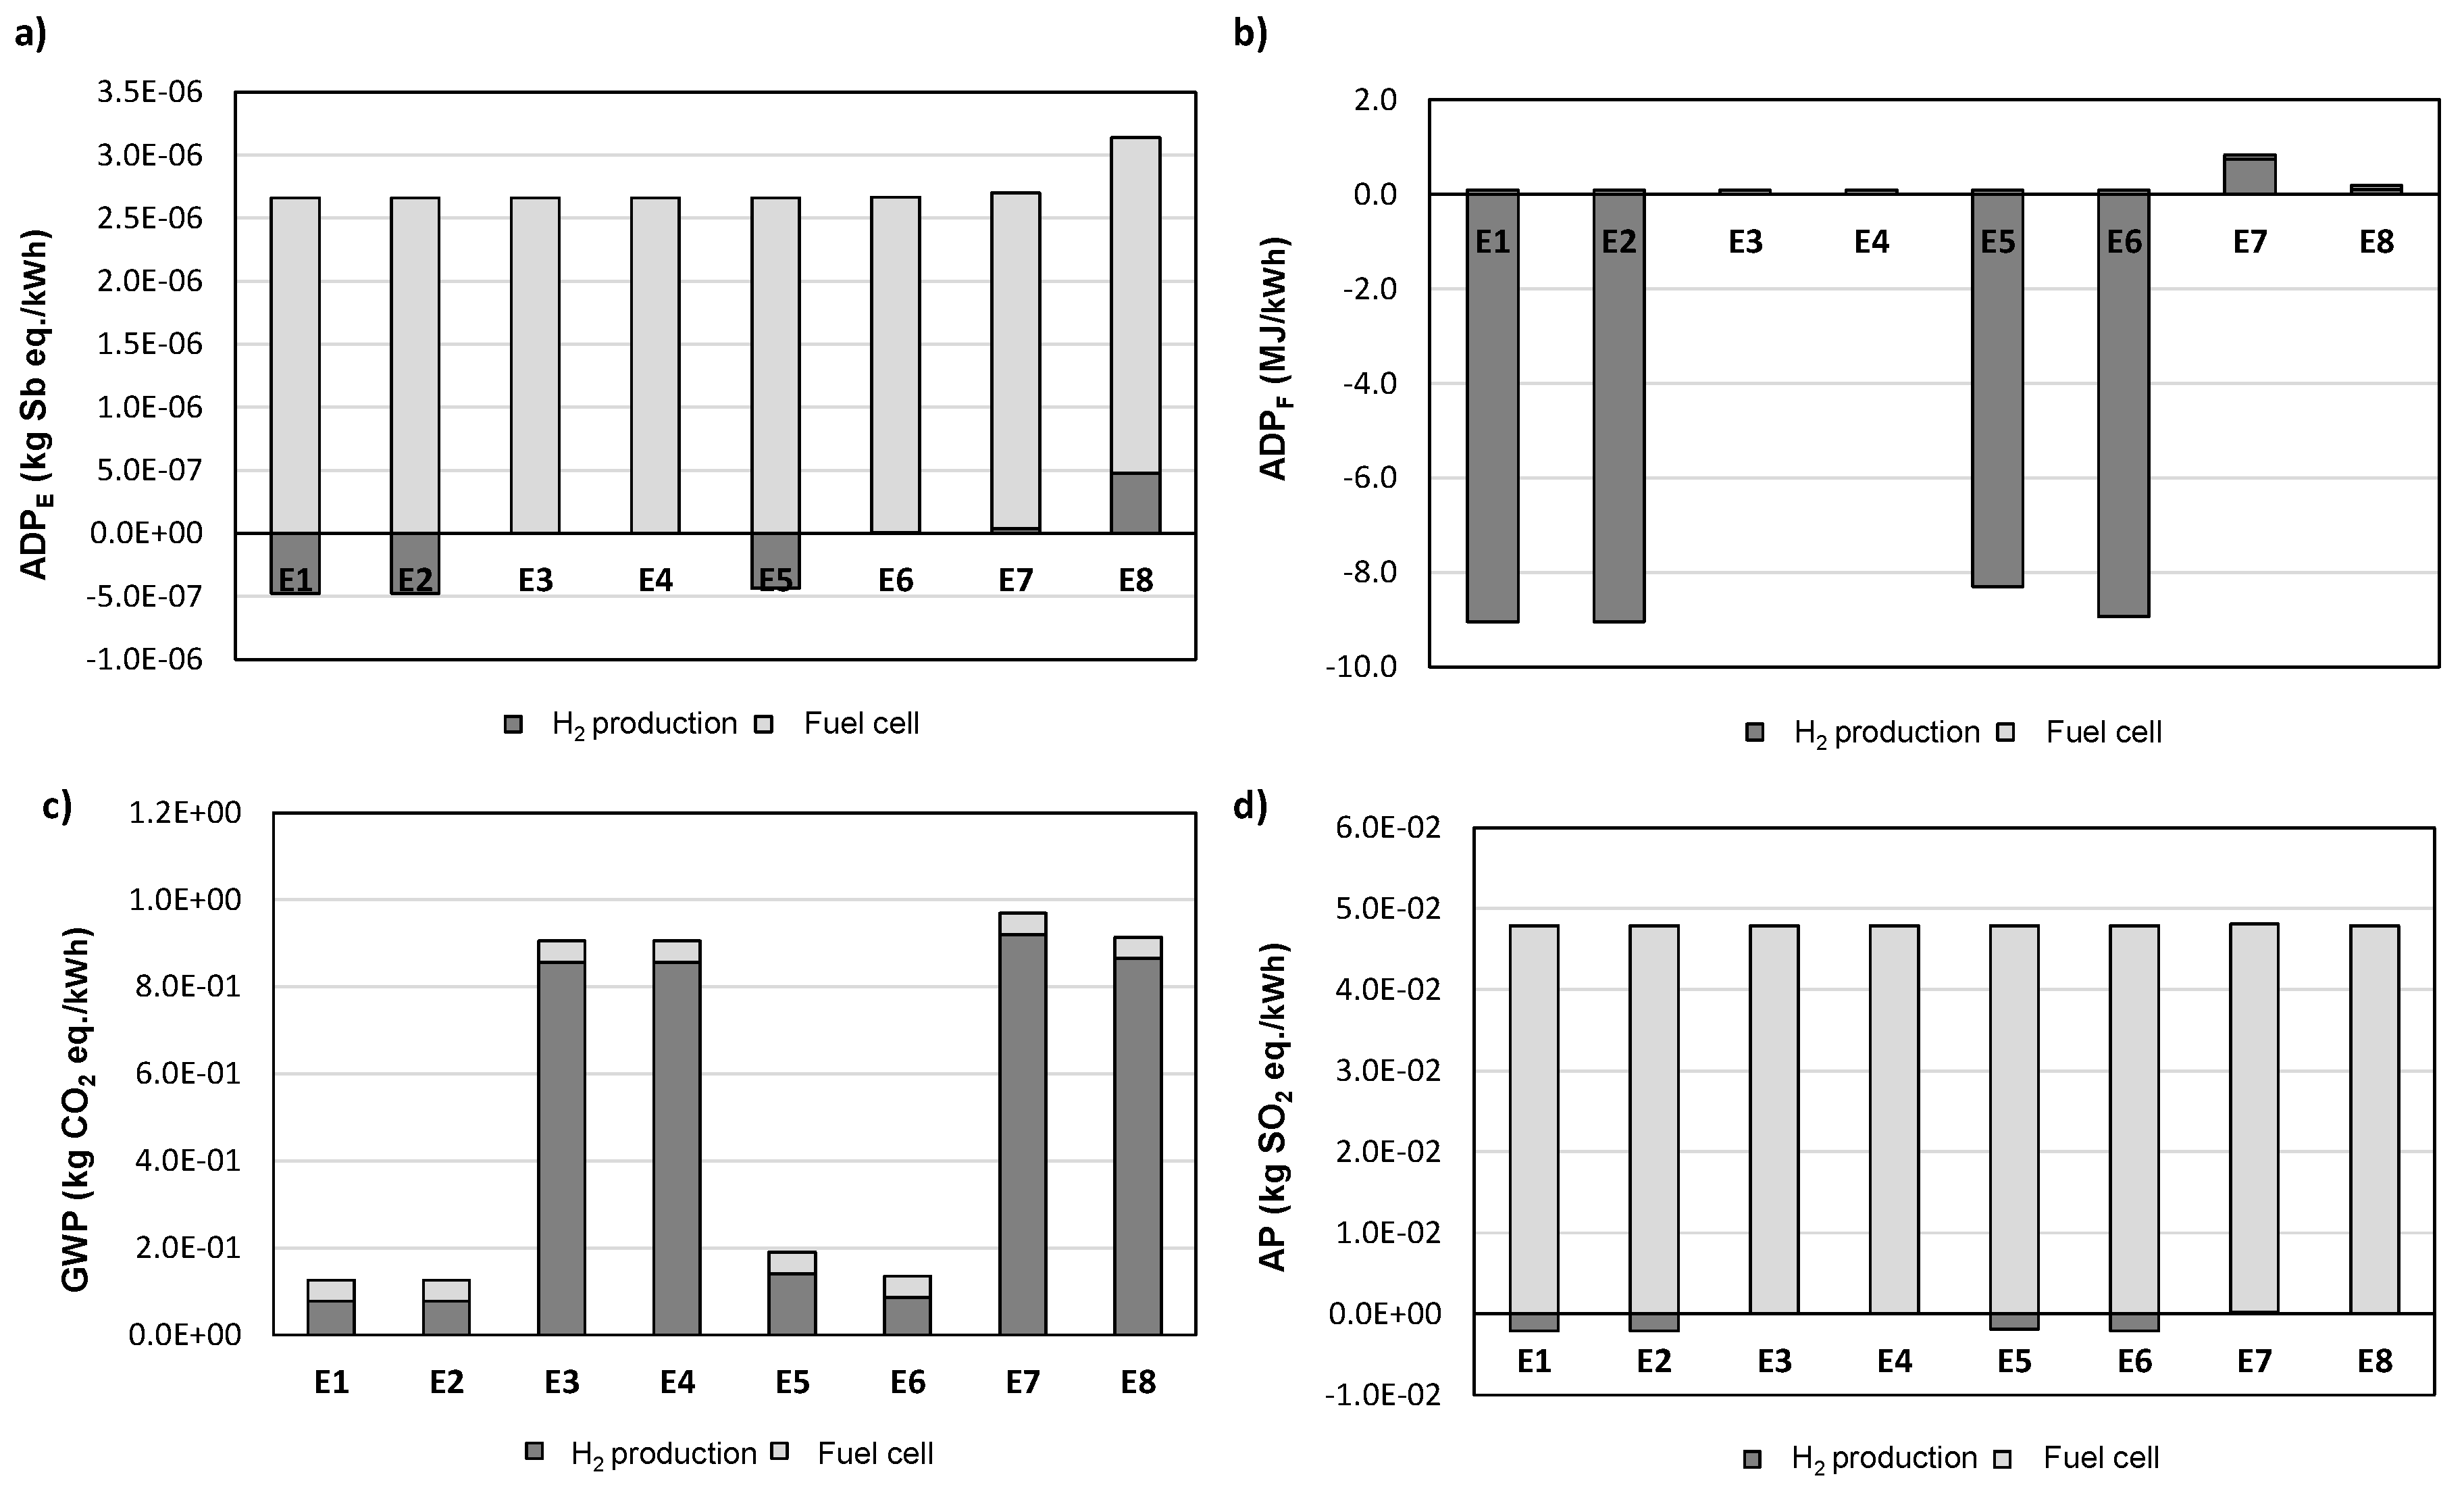
  • Function 2: Generation of one unit of electrical energy in the PEM fuel cell. To evaluate this function, the FU was 1 kWh of energy obtained from the fuel cell, which provided further information about the environmental burdens associated with the complete process and its viability as an energy source.
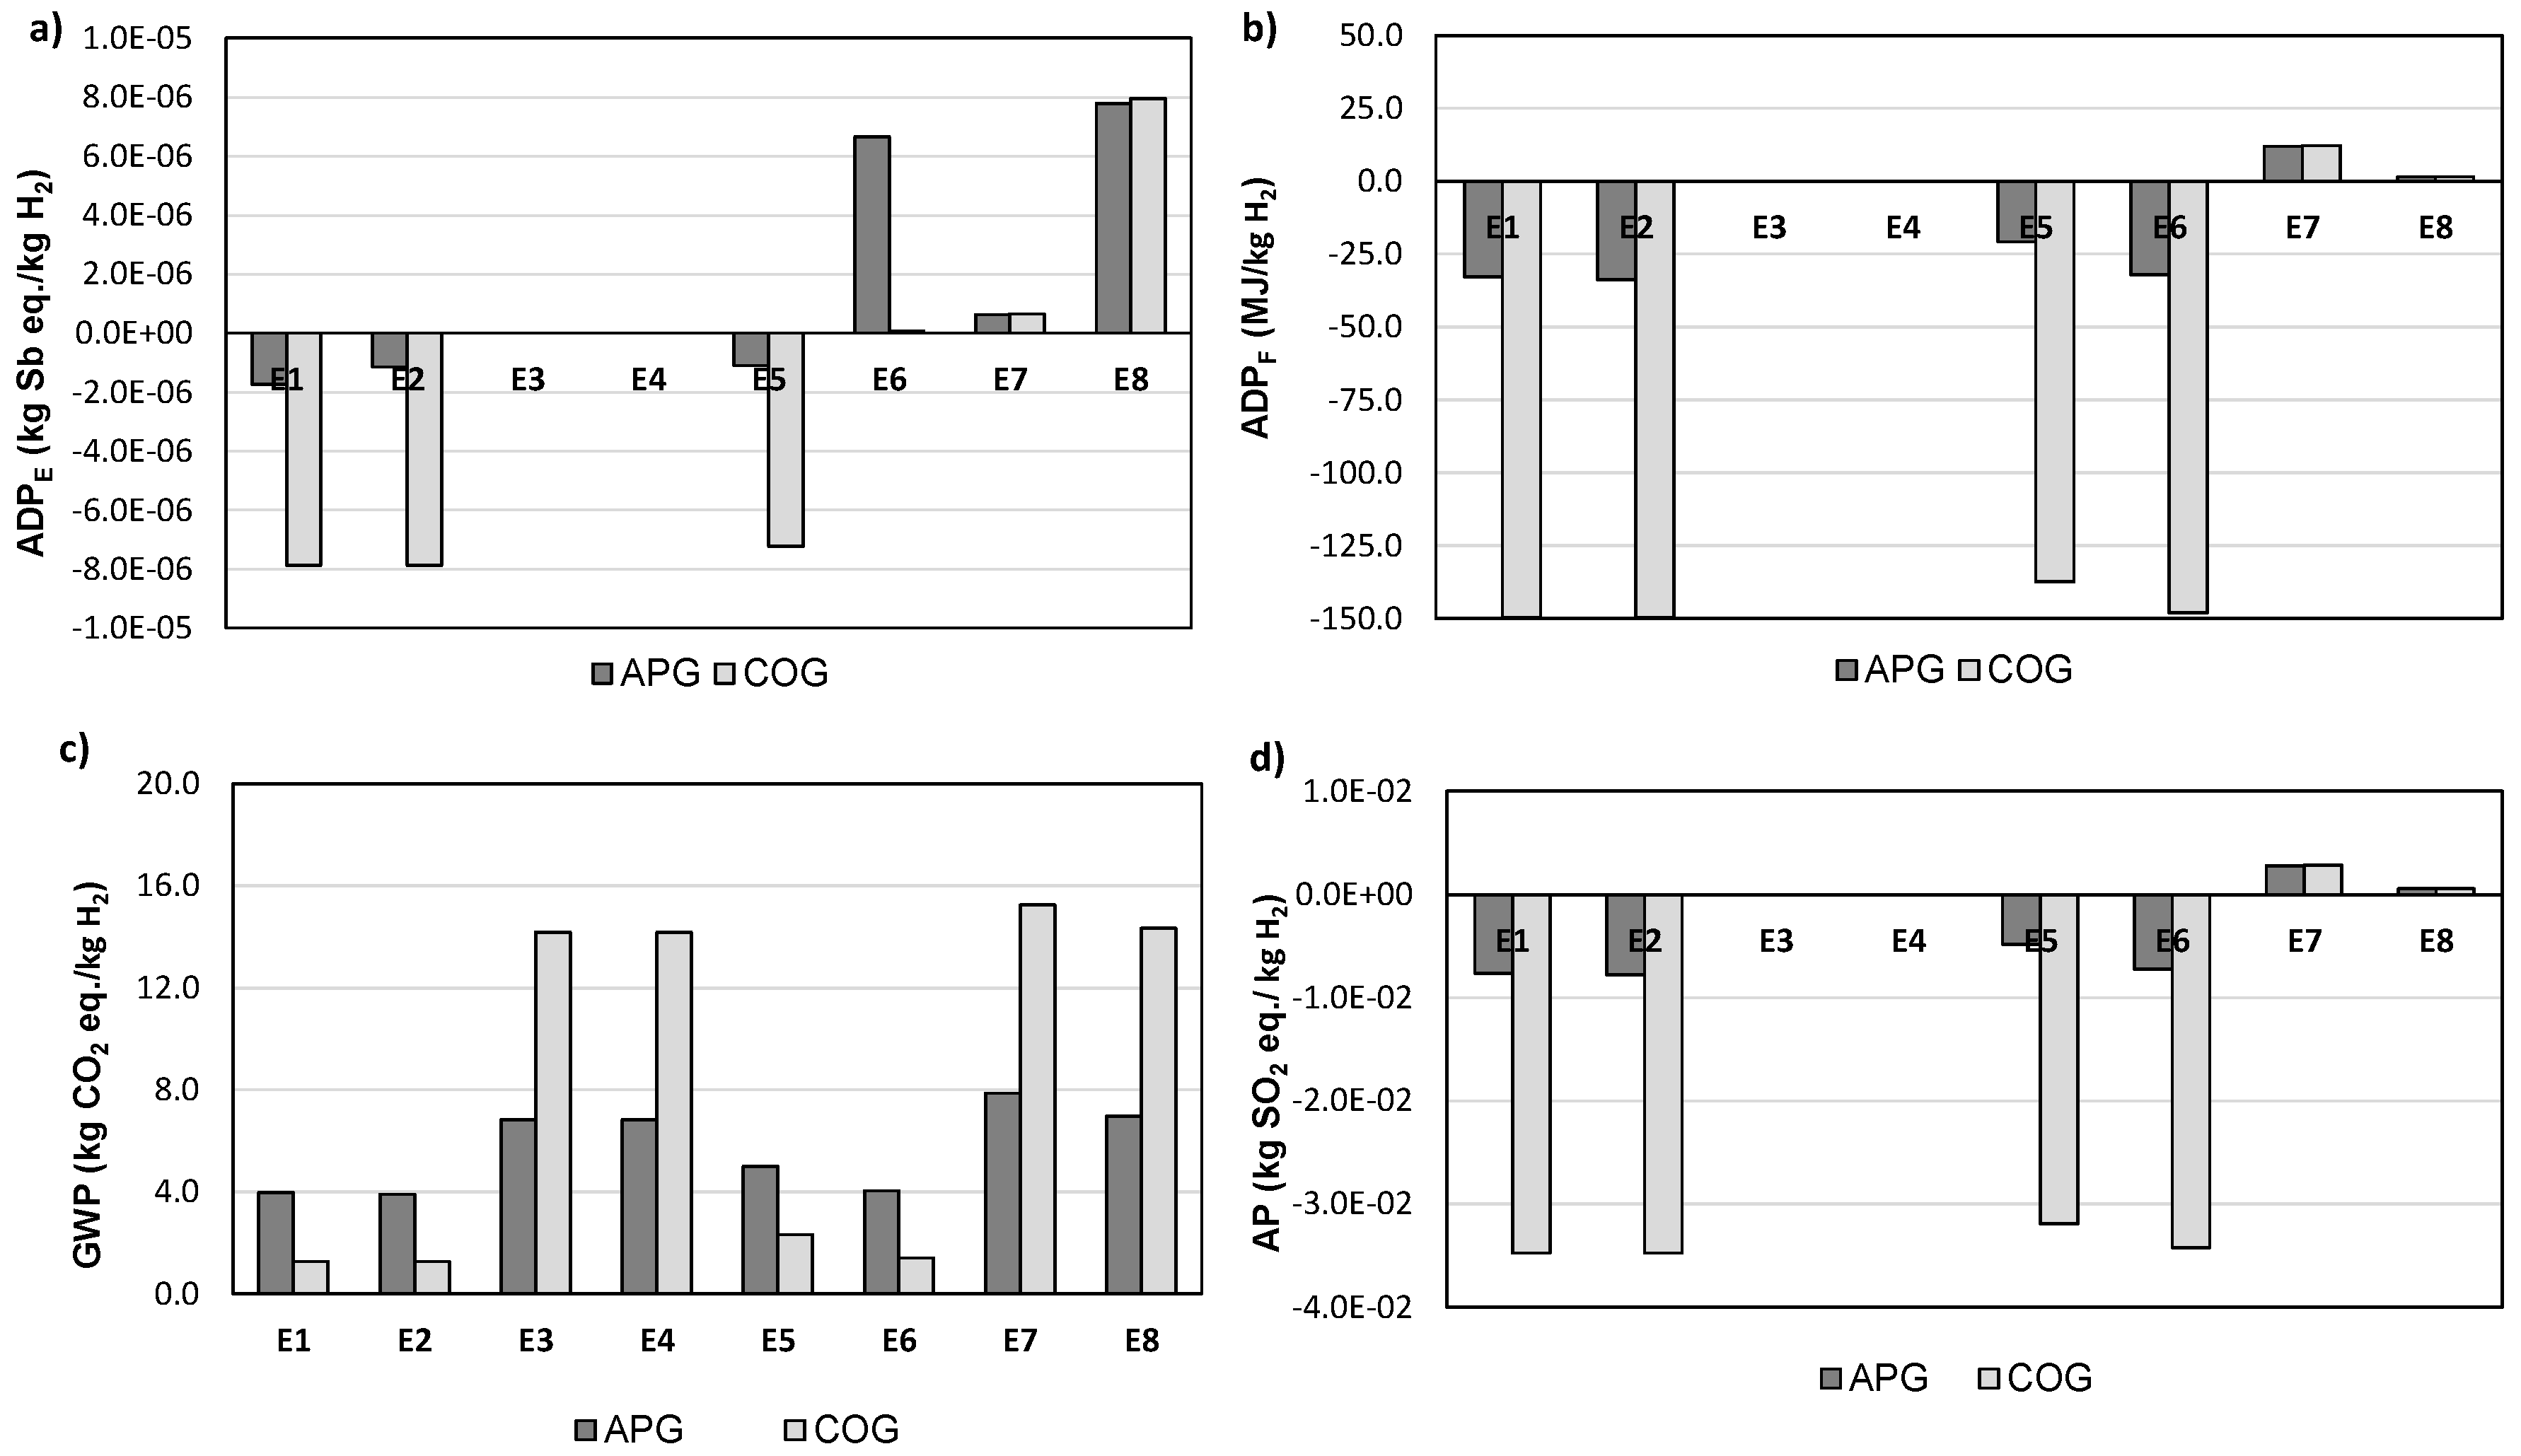
  • Function 3: Treatment of one mass unit of the residual gas stream. As a result, the FU chosen was 1 kg of COG or APG introduced to the system, which allowed the analysis of the influence of the type of residual gas stream selected on the entire process. This function and FU were considered to benchmark against no treatment for the leaving gas stream. Therefore, it can be guaranteed that the recovery and further electricity generation is better from a life-cycle perspective than the direct release to the atmosphere.
The most common functional units are grouped into fuel production in units of energy [36]; mobile application in units of covered distance [37], system production based on the power of the fuel cell [38], the type of vehicles [39], the type of fuel cell [40] or units of the area of the electrode [41]. However, it is possible to use two functional units at the same time and discuss the differences [42]. The selection of multiple functional units could be more accurate, providing better performance of the sustainability of the system, making the study more comparable with other LCAs. The use of several functional units was previously considered, in agricultural production systems [42], in food systems or waste management systems to provide a complete overview of the study. For instance, this procedure was considered when evaluating the management of several by-products [43], in fishmeal plants [44], or in the consumption of pilchard [45]. Moreover, other studies proposed the use of a dual FU for dairy products, combining both productivity and land use [46].

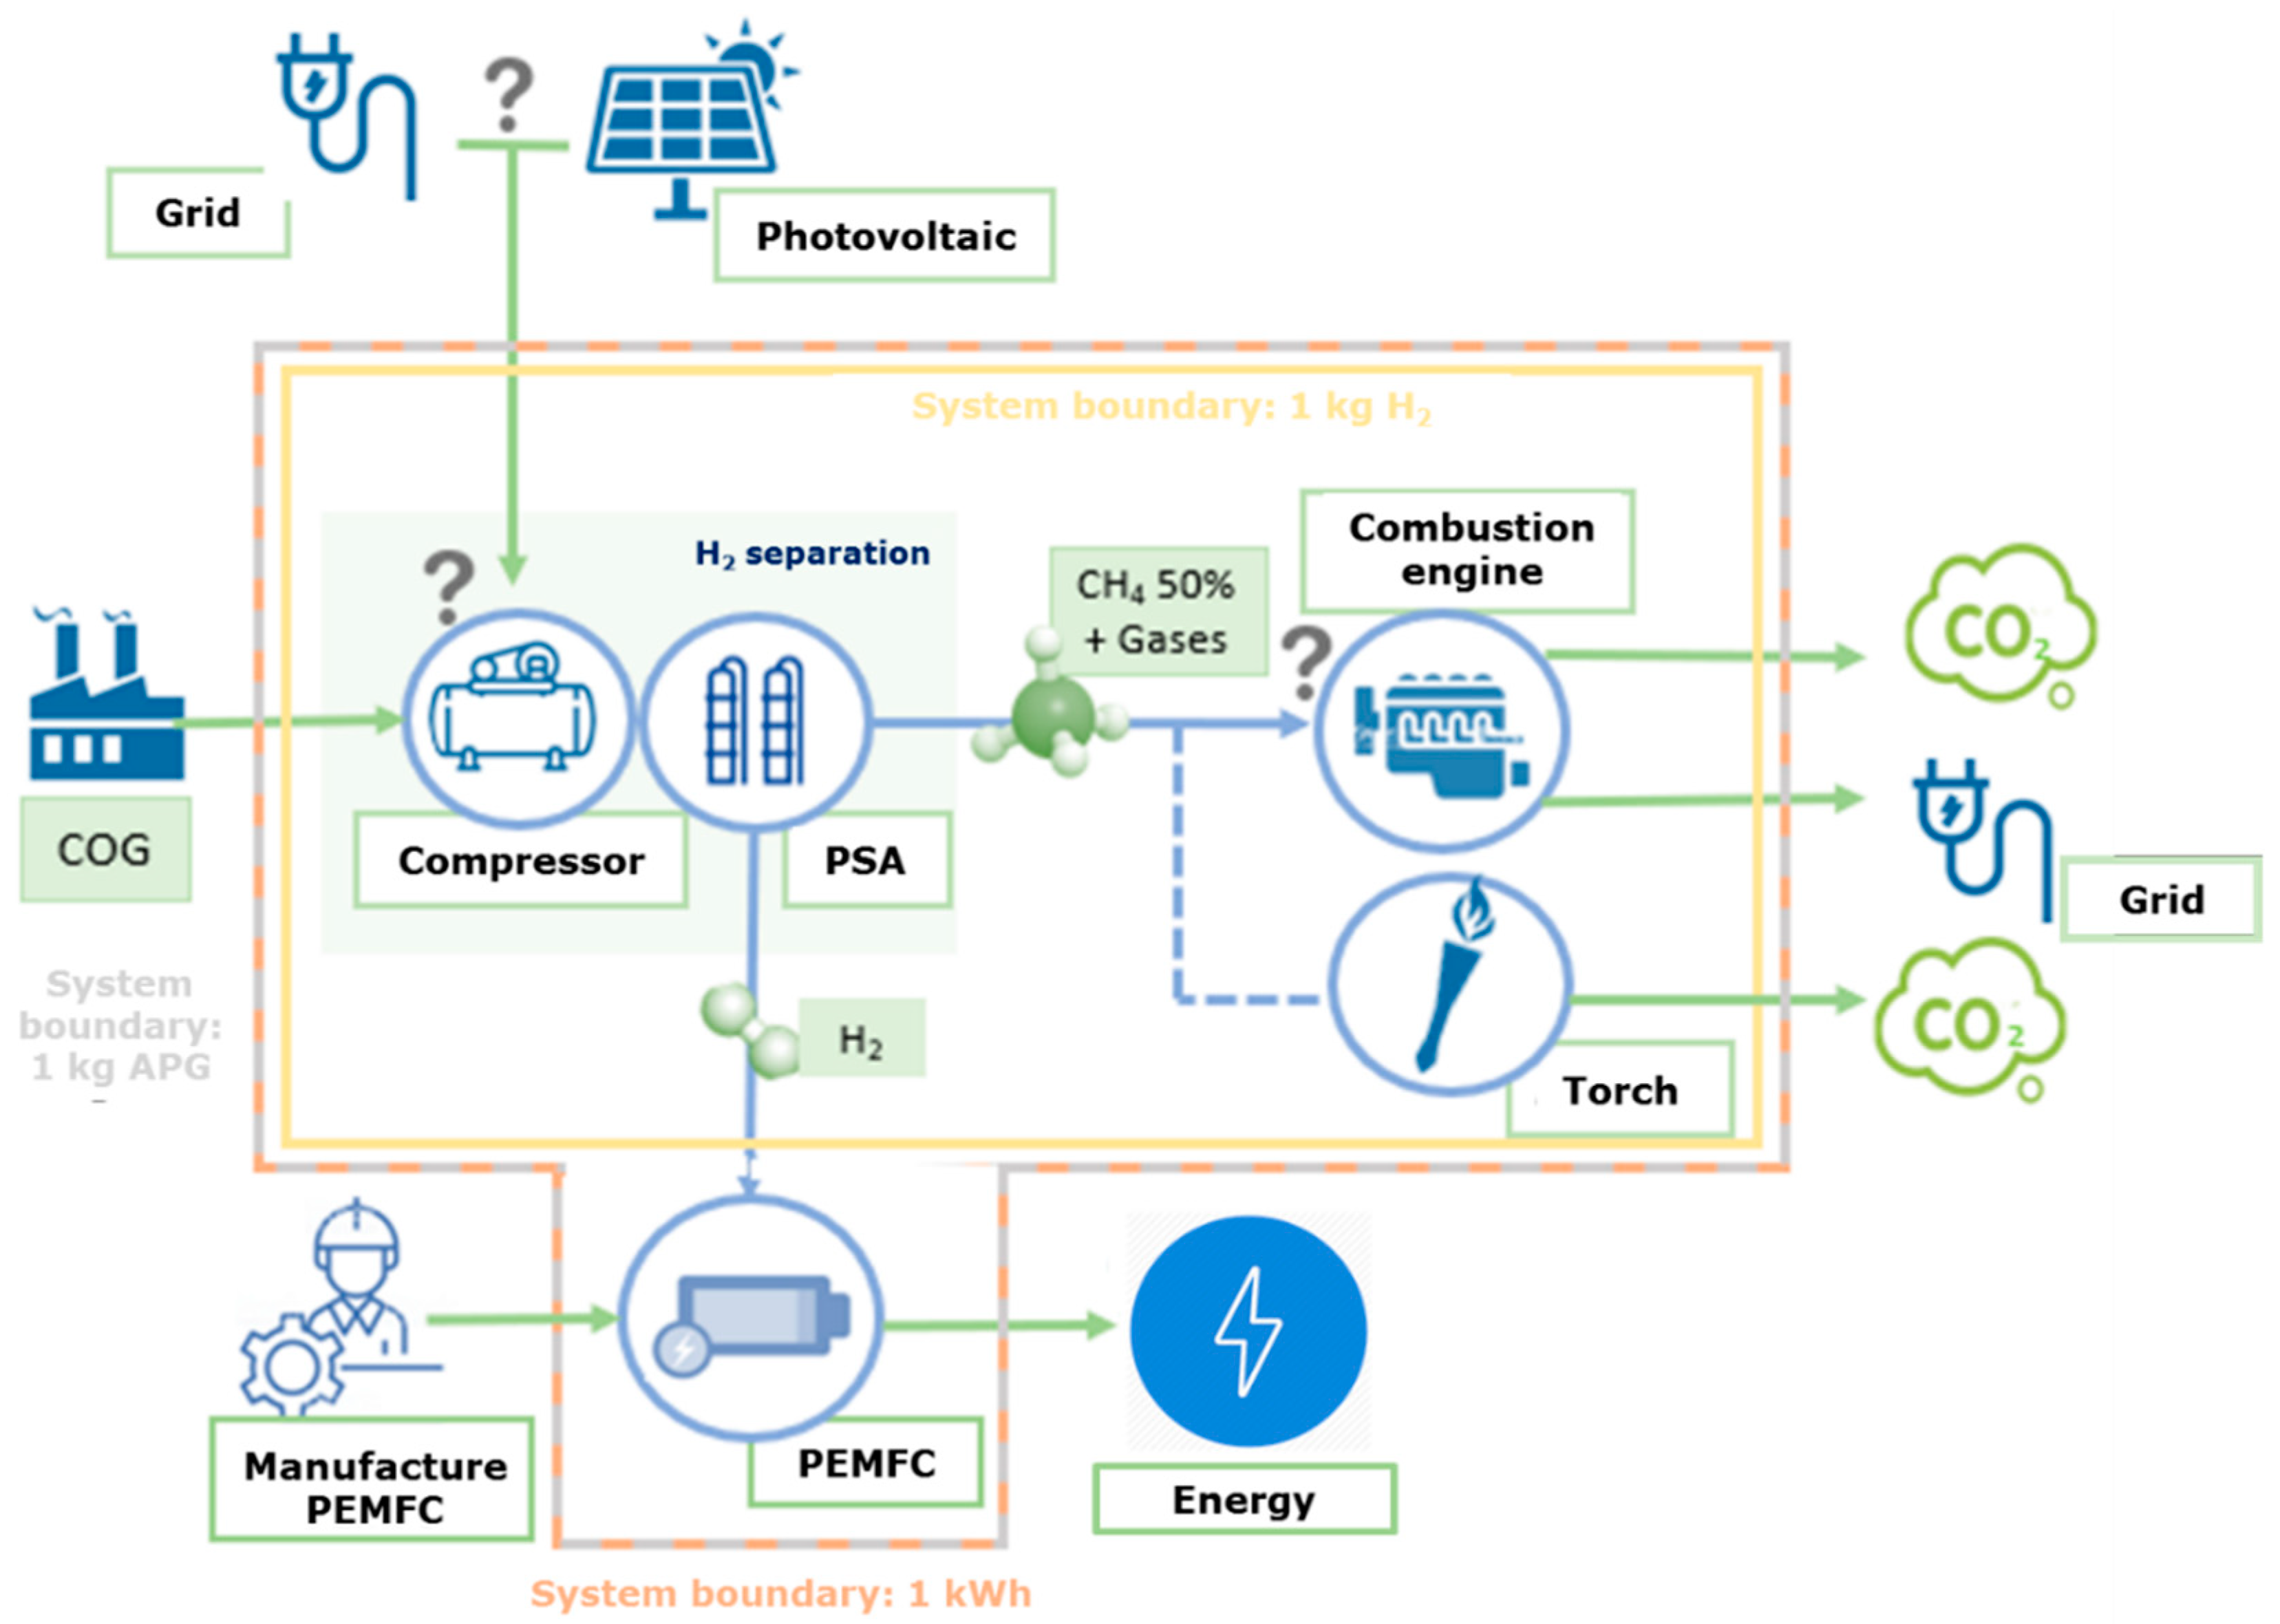
2.1.2. System Description and Boundaries

The limits of the systems are defined in Figure 1 and Figure 2, where the flow diagrams for the APG and COG processes are represented, respectively. Depending on the waste stream, different unit processes were considered. In general terms, the system boundaries include H2 separation and purification, methane separation (only for APG), a torch, a combustion engine, and the manufacture and use of the HT PEMFC. The initial stage, for both APG and COG streams, was the separation of hydrogen for its recovery, which required an adequate separation technique according to the feed concentration, required purity, and conditions of the flow of entry. The use of pressure swing adsorption (PSA) was considered the optimal option for this case. PSA can separate some gas species from a mixture of gases under pressure according to the molecular characteristics of the species and their affinity for an adsorbent material at near-ambient temperatures [47]. Two streams were obtained after implementation of PSA: On the one hand, one stream was rich in hydrogen (99.97% purity), which can be used to feed a PEM fuel cell for energy production; on the other hand, the remaining gas stream, with considerable methane content. Consequently, this second stream was targeted for energy recovery. In the case of COG, the resulting CH4 concentration was high enough to be able to be directly introduced into a biogas combustion engine to produce electricity (solid blue line). For the APG, since the molar concentration of methane does not reach 50%, another separation was required to obtain once again two streams: The first one achieved sufficiently concentrated CH4 levels to be introduced into the engine, while the other stream was burnt in a torch to decrease the harmful effects of these emissions (solid blue line). Nevertheless, in both cases, if methane recovery was not possible, the combustion of the gases in a torch (dashed blue lines) was proposed.

2.1.3. Assumptions, Hypotheses, and Limitations

Several assumptions have been proposed to define alternative scenarios that considered modifications of the main process configuration. The main inputs of the systems are the energy requirements, and thus, the main limitations and assumptions are related to this resource. These hypotheses are indicated in Figure 1 and Figure 2 by the symbol “?”.
The main energy demand for hydrogen comes from the hydrogen compressor. In this unit, when the inlet flow pressure was high enough, no additional energy was needed by the hydrogen compressor. If the pressure was too low, the energy was required for hydrogen compression. Energy requirements were calculated in Section S1 of the Supplementary Materials.
Regarding the electricity source, the use of renewable or non-renewable energy can be considered. In the case of using non-renewable energy, the electricity required for the separation processes could be obtained from the grid. In this type of analysis, the composition of the grid mix is essential, providing a source of uncertainty. The Spanish grid mix comprises 55% of non-renewable energy, 39.6% from nuclear, and 38.9% from combined cycle power plants. In renewable energy highlights the use of wind energy (17.8%), photovoltaic (17.8%), and hydropower (15.1%). To achieve the Paris Agreement targets of limiting global warming to well below 2 °C above pre-industrial levels and pursuing efforts to limit it to 1.5 °C [1], a more sustainable and low-carbon economy and energy must be contemplated. The use of renewable energy sources in the grid mix will help to achieve these goals. However, this change to a more sustainable grid mix will have a strong influence on our study. Concerning renewable sources, photovoltaic energy has been widely used as an alternative energy source at the laboratory, pilot plant, and industrial scale, providing excellent results, especially in Spain, due the climatological conditions. Therefore, this renewable source was proposed as a more sustainable scenario. Nevertheless, if we consider this study at the European level, other renewable energies could be studied, providing different results.
Finally, with regard to methane, the system could implement methane recovery after the hydrogen separation. This recovered methane was employed to produce energy. If methane recovery was not considered, then this gas stream was burnt in a torch. Therefore, the combination of the different alternatives resulted in eight different scenarios (Table 1) to be applied for each gas stream (APG or COG) that must be compared. The defined scenarios constitute a sensitivity analysis that contributed to determine the critical points of the process and propose more sustainable alternatives to feed PEM fuel cells, in particular, HT PEMFC.
There are several limitations that must be considered in this work. One of the main limitations is the assessment of the energy requirements for the PSA separation, which is based on the minimum thermodynamic energy consumption for the separation of a gas mixture [48]. As a result, the real energy consumption may fluctuate around the proposed levels. Another limitation is that the infrastructure for the separation and combustion is not accounted for, which is typical for machinery that can last periods over 20 years. Finally, it is important to note that this LCA is based on experimental data, since this technology is being developed. The scale-up of the process and the use of PEMFC at the industrial level could vary the obtained results.

2.1.4. Life-Cycle Impact Assessment Method

The life-cycle impact assessment (LCIA) included the mandatory phases according to ISO 14044: Impact category selection, classification, and characterization. The LCIA has been carried out by modeling the system with the GaBi 9.2 software [49], which allows transforming the values of the life-cycle inventory into values of the chosen environmental impact categories. GaBi software was selected because it is one of the leading software tools used for LCA, and it is a trusted product sustainability solution with over 10,000 users, including 500 companies, leading industry associations, and innovative SMEs [49].
To quantify these environmental burdens, the impact evaluation method CML2010 developed by Leiden has been selected [50], from which four categories were analyzed to have a global vision of the impact of the process: Global Warming Potential (GWP 100 years) expressed in kg CO2 equivalent, Acidification Potential (AP) expressed in kg SO2 equivalents and Abiotic Depletion Potential both for elements (ADPE) measured in kg Sb equivalent and fossil fuels (ADPF) measured in MJ. LCIA indicators were selected among those considered more relevant for this type of process, mainly related to material energy and material requirements.

2.2. Life-Cycle Inventory

According to ISO 14044 [33], the life-cycle inventory (LCI) involves the compilation and quantification of inputs and outputs of the system under study throughout its life-cycle. This work includes a detailed description of the hydrogen recovery process, the energy production in the HT PEM fuel cell, and the management of the residual gas stream obtained during the hydrogen separation. The corresponding data inventory was prepared to quantify the energy and material flow that enter and leave the systems. Resource consumption and emissions were considered in the analysis. Primary data were obtained from own calculations, material and energy balances, and experimental data. Secondary data were collected from the GaBi database [49] and Ecoinvent [51]. The LCI comprised the determination of flowrates and compositions of the APG and COG streams, the energy requirements and materials flow in the separation of hydrogen, and the inventory of the fuel cell. The LCI showed in Table 2 includes the material balances of the residual gas streams. The inventory data has been obtained by developing material and energy balances for each process unit, based on the flows and compositions of the input gas streams.
The separation of hydrogen from the gas streams was considered as a basis to assess the required energy demand and the corresponding mass flows. To determine these energy requirements, shown in Table 3, the minimum work required to achieve a 99.97% H2 flow was calculated, which is the purity necessary to operate the fuel cell according to the standard ISO 14687-2 [35]. The same operation is performed for the separation of 50% methane in the APG stream. The necessary calculations and equations are included in Section S1 in Supplementary Materials.
In the case of the outputs, various calculations must be performed to know the energy obtained from the combustion engine, which is shown in Section S2 in Supplementary Materials, and the energy obtained from the HT PEM fuel cell stack (experimental data provided by a collaborating institution were employed). The emissions generated from the processes were calculated by the stoichiometry of the combustion of the compounds. Nonetheless, depending on the scenario under consideration, the energy inputs and outputs of the system varied, so Table 3 presents a summary of the main flows for each alternative.
As expected, the fuel cell itself constituted a relevant input to the system. This device is made of different basic elements, which comprise the membrane electrode assembly (MEA). These MEAs comprise carbon (19.46 g), platinum (1.5 g), etc. Nevertheless, the end plates, the bipolar plate, and the collectors were excluded from this study. The detailed information about the compositions of the anode, the cathode, and the membrane is provided in Section S3 in Supplementary Materials, together with the operating conditions and main characteristics of the fuel cell.
To obtain the consumptions and emissions associated with each process, the environmental impact of the complete system was evaluated using the LCA software GaBi 9.2. The GaBi [49] and Ecoinvent databases [51] were used for the background system. Since several processes and products were not available, proxy processes were created mainly based on the stoichiometry of the reactions.

3. Results and Discussion

This section provides the main outcomes of the study based on the three different functions and functional units defined in the goal and scope stage. Therefore, the results will be referred to 1 kg of hydrogen (Section 3.1); 1 kWh generated (Section 3.2); and 1 kg of the corresponding gas stream (Section 3.3).

3.1. Life-Cycle Impact Assessment Based on Hydrogen Production

In this section, the FU under consideration was 1 kg of hydrogen with a molar purity of 99.97%. The results obtained in each scenario for each impact category are shown in Figure 3.
Regarding ADPE, the values obtained ranged from −1.73·10−6 to 7.8·10−6 kg Sb eq./kg H2 for the APG case and from −7.87·10−6 to 7.95·10−6 kg Sb eq./kg H2 for the COG case. All the emissions and avoided burdens associated with this category were due to the electricity demand and recovery in the process, resulting in zero in scenarios 3 and 4, since there was no methane energy recovery (no electricity production) and the stream was pressurized (no electricity demand). When electricity from the grid was used (scenarios 1, 5, and 7), the ADPE values were more favorable than the ones resulted from the use of renewable energy (scenarios 2, 6, and 8), because of the consumption of natural resources required to produce photovoltaic panels [52]. The results corresponding to the COG stream were more environmentally friendly than those of the APG stream in all the scenarios, except 7 and 8. This fact was a consequence of the higher energy spent in the COG case to separate the hydrogen without recovery of energy from methane, so the emissions cannot be compensated as in other cases (scenarios 1, 2, and 5). It was clear that in these three latter scenarios, the recovery stage of methane produced more energy than the required one by the rest of the system, so negative ADPE values were obtained associated with the energy credits. Consequently, the best conditions were found in scenario 1 (pressurized stream, energy recovery from methane, and electricity from the grid), while the worst conditions were associated with scenario 8 (non-pressurized stream, without energy recovery from methane and photovoltaic electricity). In relation to the ADPF, the values obtained were between −33.7 and 12.0 MJ for the APG case and −149.7 MJ/kg H2 and 12.2 MJ/kg H2 for the COG case. Like in the case of the ADPE category, these impacts were directly linked to the electricity. However, in this case, the use of photovoltaic electricity offered better results, and it was preferred to the use of electricity from the grid. Therefore, in this category, the best value corresponded to scenario 2 (pressurized stream, energy recovery, and photovoltaic electricity), while scenario 7 appeared as the worst option (non-pressurized current, without energy recovery and electricity from the grid).
The values of GWP laid between 3.90. and 7.88 kg CO2 eq./kg H2 for the APG case and 1.27 and 15.24 kg CO2 eq./kg H2 for the COG case. The impact in this category was associated with both the electricity used and the emissions from the torch and the combustion engine. The alternatives in which there was no energy recovery of methane (scenarios 3, 4, 7, and 8) resulted in values considerably higher due to the emissions derived from the burning of gases in the torch. The influence of the pressurization of the input stream can be analyzed comparing scenarios 1 (pressurized stream, with energy recovery and electricity from the grid) and 5 (non-pressurized stream, with energy recovery and electricity from the grid), which only differ on the pressurization stage. A slightly higher value was obtained in scenario 5, due to the emissions associated with the electrical consumption of the compressor. In all cases, the use of photovoltaic energy generated fewer greenhouse gas emissions than the grid. Comparing the APG and COG streams, it can be observed that for scenarios 1, 2, 5, and 6 the GWP values were lower for the COG case, while the opposite situation occurred in the rest of scenarios. This was because the emissions, due to the torch handicapped, were much more the COG stream than the APG one, since there was a lower content in CH4, CO, and CO2 in this latter stream. Once again, like in the case of the ADPF category, the best environmental conditions were associated with scenario 2 and the worst ones with scenario 7. Lastly, regarding AP, the values ranged from −7.82·10−3 to 2.79·10−3 kg SO2 eq./kg H2 for the APG case and from −3.48·10−2 kg SO2 eq. to 2.84·10−3 kg SO2 eq./kg H2 for the COG case. A similar trend to that observed for ADPF was identified, which can be justified because of the direct relationship between the emissions and avoided loads and the consumption and generation of electricity. Consequently, once again, scenario 2 resulted in the best option, while scenario 7 was the worst one.
To evaluate the potential environmental benefits derived from hydrogen recovery systems proposed in this work, it was necessary to compare these options with the values corresponding to other conventional hydrogen production systems. Bibliographic references that have applied LCA for different processes ways to obtain hydrogen and the assessed environmental impacts are compiled in Table 4 and Table 5 for the GWP and AP impacts, respectively.
As observed, the GWP values obtained in this study were generally lower than the results published for steam methane reforming, which are above 10 kg CO2 eq./kg H2 [53,54,55], so hydrogen recovery from waste gas streams appeared as a competitive alternative, even when the reforming of alternative chemicals like methanol or ethanol was considered [56]. In the cases where the process conditions were not favorable, such as scenarios 3, 4, 7, and 8 for the COG stream, the emissions calculated were slightly higher, so the design and operation of the gas recovery system must be studied in detail and optimized to assure the competitiveness of the process versus alternative options. In the same way, coal gasification resulted in GWP values similar to the ones obtained by steam methane reforming, so the proposed recovery systems can compete with this process too [53,56]. However, regarding electrolysis, the source of electricity clearly defined the competitiveness of the process. When renewable wind or photovoltaic energy was employed, the impact was lower than in the case of the hydrogen recovery process, since electrolysis under these conditions must be considered a clean and environmentally friendly process [53,57]. Instead, they use of electricity from the grid resulted in a considerably higher GWP impact and must be avoided when compared to gas recovery. Therefore, the recovery of hydrogen from waste gas stream must be considered among the most environmentally friendly options, appearing competitive versus complex processes like supercritical water gasification, chemical looping, advanced methane cracking, or tri-reforming [25,58,59]. When the AP was investigated, which was the second most studied category just after GWP by the LCA studies, the impact of the proposed recovery process was below 3.0 g SO2 eq. in the worst scenario, with negative values (avoided burdens) for most scenarios even without optimization. Therefore, from the perspective of this impact category, the recovery of the hydrogen from waste gas streams resulted in a completely preferable option when compared to alternative production processes, most of them with AP values above 10 g SO2 eq. [60,61].
Table 4. Greenhouse gases (GHG) impacts related to different technologies that produce hydrogen.
Production ProcessGWP (kg CO2 eq./kg H2)Reference
Natural gas thermolysis37.11[62]
Steam methane reforming11.89[53]
Coal gasification11.29[53]
Electrolysis (wind energy)0.97[53]
Electrolysis (photovoltaic energy)2.41[5]
Steam methane reforming10.56[54]
Methane partial oxidation10.70[60]
Electrolysis (grid electricity)30.50[63]
Supercritical water reforming of glycerol3.77[64]
Electrolysis (wind energy)0.68[57]
Autothermal bioethanol reforming4.36[61]
Methane cracking (liquid-metal technology)1.90[59]
Steam methane reforming11.50[55]
Autothermal natural gas reforming10.80[55]
Syngas chemical looping12.30[55]
Chemical looping reforming9.10[55]
Chemical looping combustion thermally coupled steam reforming3.01[25]
Supercritical water gasification (photovoltaic energy)2.41[58]
Electrolysis (USA mix electricity)28.60[56]
Coal gasification23.70[56]
Biomass gasification4.40[56]
Ethanol reforming12.20[56]
Methanol reforming17.90[56]
Methane reforming13.80[56]
Biomass gasification with methane tri-reforming1.35[65]
Table 5. AP impact, related to different technologies that produce hydrogen.
Production ProcessAP (kg SO2 eq./kg H2)Reference
Steam methane reforming0.008[54]
Electrolysis (photovoltaic electricity)0.028[63]
Electrolysis (wind electricity)0.003[63]
Biomass gasification0.034[63]
Methane partial oxidation0.008[60]
Supercritical water reforming of glycerol0.012[62]
Autothermal bioethanol reforming0.028[61]
Supercritical water gasification (photovoltaic energy)0.190[58]
Electrolysis (USA mix electricity)0.069[56]
Coal gasification0.011[56]
Biomass gasification0.016[56]
Ethanol reforming0.032[56]
Methanol reforming0.017[56]
Methane reforming0.012[56]

3.2. Life-Cycle Impact Assessment Based on Energy Production

In this section, the functional unit considered was 1 kWh generated by the HT PEM fuel cell. Therefore, in this system, in addition to taking into account the production of hydrogen, the manufacture and use of the fuel cell were included too. The environmental impacts assessed for the APG and COG cases are shown in Figure 4 and Figure 5, respectively.
In the ADPE impact category, the values were between 2.56·10−6 and 3.13·10−6 kg Sb eq./kWh for the APG case and between 2.19·10−6 and 3.14·10−6 kg Sb eq. /kWh for the COG case. Most of the impact was attributable to the fuel cell, since the production of this device required scarce elements like platinum. Although in scenarios 6, 7, and 8 positive values (environmental impacts) of the hydrogen recovery stage occurred, the contributions were more significant in scenarios 6 and 8, which worked with streams not pressurized that required the use of photovoltaic electricity. The rest of the scenarios exhibited negative values (avoided burdens) for the hydrogen recovery stage, but the impacts, due to the cell could not be compensated, since these latter were at least an order of magnitude higher in absolute terms. Regarding ADPF, the values ranged from −1.95 to 0.81 MJ/kWh for the APG system and from −8.94 to 0.82 MJ/kWh for the COG system. The negative values for the hydrogen recovery stage obtained in scenarios 1, 2, 5, and 6 as a consequence of the energy recovery from methane must be highlighted, since they clearly compensated the loads, due to the fuel cell operation. Since the recovery stage generated more energy than the requirement of the full system, the resulting negative values implied clear, environmentally friendly conditions in these scenarios. In scenarios 3 and 4, the impacts were completely caused by the cell, due to the absence of electricity consumption, while in scenarios 7 and 8, there were impacts, due to the recovery of hydrogen since energy recovery from methane was not implemented.
The GWP values fell in the interval between 0.28 and 0.52 kg CO2 eq./kWh for the APG system and between 0.12 kg and 0.96 kg CO2 eq./kWh for the COG case. These results were in the range of values that characterize the carbon footprint of natural gas-fired power generation [66,67]. The contribution of the hydrogen recovery stage in this category is much greater than that of the cell, being between 82% and 90% for the APG case and from 61% to 95% for the COG system. In the scenarios without methane recovery (scenarios 3, 4, 7, and 8), the impact was significantly higher, and therefore, the contribution of the hydrogen recovery stage is greater, due to the emissions produced in the burning of gases in the torch. When the different streams were compared, the APG system was more suitable when there was no energy recovery with a percentage of 5% lower, while when the combustion engine is available, the COG system was better, with an improvement of around 20%. Regarding the AP category, practically 100% of the impact was directly attributed to the cell, since the device contained elements that must be produced by means of manufacturing processes that can release acidifying chemicals to the environment.
From the analysis that took into consideration both the hydrogen production stage and the manufacture and operation of the fuel cell, the same conclusions that the case that investigated only the hydrogen production stage were reached. On the one hand, the ADPE category considered that the best conditions were found in scenario 1, and the worst ones in scenario 8. On the other hand, for the rest of the categories, scenario 2 was the most environmentally friendly option, and scenario 7 the least preferable one.
Due to the great impact that the fuel cell had in some impact categories, mainly ADPE and AP, the burdens associated with the manufacture of the cell were investigated in detail (Figure 6). As observed, in three of the four categories studied (ADPF is the exception, since in this case, the membrane is the most important contributor), the main impact was caused mainly by the production of the anode and the cathode, with joint contribution percentages close to 100% in ADPE and AP and more than 80% in GWP. These impacts were associated with the employment of platinum in the formulation of these components. In the ADPF, the membrane appeared with a huge contribution, due to the electricity used for its preparation. To have a better understanding of the relevance of the employment of platinum in the fabrication of the anode and the cathode, a sensitivity analysis was carried out. To analyze the sensitivity of the platinum loading, a hypothetical fuel cell without the noble metal was considered to analyze the variation in the environmental impacts. The results revealed that significant reductions were possible, since impact reductions close to 100% were achieved in ADPE and AP categories, while a 84% reduction in the GWP value was possible. However, for the ADPF category, the obtained results were similar to the ones corresponding to a cell with platinum anode and cathode.
For a stationary FC system, a GWP value of 0.69 kg CO2 eq/kWh was reported [68]. This value was slightly higher than the one reported in this study considering the APG case, whilst it was in the range of values obtained for the COG case. In scenarios without membrane recovery (scenarios 3, 4, 7, and 8 for COG), higher values in the GWP category are reached in this study. However, the system proposed is generally a competitive alternative; being able to present a larger amount of benefits once the design and operation optimization is carried out. Values of 0.81 and 1.00 kg CO2 eq/kWh have been reported for mobile applications [69,70]. These impacts have also been considered as an approximation to confirm the reliability of the impacts in relation to its magnitude, since the values are quite similar or even larger than those published in this study. On the other hand, the great contribution of the Pt production, which dominates the ADP elements and AP impacts, has been reported by several authors [31,69]. This identifies the process as a hot spot of the manufacturing phase, and evidence the necessity of variating the Pt load or developing advance catalyst formulations that provide equivalent electrochemical performance of the system.

3.3. Life-Cycle Impact Assessment Based on Waste Gas Stream Management

In this section, the functional unit considered was 1 kg of the corresponding gas stream, and only the scenarios with best and worst results in most impact categories (scenarios 2 and 7, respectively) were directly compared. The results of both scenarios for each impact category are shown in Figure 7.
Regarding the ADPE category, the impacts in scenario 2 are not too far from those obtained in scenario 7, with different values of 1.92·10−7 and 9.69·10−7 kg Sb eq./kg gas stream for the APG and COG streams, respectively. These differences are only due to the hydrogen separation and methane recovery stage, since equal values within each impact category corresponded to both scenarios for the manufacture and use of the pile stages. The impacts in this category were linked to the electricity required for pressurization and the presence of the combustion engine. According to the results, the additional materials required for the engine in scenario 2 were compensated by the avoided electricity consumption in the hydrogen purification stage, and the global result lead to a more environmentally friendly than the contrary situation implied in scenario 7. The analysis of both streams demonstrated that the COG situation was more suitable for scenario 2, while the APG stream was more convenient when scenario 7 was proposed. In relation to ADPF, all the values resulted negative, so fossil fuel consumption was avoided thanks to the energy production in the fuel cell, and in the case of scenario 2, the recovery of energy from the engine. In fact, this scenario 2 more than doubled the emissions avoided in scenario 7, and the results were even better for the COG stream, characterized by higher methane content.
The methane content of both streams was also a determining factor in the analysis of the GWP category. In scenario 2, with methane recovery, the emissions avoided in the COG system were clearly higher than the values corresponding to the APG stream. However, in scenario 7, when methane recovery was not considered, the emissions, due to the higher methane of the COG stream content favored the preference of the APG system. Nevertheless, both systems implied net emissions as both GWP values were positive in scenario 7. In the baseline scenario that considered the null option, which means that the gas streams were flared without further energy recovery, only GWP impacts resulted, these being 0.74 and 1.62 kg CO2 eq. for the APG and COG streams, respectively. Therefore, it can be concluded that the recovery process proposed clearly constituted an improvement, reducing these values significantly in both cases. Finally, the AP category did not exhibit important differences among all the results. Scenario 2 implied lower emissions, and the APG stream appeared slightly more environmentally friendly than the COG system.

4. Conclusions

Nowadays, the emissions from stationary sources are based on the use of fossil fuels. However, in the short-to-medium-term, the use of more sustainable resources will open the niche to new fuels, such as hydrogen. The study of the environmental advantages and disadvantages of the obtention and use of this product is essential to determine the best configuration. In this work, the environmental assessment of the recovery of hydrogen from waste streams to use to feed HT PEM fuel cells was carried out, applying the LCA methodology according to ISO 14040 and 14044. The stages of the complete system have been individually studied to analyze the environmental impact of each one and study the viability and competitiveness of the process.
This LCA defined several functions: The generation of hydrogen and electrical energy and the treatment of residual gas streams (COG or APG). Based on these functions, we define several functional units to provide a more accurate and comparable study. Thus, the results were referred to as 1 kg of hydrogen at the requested purity of 99.97%, 1 kWh of energy obtained from the fuel cell, and 1 kg of COG or APG.
The hydrogen recovery from waste streams resulted in environmental impacts between −7.87·10−6 and 7.95·10−6 kg Sb eq./kg H2 for the ADPE category, from −149.7 to 12.2 MJ/kg H2 for ADPF, from 1.27 to 15.24 kg CO2 eq./kg H2 for GWP, and from −3.48·10−2 to 2.84·10−3 kg SO2 eq./kg H2 for AP. These impacts, specifically the GWP values, resulted lower than the impacts, due to steam reforming of methane, coal gasification, or more complex hydrogen production alternatives like supercritical water gasification, chemical looping, advanced methane cracking, or tri-reforming. Only electrolysis of water by means of renewable energies, such as wind or solar, showed values that could improve the environmental impact of the proposed recovery process, since electrolysis by grid electricity based on fossil fuels appeared disadvantageous from an environmental perspective.
For the production of 1 kWh, the complete system that comprised both the hydrogen production stage and the manufacture and use of the PEM cell showed low values in the ADPE, ADPF, and AP categories. In the case of GWP, values between 0.28 and 0.52 kg CO2 eq./kWh and 0.12 to 0.96 kg CO2 eq./kWh were calculated for the APG and COG streams, respectively. These impacts were comparable to the range of values of the carbon footprint of energy generation by means of natural gas. Furthermore, it was demonstrated that in the GWP and ADPF categories, the greatest impacts were caused by the recovery stage, while in the other two categories, the cell implied higher burdens. These latter burdens were mainly caused by the platinum used in its composition, so an alternative process in which this component could be reduced to a lower level could decrease GWP impacts by up to 84%. Regarding the stream used, it can be concluded that depending on the impact category studied, the advantages of using one type or another of flow varied. To clearly identify the most convenient option, a more exhaustive study should be carried out, taking into account a greater number of impact categories, so that it can be observed in detail which option can provide more environmental benefits.
The analysis of the alternative scenarios found that having a pressurized waste stream meant considerable energy savings, since no compressor was required, which translated into lower environmental impacts in all the categories studied. The recovery of methane supposed a relevant improvement in the complete process—since, on the one hand, it avoided to burn the residual gas flow in a torch producing harmful emissions, while, on the other hand, it allowed the recovery of additional energy. Lastly, the selection of photovoltaic electricity instead of the grid resulted in more suitable for the ADPF, GWP, and AP categories, while in the ADPE, the photovoltaic energy exhibited slightly worse values.
To conclude, this paper provides a complete overview of the environmental benefits and impacts of the obtention and use of hydrogen, determining the energy requirements and savings from cradle to gate. The use of LCA determines the best scenario in terms of hydrogen production, energy production, and residual gas stream, helping the decision-making process and laying the foundations for further studies.

Supplementary Materials

The following are available online at https://www.mdpi.com/2076-3417/10/21/7461/s1, Figure S1: Relation between input and output energies in the combustion engine, Table S3a Composition of the anode and cathode, Table S3b. Electricity requirements for membrane production, Table S3c. Other characteristics of the fuel cell.

Author Contributions

Conceptualization, M.M., and R.A. (Rubén Aldaco); investigation, A.F.-R., M.M., A.D.-R., N.D., D.J., and M.Y.; methodology, M.M. and A.D.-R.; writing—original draft preparation, R.A. (Ricardo Abejón); writing—review and editing, M.M., A.D.-R., A.O., D.G., I.O., J.L., I.R.-S., D.J., A.I., and R.A. (Rubén Aldaco); funding acquisition, A.O., and R.A. (Rubén Aldaco); project administration, A.O. All authors have read and agreed to the published version of the manuscript.

Funding

The authors are grateful for the funding of the Spanish Ministry of Economy and Competitiveness through the Ceres-Procom Project CTM2016-76176 (AEI/FEDER, UE) and the funding of European Union through the Project SOE1/P1/E0293 (INTERREG SUDOE/FEDER, UE), “Energy Sustainability at the Sudoe Region: Red PEMFC-Sudoe”.

Conflicts of Interest

The authors declare no conflict of interest.

References

  1. Zalakeviciute, R.; Bastidas, M.; Buenaño, A.; Rybarczyk, Y. A Traffic-based method to predict and map urban air quality. Appl. Sci. 2020, 10, 2035. [Google Scholar] [CrossRef] [Green Version]
  2. Chen, C.; Zeng, X.; Huang, G.; Yu, L.; Li, Y. Robust planning of energy and environment systems through introducing traffic sector with cost minimization and emissions abatement under multiple uncertainties. Appl. Sci. 2019, 9, 928. [Google Scholar] [CrossRef] [Green Version]
  3. Sanchez, K.A.; Foster, M.; Nieuwenhuijsen, M.J.; May, A.D.; Ramani, T.; Zietsman, J.; Khreis, H. Urban policy interventions to reduce traffic emissions and traffic-related air pollution: Protocol for a systematic evidence map. Environ. Int. 2020, 142. [Google Scholar] [CrossRef]
  4. Mamaghani, A.H.; Najafi, B.; Casalegno, A.; Rinaldi, F. Optimization of an HT-PEM fuel cell based residential micro combined heat and power system: A multi-objective approach. J. Clean. Prod. 2018, 180, 126–138. [Google Scholar] [CrossRef]
  5. Nomnqa, M.; Ikhu-Omoregbe, D.; Rabiu, A. Performance evaluation of a HT-PEM fuel cell micro-cogeneration system for domestic application. Energy Syst. 2019, 10, 185–210. [Google Scholar] [CrossRef]
  6. Testa, E.; Giammusso, C.; Bruno, M.; Maggiore, P. Analysis of environmental benefits resulting from use of hydrogen technology in handling operations at airports. Clean Technol. Environ. Policy 2014, 16, 875–890. [Google Scholar] [CrossRef]
  7. Saufi Sulaiman, M.; Singh, B.; Mohamed, W.A.N.W. Experimental and theoretical study of thermoelectric generator waste heat recovery model for an ultra-low temperature PEM fuel cell powered vehicle. Energy 2019, 179, 628–646. [Google Scholar] [CrossRef]
  8. Díaz, M.; Ortiz, A.; Ortiz, I. Progress in the use of ionic liquids as electrolyte membranes in fuel cells. J. Memb. Sci. 2014, 469, 379–396. [Google Scholar] [CrossRef] [Green Version]
  9. Yáñez, M.; Ortiz, A.; Gorri, D.; Ortiz, I. Comparative performance of commercial polymeric membranes in the recovery of industrial hydrogen waste gas streams. Int. J. Hydrogen Energy 2020. [Google Scholar] [CrossRef]
  10. Staffell, I.; Scamman, D.; Velazquez Abad, A.; Balcombe, P.; Dodds, P.E.; Ekins, P.; Shah, N.; Ward, K.R. The role of hydrogen and fuel cells in the global energy system. Energy Environ. Sci. 2019, 12, 463–491. [Google Scholar] [CrossRef] [Green Version]
  11. Dincer, I.; Rosen, M.A. Sustainability aspects of hydrogen and fuel cell systems. Energy Sustain. Dev. 2011, 15, 137–146. [Google Scholar] [CrossRef]
  12. Protasova, L.; Snijkers, F. Recent developments in oxygen carrier materials for hydrogen production via chemical looping processes. Fuel 2016, 181, 75–93. [Google Scholar] [CrossRef]
  13. Chaubey, R.; Sahu, S.; James, O.O.; Maity, S. A review on development of industrial processes and emerging techniques for production of hydrogen from renewable and sustainable sources. Renew. Sustain. Energy Rev. 2013, 23, 443–462. [Google Scholar] [CrossRef]
  14. Levalley, T.L.; Richard, A.R.; Fan, M. The progress in water gas shift and steam reforming hydrogen production technologies—A review. Int. J. Hydrogen Energy 2014, 39, 16983–17000. [Google Scholar] [CrossRef]
  15. Kaiwen, L.; Bin, Y.; Tao, Z. Economic analysis of hydrogen production from steam reforming process: A literature review. Energy Sources Part B Econ. Plan. Policy 2018, 13, 109–115. [Google Scholar] [CrossRef]
  16. Ju, H.K.; Badwal, S.; Giddey, S. A comprehensive review of carbon and hydrocarbon assisted water electrolysis for hydrogen production. Appl. Energy 2018, 231, 502–533. [Google Scholar] [CrossRef]
  17. Maarefian, M.; Bandehali, S.; Azami, S.; Sanaeepur, H.; Moghadassi, A. Hydrogen recovery from ammonia purge gas by a membrane separator: A simulation study. Int. J. Energy Res. 2019, 43, 8217–8229. [Google Scholar] [CrossRef]
  18. Cho, S.H.; Chue, K.T.; Kim, J.N. A two stage PSA for argon and hydrogen recovery from ammonia purge gas. Chem. Eng. Commun. 1998, 163, 97–109. [Google Scholar] [CrossRef]
  19. Rahimpour, M.R.; Asgari, A. Production of hydrogen from purge gases of ammonia plants in a catalytic hydrogen-permselective membrane reactor. Int. J. Hydrogen Energy 2009, 34, 5795–5802. [Google Scholar] [CrossRef]
  20. Yáñez, M.; Relvas, F.; Ortiz, A.; Gorri, D.; Mendes, A.; Ortiz, I. PSA purification of waste hydrogen from ammonia plants to fuel cell grade. Sep. Purif. Technol. 2020, 240, 116334. [Google Scholar] [CrossRef]
  21. Razzaq, R.; Li, C.; Zhang, S. Coke oven gas: Availability, properties, purification, and utilization in China. Fuel 2013, 113, 287–299. [Google Scholar] [CrossRef]
  22. Xiang, D.; Zhou, Y. Concept design and techno-economic performance of hydrogen and ammonia co-generation by coke-oven gas-pressure swing adsorption integrated with chemical looping hydrogen process. Appl. Energy 2018, 229, 1024–1034. [Google Scholar] [CrossRef]
  23. Xie, H.; Yu, Q.; Zuo, Z.; Zhang, J.; Han, Z.; Qin, Q. Thermodynamic analysis of hydrogen production from raw coke oven gas via steam reforming. J. Therm. Anal. Calorim. 2016, 126, 1621–1631. [Google Scholar] [CrossRef]
  24. Xu, J.; Lin, W.; Xu, S. Hydrogen and LNG production from coke oven gas with multi-stage helium expansion refrigeration. Int. J. Hydrogen Energy 2018, 43, 12680–12687. [Google Scholar] [CrossRef]
  25. Wang, Z.; Li, L.; Zhang, G. Life cycle greenhouse gas assessment of hydrogen production via chemical looping combustion thermally coupled steam reforming. J. Clean. Prod. 2018, 179, 335–346. [Google Scholar] [CrossRef]
  26. Li, W.; He, S.; Li, S. Experimental study and thermodynamic analysis of hydrogen production through a two-step chemical regenerative coal gasification. Appl. Sci. 2019, 9, 35. [Google Scholar] [CrossRef] [Green Version]
  27. Piasecka, I.; Tomporowski, A.; Flizikowski, J.; Kruszelnicka, W.; Kasner, R.; Mroziński, A. Life cycle analysis of ecological impacts of an offshore and a land-basedwind power plant. Appl. Sci. 2019, 9, 231. [Google Scholar] [CrossRef] [Green Version]
  28. Asdrubali, F.; Baldinelli, G.; D’Alessandro, F.; Scrucca, F. Life cycle assessment of electricity production from renewable energies: Review and results harmonization. Renew. Sustain. Energy Rev. 2015, 42, 1113–1122. [Google Scholar] [CrossRef]
  29. Ketzer, F.; Skarka, J.; Rösch, C. Critical Review of Microalgae LCA Studies for Bioenergy Production. Bioenergy Res. 2018, 11, 95–105. [Google Scholar] [CrossRef]
  30. Valente, A.; Iribarren, D.; Dufour, J. Life cycle assessment of hydrogen energy systems: A review of methodological choices. Int. J. Life Cycle Assess. 2017, 22, 346–363. [Google Scholar] [CrossRef]
  31. Evangelisti, S.; Tagliaferri, C.; Brett, D.J.L.; Lettieri, P. Life cycle assessment of a polymer electrolyte membrane fuel cell system for passenger vehicles. J. Clean. Prod. 2017, 142, 4339–4355. [Google Scholar] [CrossRef]
  32. ISO. ISO 14040:2006. Environmental Management—Life Cycle Assessment—Principles and Framework; ISO: Geneva, Switzerland, 2006. [Google Scholar]
  33. ISO. ISO 14044:2006. Environmental Management—Life Cycle Assessment—Requirements and Guidelines; ISO: Geneva, Switzerland, 2006. [Google Scholar]
  34. Margallo, M.; Cobo, S.; Laso, J.; Fernández, A.; Muñoz, E.; Santos, E.; Aldaco, R.; Irabien, A. Environmental performance of alternatives to treat fly ash from a waste to energy plant. J. Clean. Prod. 2019, 231, 1016–1026. [Google Scholar] [CrossRef]
  35. ISO. ISO 14687-2:2012. Hydrogen Fuel—Product Specification—Part 2: Proton Exchange Membrane (PEM) Fuel Cell Applications for Road Vehicles; ISO: Geneva, Switzerland, 2012. [Google Scholar]
  36. Wagner, U.; Eckl, R.; Tzscheutschler, P. Energetic life cycle assessment of fuel cell powertrain systems and alternative fuels in Germany. Energy 2006, 31, 2726–2739. [Google Scholar] [CrossRef]
  37. Hawkins, T.R.; Singh, B.; Majeau-Bettez, G.; Strümman, A.H. Comparative Environmental Life Cycle Assessment of Conventional and Electric Vehicles. J. Ind. Ecol. 2013, 17, 53–64. [Google Scholar] [CrossRef]
  38. Simons, A.; Bauer, C. A life-cycle perspective on automotive fuel cells. Appl. Energy 2015, 157, 884–896. [Google Scholar] [CrossRef]
  39. Ahmadi, P.; Kjeang, E. Comparative life cycle assessment of hydrogen fuel cell passenger vehicles in different Canadian provinces. Int. J. Hydrogen Energy 2015, 40, 12905–12917. [Google Scholar] [CrossRef]
  40. Sørensen, B. Total life-cycle assessment of PEM fuel cell car. In Proceedings of the 15th World Hydrogen Energy Conference, Yokohama, Japan, 27 June–2 July 2004. [Google Scholar]
  41. Duclos, L.; Lupsea, M.; Mandil, G.; Svecova, L.; Thivel, P.X.; Laforest, V. Environmental assessment of proton exchange membrane fuel cell platinum catalyst recycling. J. Clean. Prod. 2017, 142, 2618–2628. [Google Scholar] [CrossRef]
  42. Hayashi, K.; Gaillard, G.; Nemecek, T. Life cycle assessment of agricultural production systems: Current issues and future perspectives. In Proceedings of the International Seminar on Technology Development for Good Agricultural Practice in Asia and Oceania, Tsukuba, Japan, 24–28 October 2005. [Google Scholar]
  43. Iribarren, D.; Moreira, M.T.; Feijoo, G. Implementing by-product management into the Life Cycle Assessment of the mussel sector. Resour. Conserv. Recycl. 2010, 54, 1219–1230. [Google Scholar] [CrossRef]
  44. Freon, P.; Durand, H.; Avadí, A.; Huaranca, S.; Orozco Moreyra, R. Life cycle assessment of three Peruvian fishmeal plants: Toward a cleaner production. J. Clean. Prod. 2017, 145, 50–63. [Google Scholar] [CrossRef]
  45. Vázquez-Rowe, I.; Villanueva-Rey, P.; Hospido, A.; Moreira, M.T.; Feijoo, G. Life cycle assessment of European pilchard (Sardina pilchardus) consumption. A case study for Galicia (NW Spain). Sci. Total Environ. 2014, 475, 48–60. [Google Scholar] [CrossRef]
  46. Ross, S.A.; Topp, C.F.E.; Ennos, R.A.; Chagunda, M.G.G. Relative emissions intensity of dairy production systems: Employing different functional units in life-cycle assessment. Animal 2017, 11, 1381–1388. [Google Scholar] [CrossRef] [PubMed] [Green Version]
  47. Song, C.; Liu, Q.; Ji, N.; Kansha, Y.; Tsutsumi, A. Optimization of steam methane reforming coupled with pressure swing adsorption hydrogen production process by heat integration. Appl. Energy 2015, 154, 392–401. [Google Scholar] [CrossRef]
  48. Dominguez-Ramos, A.; Irabien, A. The carbon footprint of Power-to-Synthetic Natural Gas by Photovoltaic solar powered Electrochemical Reduction of CO2. Sustain. Prod. Consum. 2019, 17, 229–240. [Google Scholar] [CrossRef]
  49. Sphera Gabi 9.2 Software-System and Databases for Life Cycle Engineering; Sphera: Stuttgart, Echterdingen, Germany, 2019.
  50. Heijungs, R.; Guinée, J.B.; Huppes, G.; Lankreijer, R.M.; Udo de Haes, H.A.; Wegener Sleeswijk, A.; Ansems, A.M.M.; Eggels, P.G.; van Diun, R.; de Goede, H.P. Environmental Life Cycle Assessment of Products: Guide and Backgrounds; Centre of Environmental Science (CML), Leiden University: Leiden, The Netherlands, 1992; ISBN 9051910649. [Google Scholar]
  51. Ecoinvent. Ecoinvent v3 Database; Ecoinvent: Zurich, Switzerland, 2016. [Google Scholar]
  52. Latunussa, C.E.L.; Ardente, F.; Blengini, G.A.; Mancini, L. Life Cycle Assessment of an innovative recycling process for crystalline silicon photovoltaic panels. Sol. Energy Mater. Sol. Cells 2016, 156, 101–111. [Google Scholar] [CrossRef]
  53. Cetinkaya, E.; Dincer, I.; Naterer, G.F. Life cycle assessment of various hydrogen production methods. Int. J. Hydrogen Energy 2012, 37, 2071–2080. [Google Scholar] [CrossRef]
  54. Hajjaji, N.; Pons, M.N.; Renaudin, V.; Houas, A. Comparative life cycle assessment of eight alternatives for hydrogen production from renewable and fossil feedstock. J. Clean. Prod. 2013, 44, 177–189. [Google Scholar] [CrossRef]
  55. Khojasteh Salkuyeh, Y.; Saville, B.A.; MacLean, H.L. Techno-economic analysis and life cycle assessment of hydrogen production from natural gas using current and emerging technologies. Int. J. Hydrogen Energy 2017, 42, 18894–18909. [Google Scholar] [CrossRef]
  56. Siddiqui, O.; Dincer, I. A well to pump life cycle environmental impact assessment of some hydrogen production routes. Int. J. Hydrogen Energy 2019, 44, 5773–5786. [Google Scholar] [CrossRef]
  57. Ghandehariun, S.; Kumar, A. Life cycle assessment of wind-based hydrogen production in Western Canada. Int. J. Hydrogen Energy 2016, 41, 9696–9704. [Google Scholar] [CrossRef]
  58. Chen, J.; Xu, W.; Zuo, H.; Wu, X.; Jiaqiang, E.; Wang, T.; Zhang, F.; Lu, N. System development and environmental performance analysis of a solar-driven supercritical water gasification pilot plant for hydrogen production using life cycle assessment approach. Energy Convers. Manag. 2019, 184, 60–73. [Google Scholar] [CrossRef]
  59. Postels, S.; Abánades, A.; von der Assen, N.; Rathnam, R.K.; Stückrad, S.; Bardow, A. Life cycle assessment of hydrogen production by thermal cracking of methane based on liquid-metal technology. Int. J. Hydrogen Energy 2016, 41, 23204–23212. [Google Scholar] [CrossRef]
  60. Susmozas, A.; Iribarren, D.; Dufour, J. Life-cycle performance of indirect biomass gasification as a green alternative to steam methane reforming for hydrogen production. Int. J. Hydrogen Energy 2013, 38, 9961–9972. [Google Scholar] [CrossRef]
  61. Khila, Z.; Baccar, I.; Jemel, I.; Houas, A.; Hajjaji, N. Energetic, exergetic and environmental life cycle assessment analyses as tools for optimization of hydrogen production by autothermal reforming of bioethanol. Int. J. Hydrogen Energy 2016, 41, 17723–17739. [Google Scholar] [CrossRef]
  62. Hauck, M.; Steinmann, Z.J.N.; Schipper, A.M.; Gorrissen, F.; Venkatesh, A.; Huijbregts, M.A.J. Estimating the Greenhouse Gas Balance of Individual Gas-Fired and Oil-Fired Electricity Plants on a Global Scale. J. Ind. Ecol. 2017, 21, 127–135. [Google Scholar] [CrossRef] [Green Version]
  63. Aksyutin, O.E.; Ishkov, A.G.; Romanov, K.V.; Grachev, V.A. The carbon footprint of natural gas and its role in the carbon footprint of energy production. Int. J. Geomate 2018, 15, 155–160. [Google Scholar] [CrossRef]
  64. Naterer, G.F.; Suppiah, S.; Stolberg, L.; Lewis, M.; Ferrandon, M.; Wang, Z.; Dincer, I.; Gabriel, K.; Rosen, M.A.; Secnik, E.; et al. Clean hydrogen production with the Cu-Cl cycle-Progress of international consortium, II: Simulations, thermochemical data and materials. Int. J. Hydrogen Energy 2011, 36, 15486–15501. [Google Scholar] [CrossRef]
  65. Bhandari, R.; Trudewind, C.A.; Zapp, P. Life cycle assessment of hydrogen production via electrolysis—A review. J. Clean. Prod. 2014, 85, 151–163. [Google Scholar] [CrossRef]
  66. Galera, S.; Gutiérrez Ortiz, F.J. Life cycle assessment of hydrogen and power production by supercritical water reforming of glycerol. Energy Convers. Manag. 2015, 96, 637–645. [Google Scholar] [CrossRef]
  67. Li, G.; Wang, S.; Zhao, J.; Qi, H.; Ma, Z.; Cui, P.; Zhu, Z.; Gao, J.; Wang, Y. Life cycle assessment and techno-economic analysis of biomass-to-hydrogen production with methane tri-reforming. Energy 2020, 199, 117488. [Google Scholar] [CrossRef]
  68. Rooijen, V. A Life Cycle Assessment of the PureCell Stationary Fuel Cell System: Providing a Guide for Environmental Improvement; No. CSS06-09; Center for Sustainable Systems: Ann Arbor, MI, USA, 2006. [Google Scholar]
  69. Stropnik, R.; Lotric, A.; Montenegro, A.; Sekavcnik, M.; Mori, M. Critical materials in PEMFC systems and a LCA analysis for the potential reduction of environmental impacts with EoL strategies. Energy Sci Eng. 2019, 7, 2519–2539. [Google Scholar] [CrossRef]
  70. Gilbert, P.; Walsh, C.; Traut, M.; Kesieme, U.; Pazouki, K.; Murphy, A. Assessment of full life-cycle air emmisions of alternative shipping fuels. J. Clean. Prod. 2018, 172, 855–866. [Google Scholar] [CrossRef]
Figure 1. System boundaries overview of the ammonia purge gases (APG)-based process.
Applsci 10 07461 g001
Figure 2. System boundaries overview of the coke oven gas (COG)-based process.
Applsci 10 07461 g002
Figure 3. Environmental impact results of the APG and COG processes (FU = 1 kg H2) in the categories (a) Abiotic Depletion Potential for elements (ADPE), (b) Abiotic Depletion Potential fossil fuels (ADPF), (c) Global Warming Potential (GWP), and (d) Acidification Potential (AP).
Applsci 10 07461 g003
Figure 4. Environmental impact results of the APG process (FU = 1 kWh) in the categories (a) ADPE, (b) ADPF, (c) GWP, and (d) AP.
Applsci 10 07461 g004
Figure 5. Environmental impact results of the COG process (FU = 1 kWh) in the categories (a) ADPE, (b) ADPF, (c) GWP, and (d) AP.
Applsci 10 07461 g005
Figure 6. The relative contribution of the components of the cell to the environmental burdens. A comparison with reference values reported from bibliographic references that applied the LCA methodology to assess the environmental impact of FCs was carried out with two purposes: (i) To know the reliability of the results obtained in the current study comparing with those taken as reference, and (ii) to evaluate the benefits related to the use of H2 recovered from gaseous waste streams in HT-PEMFC. References that have applied LCA for H2 recovery to its use in HT-PEMFC for stationary applications have not been found, so the production method of steam methane reforming has been considered for the comparison. In addition, most references assess the environmental impact of PEMFC for mobile applications, as transportation is currently one of the most polluting sources, whereas, that of HT-PEMFC for stationary applications is underdeveloped.
Applsci 10 07461 g006
Figure 7. Environmental impact results of the APG and COG processes (FU = 1 kg input stream) in the categories (a) ADPE, (b) ADPF, (c) GWP, and (d) AP.
Applsci 10 07461 g007
Table 1. Characteristics of the different scenarios defined.
ScenariosE1E2E3E4E5E6E7E8
Compression (Yes/No)YYYYNNNN
Electricity Source (Grid/Photovoltaic)GPGPGPGP
Methane recovery (Yes/No)YYNNYYNN
Table 2. Flowrates and compositions of the APG and COG streams.
Gas StreamFlow Rate
(kg/h)
Molar Composition
H2N2CH4CO2CO
COG15660.6020.0470.2620.0210.068
APG1370.6100.2200.1700.0000.000
Table 3. Energy balances of the system in different scenarios.
Gas StreamScenariosInputsOutputs
Feed Flow
(kg/h)
N2
Separation
Energy (kWh)
CH4 Separation
Energy (kWh)
Fuel Cell
(Units)
Fuel Cell Energy
(kWh)
Engine Energy
(kWh)
COGE1/E2156600129276789
APG13702.71245128
COGE3/E4156600129270
APG1370012450
COGE5/E615665550129276789
APG137442.71245128
COGE7/E815665550129270
APG13744012450
Publisher’s Note: MDPI stays neutral with regard to jurisdictional claims in published maps and institutional affiliations.

