1. Introduction
1.1. Concept of Industry 4.0 and Smart Factory
A smart factory is defined as a high-tech intelligent factory centered on integrating all the production processes—from product planning to purchase—through ICT (information communication technology) to time- and cost-effectively produce customized products. Through Industry 4.0 and smart factories—two concepts that have been amassing much attention recently—various technologies, such as control technology, robot technology, Internet of Things (IoT) technology, cloud technology, and AR/VR technology, are integrated and implemented. However, beyond the application and integration of these new technologies, the integration and flexibility of the global value chain [
1] are also key features of Industry 4.0 and smart factories. In fact, Industry 4.0, also known as the Fourth Industrial Revolution, began based on the objective of having the ability to create products that reflect the diverse needs of customers through efficient manufacturing systems; we can call this concept “flexible global value chain integration”. The goal of Industry 4.0 and smart factories can be realized through the integration of three perspectives [
2,
3]. The first is “end-to-end engineering,” which is the integration of product value chains to create the products customers want. The second is “horizontal integration”, which is a concept for building new business models or ecosystems between companies. The third is “vertical integration”, which refers to the amalgamation of systems with a single company, from a sensor in the shop floor to an ERP (Enterprise Resource Planning) system, for flexible and reconfigurable manufacturing systems.
Through empirical studies on various technologies related to Industry 4.0 and smart factories, eight core technologies have been presented as being part of this revolution, as shown in
Table 1 [
4]. Currently, of these eight, four have been identified as the major technologies: CPS (cyber-physical system), IoT, Smart Factory, and Internet of Service (IoS). However, rather than taking big data and cloud technologies as unimportant, it is proposed that the remaining four technologies should be introduced in stages following the four major technologies (
Table 1). Among these technologies, we included technical indicators related to IoT, big data, and M2M in the evaluation framework.
1.2. Global Industry 4.0 and Smart Factory Trends
The advent of the Fourth Industrial Revolution was announced at the WEF (World Economic Forum) in 2016 following its initial discussion in Germany in 2011, and it has been a global issue since then. Germany has pursued the Industry 4.0 strategy as a way to maintain its leadership in global manufacturing. In addition to Germany, USA, China, and Japan have also reexamined the manufacturing industry, which is a source of job creation and economic growth. In particular, the environment surrounding the manufacturing industry is changing rapidly, and the pace of change is accelerating due to market changes, the manufacturing environment, and technology. Due to such changes and the technological advancements brought on by Industry 4.0, the manufacturing sector began to move towards more advanced methods of production, which today has culminated in the concept of a smart factory.
1.3. Status of Smart Factories in Korea
A smart factory in Korea is defined as a factory that produces customized products with minimal cost and time by integrating the entire process of planning, design, production, distribution, and sales into IoT, AI, and big data [
5]. In Korea, various strategies are being pursued in response to Industry 4.0. In particular, the Korean government began to distribute and expand smart factories from 2014 to make the manufacturing industry smart. Recently, the government has been making continuous efforts to establish 30,000 smart factories.
The smartness of manufacturing companies following the establishment of their smart factories is defined in five levels: level 1 (identified), level 2 (measured), level 3 (analyzed), level 4 (optimized), and level 5 (customized) [
5]. According to the smartness level, manufacturing companies establish a smart factory to meet their process and system levels. In Korea, by the end of 2018, about 8000 manufacturing companies had established smart factories, but about 80% of them were established at a basic level—that is, at either level 1 or 2 [
6].
Although smart factory projects are currently underway in Korea, methods for accurately diagnosing the levels of companies that want to establish smart factories are lacking. There is also a lack of empirical information on existing smart factories that could help guide the establishment of new smart factories. First, operating a supplier-centered diagnostic system is problematic despite the need to provide a checklist suitable for a manufacturing company that uses an actual smart factory. In the existing smart factory diagnosis model, the smart factory level is diagnosed by combining five areas (shop floor automation, factory operation, enterprise resource management, product development, supply chain management) and five levels (advanced level, intermediate level 2, intermediate level 1, basic level, no application of ICT). To supplement for this, it is necessary to consider the manufacturing company’s process, manpower, and performance aspects, including the level of supply technology to make a smart factory. Second, given the advent of Industry 4.0, various new technologies such as artificial intelligence, IoT, CPS, and collaborative robots are being applied in manufacturing; thus, it is necessary to develop a diagnosis and evaluation system for these technologies.
1.4. Study Purpose and Structure
In this study, we propose an evaluation framework to assess the smartness and performance levels of smart factories in Korea based on the resource-based view (RBV) and IT value creation process. In relation to RBV, Grant (1991) regards the result of a combination of resources as firm capability, and clearly distinguishes resources and capabilities by insisting that various resources held by a company are the source of corporate capability [
7]. Melville et al. (2004) argue that business processes are improved by combining IT resources with complementary organizational resources, suggesting that IT resources and organizational resources are different for every company and that performance is determined by how they are used [
8]. In addition, Barua et al. (1995) emphasize that business processes change due to the introduction of IT, and that such business process changes result in IT effects on corporate performance [
9].
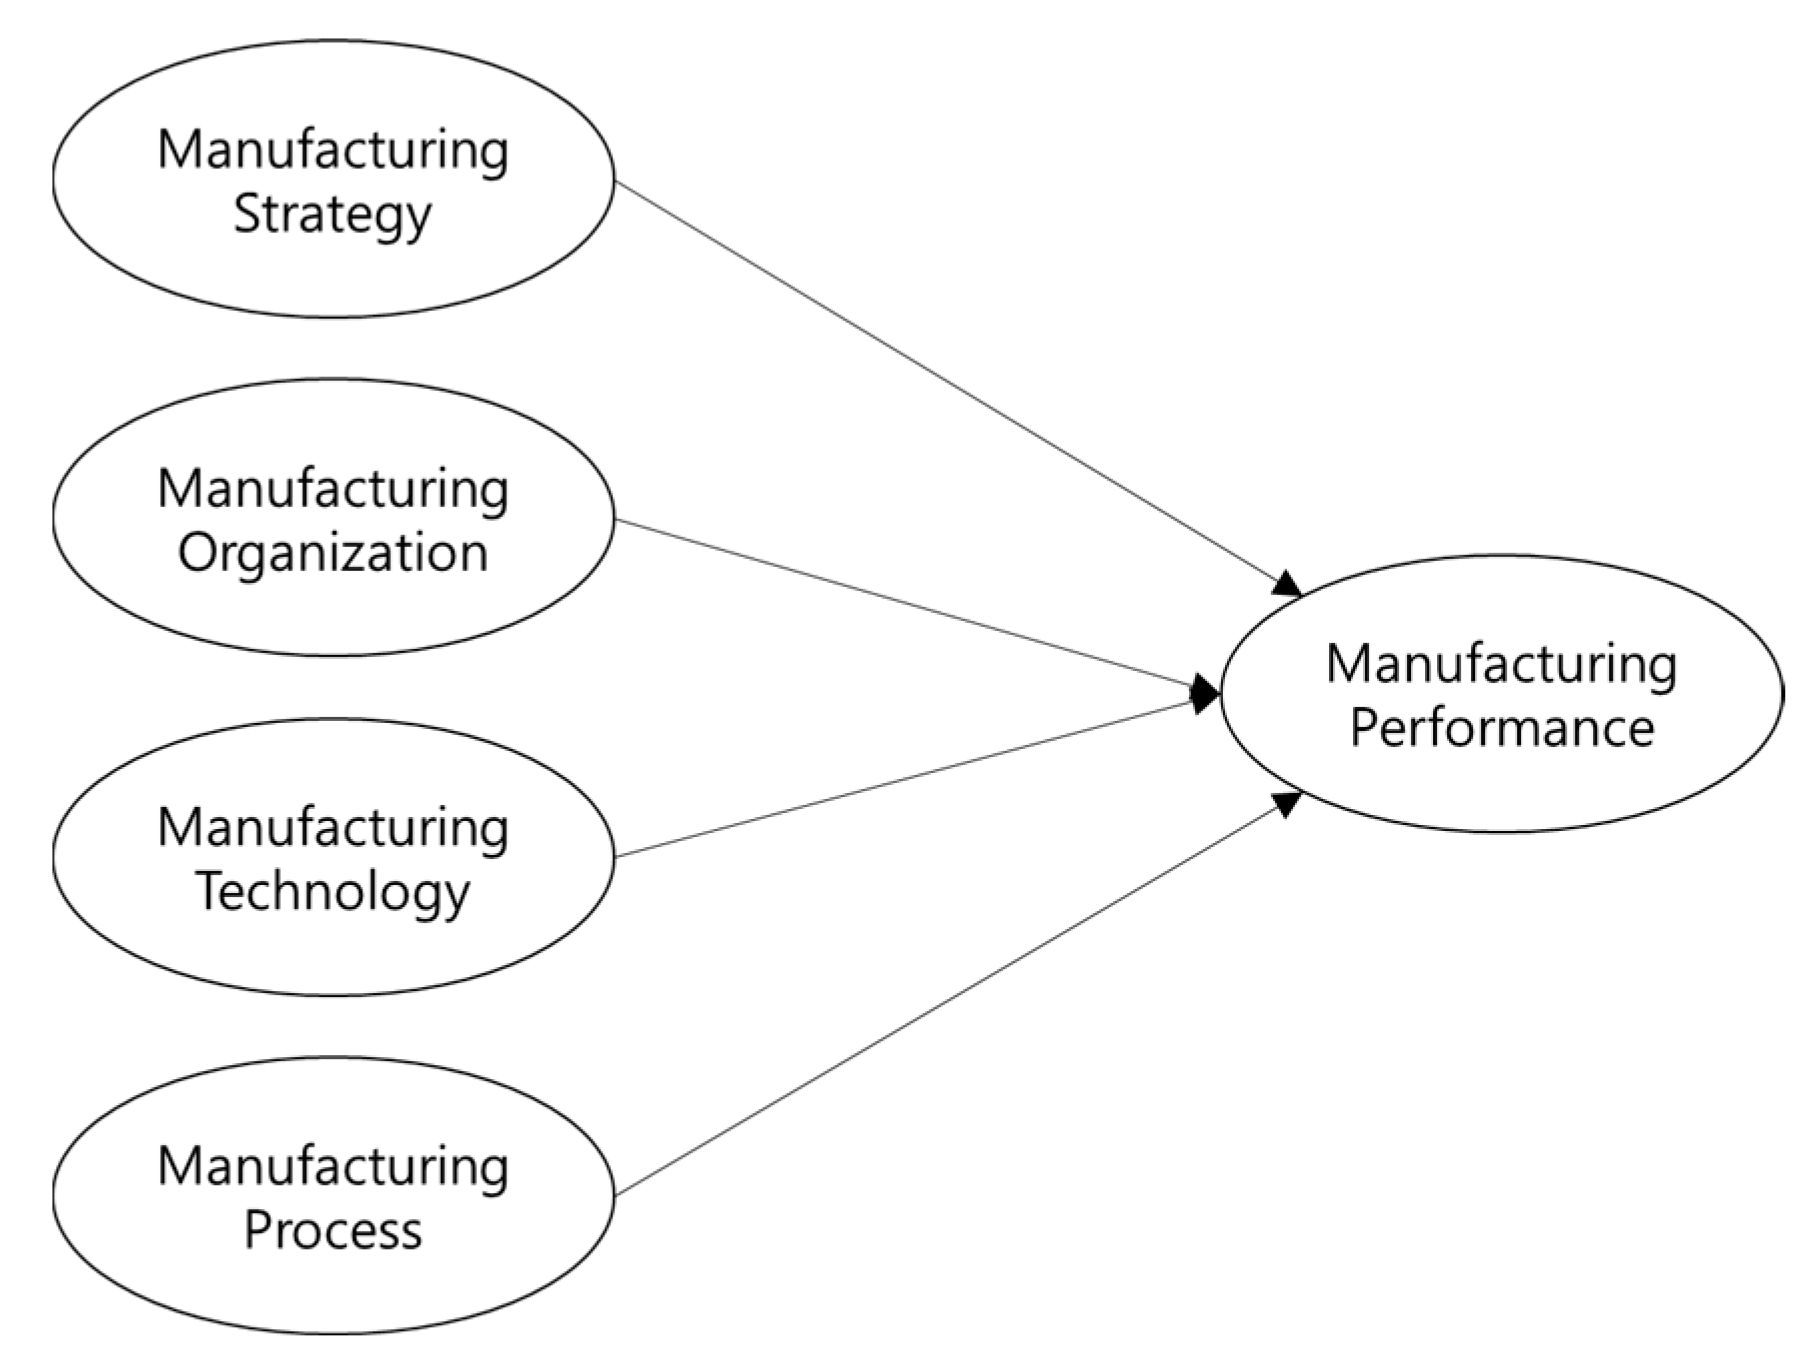
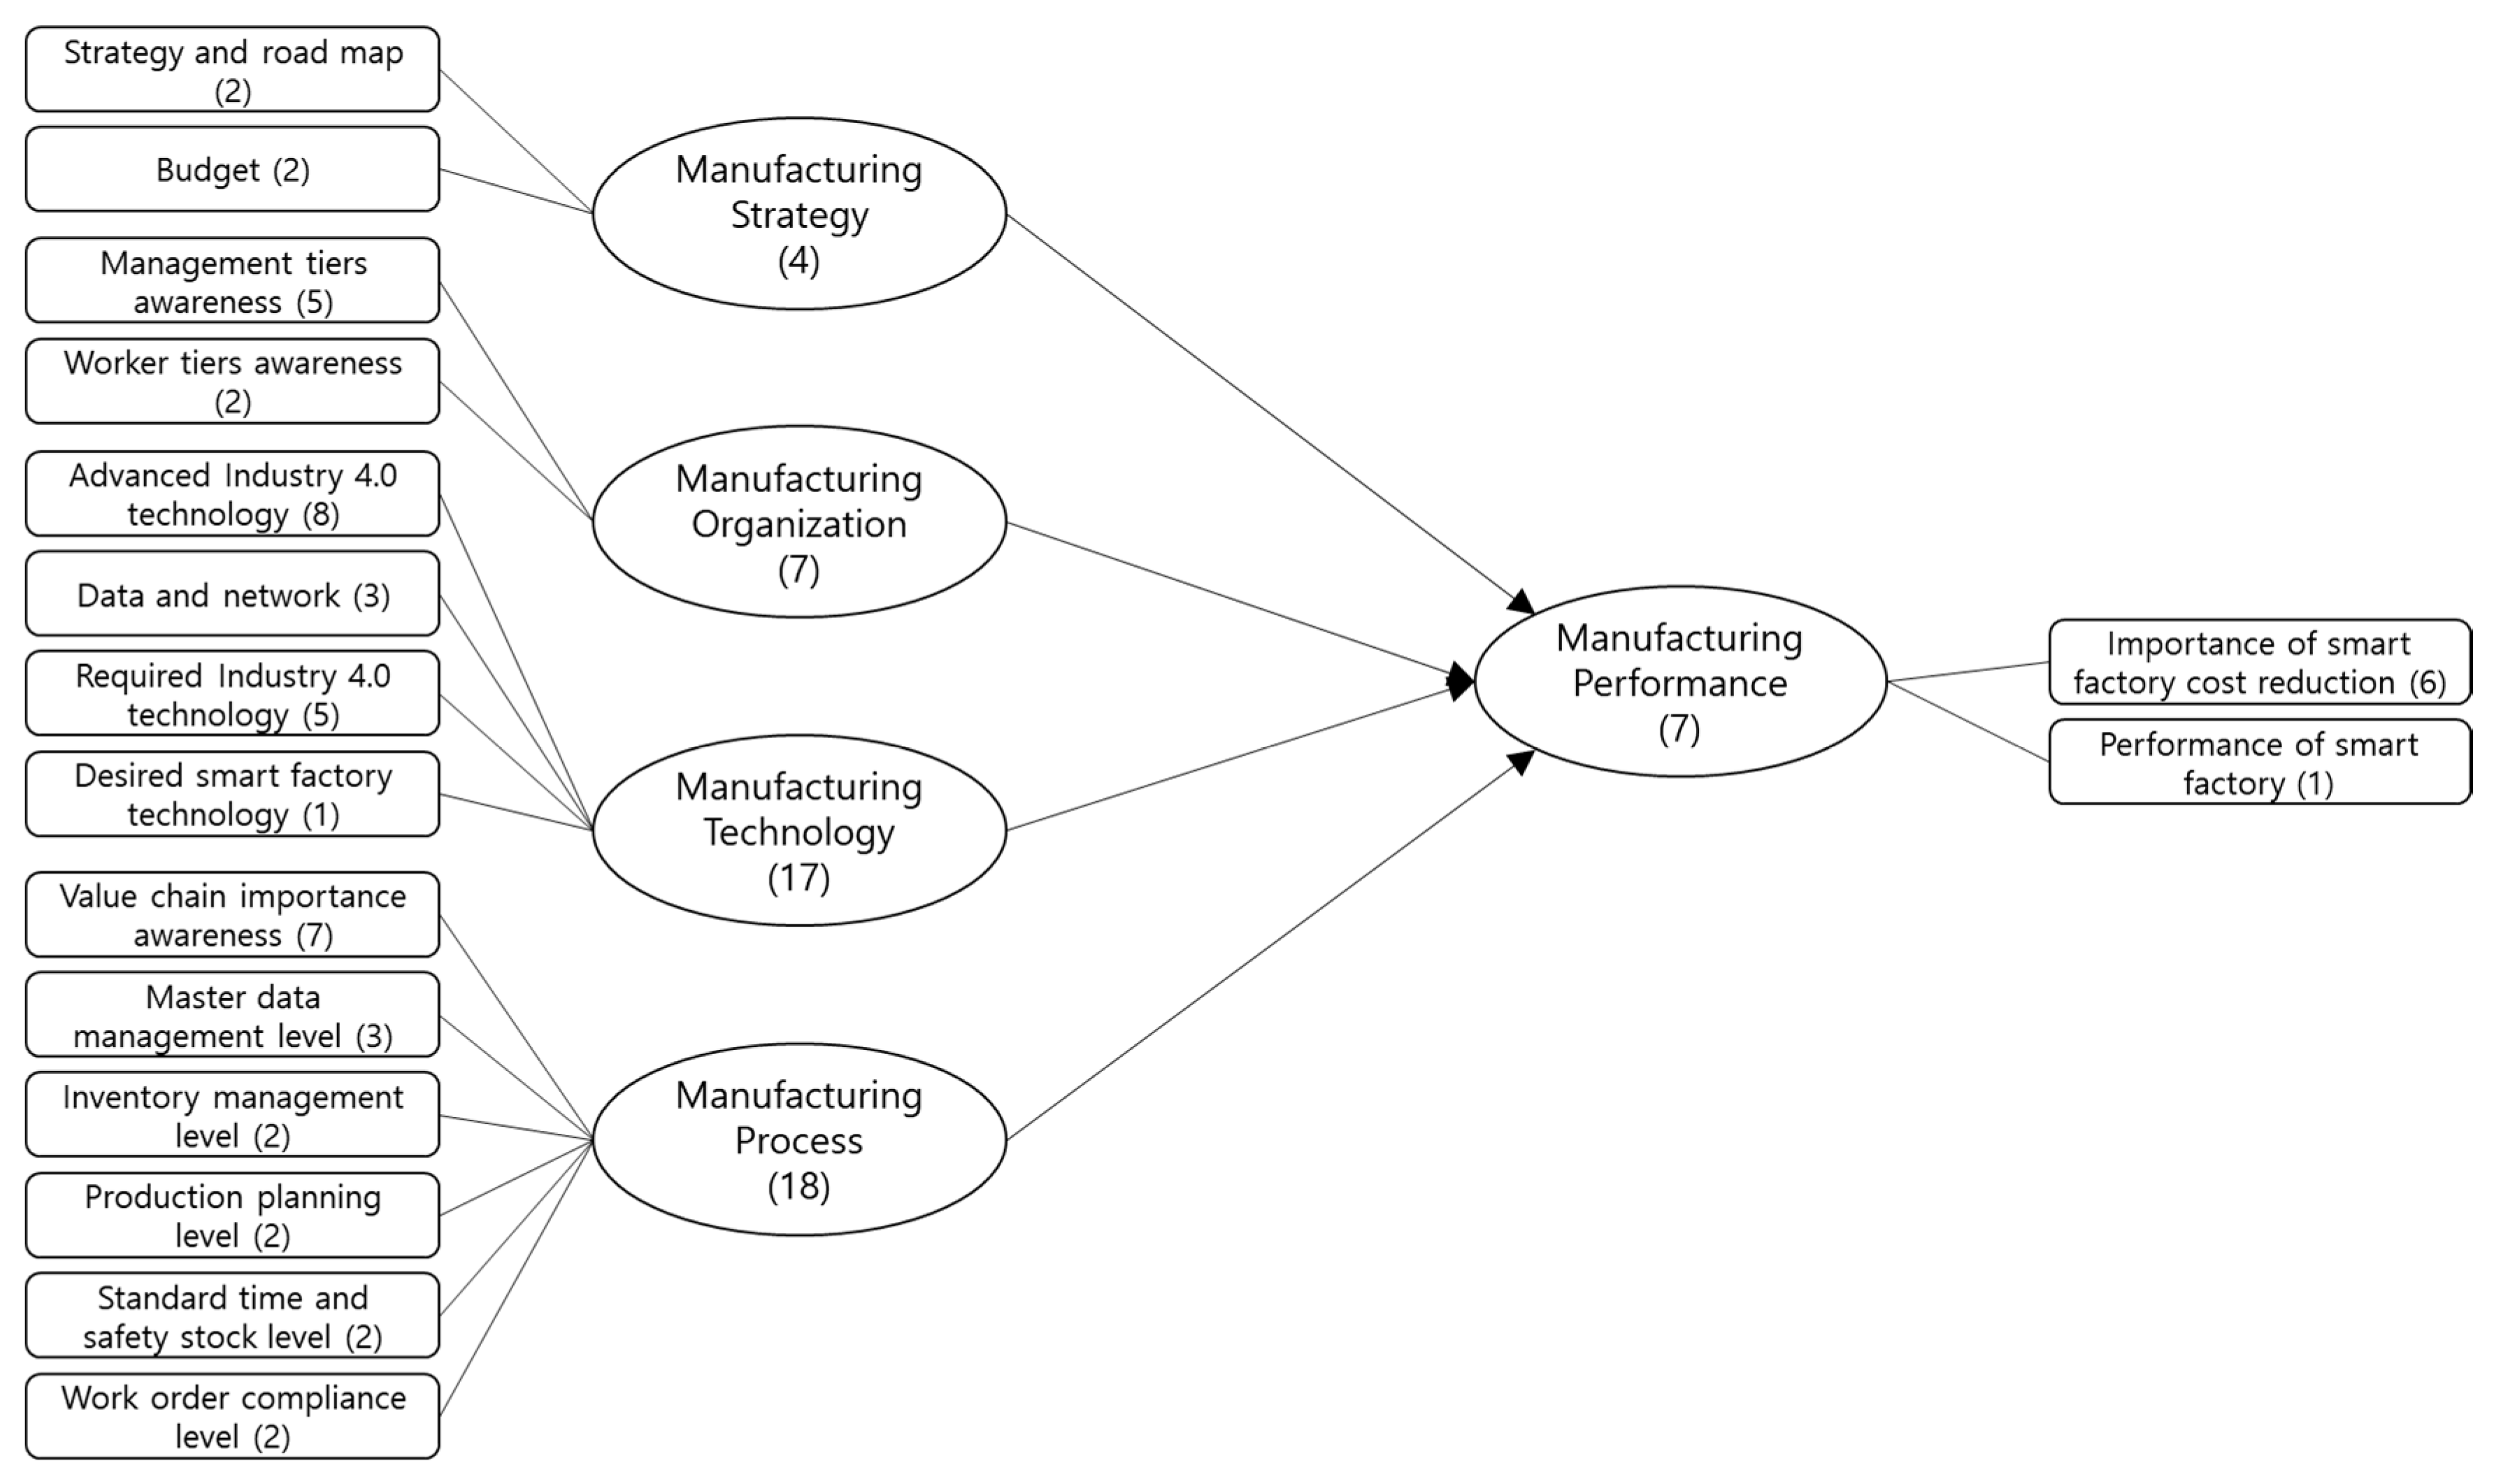
Based on their arguments and such related works, we derived five evaluation areas and proposed a research framework, as shown in
Figure 1. We applied the framework to survey 113 companies and conducted factor analysis and reliability analysis to examine the validity of the evaluation model. Through this feasibility analysis, the evaluation model for assessing a smart factory’s level of smartness was derived. In addition, we performed a correlation analysis and ANOVA based on the derived evaluation model.
2. Research Methodology
2.1. The Design of the Questionnaire
The questionnaire used in the survey was composed based on the five constructs as shown in the figure above: manufacturing strategy, organization, technology, process, and performance. The first item, the manufacturing strategy, consisted of seven items related to securing the smart factory strategy and roadmap, the promotion of the smart factory within the manufacturing company, and the input budget for establishing the smart factory. The second item, the manufacturing organization, consisted of items related to the presence or absence of a dedicated organization for the promotion of the smart factory, as well as the recognition of and commitment to the smart factory by all staff, from workers to CEOs. The third item, the manufacturing technology, consisted of items related to the level of introduction of technology required in a smart factory. For example, it consisted of items on the introduction statuses of and plans for the core Industry 4.0 and smart factory technologies, such as manufacturing execution system (MES), IoT, artificial intelligence (AI), and CPS. The fourth item, the manufacturing process, consisted of items on the level of process management after the establishment of the smart factory, such as master data management, inventory management, and production planning. Finally, the fifth item, the manufacturing performance, consisted of items related to performance indicators such as due date rate, defect rate, and line operational rate after the establishment of the smart factory.
The survey included a total of 73 questions (
Table 2), and employed two questionnaire formats, namely the Likert-type scale, with responses ranging from 1 to 5, and multiple-choice questions.
2.2. The Respondents
We conducted a questionnaire survey for manufacturing companies that adopted a smart factory through Korea’s smart factory distribution and diffusion project. The study population consisted of 203 companies, and the response rate was relatively high at 55.6% (113 out of 203 companies).
2.3. Survey and Analysis Methodology
The survey was conducted over three months from 1 January 2019 to 31 March 2019, and completed the survey through interviews, e-mail, and fax. We employed statistical analysis methods using the SPSS and Microsoft Excel packages to analyze the materials collected from the survey and conducted descriptive statistics and a frequency analysis. Through the frequency analysis, we analyzed the general current statuses of the companies.
3. Survey Results
We judged the skewness and kurtosis values for the normalization of the survey results and presented them in
Table 3 below.
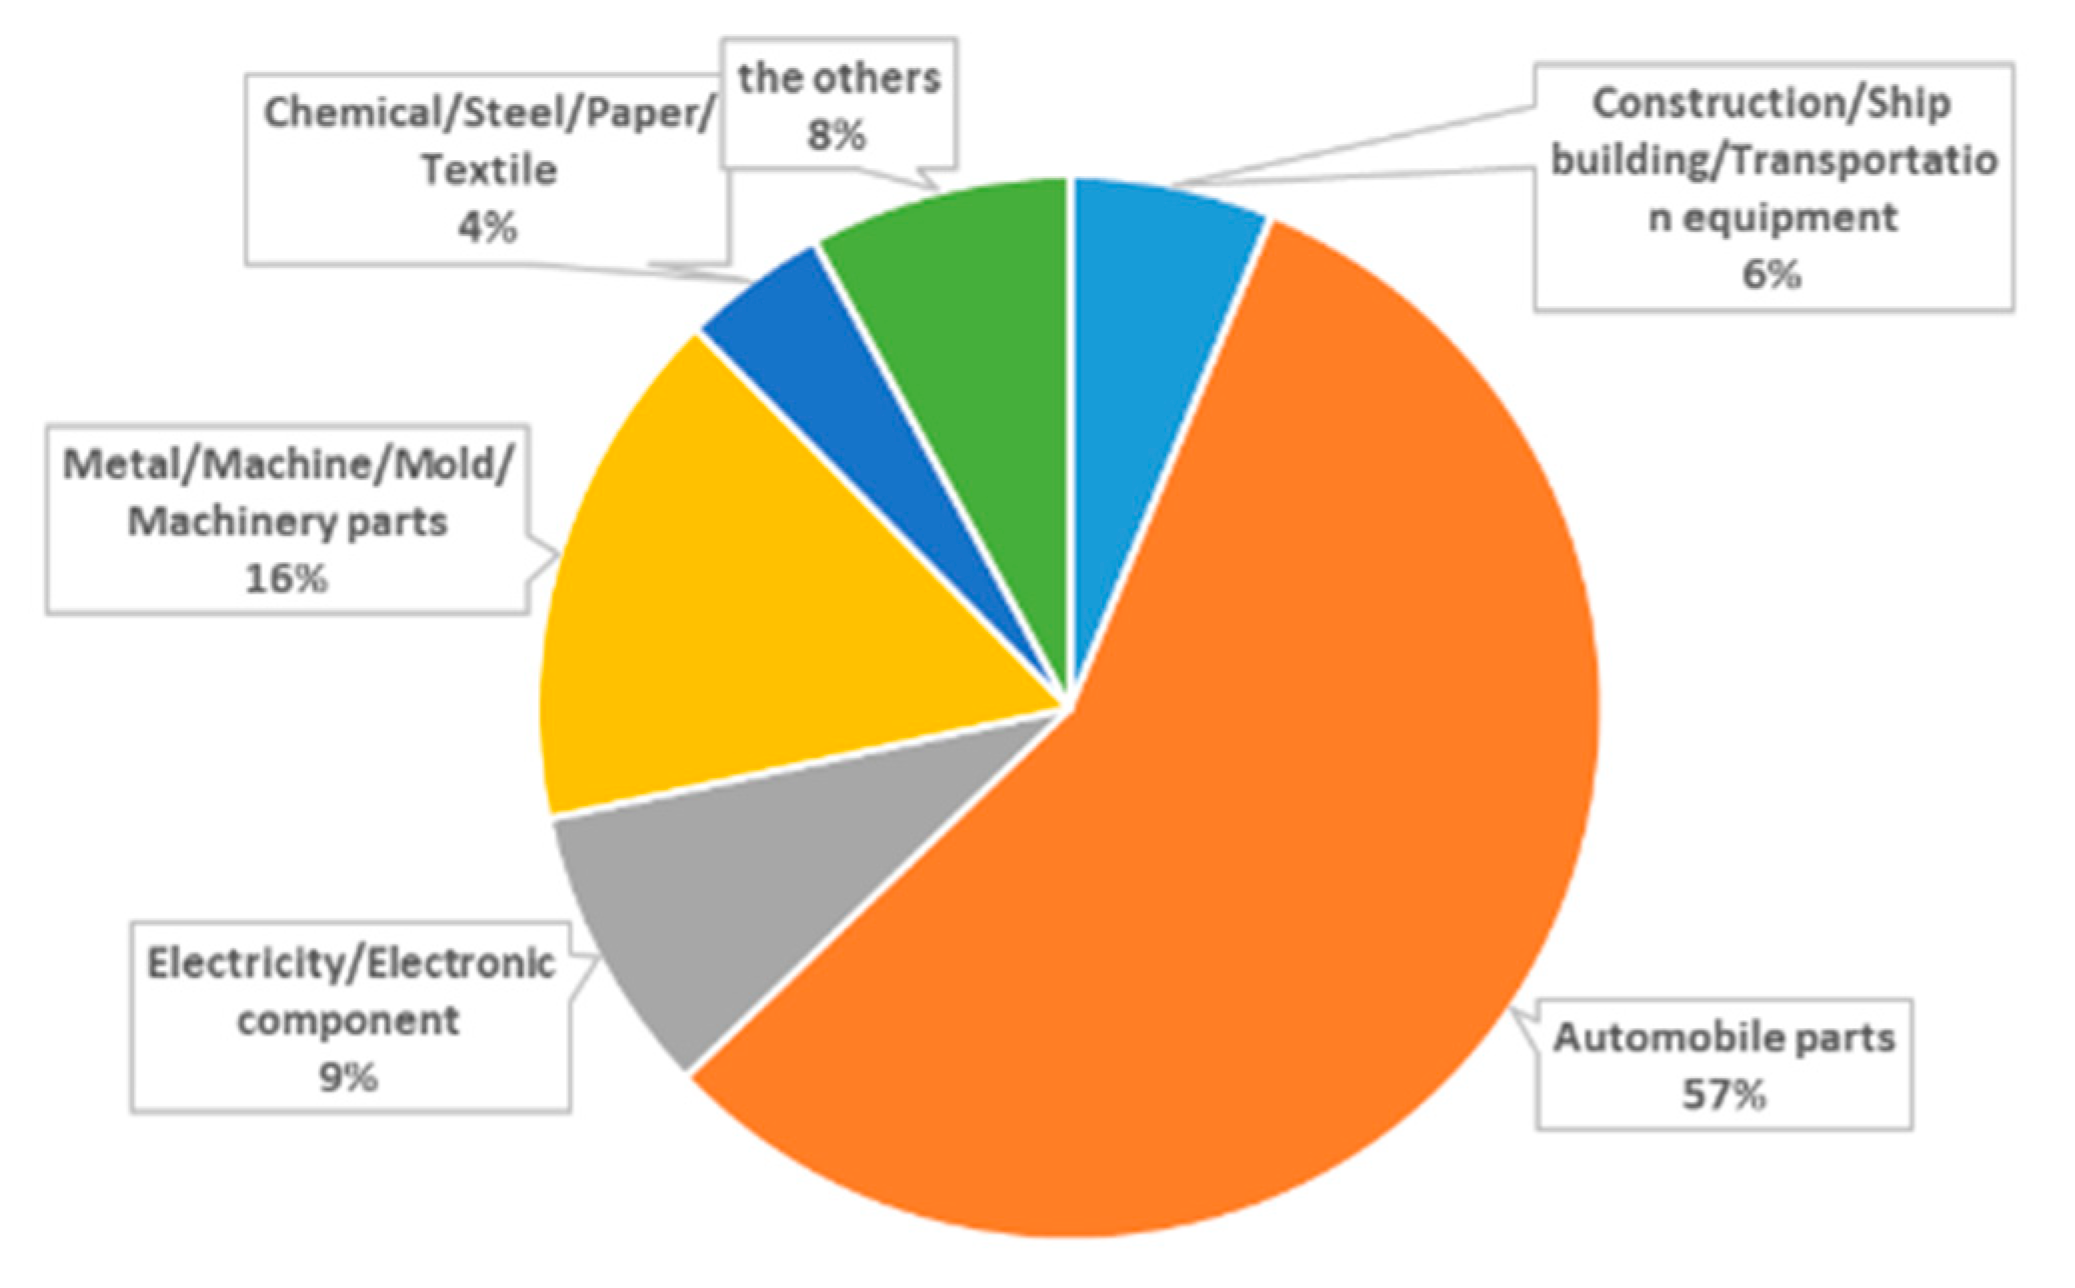
First, the survey results concerning the business type showed that the two major types among the sample were those of automobile parts and the metal/machine/mold/machine parts manufacturing, accounting for 57% and 16% of all the manufacturing companies, respectively (
Figure 2).
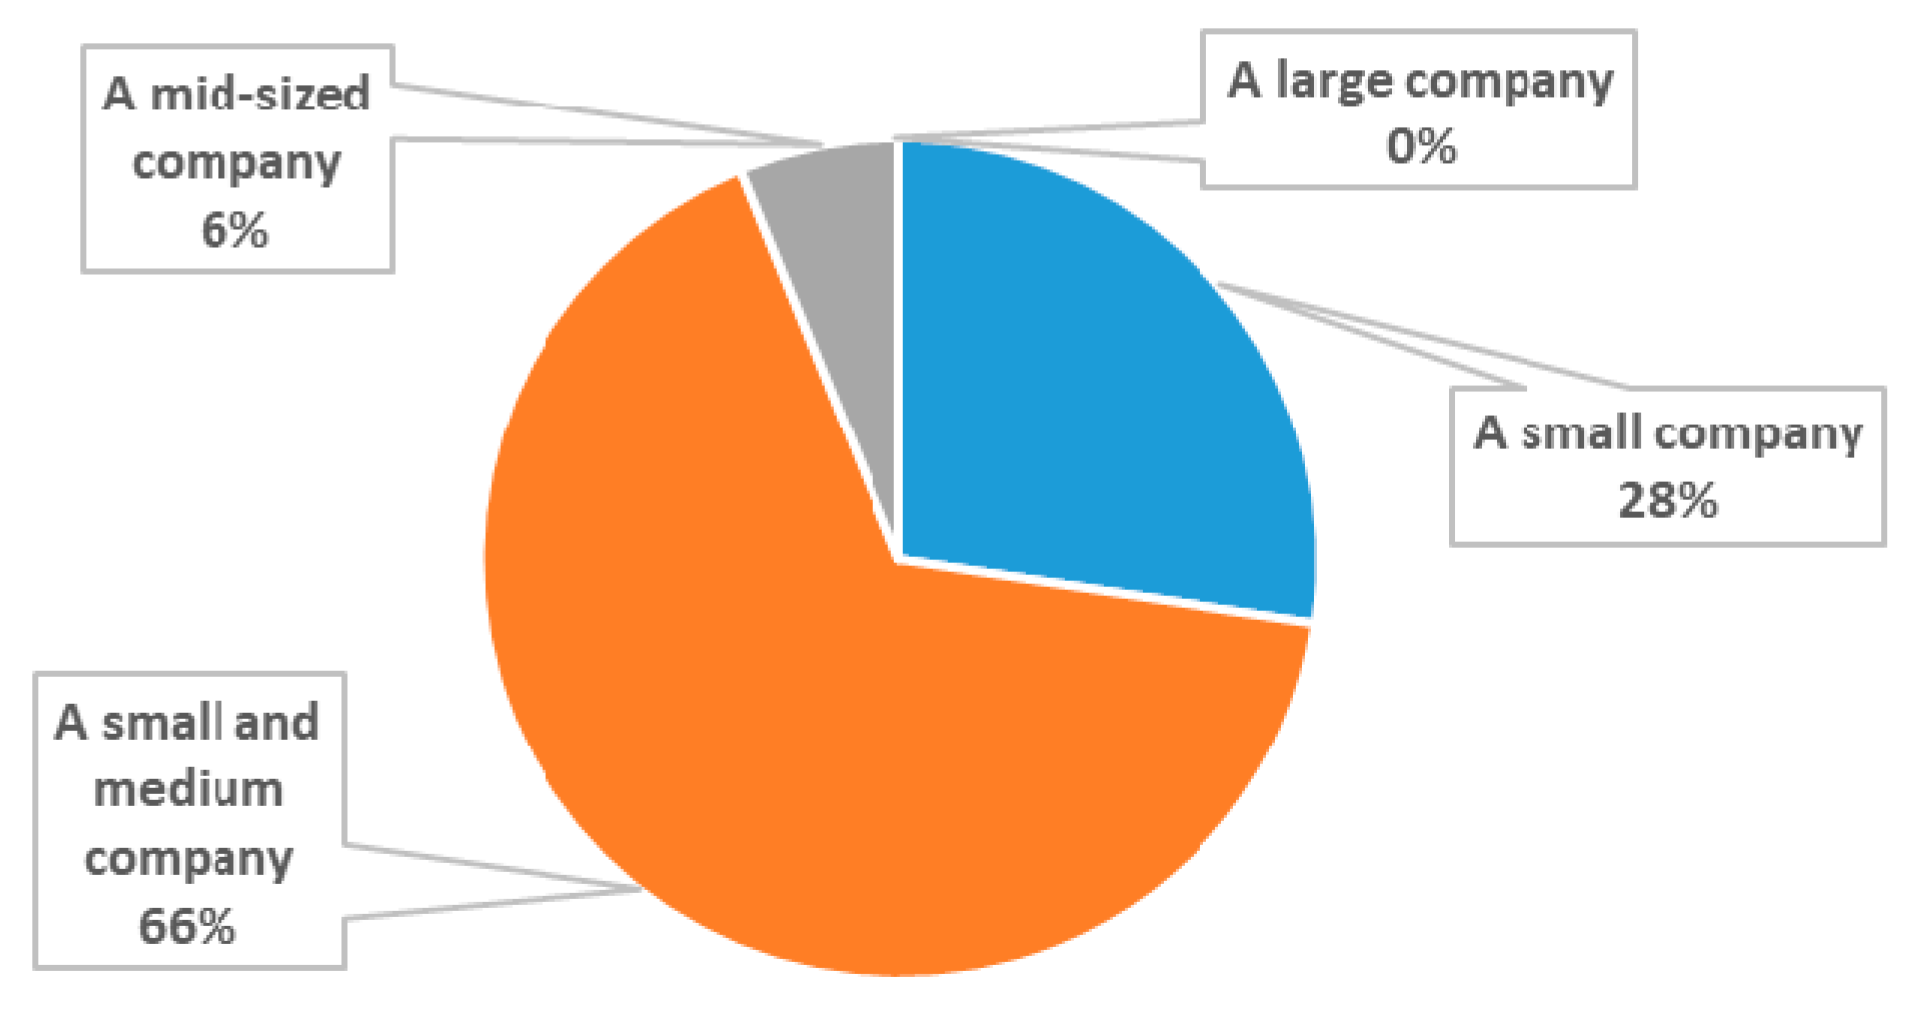
Second, 66% of the companies we surveyed were SMEs, and the rest (28%) were small companies (
Figure 3).
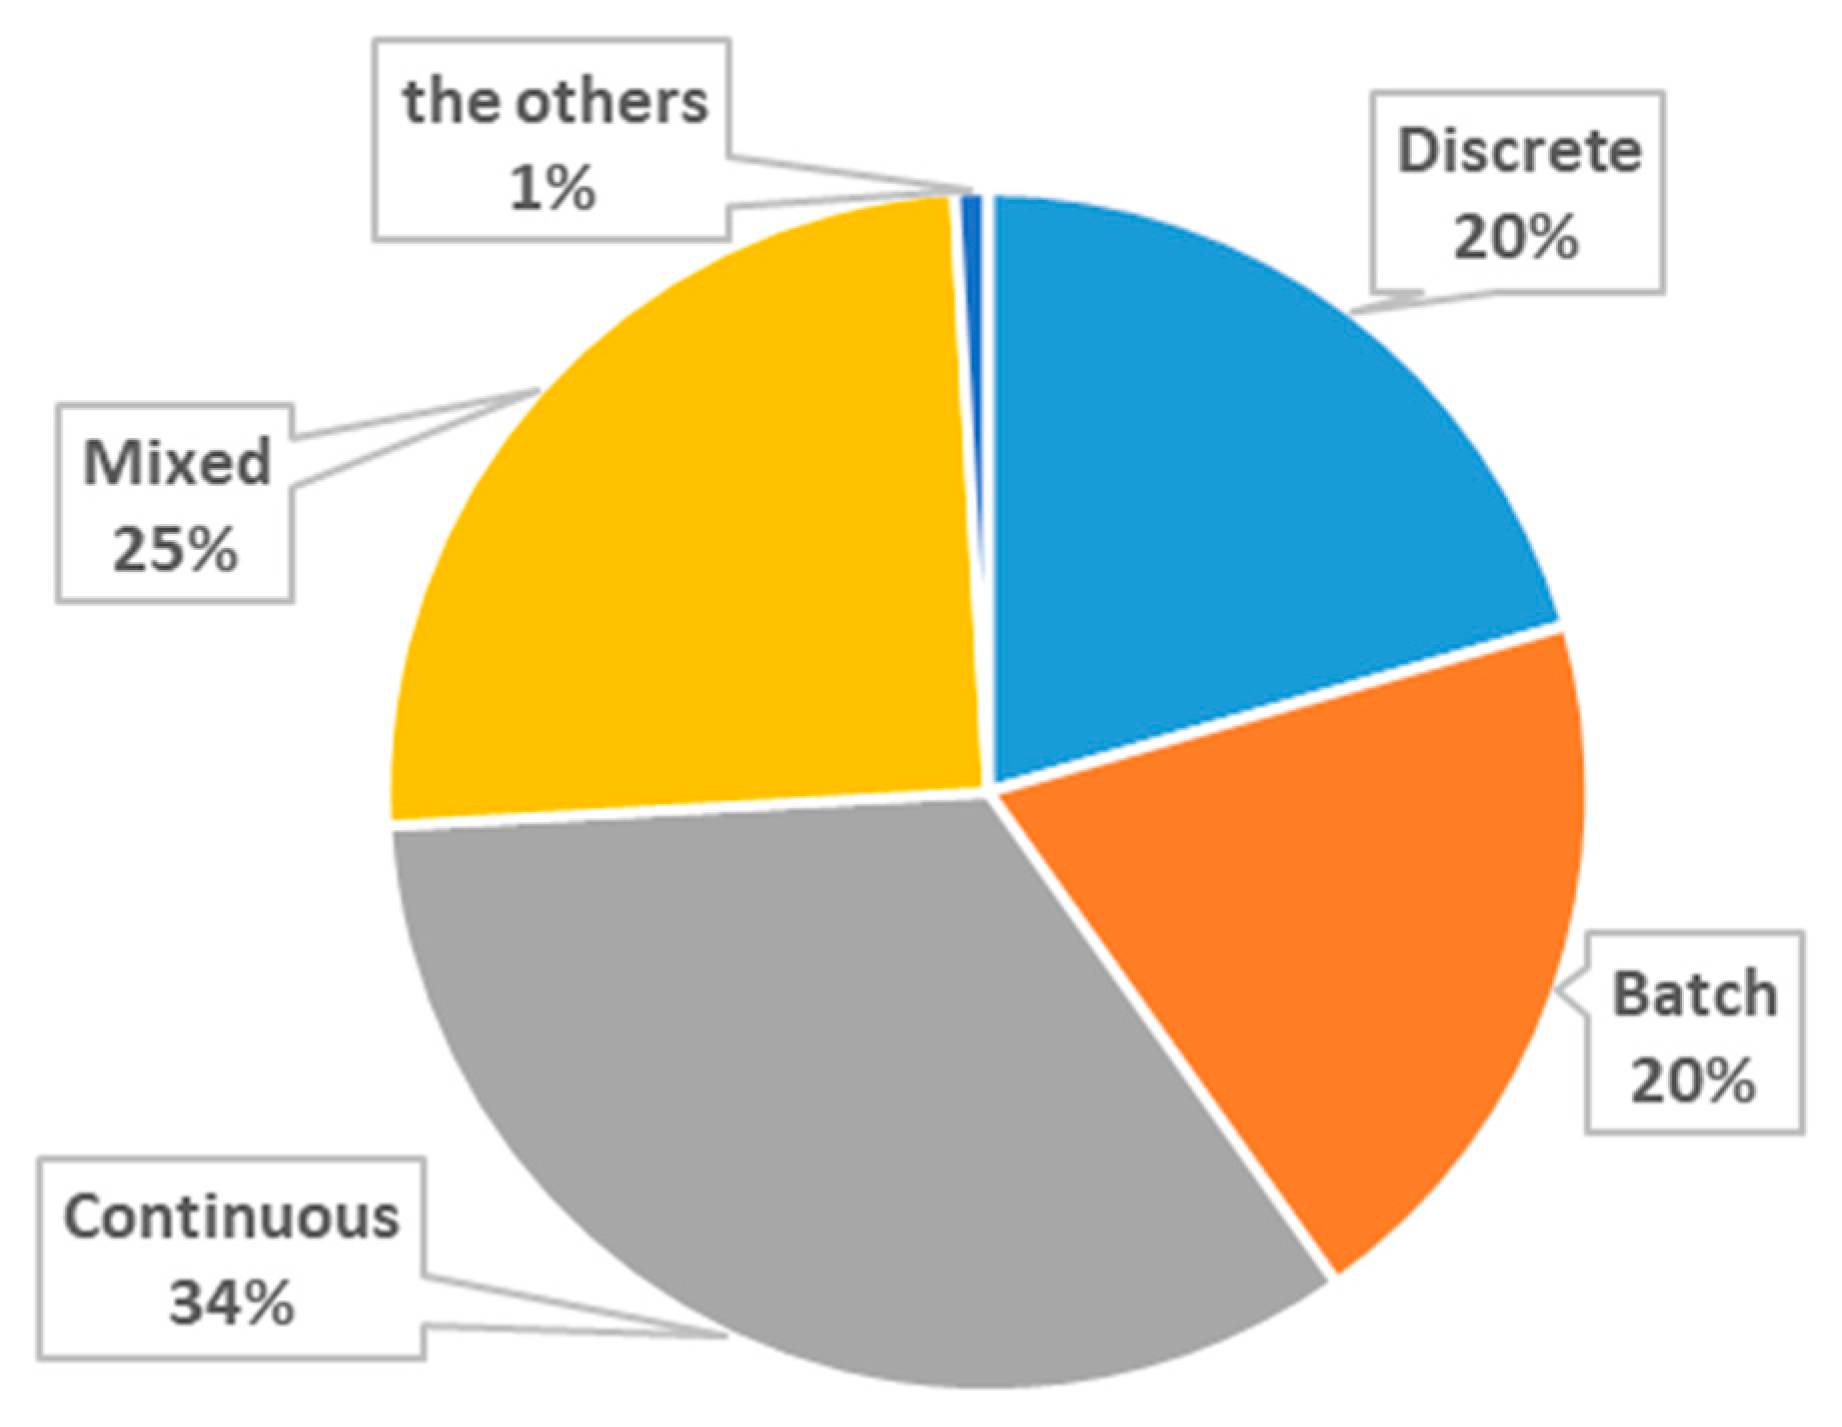
Third, regarding the production methods used by the manufacturing companies we surveyed, most employed continuous processes (34%) and discrete processes (20%) (
Figure 4).
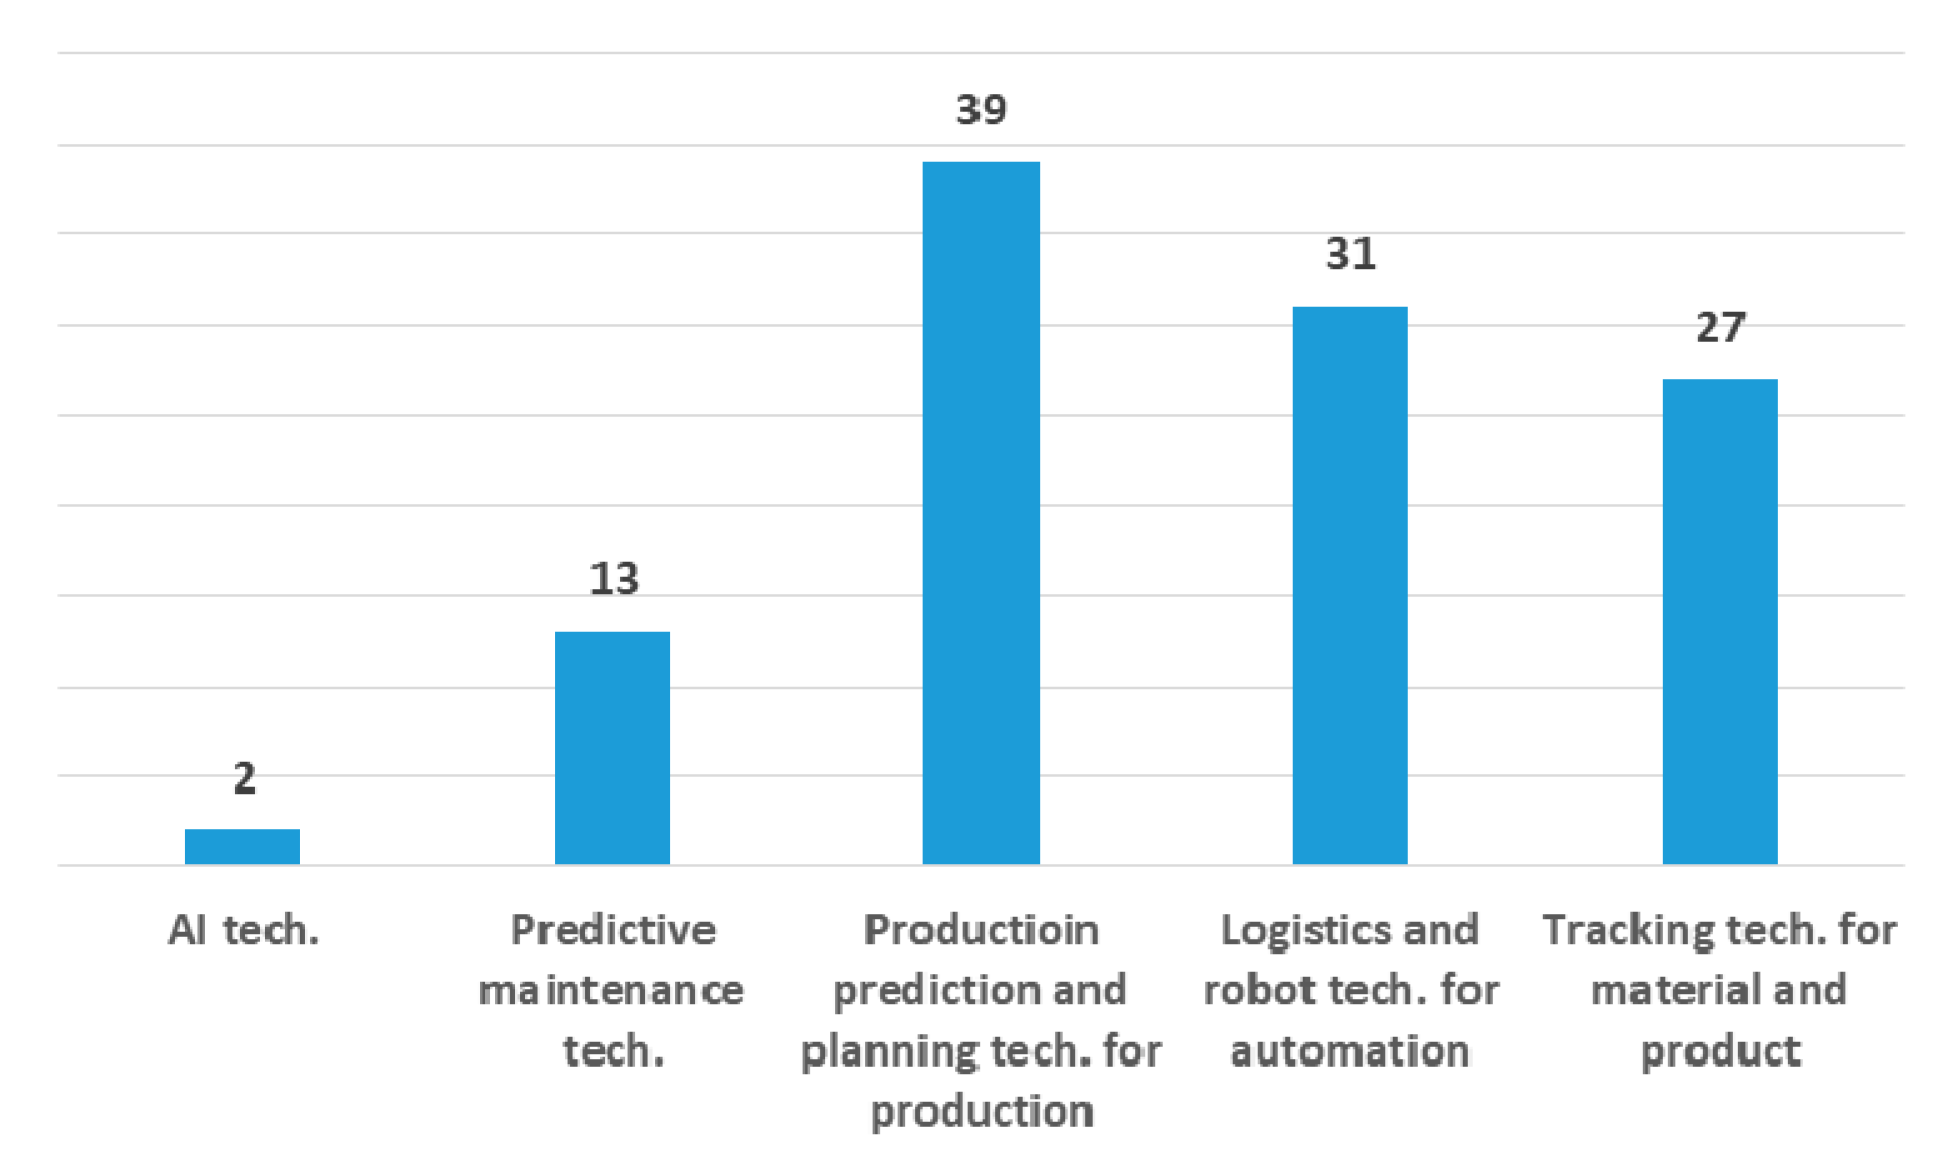
Fourth, according to the survey results of the smart factory technology to be applied within the manufacturing company (
Figure 5), production prediction and production planning technology was the highest (39), followed by robot and automation technology (31). AI technology ranked the lowest; thus, it may be concluded that advanced technologies such as AI are difficult to apply in small and medium-sized manufacturing plants. From these results, we can see that many production management systems such as MES and WMS are introduced and utilized in manufacturing companies that have introduced smart factories. Based on these systems, it can be seen that the smart factory technology related to production planning and material tracking is mainly used.
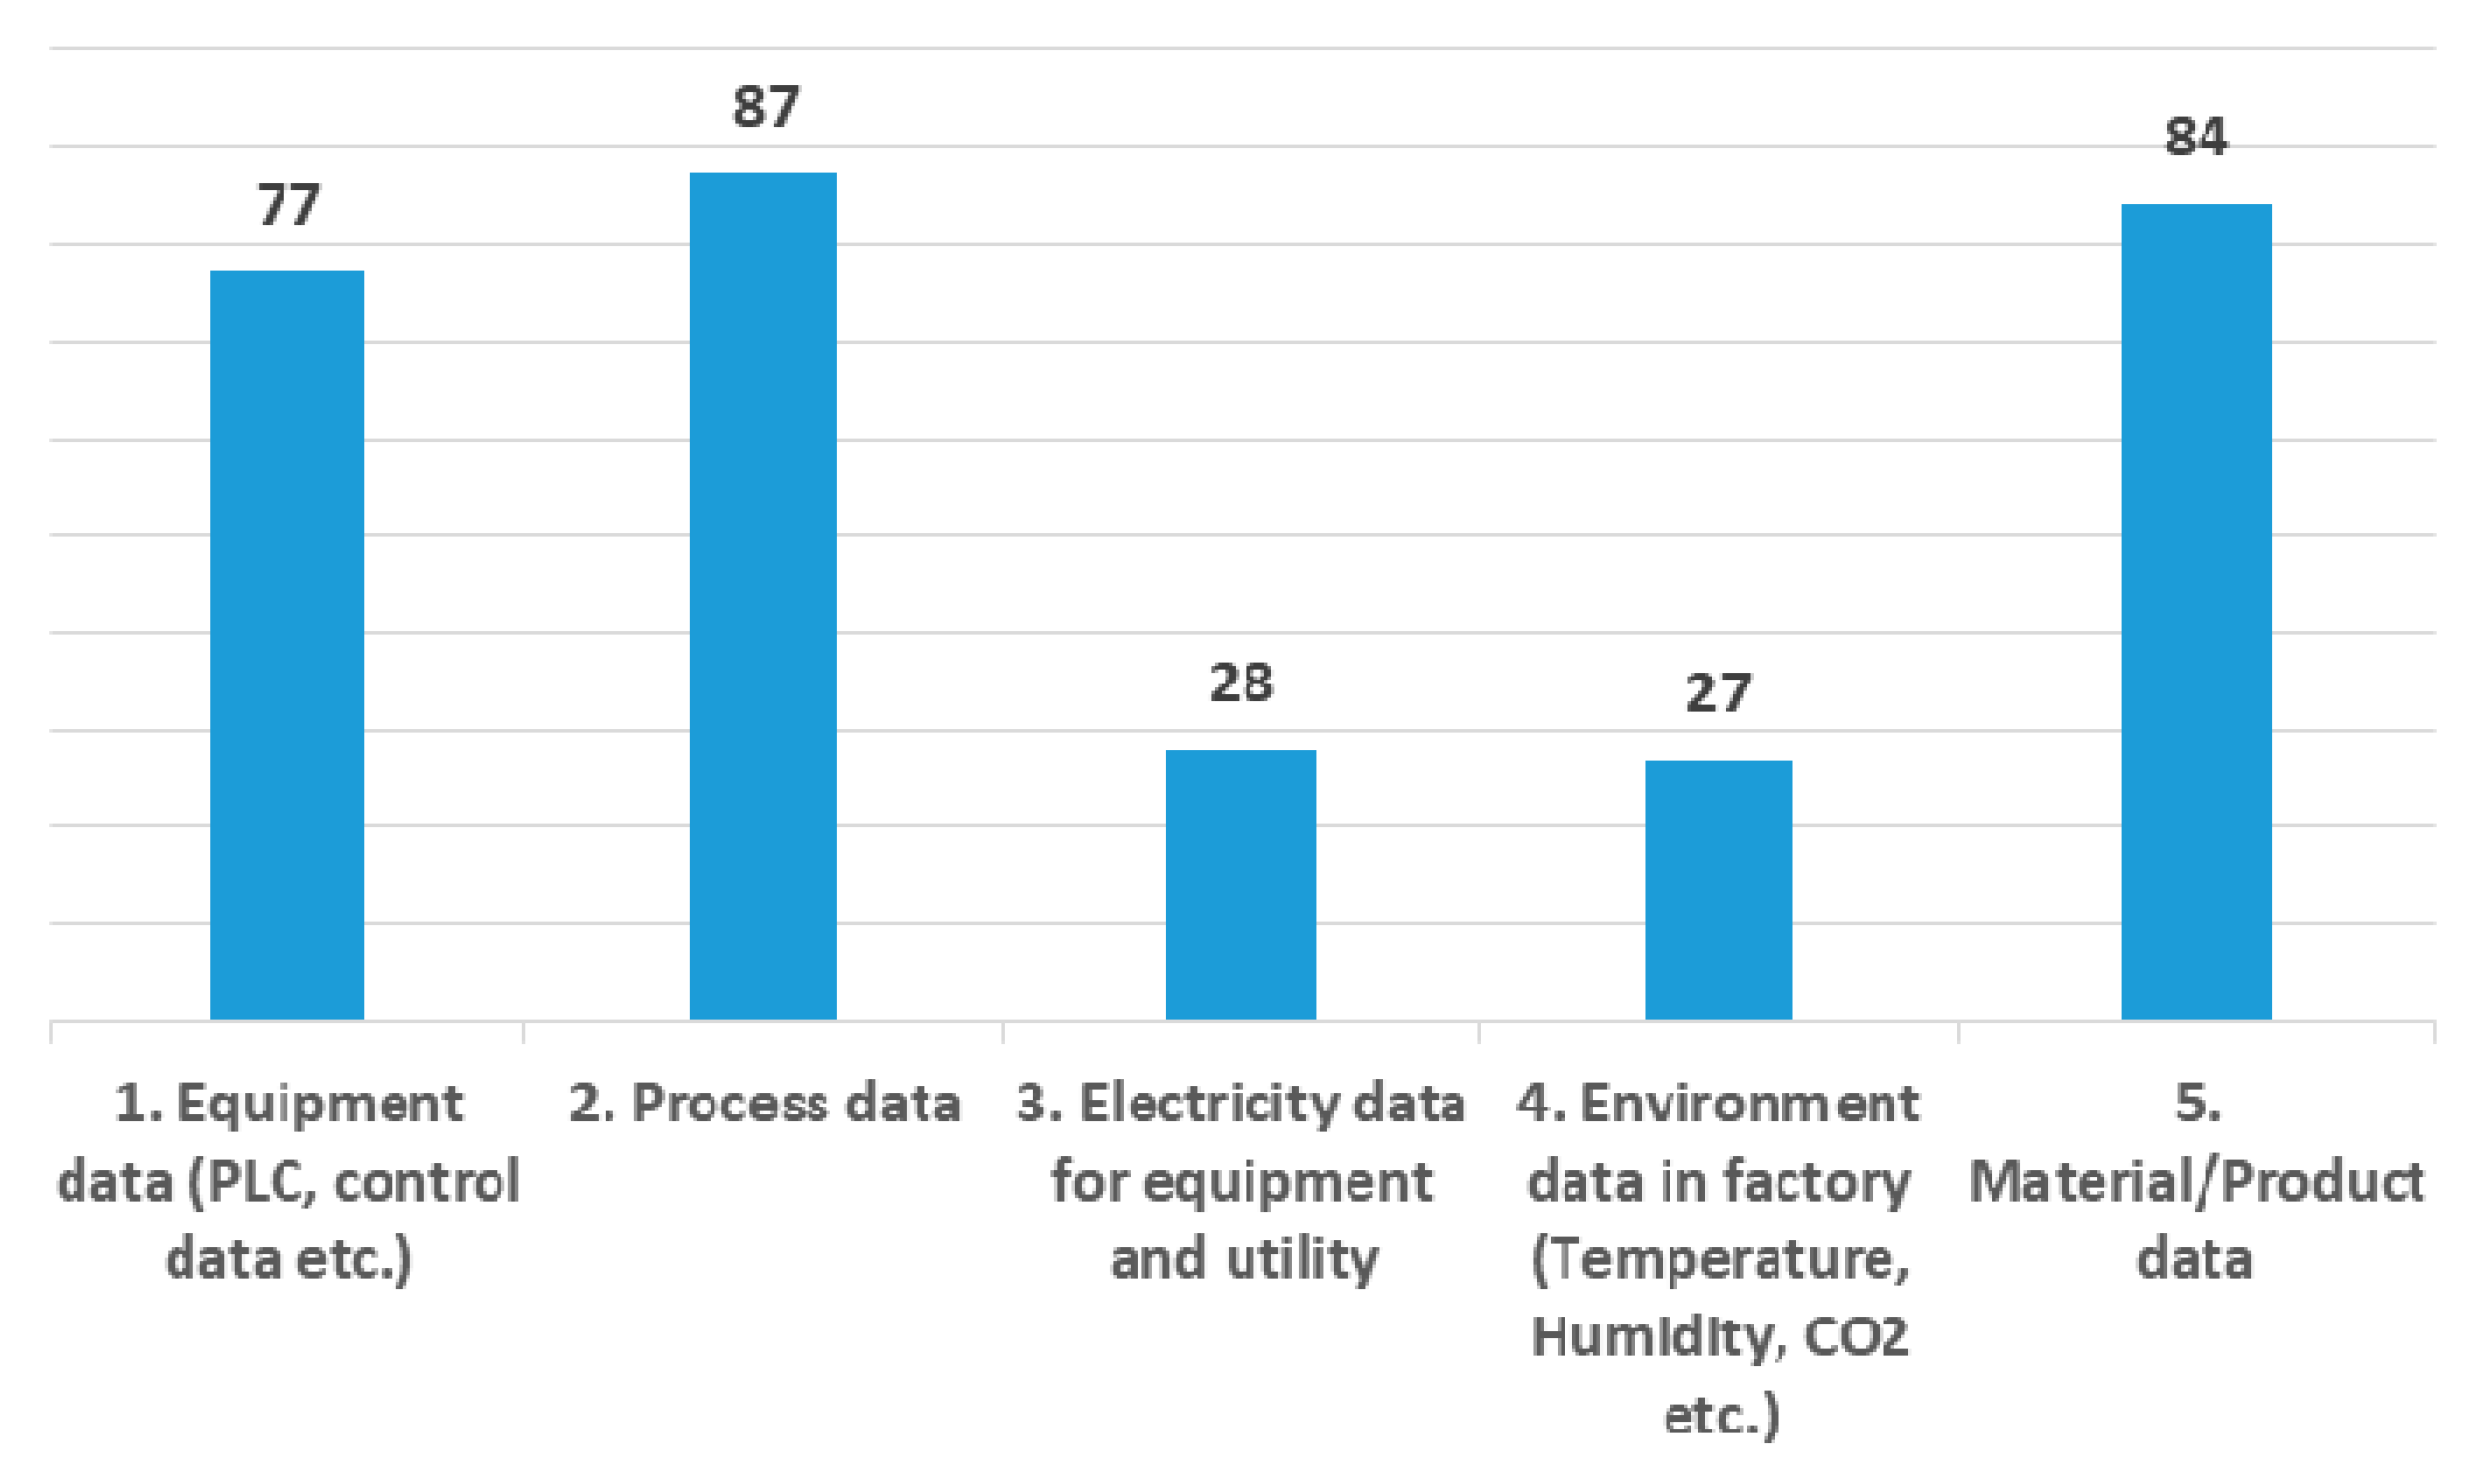
Fifth, among the various manufacturing data generated at the shop floor, the survey results for the type of data that the manufacturing companies want to acquire and manage showed that process data was the most desired, followed by material and product data (
Figure 6). Similarly, manufacturers hoped to manage equipment data, such as PLC data. In fact, manufacturing companies have various types of facilities operating within them; thus, securing and managing facility data is a difficult problem and requires another budget.
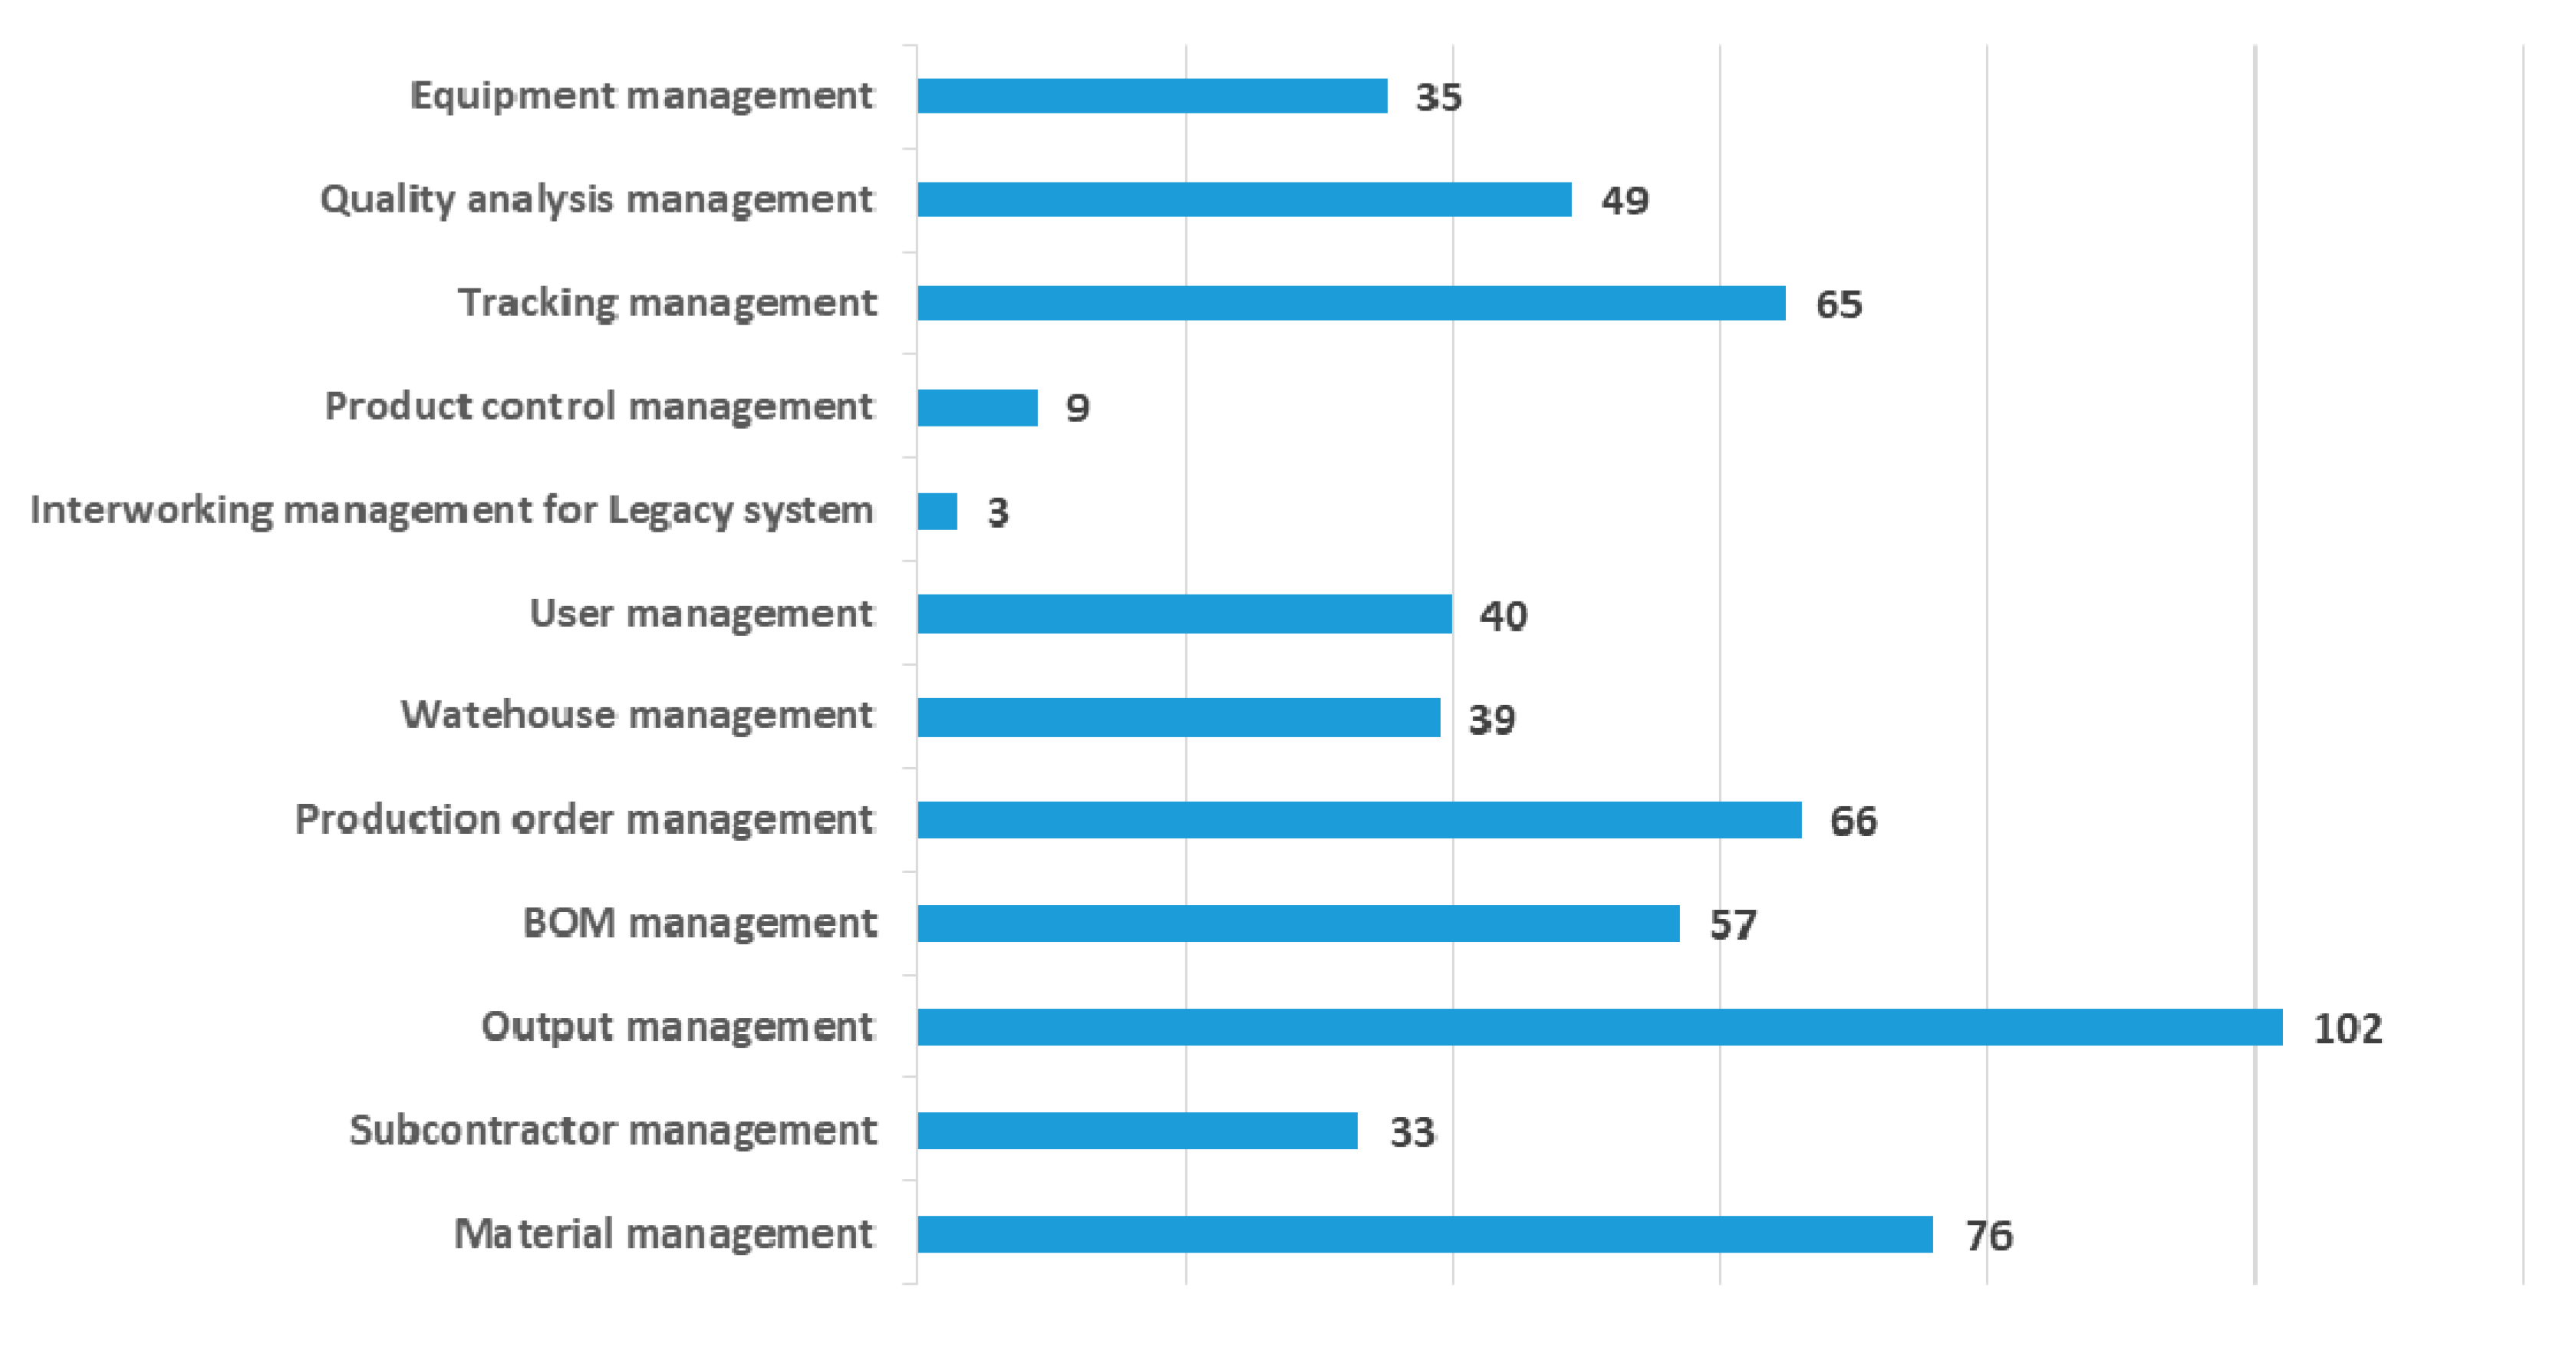
Sixth, regarding the manufacturing process, among the 12 core modules of the MES system, the output management module was the highest (102), followed by the material management module (76), as shown in
Figure 7. Judging from these results, we knew that the final product management is still more important than the manufacturing process in the manufacturing company. Next, the production order management module and tracking module were examined in the third and fourth order, respectively. However, the utilization of the module for integration systems (interworking management for legacy systems), which is an important point when building a smart factory, was found to be extremely low (3).
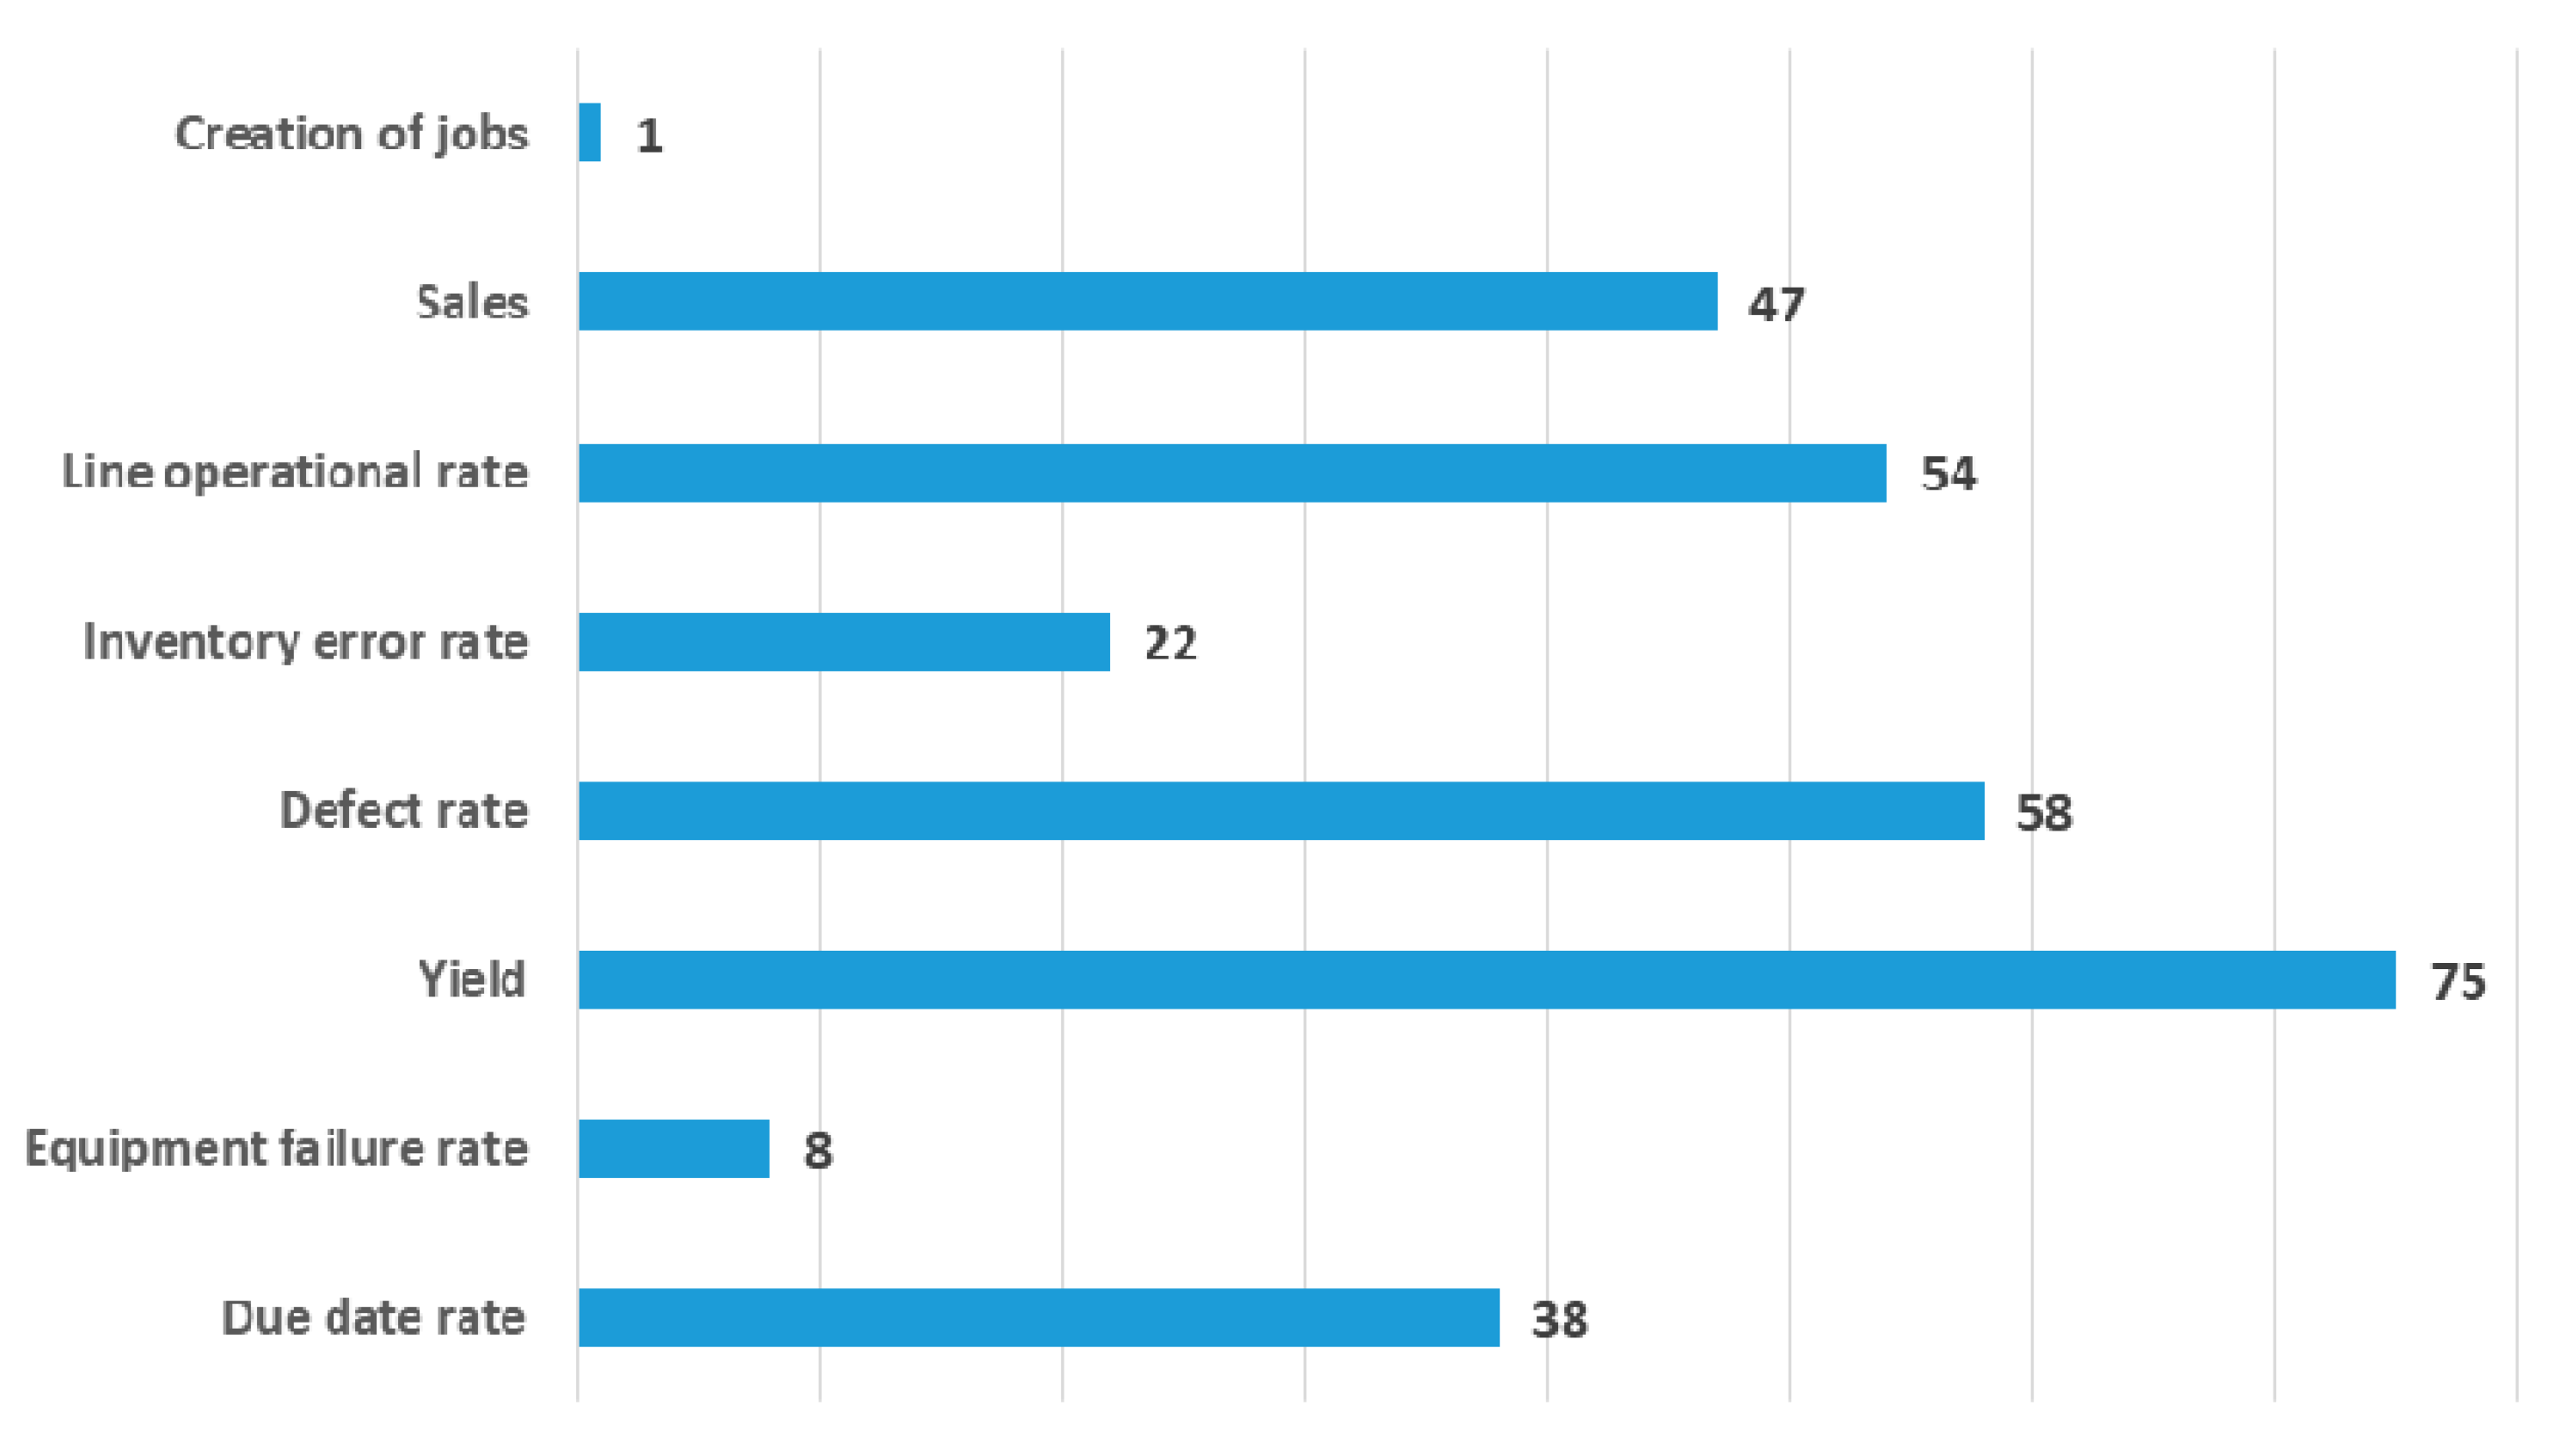
Seventh, according to the results of the survey on the performance indicators for smart factories, the management of yield (75) and defect rate (58) were the most important to the companies (
Figure 8). Line operational rate (54) and sales (47) were also important indicators. On the other hand, job creation indicators related to the introduction of smart factories were low (1). This shows that manufacturing companies’ interest in creating jobs when introducing new technologies is not high.
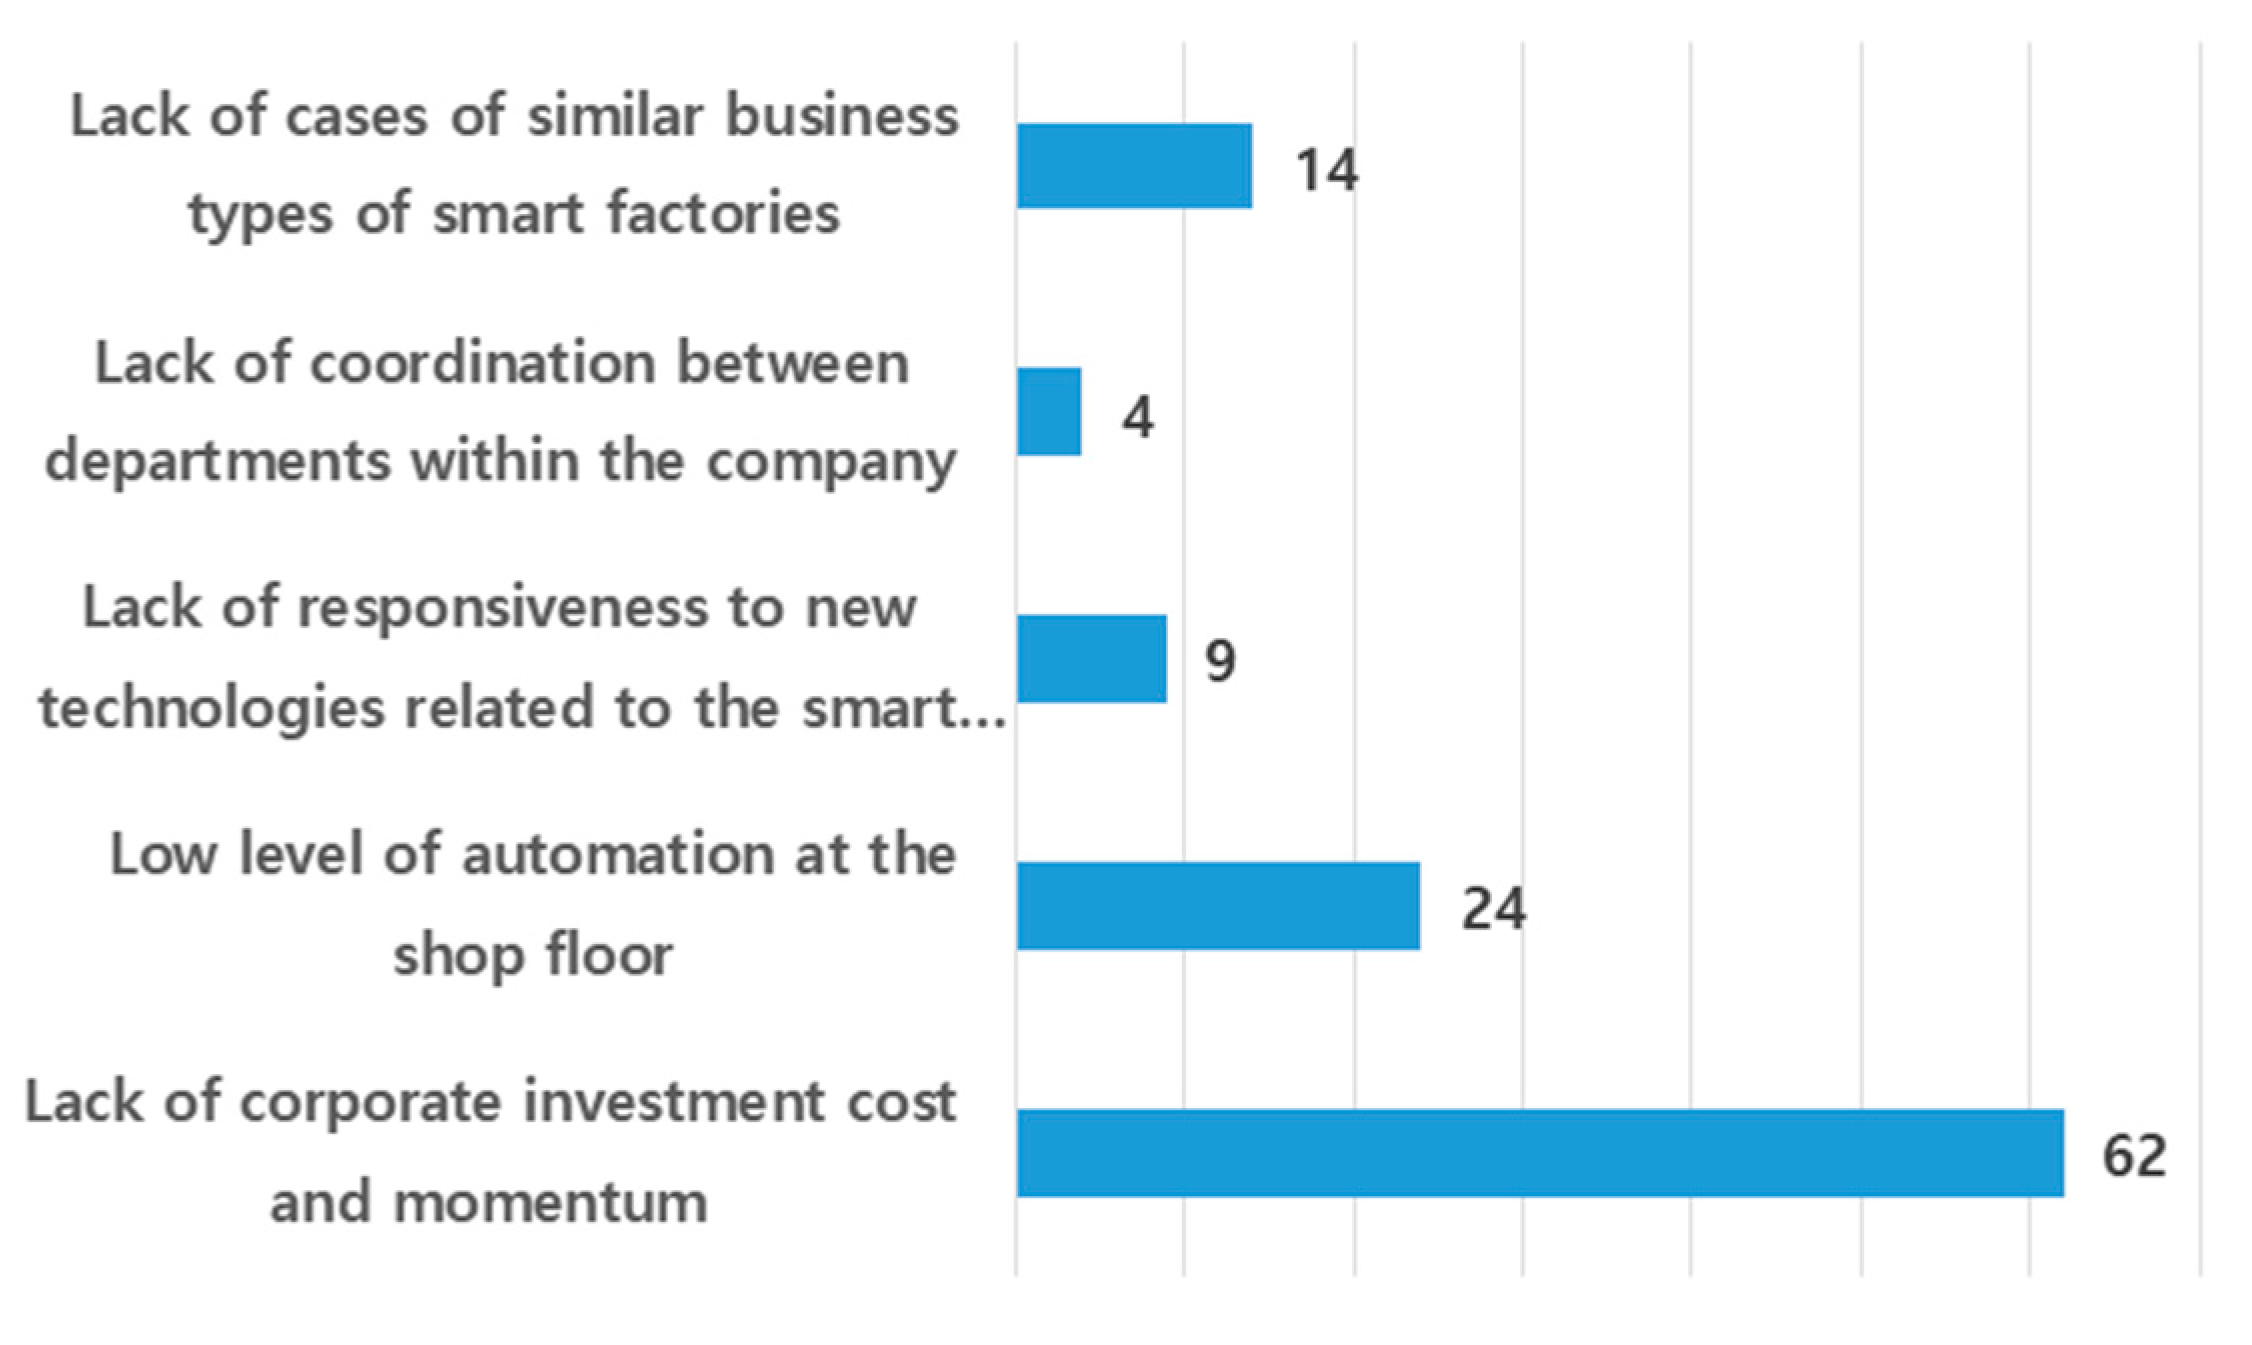
Eighth, according to the results of the survey on the difficulties in promoting smart factories (
Figure 9), the lack of corporate investment cost and momentum was the highest (62), followed by the low level of automation at the shop floor (24). Through this survey, we found that SMEs that want to promote smart factories need application cases in similar industries (14).
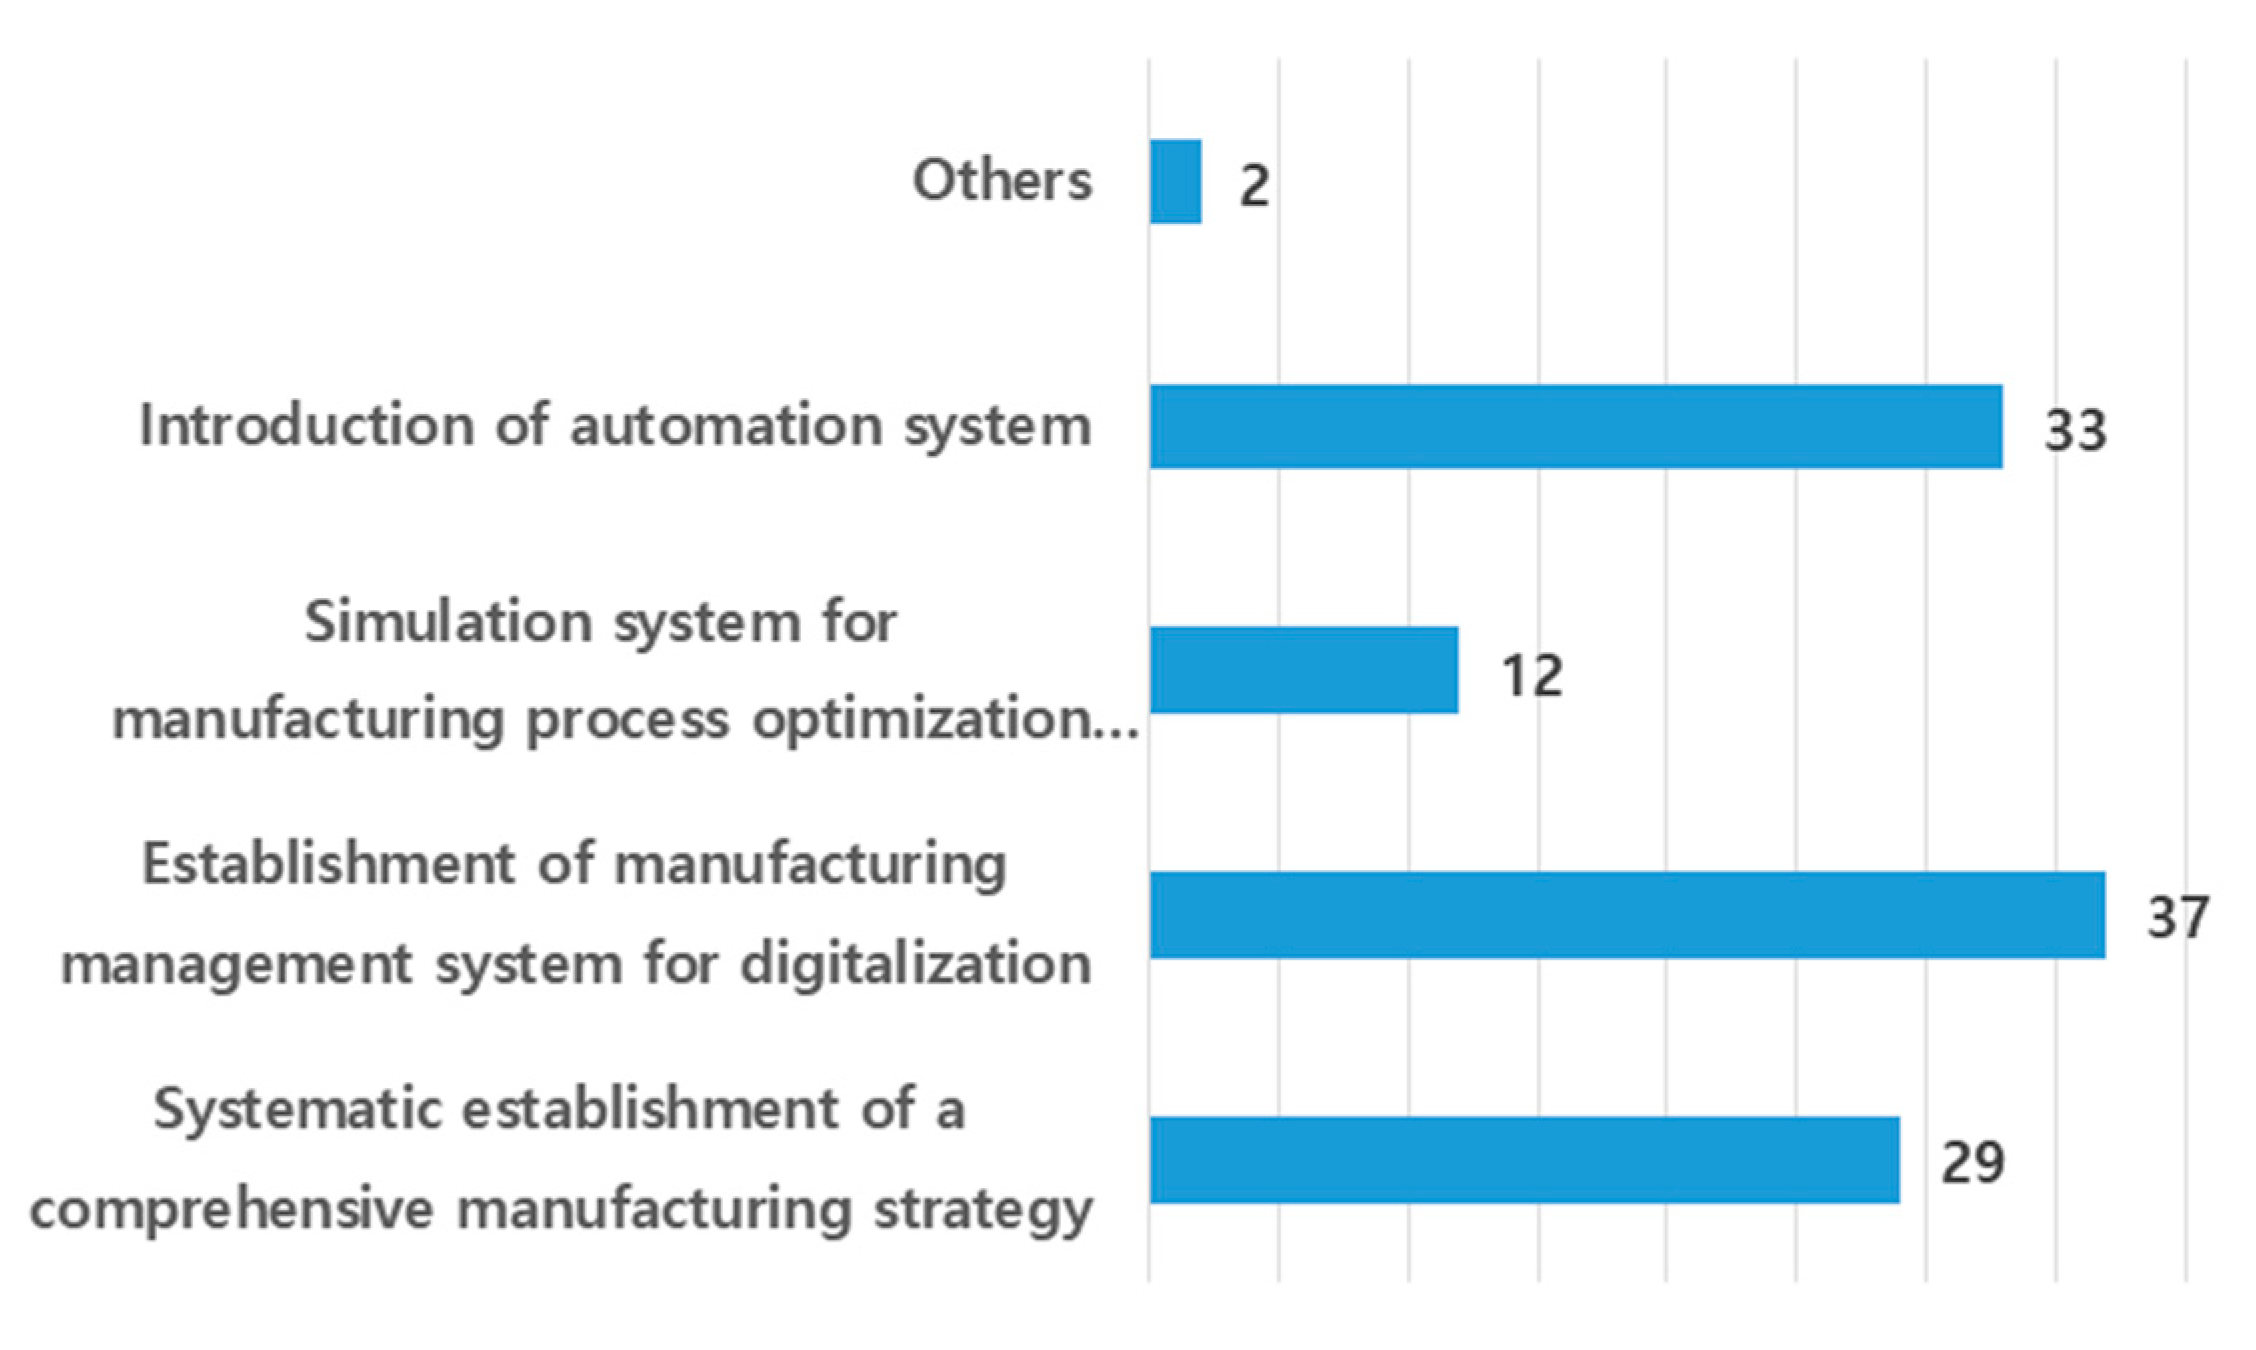
Ninth, according to the most important part when promoting smart factories (
Figure 10), the establishment of manufacturing management system (37) and the introduction of automation system (33) were the highest, and next we found that the establishment of a manufacturing strategy was an equally important part of a manufacturing firm.
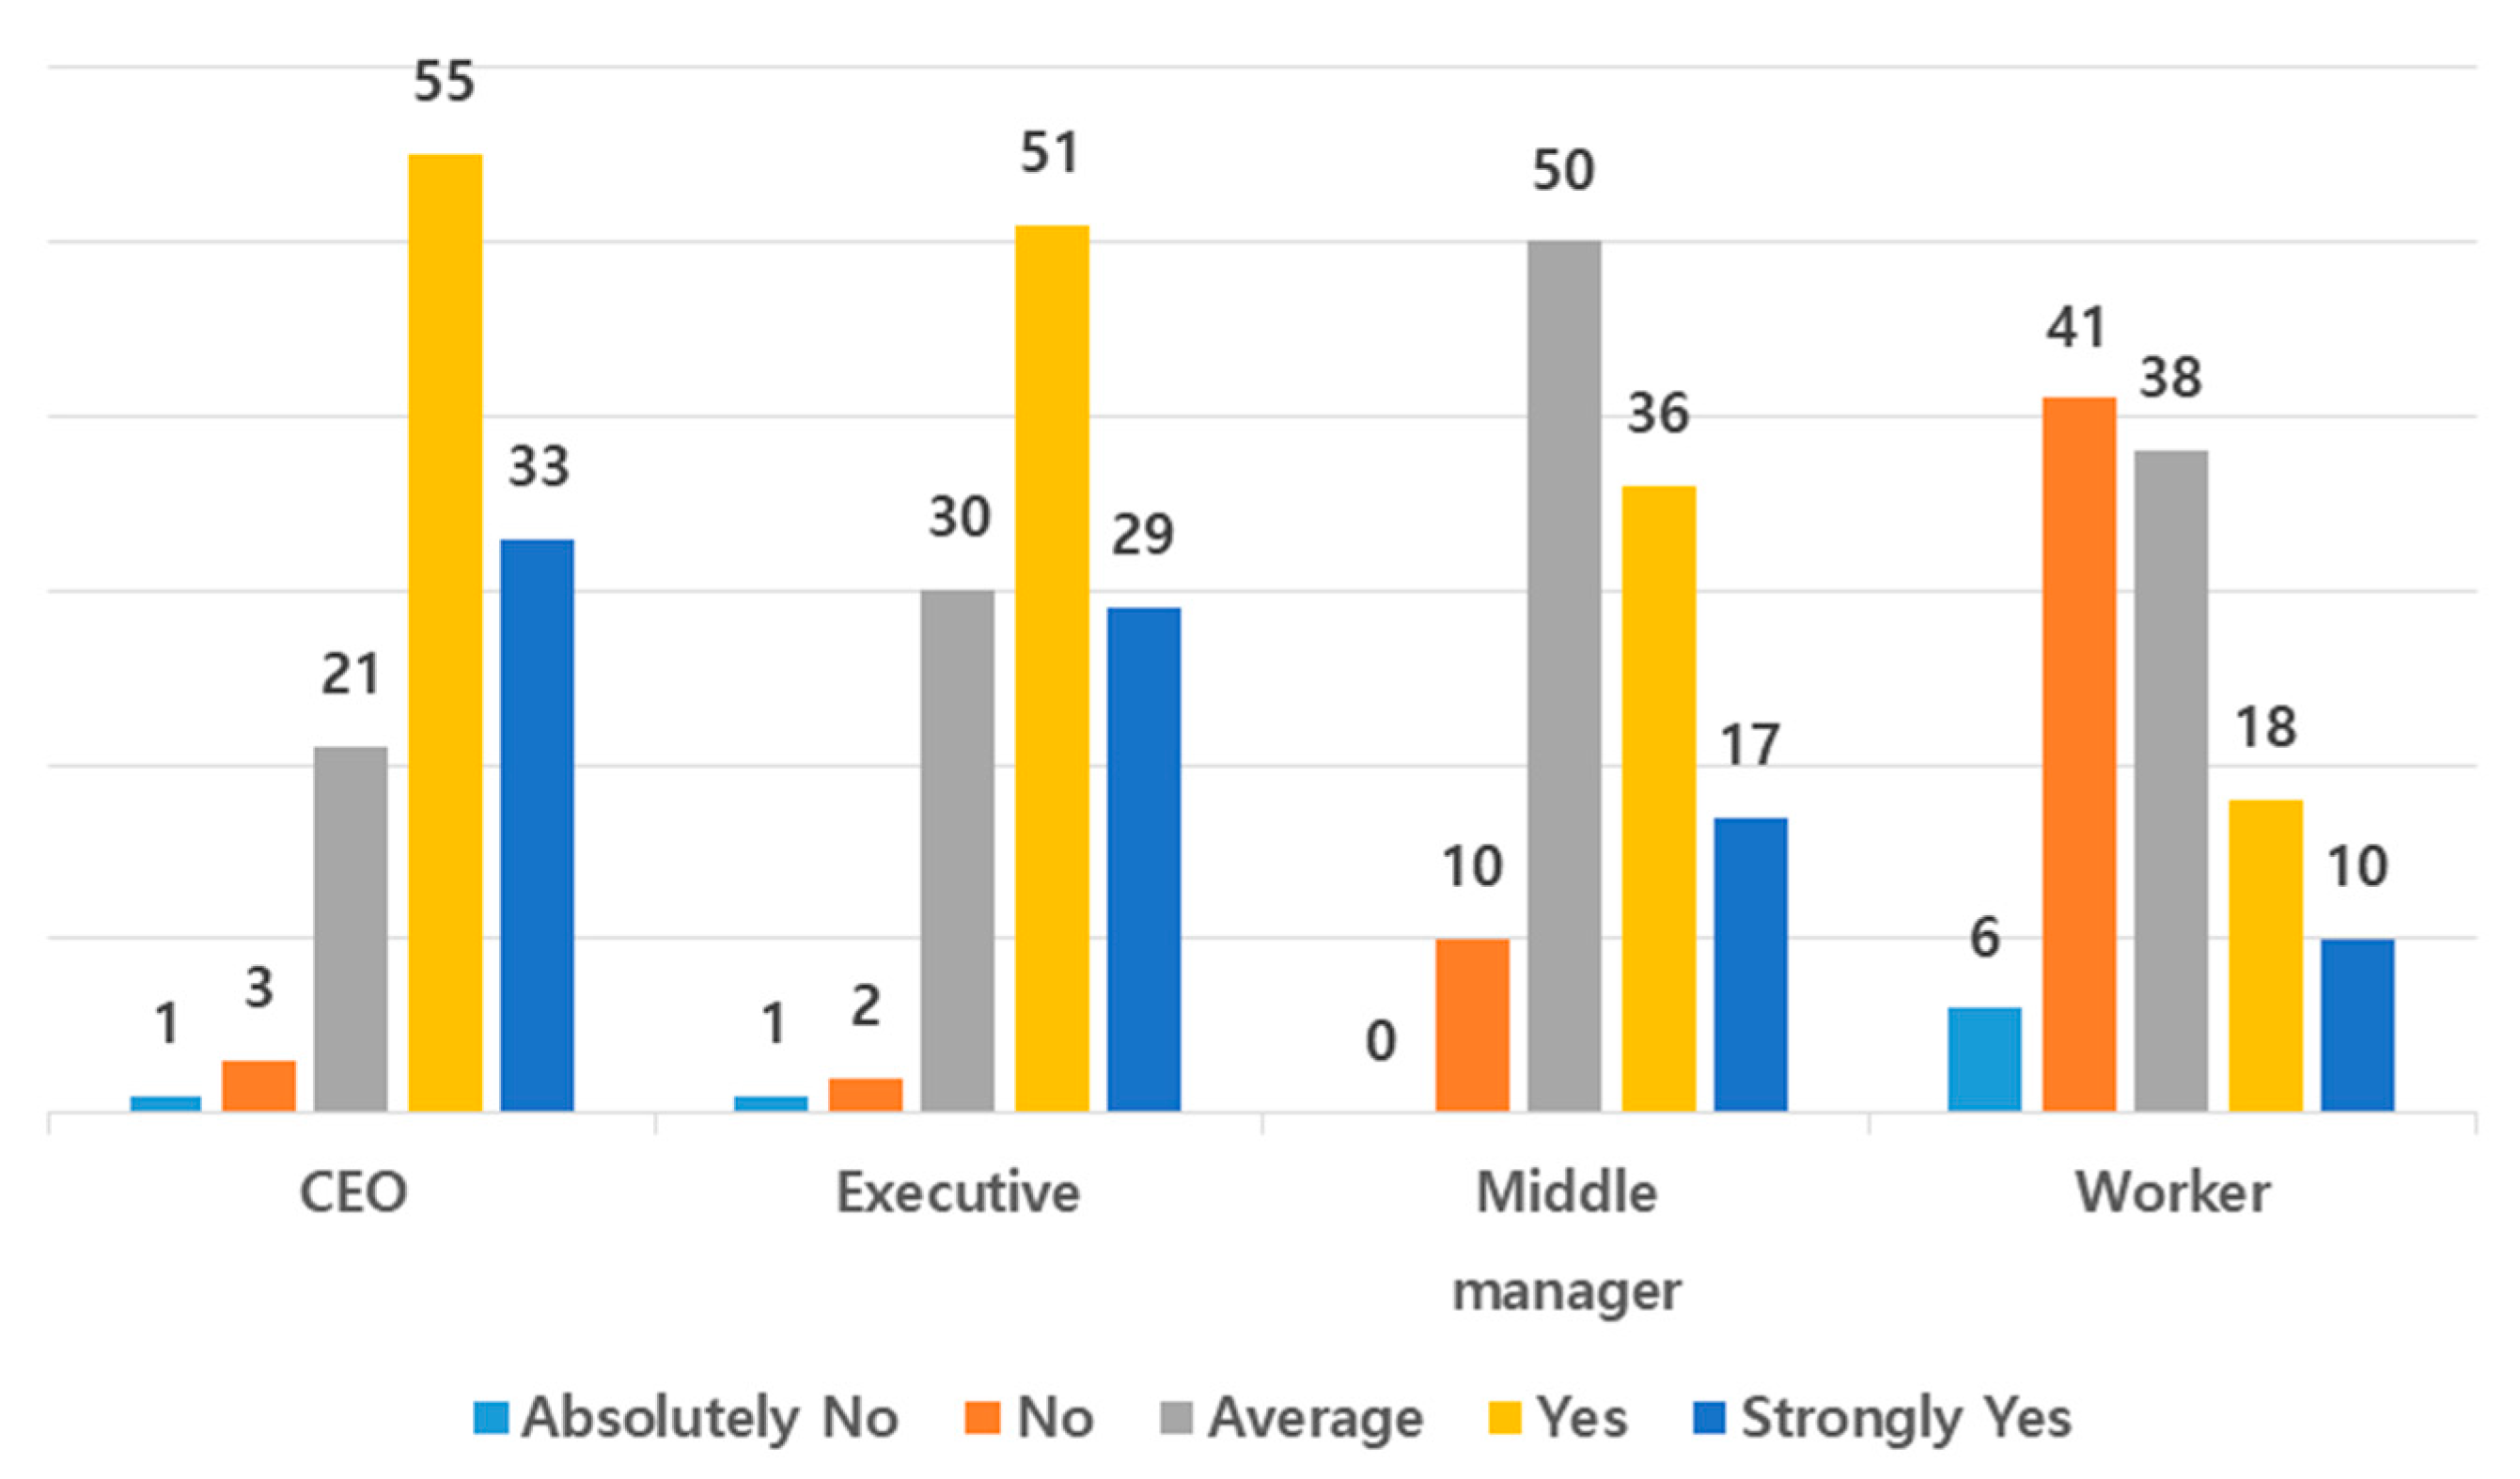
Tenth, according to the organization members’ willingness to promote smart factories (
Figure 11), we can see that the CEO and executive have an active will to promote the smart factory, but middle managers and workers have a relatively passive will. In addition, we found that when a smart factory is introduced into a manufacturing company, it is necessary to consider the difficult points that are compatible with both job reduction and new job creation.
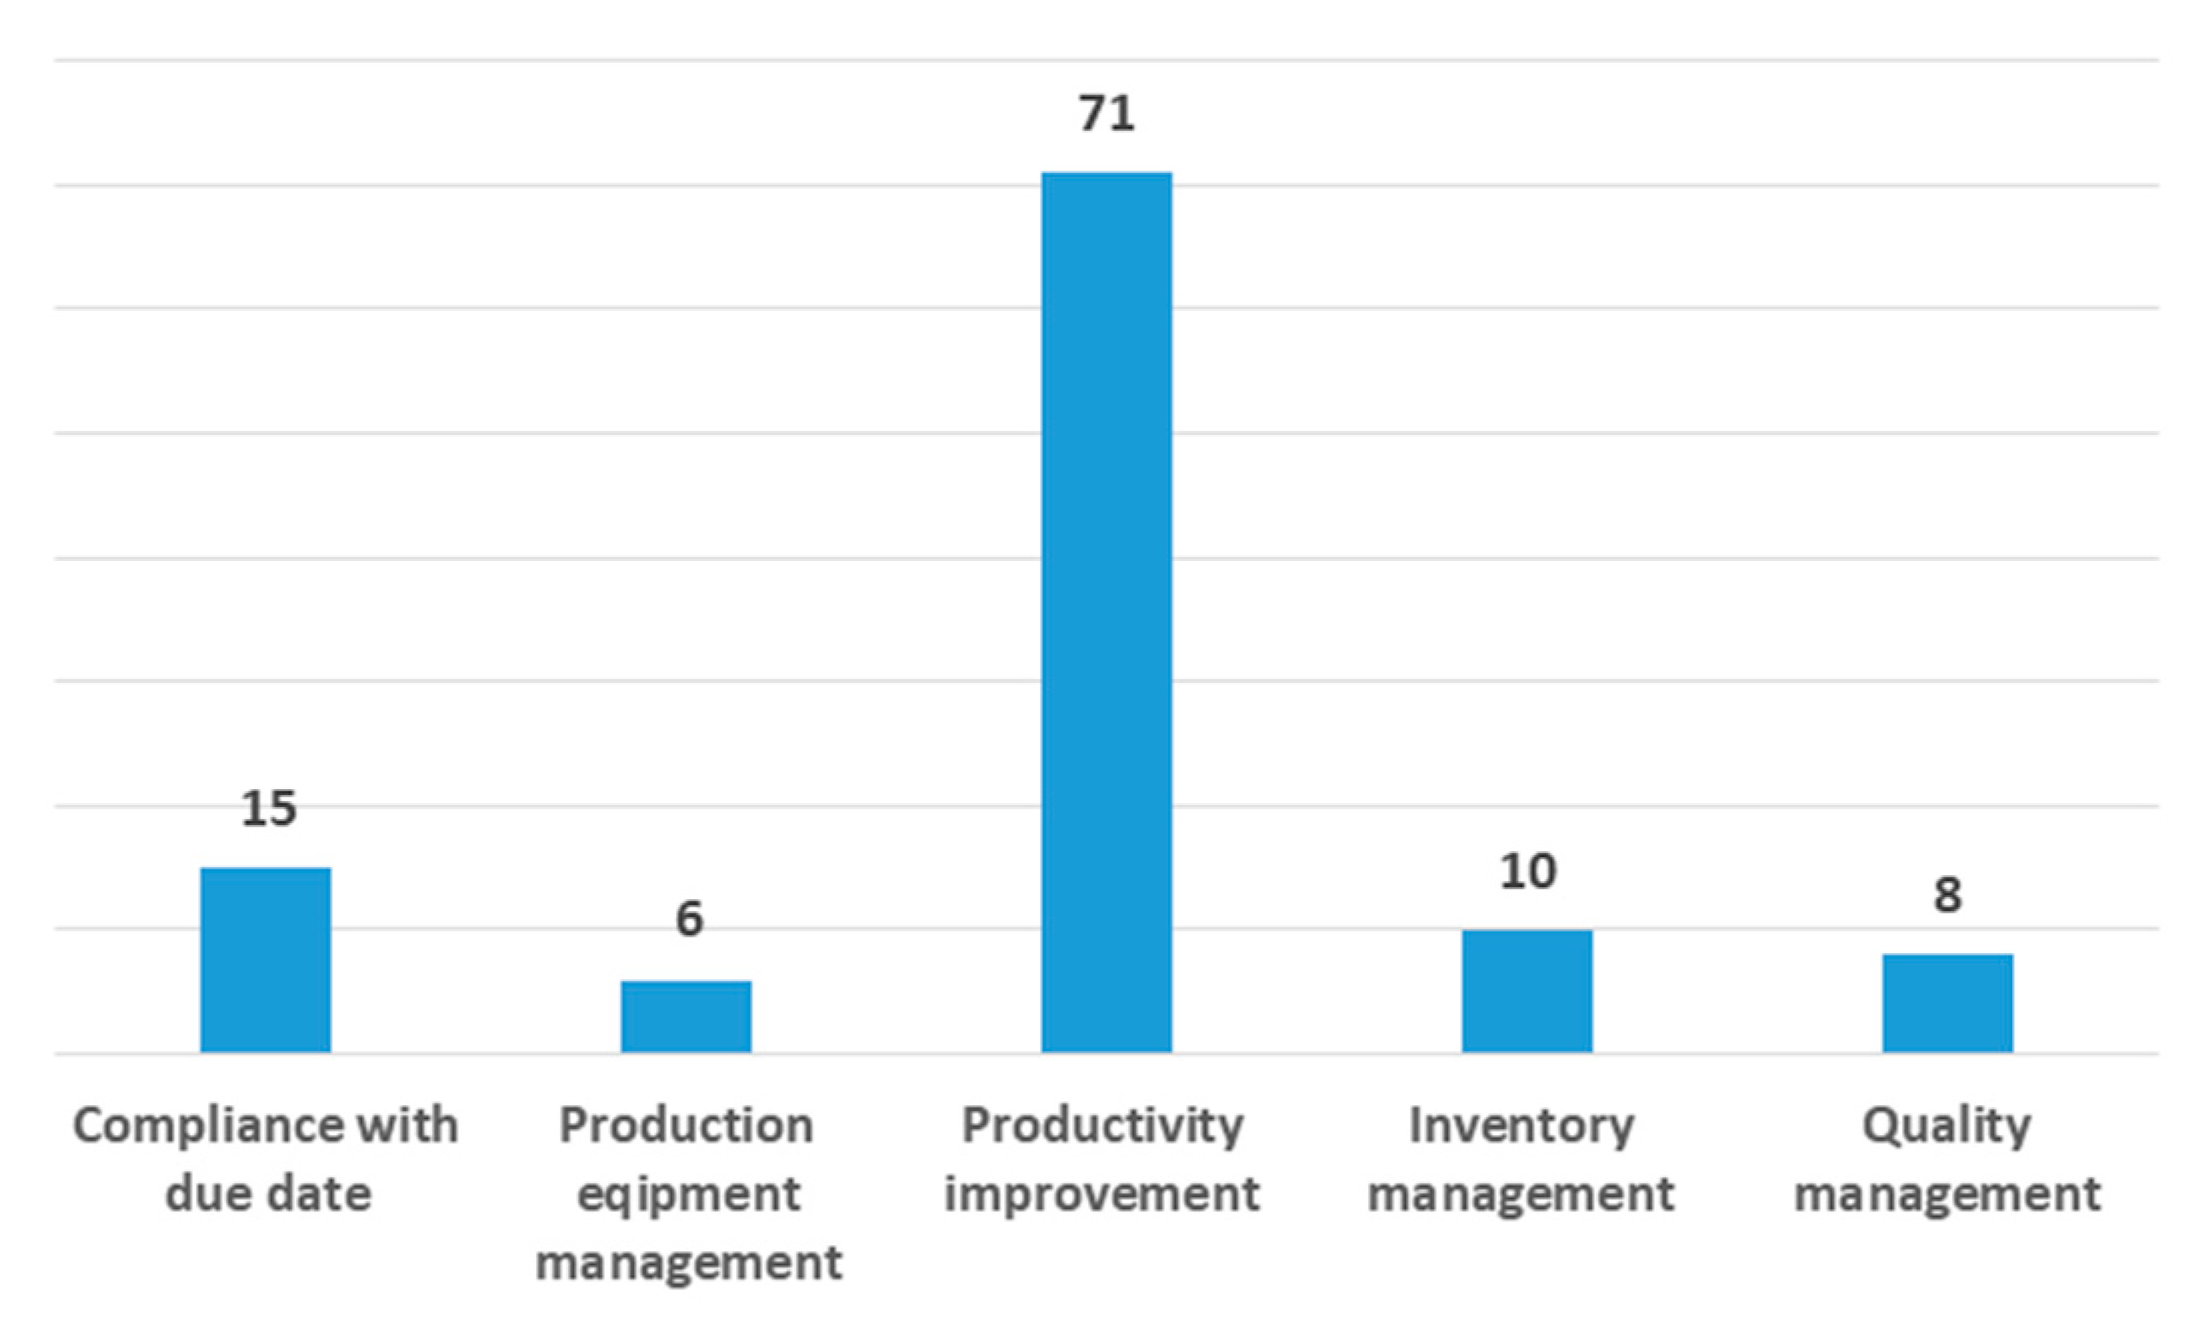
Lastly, according to the purpose of promoting smart factories (
Figure 12), the productivity improvement was the highest (62). From these results, we can see that the important purpose of promoting the smart factory for SMEs in Korea is not to develop new products and discover new business models, but rather to improve the productivity considering quality improvement, inventory reduction, facility efficiency improvement, and compliance with due date.
4. Validation of Research Model
4.1. Factor Analysis
In this study, we used factor analysis as a method of testing. The extraction method used was principal component analysis (PCA) and VARIMAX rotation. Determining the number of factors in a variable only extracts factors with an eigenvalue greater than 1 and excludes items with an item loading value less than 0.4.
The KMO value was found to be close to 0.6, a criterion for factor analysis (0.587), and the significance probability of Bartlett’s test was 0.000, which is less than 0.05. As a result, we continued our factor analysis (
Table 4).
The extraction value from the results of the communalities analysis is the ratio explained by the factors derived from the factor analysis. Generally, it can be said that the extraction value is well over 0.5. We extracted the values of the ms_q3 and ms_q4 variables (as explained in
Table 2) below 0.5, deleted the two variables, and performed factor analysis again (
Table 5).
As mentioned above, after the deletion of the two variables (ms_q3, ms_q4), the ratio of all the variables was derived and found to be higher than 0.5 (
Table 6). The results of the rotation sums of squared loadings show that the five factors of the manufacturing strategy are grouped into two components. In addition, the five factors have a 66.4% explanatory power for the manufacturing strategy. From the rotated component matrix, the final result of the factor analysis, we can see that 5 variables are grouped into 2 components. The factor loadings of all five variables were derived above 0.5, which is considered a valid variable. We can see that the variables ms_q7, ms_q6, and ms_q5 and variables ms_q2 and ms_q1 are bundled into their respective components (
Table 7).
In the case of the manufacturing organization construct, we went through a factor analysis process. As a result of the analysis, we deleted mo_q8, mo_q13, mo_q14, mo_q15, and the remaining seven variables were grouped into mo_q10, mo_q11, mo_q9_1, mo_q12, mo_q9_2, and mo_q9_4, mo_q9_3.
In the case of manufacturing technology, we also performed a factor analysis process as well. As a result, 19 variables were grouped into four groups. The first group consisted of mt_22_13, mt_22_11, mt_22_14, mt_22_10, mt_22_12, mt_22_9, mt_22_5, mt_22_8, and mt_22_15 variables, and the second group consisted of mt_22_4, mt_22_7, mt_22_6, mt_22_3, and mt_22_2 variables. The third group consisted of mt_19, mt_21, mt_17, and mt_20, and the fourth group shows that the mt_16 variable is grouped into the last group.
4.2. Reliability Analysis
Reliability analysis determines the degree of trust through the derived Cronbach’s value. In general, if the Cronbach’s value is less than 0.6, it is determined that the reliability is low and the variable purification should be performed again. We conducted a reliability analysis and finally obtained results that satisfied the value of Cronbach’s value (
Table 8). Finally, we refined the research model with 73 questions into 53 questions after factor analysis and reliability analysis. As a result, we derived a final research model, as shown in
Figure 13.
4.3. Correlations
We conducted a correlation analysis to analyze the relevance between 16 newly derived variables based on the final research model. According to the correlation analysis results, in particular, the “budget” (82) and the “advanced I4.0 technology” (91) factors are lower than the other factors. These results show that SMEs in Korea still have a lot of difficulty in budgeting for smart manufacturing. Recently, Industry 4.0-related technologies such as IoT and AI have been applied to manufacturing companies; however, SMEs are not currently able to adopt and utilize them.
4.4. One-Way ANOVA
We conducted a one-way ANOVA to determine whether there were differences between variables by company size. According to the analysis results (presented in
Table 9), there was an average difference in budget input between small companies and mid-sized companies, and an average difference in data and network infrastructure between small companies and SMEs. In addition, there was an average difference in the level of master data management between small companies, SMEs, and mid-sized companies. As a result, the importance of providing data and network infrastructure, as well as master data management, to relatively weak small companies is inferred. In the case of business type, production type, order method, and production type, it can be judged that there is no average difference between groups.
5. Conclusions
Recently, various types of national projects are being promoted in Germany and USA to secure technological competitiveness in Industry 4.0 and smart factory fields. In particular, the Korean government has promoted a smart factory project by dividing the level of smartization from level 1 to level 5 to smartize the manufacturing companies. In general, in order to apply technologies such as MES, ERP, AI, and IoT to manufacturing companies, an ISP (information strategy planning) process is performed to accurately analyze the current state of the target companies. In order to efficiently perform such ISP process, an evaluation model for accurately assessing the level of smartization of the target company should be applied.
In this paper, we analyzed the statuses of smart factories in Korea through an empirical study. First, we analyzed the current statuses of 113 SME manufacturing companies that established smart factories in Korea from five perspectives: manufacturing strategy, organization, technology, process, and performance. Second, we derived the first framework for diagnosing and evaluating the smart factory level and the research model through factor analysis and reliability analysis. Finally, based on the derived research model, we derived the problems that SMEs need to solve urgently through correlation analysis and ANOVA analysis.
In conclusion, (1) we derived an evaluation framework including five evaluation areas and 73 questionnaires through related research. (2) Through a survey conducted on 113 companies that have introduced smart factories, we analyzed the general status of companies that have introduced smart factories. (3) Next, we verified the validity and reliability of the proposed research model through factor analysis and reliability analysis. (4) Through these processes, we reduced to 53 questionnaires, and finally reorganized the research model including 16 variables.
Based on these findings, we will continue to advance the research model through continuous surveys and develop a maturity model for smart factory level diagnosis.


