1. Introduction
In recent years, interactive design devices have been integrated into information technology and artworks; this is known as interactive art. Due to the element of interaction, new media art has become the mainstream for this type of exhibition. Interactive art can be displayed in settings like museums or fine art museums, or can be included in any exhibition presented in certain culture center areas. Digital technology has made an impact on video collages, editing, synthesis procedures and the like, and virtual reality, with the sense of mixing reality having also inspired people in their creations. In the traditional creation-related fields, this interactive art is considered an innovative approach [
1].
From computer art to multimedia art, and then to the developments of digital art and so-called new media art, these applications can be found not only in art exhibitions, but also in science education and even in daily life, as well as in the field of design. Interactive art could also be considered as digital art. With the feature of interaction, the factor of an engaged user is a part of this type of artwork, which is different from traditional art, where the artwork can only be seen, but not otherwise interacted with. However, the core value of interactive art would be that user experiences are created by instant interaction from the user experience.
Providing innovative interactions that can entertain the user is the crucial aim of performances of interactive technology and art integration. ‘Interaction’ is a process of communication between the work and the user. Regarding the interaction mode, the users’ cognition, as well as the mental aspect, should be the main focus. In the interactive art process, one by one, different messages are sent back and forth, where the audience becoming a user who can control the work. Interaction should have a positive impact on the performance of a work, as an amazing and joyful experience. That is the core value of interactive art is the interactive entertainment. As ‘Megatrends’ author John Naisbitt once suggested, secondary aims may be to sell products, inspire employers, or find more customers. However, first and foremost, interactive art should always be interesting entertainment [
2]. In post-modern society, entertainment has come to be considered a necessary element in daily life.
In the first phase, this research takes the built-in ‘gyroscope’ motion sensor in cellphones as a tool to send signals via Wi-Fi to a server computer; by measuring the gravity and speed through the cellphone, the user can control the visual performance. By the time the server begins to run the Real-time Sprite Render, the visual effects of the universe space galaxy rotation will be presented as the animation display on the screen of the smart phone.
In the second phase, through the Data Access Protocol, this research accesses the Hsih Shin University library database, and using all information from 2013 to 2015, performs an information visualization. By carrying out the first phase using the universe interactive technology, information on the numerous books in the library, such as the book title and the number of times that a book has been borrowed, can be animated. To be precise, information visualization is an approach that can present library data analysis through interactive art. The main purpose of this is to demonstrate both ‘the interactive entertainment’ and ‘the visualized art’, where they can both be perceived by users who are engaged in the information visualization process.
When users download the cellphone APP client server and activate the program, all the library book information is presented in an animated universe form. Through the interaction between the user and the interactive device, a dynamic word cloud is shown on a huge monitor where the user can perceive beautiful cross-field integrations of library data and the interactive artwork.
Nowadays, library information services are user-oriented. To emphasize the user experience, a user-centered approach broadens the purpose of information services and the views of related tasks. During the process, the user may meet more of their needs and experience deeper emotions, such as feelings that come from enjoyment, entertainment, and attraction [
3]. Since interactions with digital art are typically of value for the users, this research will take the user experience as a crucial point for the creation of entertainment. Thus, in the third phase, by observing the users’ reactions to library information services during the process of the interaction, this research takes the user experience, as well as usability, as a factor to examine for our research hypothesis.
To measure the user experience empirically, this research takes 42 users as the research subjects and emphasizes user feelings, as well as the optimization of the interface design, so as to carry out a user experience parameter analysis. Understanding the visions of the users to recognize their needs is crucial for research on the user experience [
4]; this research takes an evaluation method and heuristic approach design originating from Jakob Nielsen for the usability evaluation [
5]. By taking the user experience (UX) and playfulness as the factors, this research will then explore how the library information service interactive art interface design and its operating mode impact the satisfaction degree of the user, alongside the users’ willingness to engage with the interactive device. Jakob Nielsen’s 10 principles for the heuristic approach to usability evaluation are considered the evaluation standard in the field of academia [
5]. Related overseas theses regarding user experience, interface design research, and user onsite interactive experience creation with interactive devices have also been continuously published.
The purposes of this research is firstly to verify that the interactive art we provide for the library information service meets the user’s acceptance. Secondly, it provides usability-verified models for the cross-domain applications between digital art and data visualization. Before attempting to answer these questions, this paper begins with a brief description of the system architecture of this interactive art in
Section 2. After that, verified the usability for users in empirical way based on the Technology Acceptance Model (TAM) in
Section 3. This is followed by the development of the questionnaire and statistical analysis that was conducted based on the usability theory in
Section 4. Finally, this paper discusses the research results (
Section 5) and concludes the research results for the usability of the interactive artwork applied in the library data analysis.
3. Methodology
3.1. System Design Idea
By operating a client app that has been downloaded to facilitate the interaction, messages are sent via Wi-Fi, by means of a gyroscope controlling speed and gravity, to a computer. By doing so, the stable condition of the animated images will be changed on the monitor and the movement of stars will speed up, as they continue to collide with each other. Therefore, Big Band, the cloud-like galaxy, will cause cosmetic swirling. Three to nine people can randomly join or leave the interaction at the same moment, as shown in
Figure 1. The Wi-Fi system is a mini telecommunications base station. Even if there is no limit on the number of connections, after reaching a certain number of people (more than 10 people), signal transmission congestion will occur, and there may even be problems such as disconnection and failure to connect the server’s IP. To increase the demand for a large number of connections for users, it is necessary to build a Wireless Array to increase the load of the number of connections. In the exhibition space of the library, it is suitable for less than 10 people that can move freely. Therefore, we only built one Wi-Fi receiver, instead of building a wireless array.
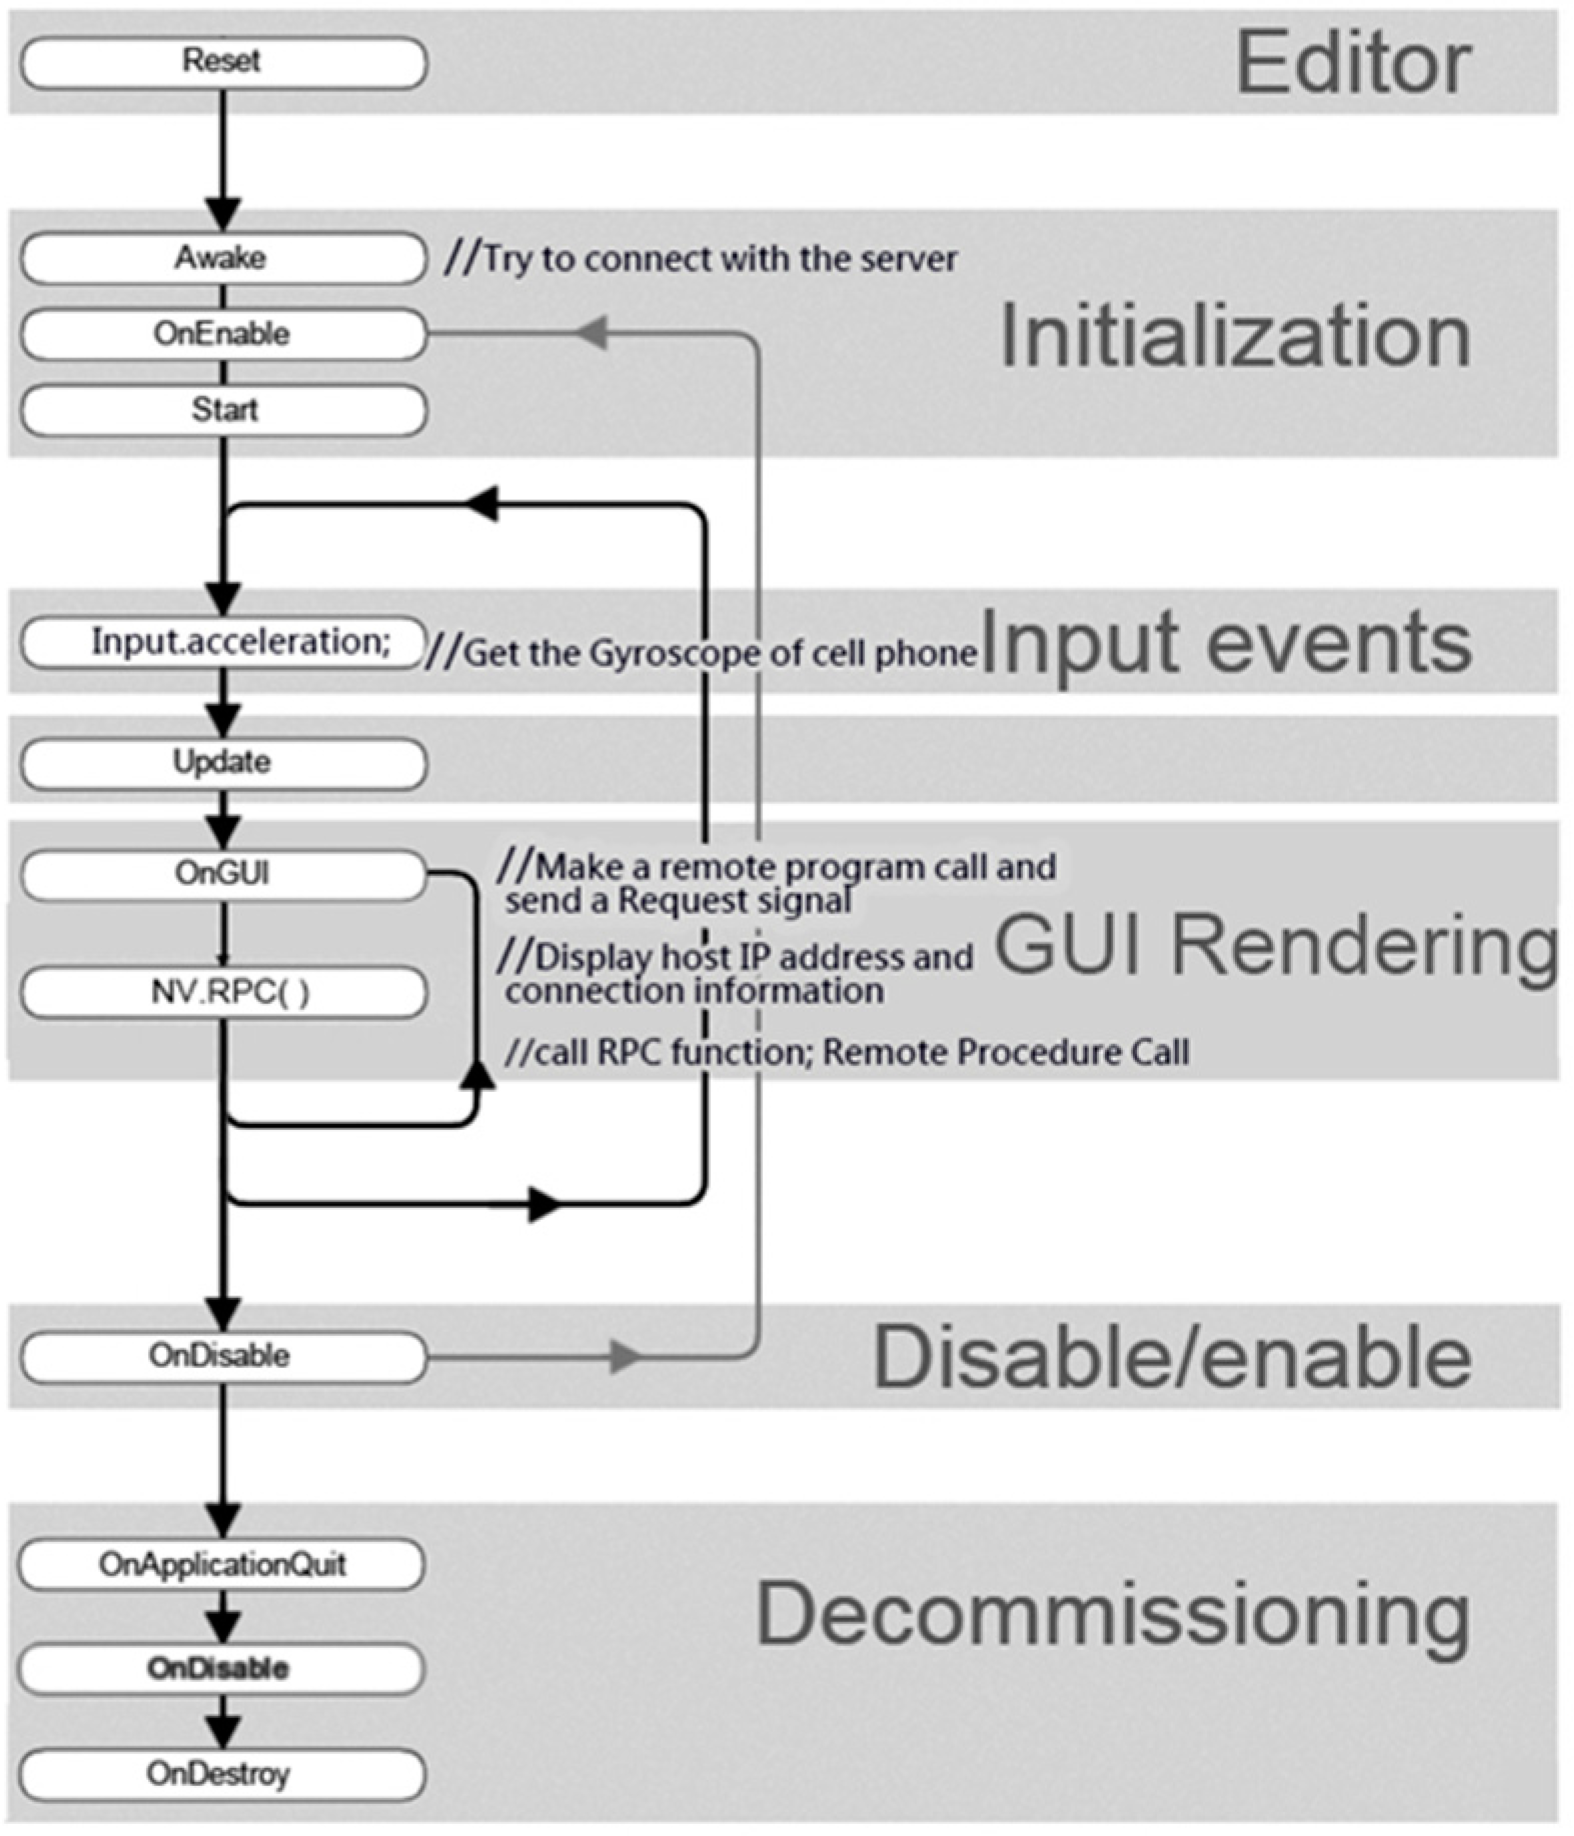
By taking Unity Engine, this research used C# language to write the connecting socket application for the client with the server via Wi-Fi. In the phase of initiation, the server makes connections with the client server when the users shake their phone to send gyroscope messages. Once the messages are received, the connection is made. The client app procedure is explained in
Figure 2.
As seen
Figure 3, OnEnable( ) on the server model indicates that a message is to be sent to the client server to request a connection. The connection of the socket will be made through Port 4242 once the message is received, and MS SQL Database Management will request a DB inquiry signal to create an access channel. Once the DB access channel is created, SQL is shown on the server model, indicating a message is to be sent to the SHU library server. Therefore, the library borrowing data from 2013 to 2015 will be selected, and a report of the book borrowing statistics will be sent back to the server. Based on the information that the server receives from the library server, the galaxy of universe dynamic sprite renderings will proceed, and as the book titles and borrowing information are animated on the monitor, a galaxy rotation visual effect infographic will be presented. Once the gyroscope is stopped by the user, the DB access channel is closed and the connection between the server and the client-server will be disconnected. The connection between the server and client-server is illustrated in
Figure 4.
3.2. The Exhibition of the Work
For the user, digital media not only features high productivity and high efficiency, but also high entertainment. Moreover, through the user experience, digital media may ignite creativity and aesthetic inspection, which is the core value of modern interactive design. With the advanced technology now available, this research will produce an interactive artwork for people to engage in worldwide.
Regarding ‘environmental interaction’, Her once stated that art that is presented to the public usually has multiple purposes, and interaction will be part of the experience no matter how the user engages in the artwork, even if only indirectly [
22]. During this process, the usability, function, and meaning of the art should never be changed. That is, the artwork is classified as a sort of recreation, or even an element that can vitalize a work. In interactive art, active operation of the system by the user can be seen as the key to a successful artwork. Although interaction is not the only means by which to perform a work, it is one way that a user experience can be obtained. Furthermore, Kwon pointed out that, today, public artworks are no longer static; artworks are presented in harmony with the environment, buildings, and architecture around them [
23], which helps to convey their meaning.
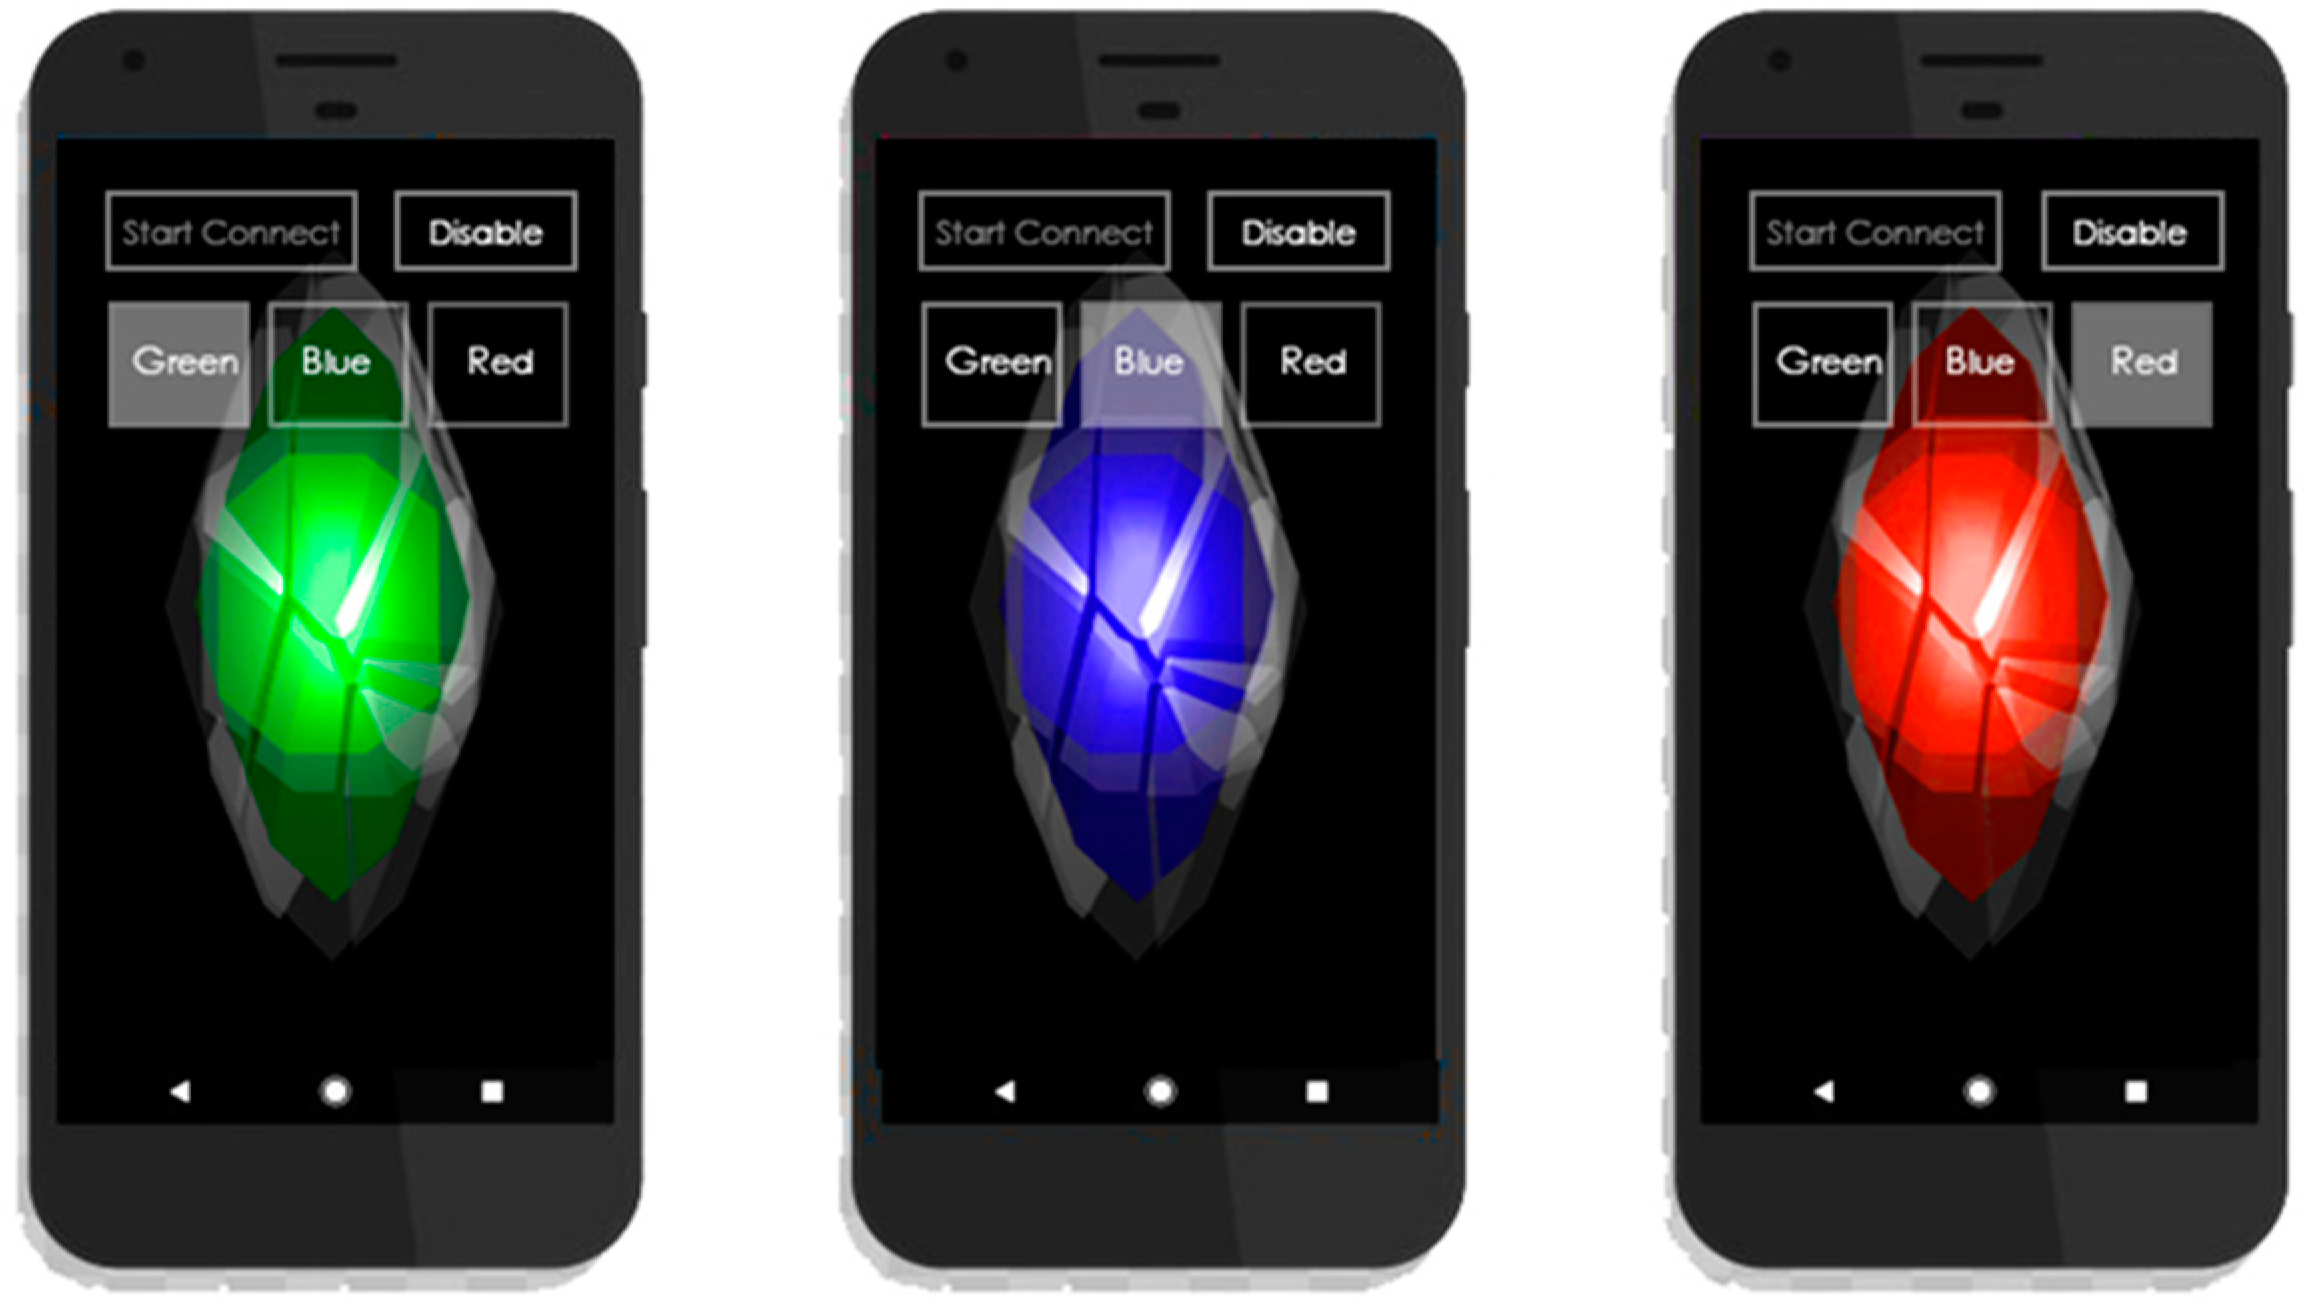
Figure 5 shows the client app UI design. There are five buttons on the interface, including the ‘Start Connect’ button for activating the server connection and the ‘Disable’ button for ending the connection. The other three buttons are Red, Green and Blue, all of which can control the star color on the monitor. Users can control the buttons together at the same time to create a color mixing effect. There are 256 color combinations, which can give diverse visual effects. If desired, users can repeat the interaction or are free to leave the process when they choose. During the interaction process, the server will make a connection to the HSU Library database to collect book borrowing information, and then present this data through the projector on the monitor. As the phone stops shaking, and all the users turn off the app and leave the interaction, the image on the monitor will go back to the original state of silence, and the stars in the universe will go back to their original luminous white. This research was performed at the HSU library from 12/16/2015 to 12/21/2015 during the exhibition, and 300 to 400 people engaged with the interactive art, as shown in
Figure 6a,b. The library book borrowing data analysis is explained in
Figure 7. In
Figure 7a, each book title and its number of loans per book can be visualized by user launch his smart phone’s gyroscope. While in
Figure 7b, the service data for number of books loaned by the library was displayed as the information visualization of big data on the screen. The color of the device according user’s choice in
Figure 5 will be related to the color display of the area in
Figure 7b. If the user chooses green, green will be displayed for the book borrowed.
3.3. The Empirical Verification of Usability
During the exhibition from 12/16/2015 to 12/21/2015, we carried out a questionnaire survey through observing the interactive process and briefly interviewing users for the usability evaluation. Usability testing is a method to evaluate the value of digital products or systems, to verify whether the information architecture can be easily and intuitively operated by users. This method is known as user-centered design.
ISO 9241-11 [
24] and ISO 13407 [
25] are two important standards related to usability; the former provides the definition of usability, and the latter guidance for design usability [
26]. According to the ISO 9241 standards, a usability evaluation should test the effectiveness, efficiency, and satisfaction in the specific context that a product is used by certain people. In other words, a usability test is an evaluation approach that tests whether users are satisfied with the product and examines the context effectiveness and efficiency. The evaluation procedure includes four parts: (1) definition and setting, (2) recruitment of interviewees, (3) observation and testing, and (4) results analysis. After collecting users’ feedback, quantitative tests were also conducted during the exhibition.
3.4. Description of the Questionnaire—Definition and Setting
Regarding the degree of IT system acceptance in the social science field, the Theory of Reasoned Action (TRA) [
27,
28] was constructed on the basis of the Technology Acceptance Model (TAM) [
29]. Since traditional IT is used only for work efficiency, the influence factors would be limited to the user, such as their operation of the computer hardware or software. Since the factors of the environment and society would be expected to impact the degree of user information system acceptance, Venkatesh and Davis used TAM principles to develop the Extended Technology Acceptance Model (TAM2) [
30]. TAM2 has the constructs of the social influence process (including social norms, volunteering, and social images), as well as a user cognition process (including work-related elements, product quality, performance, and perceived ease of use) [
30]. Despite the fact that in TAM the social influence process has been deleted, it is clear that social norms may affect user intentions. Through TAM, however, users’ behavior and intentions towards technology products can be empirically explained, as since 1989, numerous researchers have published work on user technology acceptance theses in the field of social technology.
By observing the popularity of digital technology and the user experience of the consumption market, the concept of usability has been extended with the user-centered model, which is different from the idea that products are mainly used for purposes related to work or task achievement. Thus, to create a better user experience that takes into account users’ needs and emotions, enjoyment, entertainment, excitement, and attraction should be taken into account in the interactive process [
3].
Wetzlinger, Auinger, and Dorflinger stated that the user satisfaction degree of a system should be focused on the usability evaluation [
31], and the Software Usability Scale (SUS) questionnaire was their preferred measure for usability evaluations [
32]. The SUS is considered to be a reliable approach for usability evaluation [
33,
34], and is outlined in
Table 1.
Questions (2), (3), (4), (6), (7), (8) and (10) are related to perceived ease of use. Questions (1) and (5) are about perceived usefulness, and (9) reflects the user satisfaction degree. The two factors of perceived usefulness and perceived ease of use are the most important to test in a usability evaluation.
Moon and Kim emphasized individual perceived playfulness. They suggested that user intention and attitude to net-related entertainment would be affected by perceived playfulness [
35]. As for the degree of digital media acceptance, Moon and Kim proposed that perceived playfulness may help increase user cognition, and further recognize the user’s intention. Thus, this research will take ‘perceived playfulness’ as the main factor to explore in relation to the value of interactive artwork.
3.5. Research Model and Hypotheses
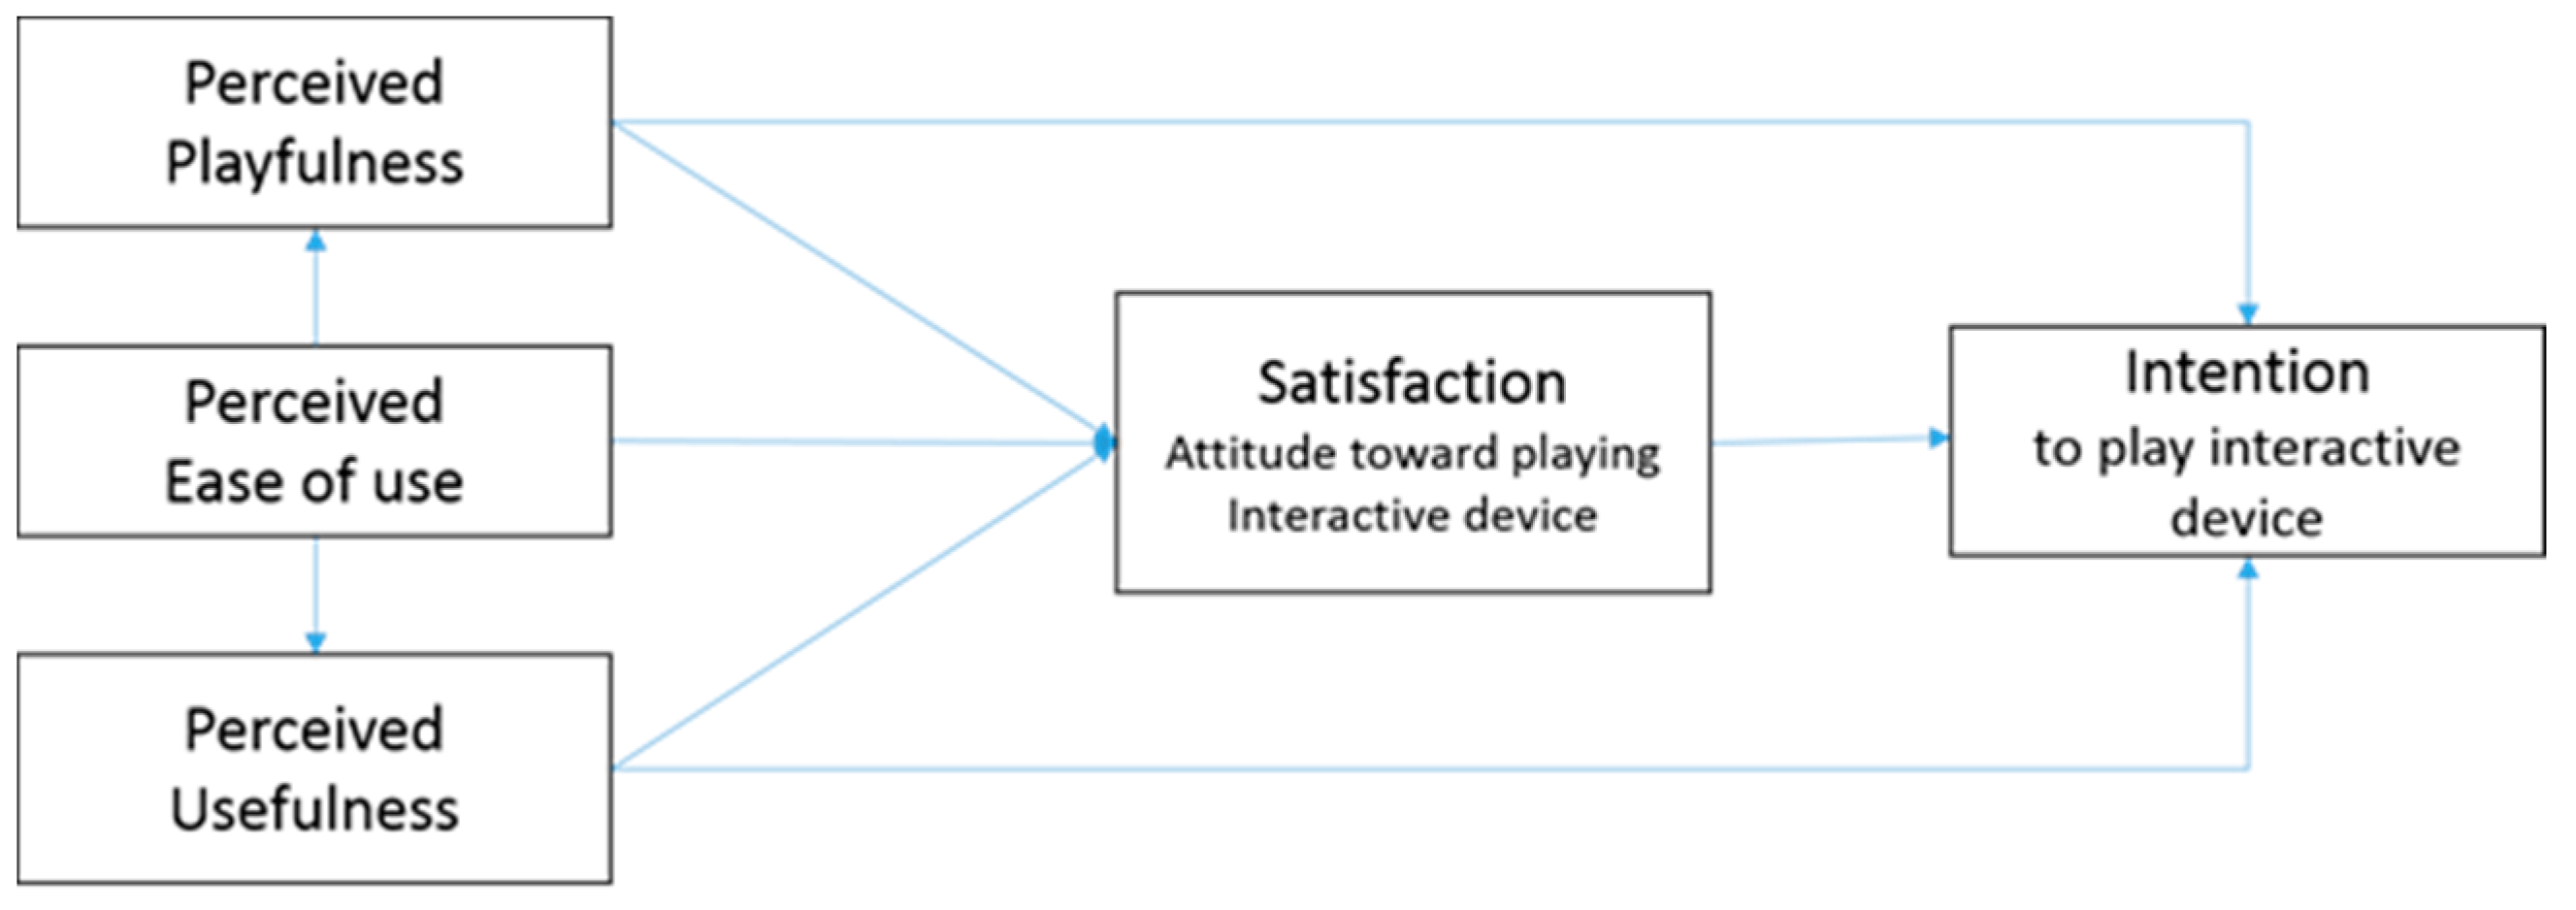
Based on the ISO standards, three constructs are essential for usability evaluation, along with TAM constructs and the factor of perceived playfulness, which Moon and Kim proposed. This research builds a construct for integrating library data analysis into artwork usability evaluations, as seen in
Figure 8. The research constructs include: (1) Perceived Playfulness, (2) Perceived Ease of Use, (3) Perceived Usefulness, (4) Satisfaction, and (5) Intention.
- (1)
Perceived Playfulness
Both internal and external factors may affect the intention to use information technology [
36,
37]. The internal factor in this research is the sense of excitement and playfulness that comes from engaging with the operating system. The external factors are the goals or rewards that can be achieved by using the operating system [
36,
38,
39]. ‘Perceived playfulness’ is positively related to the internal and external factors of user acceptance, as testified by related research on the Internet [
35,
40], virtual stores [
41], AR teaching systems [
17,
42] and online games [
36,
43]. Perceived playfulness in this research is defined as the joyful feeling that the user experiences during their interaction with the interactive artwork. We proposed that ‘perceived playfulness’ should help convey the theme of the artwork and increase user satisfaction.
- (2)
Perceived Ease of Use
In the TAM model, ‘perceived ease of use’ is positively and directly related to user intention. In this research, it refers to the easy and intuitive operation of the artwork. Related research, such as in online media or digital media [
36,
44,
45], AR education applications [
17], and so forth, has confirmed that ‘perceived ease of use’ is a key factor in user acceptance. This research further proposes that ‘perceived ease of use’ should include the ability to engage with the interactive artwork with a light heart. ‘Perceived ease of use’ should also increase the sense of joyfulness. ‘Perceived ease of use’ is positively related to perceived playfulness, according to related research [
30,
36]. This research thus proposes that ‘perceived ease of use’ directly affects perceived playfulness, perceived usefulness, and user satisfaction.
- (3)
Perceived Usefulness
There are many diverse aspects of efficiency. For most multimedia and information systems, efficiency refers to tasks being completed quickly and with few mistakes. Decreasing the number of steps in the process of operating the information system and multimedia can also enhance efficiency, which has been confirmed by related TAM research [
17,
30,
36,
37,
43]. According to the TRA model, efficiency feedback can be defined as user self-internal identified, and also can be defined as the degree of user acceptance [
36]. Lin and Lu suggested that ‘perceived usefulness’ is closely linked to usability [
46]. ‘Perceived usefulness’ in this research is defined in terms of the interactive art system. We propose that ‘perceived usefulness’ should directly affect user satisfaction.
- (4)
Satisfaction
According to Lin and Lu, satisfaction is a main factor influencing whether a user will continue to use a service [
46]. For instance, if a user is satisfied with a website, then the user will repeatedly visit the website. User satisfaction is formed by the whole image of a product. Chang, Hu, and Chen, in applying AR to the usability evaluation of a culture environmental learning system, suggested that the user satisfaction degree will not merely increase user intention, but will also enhance user learning performance [
17]. ‘Satisfaction’ in this research is defined as the sense of satisfaction that can be created by the interaction with the interactive artwork. The degree of satisfaction should directly affect user intention to use the system, and is also positively linked to the factors of ‘Perceived Playfulness’, ‘Perceived Ease of use’, and ‘Perceived Usefulness’.
- (5)
Intention
‘Intention’ here is closely linked to the factors of perceived playfulness, perceived ease of use, perceived usefulness, and satisfaction degree. It refers to the users’ willingness to engage with the interactive art again.
Accordingly, the following eight hypotheses have been proposed by this research:
Hypothesis 1. ‘Perceived Playfulness’ is positively related to ‘Satisfaction’ with respect to interaction with the interactive art device.
Hypothesis 2. ‘Perceived Playfulness’ is positively related to the user’s ‘Intention’ of reusing the interactive art device.
Hypothesis 3. ‘Perceived Ease of Use’ is positively related to ‘Perceived Playfulness’ with respect to interaction with the interactive art device.
Hypothesis 4. ‘Perceived Ease of Use’ is positively related to ‘Perceived Usefulness’ with respect to interaction with interactive art device.
Hypothesis 5. ‘Perceived Ease of Use’ is positively related to ‘Satisfaction’ with respect to interaction with the interactive art system.
Hypothesis 6. ‘Perceived Usefulness’ is positively related to ‘Satisfaction’ with respect to interaction with the interactive art device.
Hypothesis 7. ‘Perceived Usefulness’ is positively related to the user’s ‘Intention’ with respect to interaction with the interactive art system.
Hypothesis 8. ‘Satisfaction’ is positively related to the user’s ‘Intention’ with respect to interaction with the interactive art system.
5. Discussion
Based on related academic theories, in
Section 3, we proposed a usability evaluation for an interactive artwork, in which the analysis of reliability and the analysis of validity met the standards of examination. In
Table 3, the descriptive statistics analysis results indicate that the user responses to the interactive artwork were positive with respect to the aspects of ‘perceived playfulness’, ‘perceived ease of use’, ‘perceived usefulness’, ‘satisfaction’, and ‘intention’ (>3.5).
The research results confirm these hypotheses, and the perception of users, such as ‘perceived playfulness’, ‘perceived ease of use’, and ‘perceived usefulness’, can improve user intention in using the interactive artwork. As we expected at the beginning of the study, the proposed research Hypotheses 1 to 7 were verified.
Moreover, according to the results of the correlation coefficient analysis, we propose that the perceived ease of use is not related to the perceived usefulness, and the perceived usefulness is not related to intention. The other constructs are all positively related to one another, which means that this research model explains the construct correlation of the interactive artwork usability. As can be seen in
Figure 9, the results show that perceived playfulness is closely linked to the factors of satisfaction and intention. This suggests that interaction can create entertainment, as the degree of satisfaction with the library information services should impact users’ intention to reuse this interactive artwork. Thus, in this case, interaction can create entertainment. In this way, this research model adequately explains the usability of the interactive artwork.
In recent years, digital art with interactive elements has been widely applied in museums and digital cultural theme exhibitions presented in certain culture centers. However, whether cross-field interactive art performances related to information services is accepted by users has not been well researched as yet. Based on TAM research results and related literature reviews, this research examined the usability evaluation of an interactive artwork, and further proposed perceived playfulness as a crucial factor construct of usability when considering the concept of user acceptance. In this research, only 42 valid questionnaires were obtained for statistical analysis, and we hope to obtain more questionnaires in the future so as to further explore the usability evaluation of this integration of information services into an interactive artwork.
6. Conclusions
Good innovative design comes from technological progress. Due to the continuous emergence of new interactive technology, digital art has achieved great performance in the past ten years. In the presentation of traditional art, the audience is only the information receiver of the art theme. As interaction is regarded as one of the digital creative media, digital art performances are beginning to emphasize user participation (including the user experience). Usability, or user acceptance, has become one of the important indicators for evaluating the success of digital art.
In this research, the innovation of digital art is combined with the educational application of the library information service. The data visualization was used to tie the pleasant of digital art dynamic images for the library information services. In addition, this research believes that visualize data sources applications should ensure acceptance of use. Therefore, we believe that a feasible usability evaluation framework is proposed for evaluating data visualization systems for information service is critical. This is also the value of digital art combined with cross-domain applications such as information services or education services.
The interactive artwork can fully make library information service data more intuitive, understandable, and more interesting with the interactive process. Users can understand which books are often borrowed from the data analysis, the frequency with which the specified book has been borrowed, and whether these books are related to the user’s interests. The interactive artwork can promote the library in becoming an interesting field for the lifelong learning of users, because they feel that the library can provide high-quality data services.
The statistical methods and analysis results implemented in the fourth section show that the research purpose was achieved; firstly, by verifying that the interactive art we provided for the library information service met the user’s acceptance; and secondly, by providing usability-verified models for cross-domain applications between digital art and data visualization. Therefore, we believe that the proposal of a feasible usability evaluation framework for evaluating data visualization systems for information services is critical. This is also the value of digital art combined with cross-domain applications such as information services or education services.
Usability evaluations of devices and performances are rarely carried out, as most interactive art is focused on the exhibition aspect, rather than being user centered. The user experience is hard to understand, as users’ emotional responses to art are internal and often private. Thus, this research took a cross-field approach that integrated library book borrowing data into an interactive device to create an interactive artwork; the users could use their own smartphone to engage with library book borrowing information through an interactive art performance of a library information visualization service. Furthermore, for this cross-fields interactive artwork application, this research proposed a usability evaluation analysis model based on user feedback data and statistical examination of the usability of the interactive artwork. Limited research has been published in this area, so this research represents a unique viewpoint.
The research future can be extended, and the focus on data analytics in the future will be heavily centered on analytical applications such machine learning and decision tree methods combined the organization’s information services, particularly in relation to human factors, information visualization, communication, and the presentation of data analytics results through the latest data mining technologies, such as interactive analytics, digital interfaces, data storytelling, and new algorithms and methods.


