Featured Application
Reducing the magnitude of within-day energy deficiency could have a positive effect on optimizing performance in competitive female cyclists.
Abstract
(1) Background: Low energy availability (LEA) has negative effects on performance, but mechanisms, timing, and other circumstances of these effects are not yet established. We aim to assess the performance-related effects of low energy availability in competitive female cyclists with a detailed approach to within-day energy availability (WDEB). (2) Methods: Female competitive cyclists (n = 8) completed the measurement of body composition, resting energy expenditure, and incremental testing; they reported diary logs and used accelerometers for energy availability (EA) calculation. Based on the Low Energy Availability in Females (LEAF) questionnaire, performance and energy parameters were compared between cyclists with risk for relative energy deficiency in sport (RED-S; the LEAF+ group) and cyclists without any risk (LEAF−). (3) Results: 87.5% had EA <30 kcal/kg. EA and energy balance in LEAF– were significantly different from LEAF+ cyclists (U = 0.00, z = −2.00, p < 0.05 and U = 0.00, z = −2.00, p < 0.05, respectively). We found significant correlations between WDEB−300 and EA (−0.736, p = 0.037) and energy balance (−0.732, p = 0.039). In addition, relative power output was correlated with mRMR/pRMR (−0.763, p = 0.046). (4) Conclusions: This study is the first to show that WDEB−300 in competitive female cyclists is greater in cyclists with risk for RED-S. Increased time in a catabolic state was correlated to worse anaerobic capacity in incremental testing. Measuring mRMR/pRMR might be useful as it was negatively associated with aerobic performance.
1. Introduction
Relative energy deficiency in sport (RED-S) has gained a lot of attention during the last few years. This is a syndrome resulting from low energy availability that impairs health and performance [1]. Its effects are often subtle and unrecognized but can critically alter an athlete’s physical and mental status. Due to excellent work from some research groups, we now better understand RED-S effects of health in male and female athletes [2]. Unfortunately, we can only speculate to which extent and when RED-S affects performance. We know even less about performance effects among competitive athletes since LEA measurements are quite a great burden for participants. This under-researched phenomenon has many negative performance outcomes that are mostly supported by theory and some indirect evidence from research in athletes with eating disorders. In one of the first studies assessing performance in elite female swimmers, Vanheest et al. [3] concluded that ovarian suppression impairs performance. Energy availability (EA), calculated with exercise energy expenditure (EEE) from diary logs, was associated with poorer performance. Unfortunately, evidence observing performance while actually measuring EA is lacking and is currently limited to only a few studies [4,5,6]. The decline in performance due to LEA could appear earlier than detrimental health effects, and more evidence is needed to support this. In females, the Low Energy Availability in Females (LEAF) questionnaire is available as a short and simple screening tool to recognize risk for RED-S [7,8]. Screening with LEAF can be performed before any evident clinical signs are present. This validated tool has already indirectly shown poorer performance in 1000 athletes [9]. In this study, EA was assessed by two surrogate markers, eating disorder and disordered eating, which were measured by three questionnaires (the Brief Eating Disorder in Athletes Questionnaire, Eating Disorder Screen for Primary Care, and self-reported current or past history of eating disorder or disordered eating). Performance was subjectively reported with single yes/no questions for decreased training response, impaired judgment, decreased coordination, decreased concentration, irritability, and depression. In addition to these performance effects, increased injury risk was also estimated (>3 separate injuries in the last year, resulting in missed training/race days in the past year) [9].
Novel findings indicate that not only is daily EA important for an athlete’s well-being and results, but it is also important for the distribution of EA throughout the day [10,11]. The so-called within-day energy balance (WDEB) has already been associated with suppressed resting energy expenditure (REE) and blood parameters of catabolism in male athletes [10]. In elite athletes with amenorrhea, potentially indicating LEA, the catabolic state was also associated with severe WDEB [11]. This severe state, also called within-day energy deficiency, was set at energy balance (EB) greater than −300 kcal/h (WDEB−300). A value of 300 kcal comes from the predicted liver glycogen amount in small subjects [12]. Deutz et al. [12] suggested that WDEB−300 in elite athletes is associated with higher body fat, which could be due to a reduction of REE. The REE can be measured or predicted, and the ratio between these two parameters (measuredREE/predictedREE or mREE/pREE) has been suggested to be a possible screening marker for RED-S [2,13]. The importance of this ratio has yet to be confirmed as it needs more evidence [8].
This study aims to find direct evidence of LEA on performance. This paper was set as original research, with direct measurements of EA and WDEB to support the performance effects of LEA on athletes. We aim to find any associations between LEA, as detected by objective and subjective methodology and performance-related parameters obtained under strict laboratory conditions. The goal is also to find any direct associations between mREE to performance in female competitive cyclists. Lastly, we aim to explore any correlations between performance and mREE/pREE that can support the value of this marker for future screening for LEA and RED-S.
2. Materials and Methods
2.1. Study Design
Members of a cycling team (n = 8) were analyzed for 5 consecutive days during their preparation period. All participants are competitive female cyclists participating in national and international races. All signed a consent form and were given instructions on the research protocol. The study was designed based on two papers looking into EA and time spent in a catabolic state in athletes [10,11]. On the first day, subjects filled in the LEAF questionnaire. Their body composition and REE were measured. The next day, they started recording diary logs, used HR monitors during all training units, and wore accelerometers 24 h per day for three days. On the last day (day 5), an incremental test was used to test cycling performance. The novelty in this research was an insight into performance rather than into reproductive function. The measurements took place 14 days after their last first day of menstruation. The time of measurements was chosen based on the fact that no blood was drawn from the participants, and observing performance was the primary goal for this research. Women with dysmenorrhea (45 and 95% of menstruating women) are less physically active when in pain, and this time frame was to eliminate the possibility of menstrual impact on EEE and thus on EA and WDEB [14].
In amenorrhoeic members, there was no limitation on the timing of procedures. Ethical approval was gathered from the National Ethical Committee for performing this research (number 0120-202/2020/5).
On the first day, body composition was measured with bioelectrical impedance (Biospace InBody 720, Seul, Korea). Prior to measurement, adhering to standards for measurement [15], participants were instructed to be well hydrated and refrain from any physical activity in the last 12 h.
2.2. Procedures
Indirect calorimetry was used to measure mREE (V2 mask (Hans Rudolph, KS, USA), Quark CPET (Cosmed, Albano Laziale, Rome, Italy), with Quark 8.1 PC software support). The measurement for mREE was performed in a thermoneutral environment, in silence, between 6.00 and 9.00 a.m., after 12 h of fasting [16]. The last 20 min of the 30 min measurement was used [17]. During every measurement, RQ was monitored to detect any possible protocol violations or inaccurate gas measurements [17]. pREE was calculated with the Harris–Benedict equation [18]. This is the most commonly used equation when calculating the mREE/pREE ratio in athletes, and it has previously been used in similar study designs [8,19]. The Weir equation was also used [20,21]. All cyclists filled in the LEAF questionnaire. Based on the LEAF questionnaire, they were put in the LEAF– group (no positive answers) or in the LEAF+ group (1 or more positive answers).
The next day, participants were given an accelerometer (ActiGraph GT3X®, Pensacola, FL, USA) that is worn on the left hip at all times except for training. This was used to obtain energy expenditure (EE) and nonexercise activity thermogenesis (NEAT) data. During intentional physical activity, the heart rate (HR) was monitored with Polar HR monitors (Polar V800, Polar Electro, Kempele, Finland) to measure EEE. Energy intake (EI) was calculated by participants filling in the diary log. As the calculation of EA is a challenging task for the participants and the scientists, this research followed recommendations by Burke et al. [22] and included only subjects who successfully completed all records. They were given specific instructions on how to measure (by taking photographic evidence, using measuring scales, and weighing foods) and record all foods and liquids ingested. EI data was analyzed with Foodworks 9 Professional Edition (version 9.0.3973, Xyrix Software, Brisbane, Queensland, Australia) by an experienced nutritionist.
On the fifth day, incremental testing took place with indirect calorimetry. A Cyclus 2 ergometer was used for incremental testing (Cyclus 2, Leipzig, Germany). Following 20 min of warm-up, participants started the ramp test at 60 W, with an additional 15 W every min. The test was performed until volitional exhaustion. The ambient temperature in the laboratory was 21 °C. Lactate was sampled from the earlobe. Samples were obtained at rest before any physical activities, at the end of the test, and 5 min after the test. Lactate was analyzed with the blood lactate analyzer Biosen C_Line (EKF Diagnostics, Germany).
WDEB was calculated as WDEB = EI − (EEE + EPOC + DIT + NEAT + mREE) for every h [12] (where EPOC is excess postexercise oxygen consumption, DIT is diet-indices thermogenesis and NEAT). As previously described, EEE was measured by an HR monitor. In the first h after exercise, EPOC was defined as 5% of EEE and the second hour as 3% of EEE [23]. DIT is 10% of EI. In the sixth hour, after all meals were used to calculate DIT with the equation DIT = 175.9 × t × e−t/1.3, where t is time [23], NEAT was measured by an accelerometer.
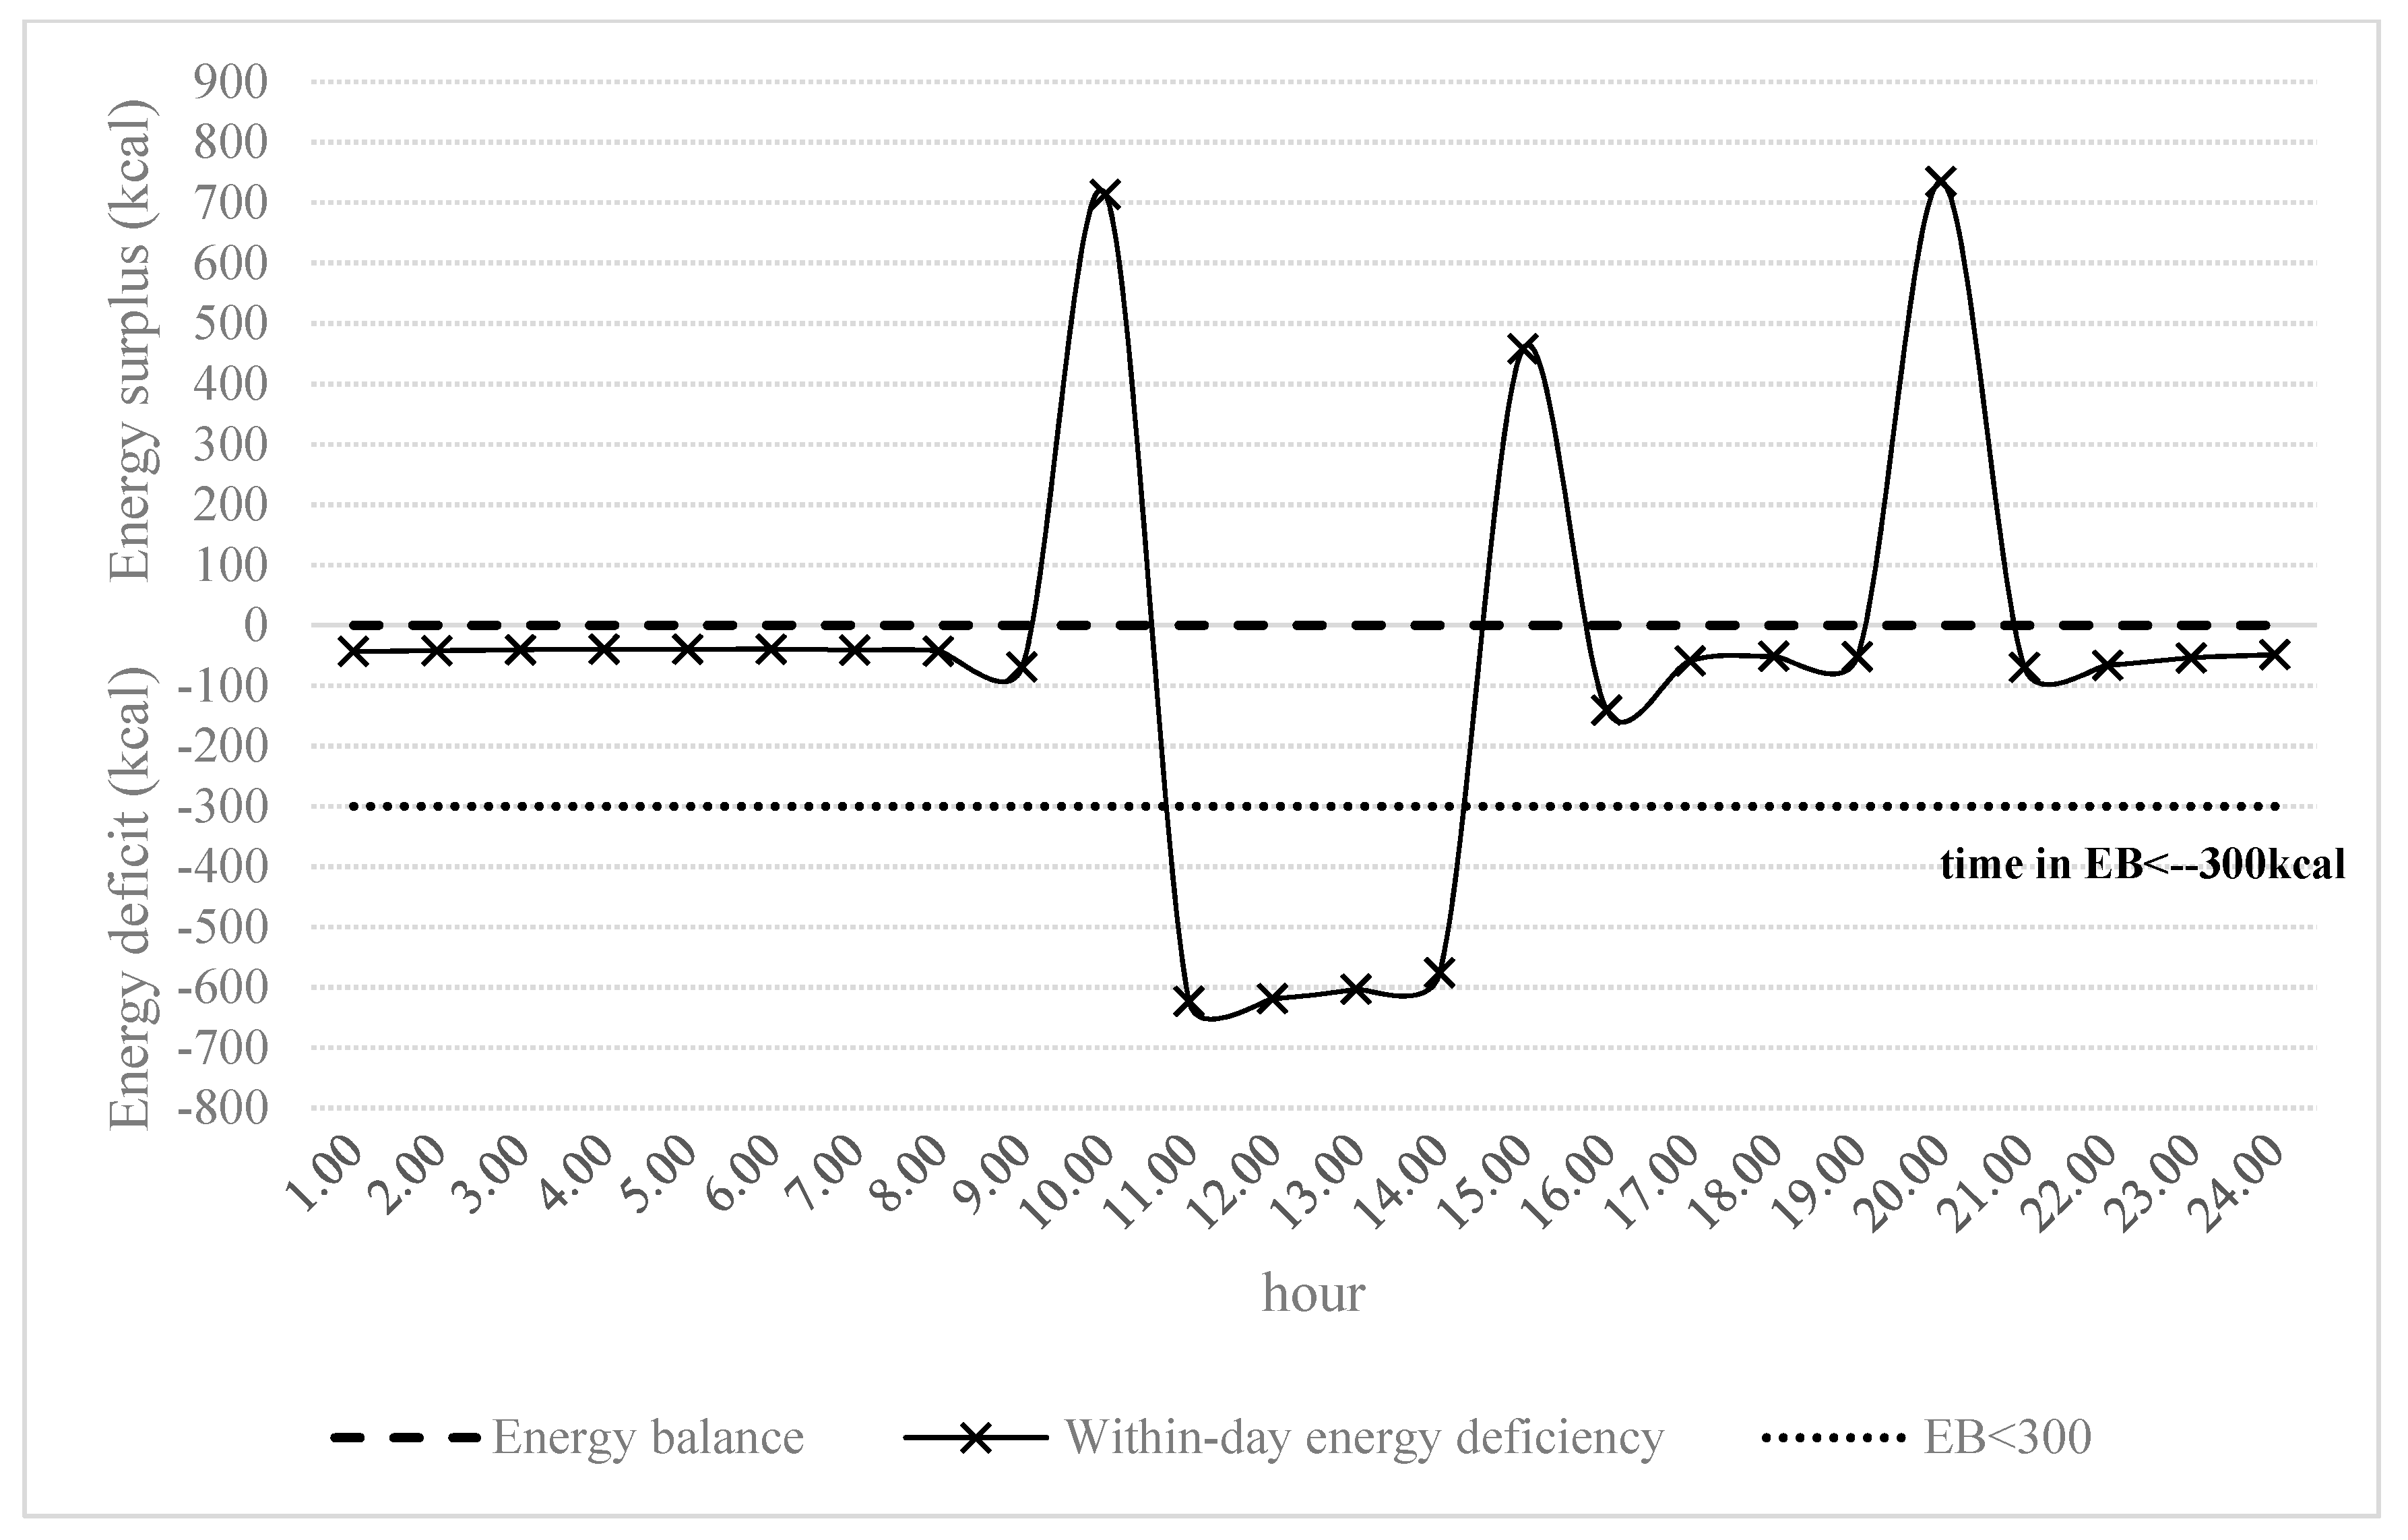
For all participants, we calculated WDEBneg, which is time spent in negative energy balance, and WDEB−300, which is time spend in energy balance under −300 kcal. EA was calculated as EA = (EI − EEE)/FFM. An example of WDEBneg and WDEB−300 calculation can be seen in Figure 1.
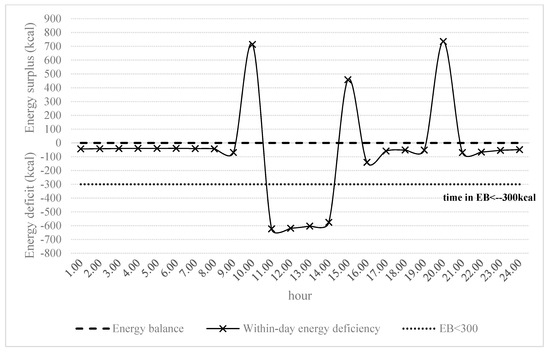
Figure 1.
An example of how within-day energy availability (WDEB)neg and WDEB−300 were calculated for one of the participants. The visual representation of the WDEB calculation of this figure is adapted from Fahrenholtz et al. [11].
2.3. Data Analysis
All statistical analysis was done by SPSS version 25.0 (IBM SPSS Statistics, Chicago, Illinois, USA). Descriptive statistics were used to present anthropological factors, performance, and energy-related parameters. Looking for differences in LEAF+ and LEAF− cyclists, the Mann–Whitney test was used with a 2-tailed statistical significance set at <0.05. For correlations between WDEB and performance-related parameters, Pearson’s and Spearman’s rank coefficients were used.
3. Results
Out of 12 cyclists, 8 completed all the procedures. One cyclist was eliminated due to poor compliance in the diary log, and three did not finish due to personal reasons.
Anthropological characteristics are represented in Table 1.

Table 1.
Anthropological characteristics of female cyclists with all completed procedures.
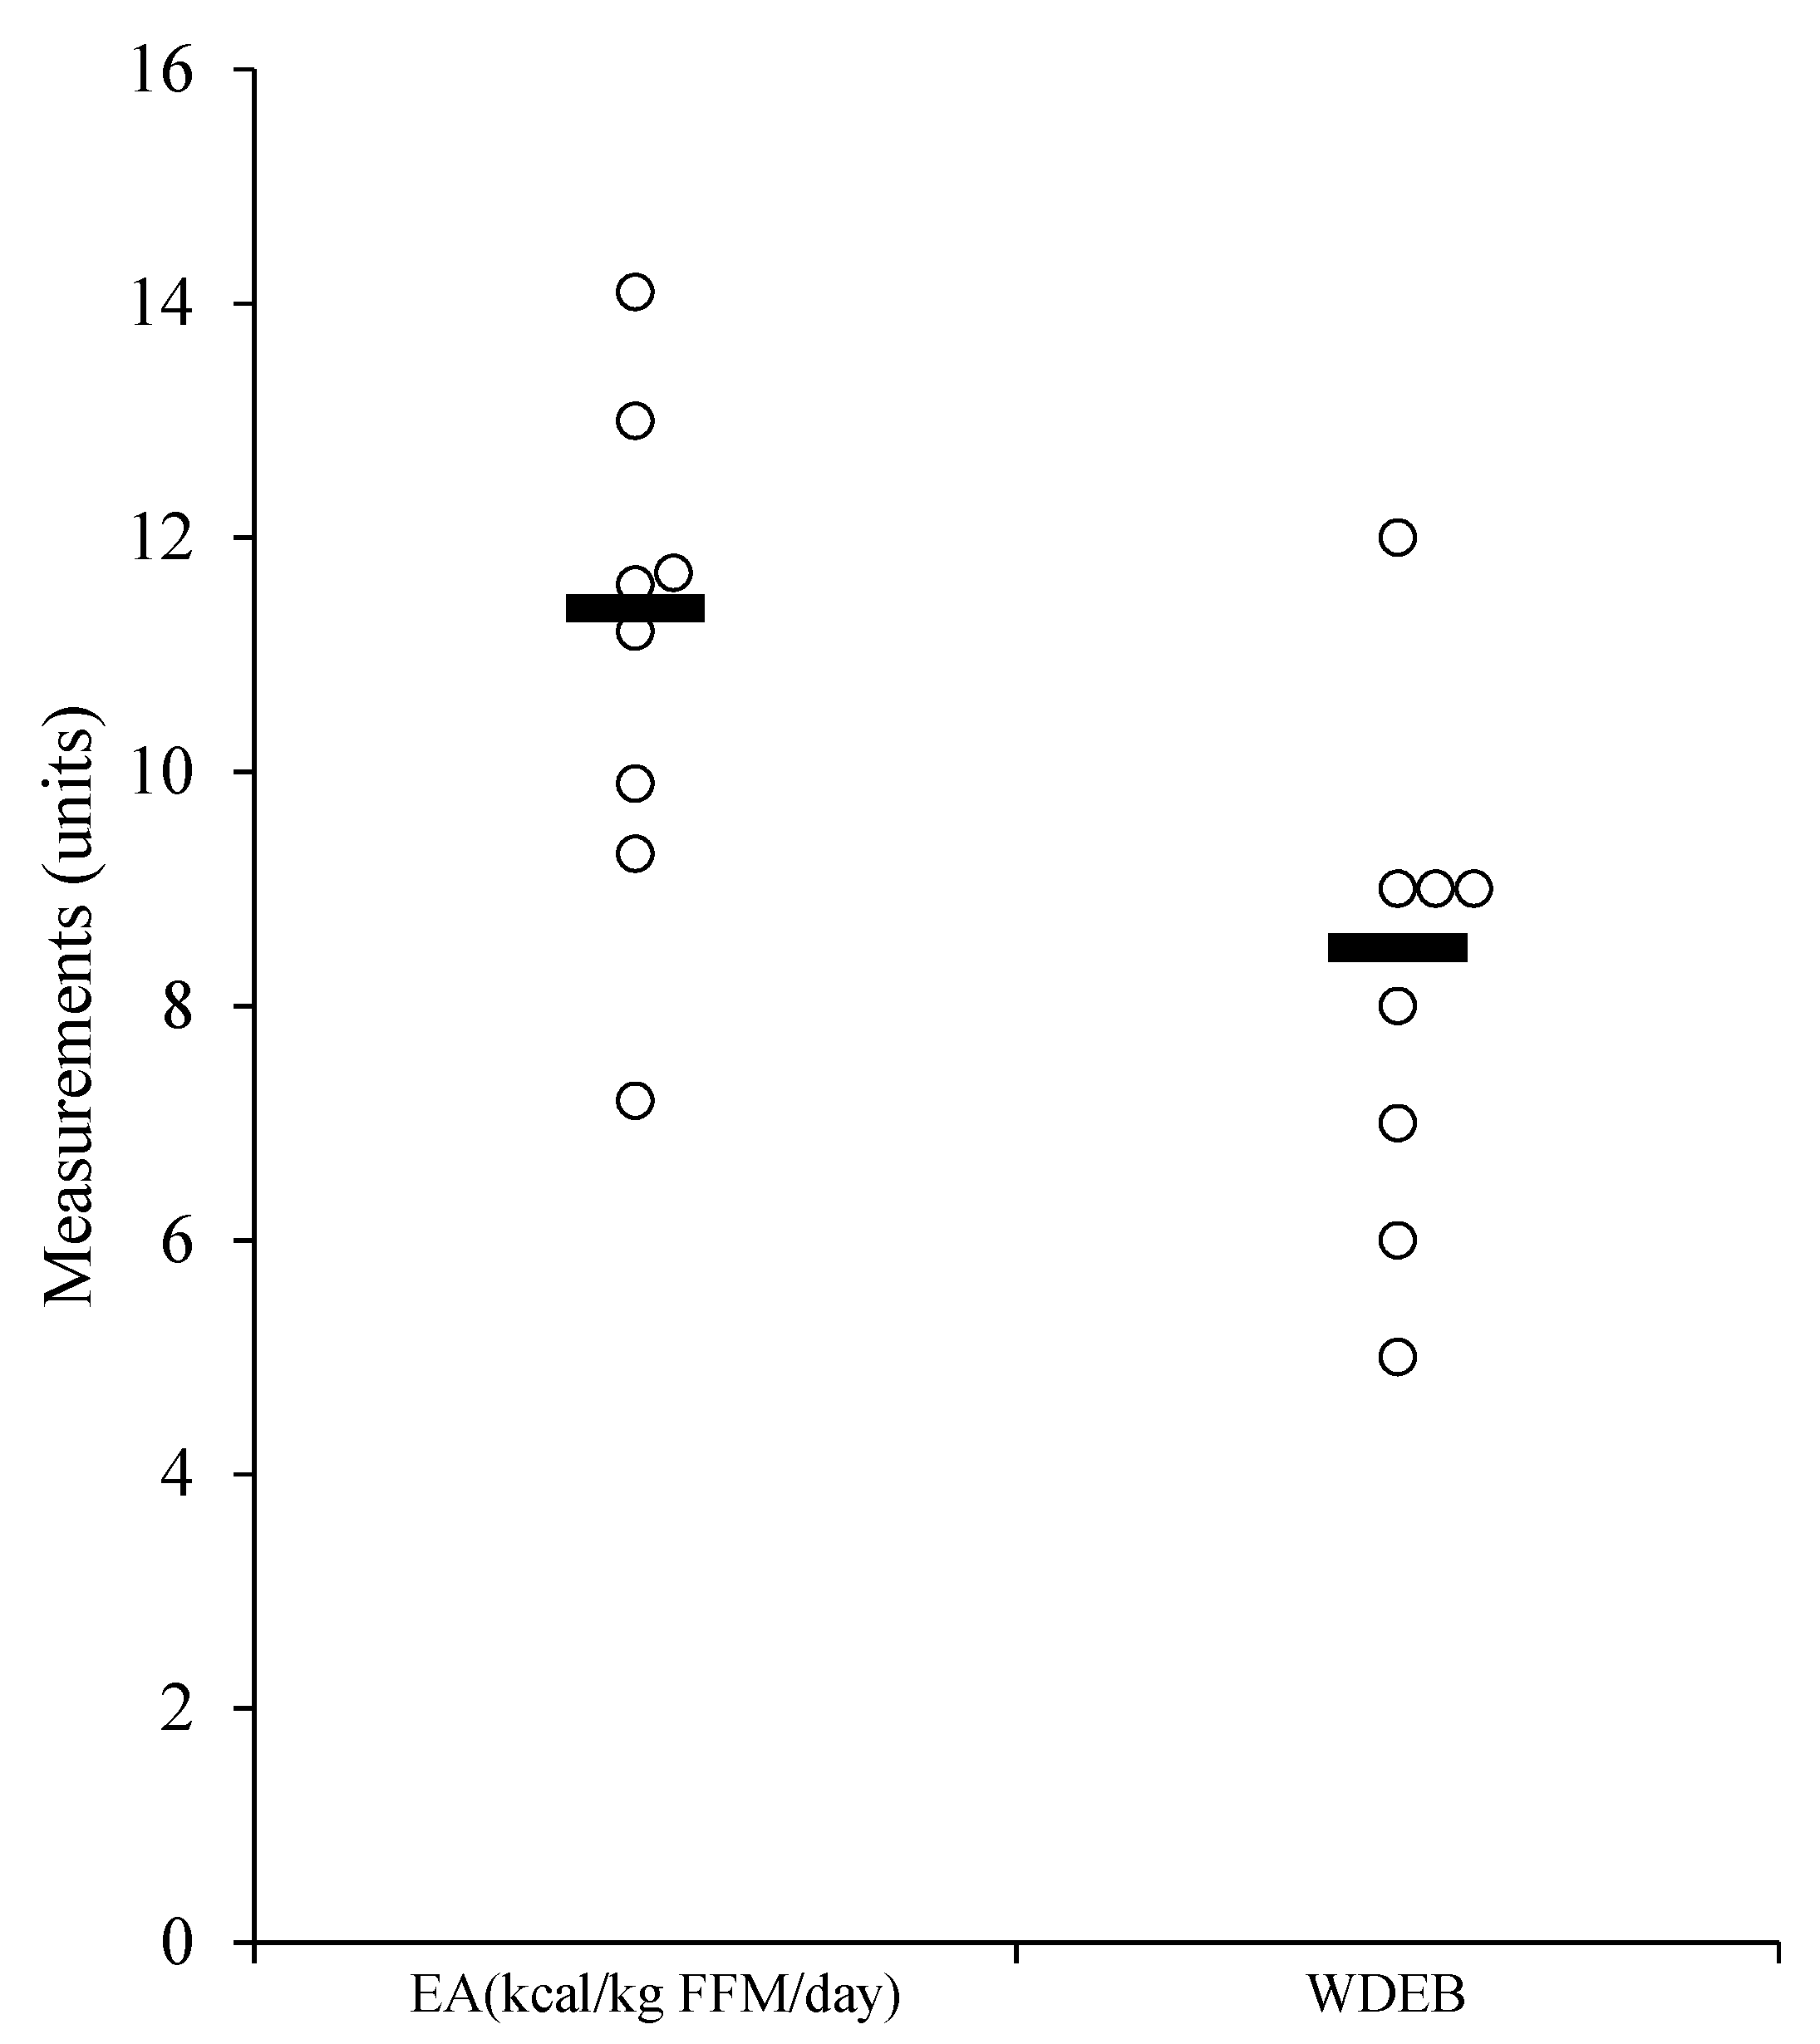
The LEAF questionnaire was positive in 6/8 (75%) of participants; the rest were labeled as the LEAF− group. In 5/8 (63%) cyclists, we registered negative EB over 3 days, and 7/8 (88%) had EA < 30 kcal/kg FFM/day. Other data on energy-related parameters are presented in Table 2. For clarity, univariate scatter plots for key values EA and WDEB−300 are shown in Figure 2. Two participants were amenorrhoeic, and one had previously experienced stress fracture.

Table 2.
Descriptive statistics of the energy-related parameters.
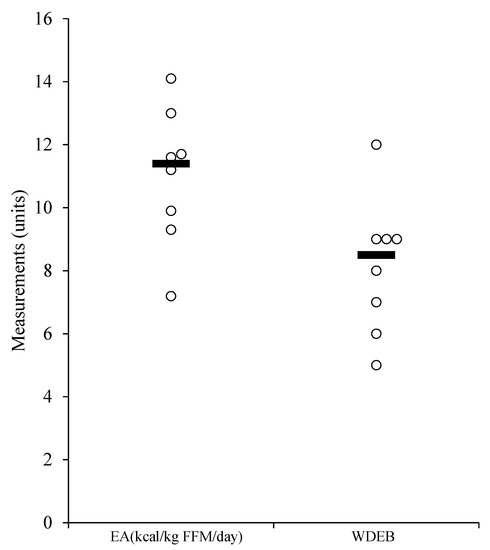
Figure 2.
Univariate scatter plots for energy availability (EA) and WDEB−300.
Looking into differences in the LEAF− and LEAF+ groups, we found some significant results. EA in LEAF− (mean 25.67) cyclists was significantly different from LEAF+ cyclists (mean 4.77) (U = 0.00, z = −2.00, p < 0.05, r = −0.70). In addition, EB in the LEAF− group was significantly different from the LEAF+ group (U = 0.00, z = −2.00, p < 0.05, r = −0.70). There were no differences in WDEBneg, EI, EEE, and EE.
WDEB−300 was significantly different in the LEAF− group compared to LEAF+ group (U = 12.0, z = 2.049, p < 0.05, r = −0.72).
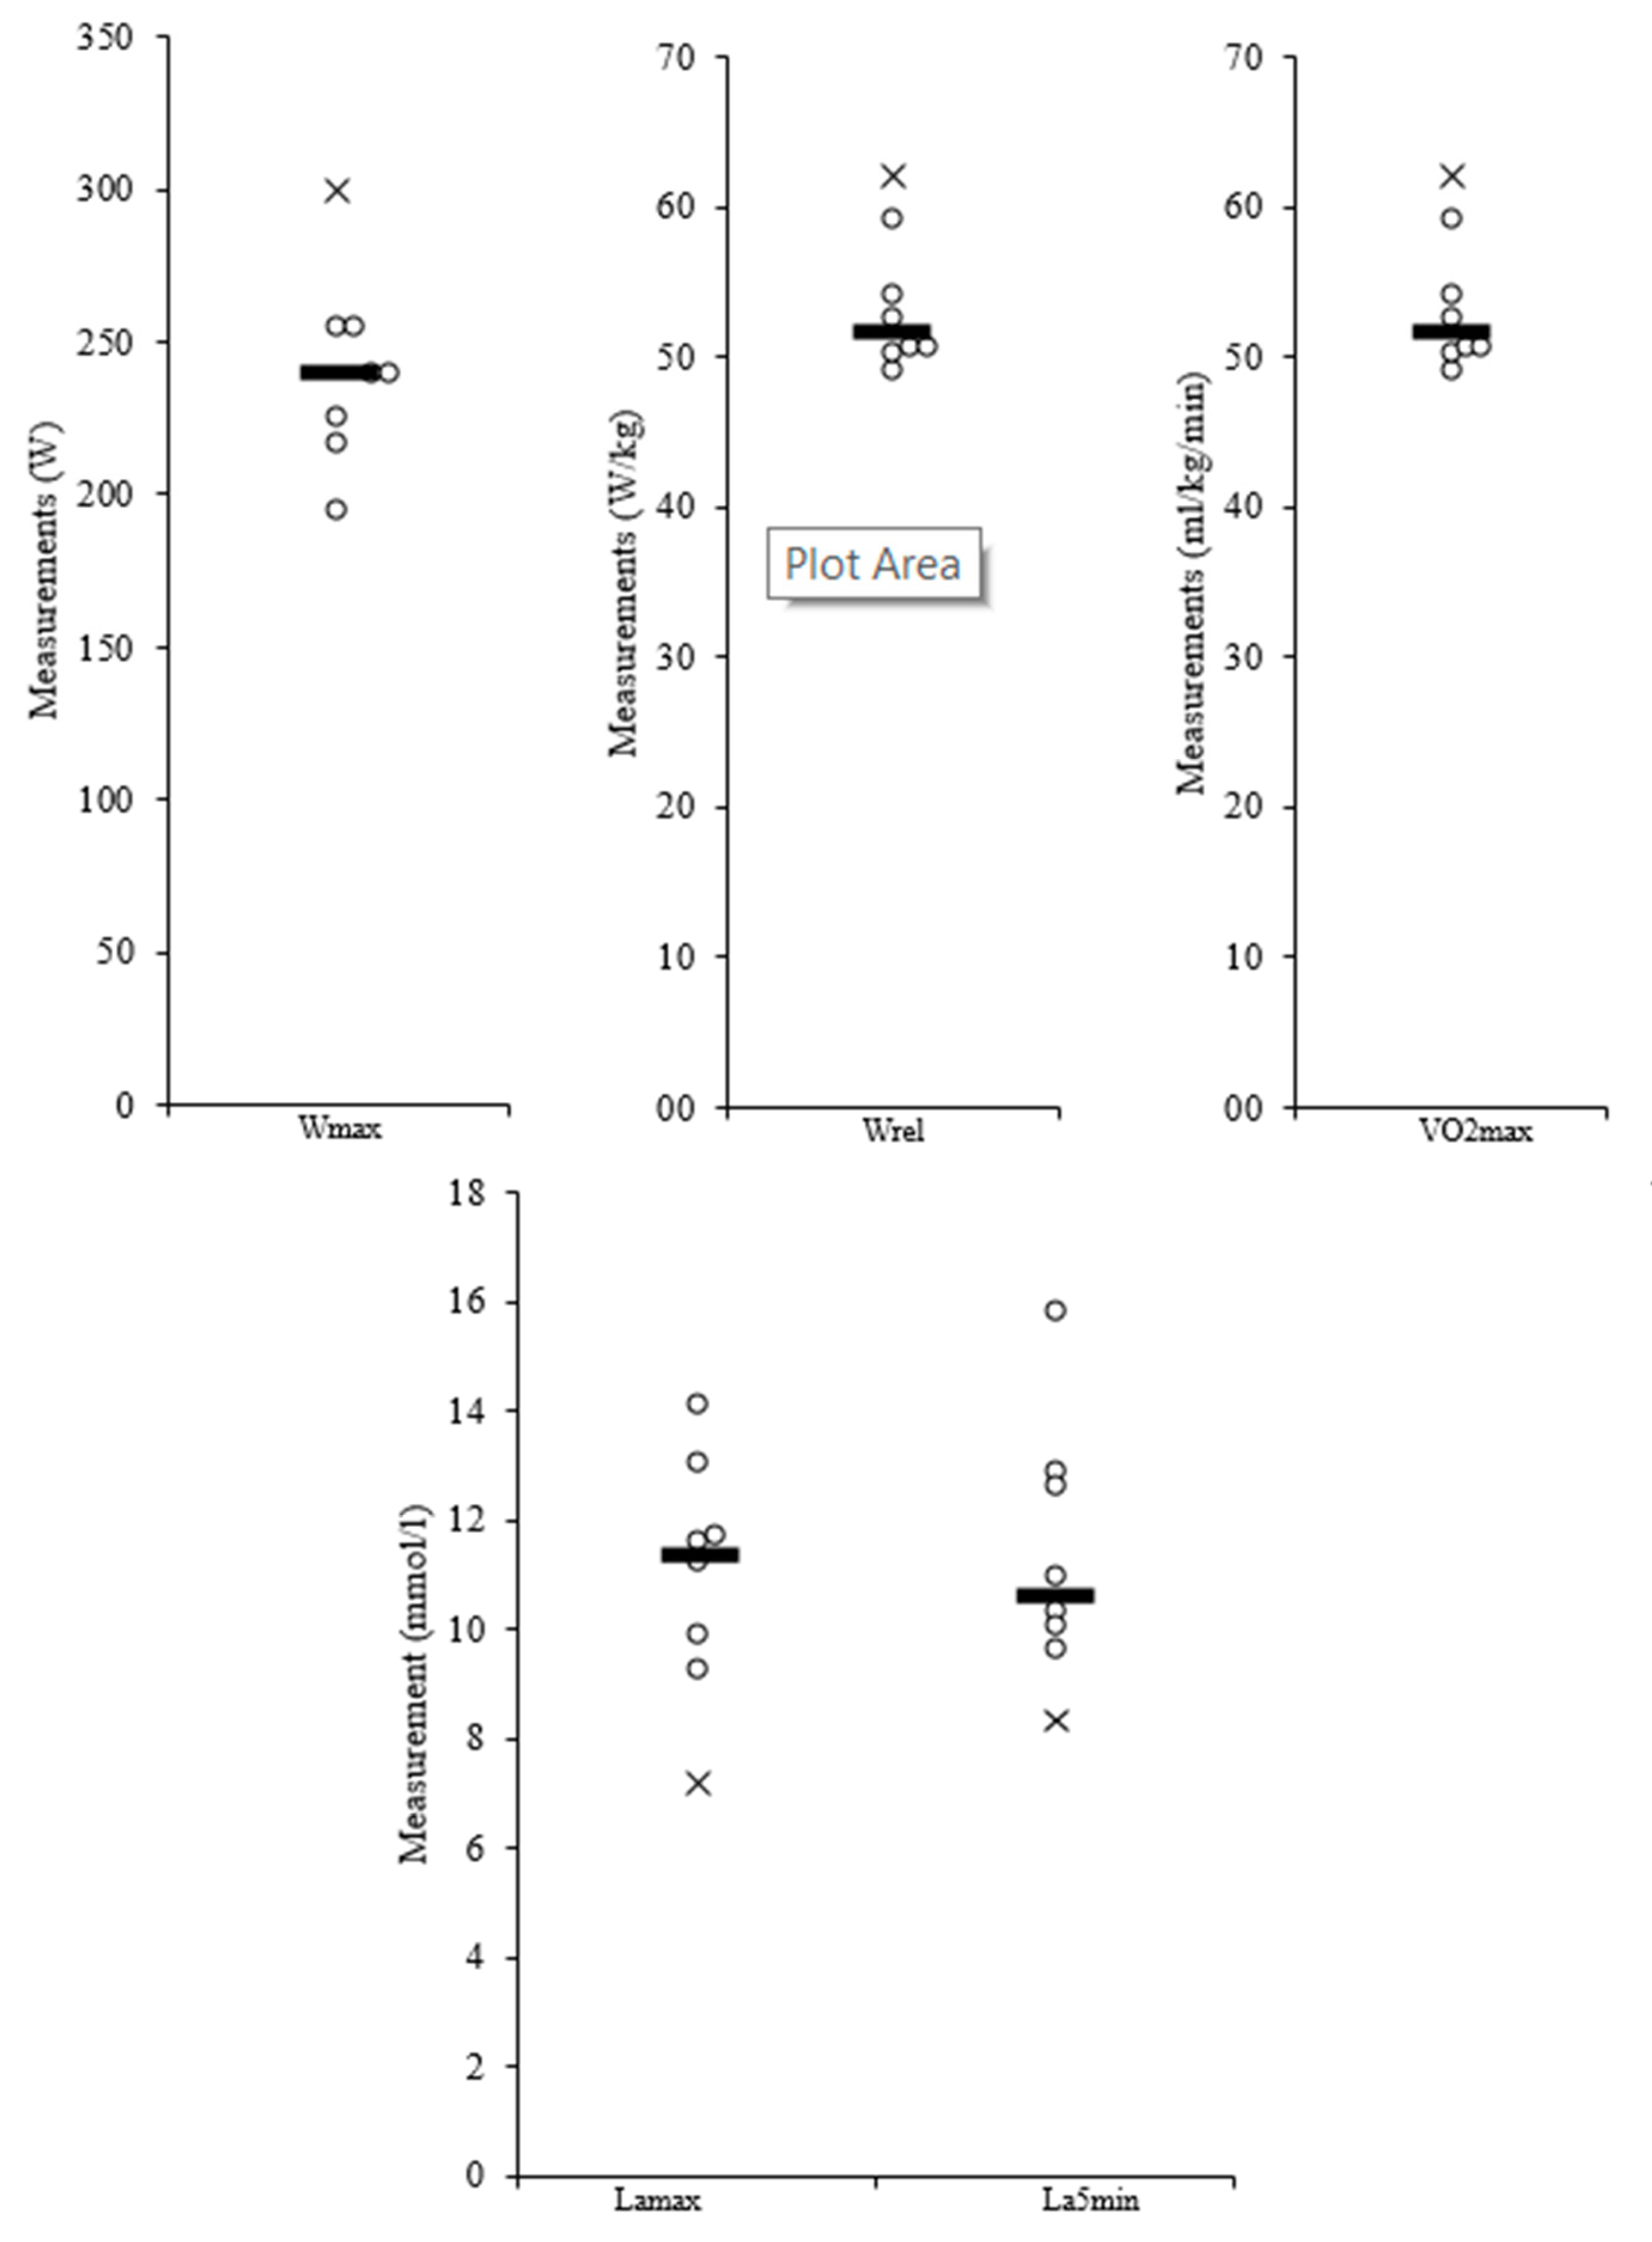
Performance-related parameters are presented in Table 3 and their scatter plots in Figure 3. We have obtained maximal power output (Wmax), relative power output (Wrel), maximal oxygen consumption (VO2max), lactate values at the end of the test (Lamax), and 5 min after the test (La5min). Mean VO2max was 53.61 mL/min/kg.

Table 3.
Descriptive statistics of all performance-related parameters.
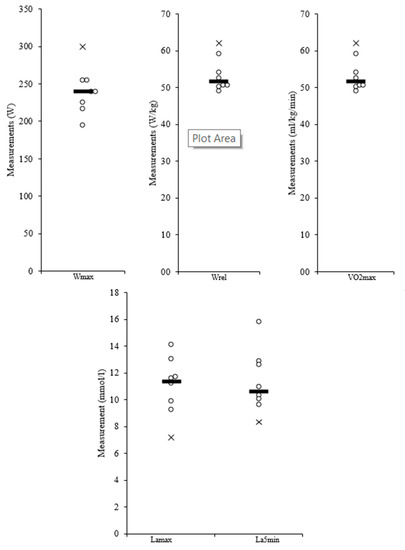
Figure 3.
Scatter plots for performance-related parameters Wmax, Wrel, VO2max, Lamax, and La5min. The x is the value of the participant excluded from further analysis for performance parameters.
Performance-related parameters (Wmax, Wrel, VO2max, Lamax and WDEBneg), body composition parameters (FAT, SMM, FFM) and other parameters related to energy metabolism (EE, EEE, EI, mREE, mREE/pREE) in LEAF+ cyclists did not differ from LEAF− cyclists.
We found significant correlations between WDEB−300 and EA (−0.736, p = 0.037 (2-tailed)) and between WDEB−300 and EB (−0.732, p = 0.039 (2-tailed)). No correlations were found between WDEB−300 and body composition parameters, mREE or mREE/pREE.
Looking into performance, our first analysis failed to show any associations due to a lack of homogeneity in our sample (Figure 3). We excluded one cyclist from further analysis due to probable age impact on performance. When the cyclist was excluded (n = 1, age 30), the sample was more homogenous (n = 7, age 15.71 ± 1.38). In this way, a comparison in performance parameters was possible. As cyclists age and develop, their performance parameters are not the same as in adult athletes. Our research group has previously described how growth and development during this age critically impact performance [24,25]. Performance analysis has shown that there is a significant correlation between WDEB−300 and Lamax at the 0.05 level (r = −0.859, p = 0.006 (2-tailed)). Even more importantly, correlation between Wrel and mRMR/pRMR was significant at the 0.05 level (r = −0.763, p = 0.046).
We did not find any significant correlations with other performance-related parameters (VO2max, Wmax, La5min).
4. Discussion
This study was set to find any impacts of EA and WDEB on performance, with objective methodology in competitive female cyclists. We found that objective measurements supported findings with the LEAF-Q—the prevalence of LEA was high. The parameter for energy conservation (mREE/pREE) was negatively correlated with endurance performance. In addition, we found that WDEB−300 was associated with lactate metabolism in the incremental test.
Looking for ideal body weight to improve their racing results, endurance athletes tend to lose weight or retain low body mass. This is why cycling is a sports discipline with increased LEA prevalence [1,2,26]. In the preparation period, optimal periodization demands the highest training volume. If this is not matched with EI, LEA can occur. This is in accordance with our finding that a great majority (87.5%) had EA < 30 kcal/kg FFM/day. LEA was also confirmed with the LEAF questionnaire, which failed to show an increased risk for LEA in only two subjects, who were false-negative.
The analysis showed that EA was lower and EB was more negative in the LEAF− group, meaning that the results of the LEAF questionnaire successfully pointed to actual values, as measured directly on competitive cyclists. Unfortunately, in this sample, there were no significant differences in other energy- and performance-related parameters when subjects were grouped by the LEAF-Q. Competitive female cyclists are less studied than their male counterparts, and research with a greater sample size could reveal more in terms of performance differences. In addition, LEAF-Q merely finds a risk for LEA and is not a perfect tool for detecting the energy status of an athlete. This could also be the reason why we did not find any mREE, pREE, or even mREE/pREE differences across groups. This study thus failed to support the work by Fahrenholtz et al. that successfully showed that mREE/pREE was associated with energy deficiency. Unfortunately, only one subject reached the criteria for “reduced mREE/pREE” (<0.9), and no correlations were found to any other energy parameters (EI, EE, EEE, EA, or EB). All other participants had a ratio above 1. This is not in accordance with some other studies [3,5,6,27], and more research is needed to support the hypothesis that mREE/pREE < 0.9 is a possible marker for LEA. A reason for the inability to show such low values in this paper is that EPOC and related processes may have a much longer “washout” period than the 12 h that were a part of our procedure before measuring REE. Future research might need to include a longer activity-free period before measuring REE than the standard 12 h. We also failed to show any differences in body composition.
Although groups did not differ in mREE/pREE and we failed to find any correlation to EA, this ratio was negatively associated with endurance performance, as reflected by Wrel. This indicates that mREE/pREE might indeed be useful. Energy conservation, as reflected by the ratio, could lead to suboptimal endurance capacity in more ways. One of them is that while EA might still be sufficient to support health, there is too little energy for optimal recovery after training (protein synthesis for muscle regeneration, replenishing energy stores, supporting hormones like IGF-1). As we lack blood markers and direct observation of glycogen stores, we can only speculate whether such data would provide some further explanations. If this ratio would prove to be useful in the early detection of performance changes before evident clinical signs like amenorrhea appear, this could be much simpler and more cost-effective than the actual measurement of EA. More studies are needed to draw any final conclusions.
Finally, this study showed that WDEB−300 is negatively associated with lactate values at the end of the incremental test. More time spent in energy deficiency results in lower maximal lactate. The inability to raise lactate values in the 100 + 20 W incremental cycling test in these national-level cyclists more likely reflect poor substrate utilization than poor physical form. Low glycogen stores and the inability to support optimal recovery and growth and substrate utilization during maximal load are reasons that have been proposed before. We did not find any association between WDEBneg and performance. This suggests that the severity of energy deficiency (as observed by WDEB−300) could potentially have an impact on anaerobic metabolism rather than just time spent in energy deficiency (as reflected by WDEBneg). This is further supported by our observation from diary logs that the majority of participants had poor or absent EI during long strenuous activities, which resulted in greater hours spent in WDEB−300. Better nutritional practices are widely recommended to support optimal performance and recovery [28].
With this paper, we would like to confirm that among female cyclists, EI is especially problematic during training as they seem to be avoiding (excess) carbohydrate intake. The lactate values at the end of the test reflect anaerobic metabolism. The inability to raise these values can reflect poor physical form, overtraining, or suboptimal substrate utilization. As cyclists involved in this study were top national contenders, the last two options seem more likely. Lactate metabolism reflects the ability to perform in anaerobic metabolism. Two theoretical mechanisms could explain the result of our study. We did not measure glycogen levels directly, but it is known that spending more time in a catabolic state that fails to fill glycogen stores could result in a suboptimal glycogen reserve at the beginning of training [29]. This would support fat metabolism soon after starting physical activity. Fat metabolism is, unfortunately, not as effective when anaerobic metabolism takes place during high training loads [30]. This leads to lactate values that are not as high as in optimal circumstances. The other possibility is the failure to use the glycogen storage, as almost all cyclists failed to replenish carbohydrates during any training. This could also propagate fat metabolism even when glycogen stores are not empty due to failure in optimal substrate utilization.
To our knowledge, this is the first study to investigate performance and WDEB in competitive female cyclists. This research demonstrates that performance in professional female cyclists might be more dependent on daily fluctuations in energy balance rather than on EA. In the future, more studies, including blood markers and actual racing results, might be sensible in supporting the finding of this paper. We would also like to suggest future research should use WDEB and direct EA measurement for the categorization of participants in research assessing LEA performance effects rather than questionnaires such as LEAF. This might provide useful insight into the mechanism of LEA impairing performance. A possible practical application of this study is that cyclists could benefit from measuring REE. A decline in their mREE could be an indicator of impaired endurance performance. More studies are needed to provide final conclusions.
The authors would like to acknowledge some limitations of this study. Baseline individual differences are not completely accounted for. Behavioral patterns have not been studied in this paper, and temporal analyses [31] that could have an impact on performance have not been used [32]. All participants included in the performance analysis were from the same cycling team, competing at the same level. This is how we tried to eliminate any major differences in baseline performance characteristics. This study is not properly powered due to the suboptimal sample size. However, measurements of LEA are time consuming and exhausting for the athletes, and it is difficult to obtain proper participation. Furthermore, when facing a specific sports discipline such as female cycling, it is even harder to obtain top-level athletes as their number is limited. Therefore, we believe that in spite of the low sample size, our data are valuable for sports professionals working with female cyclists. Additionally, our findings can be used for sample size calculations in future studies. Another limitation is the lack of common blood markers and/or glycogen levels, but the main aim of our study was to address performance and not just physiological changes.
5. Conclusions
Competitive female cyclists could benefit in performance if WDEB is measured in those that exhibit suboptimal nutritional practices or have positive results in the LEAF questionnaire. Reducing the time spent in a catabolic state could result in greater aerobic and anaerobic performance.
Author Contributions
Conceptualization, I.J.; data curation, I.J.; formal analysis, I.J.; funding acquisition, V.H.; investigation, I.J.; methodology, I.J. and S.R.; project administration, I.J.; resources, I.J.; software, I.J.; visualization, I.J.; writing—original draft, I.J.; writing—review and editing, I.J., V.H., and S.R. All authors have read and agreed to the published version of the manuscript.
Funding
This research received no external funding.
Acknowledgments
We would like to acknowledge the tremendous effort by all cyclists who participated in this research while adhering to their strict schedule. This work was supported by the Slovenian Research Agency [P5-0147].
Conflicts of Interest
The authors declare no conflict of interest.
References
- Mountjoy, M.; Sundgot-Borgen, J.; Burke, L.; Carter, S.; Constantini, N.; Lebrun, C.; Meyer, N.; Sherman, R.; Steffen, K.; Budgett, R.; et al. The IOC consensus statement: Beyond the Female Athlete Triad—Relative Energy Deficiency in Sport (RED-S). Br. J. Sports Med. 2014, 48, 491–497. [Google Scholar] [CrossRef] [PubMed]
- Mountjoy, M.; Sundgot-Borgen, J.; Burke, L.; Ackerman, K.E.; Blauwet, C.; Constantini, N.; Lebrun, C.; Lundy, B.; Melin, A.; Meyer, N.; et al. International Olympic Committee (IOC) Consensus Statement on Relative Energy Deficiency in Sport (RED-S): 2018 Update. Int. J. Sport Nutr. Exerc. Metab. 2018, 28, 316–331. [Google Scholar] [CrossRef] [PubMed]
- Vanheest, J.L.; Rodgers, C.D.; Mahoney, C.E.; De Souza, M.J. Ovarian suppression impairs sport performance in junior elite female swimmers. Med. Sci. Sports Exerc. 2014, 46, 156–166. [Google Scholar] [CrossRef] [PubMed]
- Tornberg, Å.B.; Melin, A.; Koivula, F.M.; Johansson, A.; Skouby, S.; Faber, J.; Sjödin, A. Reduced Neuromuscular Performance in Amenorrheic Elite Endurance Athletes. Med. Sci. Sports Exerc. 2017, 49, 2478–2485. [Google Scholar] [CrossRef] [PubMed]
- Woods, A.L.; Garvican-Lewis, L.A.; Lundy, B.; Rice, A.J.; Thompson, K.G. New approaches to determine fatigue in elite athletes during intensified training: Resting metabolic rate and pacing profile. PLoS ONE 2017, 12, e0173807. [Google Scholar] [CrossRef] [PubMed]
- Woods, A.L.; Rice, A.J.; Garvican-Lewis, L.A.; Wallett, A.M.; Lundy, B.; Rogers, M.A.; Welvaert, M.; Halson, S.; McKune, A.; Thompson, K.G. The effects of intensified training on resting metabolic rate (RMR), body composition and performance in trained cyclists. PLoS ONE 2018, 13, e0191644. [Google Scholar] [CrossRef]
- Melin, A.; Tornberg, Å.B.; Skouby, S.; Faber, J.; Ritz, C.; Sjödin, A.; Sundgot-Borgen, J. The LEAF questionnaire: A screening tool for the identification of female athletes at risk for the female athlete triad. Br. J. Sports Med. 2014, 48, 540–545. [Google Scholar] [CrossRef]
- Logue, D.M.; Madigan, S.M.; Melin, A.; Delahunt, E.; Heinen, M.; Mc Donnell, S.J.; Corish, C.A. Low energy availability in athletes 2020: An updated narrative review of prevalence, risk, within-day energy balance, knowledge, and impact on sports performance. Nutrients 2020, 12, 835. [Google Scholar] [CrossRef]
- Ackerman, K.E.; Holtzman, B.; Cooper, K.M.; Flynn, E.F.; Bruinvels, G.; Tenforde, A.S.; Popp, K.L.; Simpkin, A.J.; Parziale, A.L. Low energy availability surrogates correlate with health and performance consequences of Relative Energy Deficiency in Sport. Br. J. Sports Med. 2018, 53, 628–633. [Google Scholar] [CrossRef]
- Torstveit, M.K.; Fahrenholtz, I.; Stenqvist, T.B.; Sylta, Ø.; Melin, A. Within-day Energy Deficiency and Metabolic Perturbation in Male Endurance Athletes. Int. J. Sport Nutr. Exerc. Metab. 2018, 28, 419–427. [Google Scholar] [CrossRef]
- Fahrenholtz, I.L.; Sjödin, A.; Benardot, D.; Tornberg, Å.B.; Skouby, S.; Faber, J.; Sundgot-Borgen, J.K.; Melin, A.K. Within-day energy deficiency and reproductive function in female endurance athletes. Scand. J. Med. Sci. Sports 2018, 28, 1139–1146. [Google Scholar] [CrossRef] [PubMed]
- Deutz, R.C.; Benardot, D.; Martin, D.E.; Cody, M.M. Relationship between energy deficits and body composition in elite female gymnasts and runners. Med. Sci. Sports Exerc. 2000, 32, 659–668. [Google Scholar] [CrossRef] [PubMed]
- Mountjoy, M.L.; Burke, L.M.; Stellingwerff, T.; Sundgot-Borgen, J. Relative Energy Deficiency in Sport: The Tip of an Iceberg. Int. J. Sport Nutr. Exerc. Metab. 2018, 28, 313–315. [Google Scholar] [CrossRef] [PubMed]
- Iacovides, S.; Avidon, I.; Baker, F.C. What we know about primary dysmenorrhea today: A critical review. Hum. Reprod. Update 2015, 21, 762–778. [Google Scholar] [CrossRef] [PubMed]
- Brodie, D.; Moscrip, V.; Hutcheon, R. Body composition measurement: A review of hydrodensitometry, anthropometry, and impedance methods. Nutrition 1998, 14, 296–310. [Google Scholar] [CrossRef]
- Westerterp, K.R. Measurement of Energy Expenditure. In Translational Research Methods for Diabetes, Obesity and Cardiometabolic Drug Development; Springer: London, UK, 2015; pp. 169–187. [Google Scholar]
- Compher, C.; Frankenfield, D.; Keim, N.; Roth-Yousey, L. Evidence Analysis Working Group Best Practice Methods to Apply to Measurement of Resting Metabolic Rate in Adults: A Systematic Review. J. Am. Diet. Assoc. 2006, 106, 881–903. [Google Scholar] [CrossRef]
- Harris, J.A.; Benedict, F.G. A Biometric Study of Human Basal Metabolism. Proc. Natl. Acad. Sci. USA 1918, 4, 370–373. [Google Scholar] [CrossRef]
- Guebels, C.P.; Kam, L.C.; Maddalozzo, G.F.; Manore, M.M. Active women before/after an intervention designed to restore menstrual function: Resting metabolic rate and comparison of four methods to quantify energy expenditure and energy availability. Int. J. Sport Nutr. Exerc. Metab. 2014, 24, 37–46. [Google Scholar] [CrossRef]
- Torstveit, M.K.; Fahrenholtz, I.L.; Lichtenstein, M.B.; Stenqvist, T.B.; Melin, A.K. Exercise dependence, eating disorder symptoms and biomarkers of Relative Energy Deficiency in Sports (RED-S) among male endurance athletes. BMJ Open Sport Exerc. Med. 2019, 5, e000439. [Google Scholar] [CrossRef]
- De Weir, J.B.V. New methods for calculating metabolic rate with special reference to protein metabolism. J. Physiol. 1949, 109, 1–9. [Google Scholar] [CrossRef] [PubMed]
- Buckinx, F.; Landi, F.; Cesari, M.; Fielding, R.A.; Visser, M.; Engelke, K.; Maggi, S.; Dennison, E.; Al-Daghri, N.M.; Allepaerts, S.; et al. Pitfalls in the measurement of muscle mass: A need for a reference standard. J. Cachexia. Sarcopenia Muscle 2018, 9, 269–278. [Google Scholar] [CrossRef] [PubMed]
- Reed, G.W.; Hill, J.O. Measuring the thermic effect of food. Am. J. Clin. Nutr. 1996, 63, 164–169. [Google Scholar] [CrossRef] [PubMed]
- Jurov, I.; Kajtna, T.; Milić, R.; Rauter, S. Recovery and Dietary Factors as Predictors of Physiological Parameters in Cyclists. Med. Sport 2020, 73, 220–230. [Google Scholar]
- Rauter, S.; Vodicar, J.; Simenko, J. Body Asymmetries in Young Male Road Cyclists. Int. J. Morphol. 2017, 35, 907–912. [Google Scholar] [CrossRef][Green Version]
- Burke, L.M.; Close, G.L.; Lundy, B.; Mooses, M.; Morton, J.P.; Tenforde, A.S. Relative Energy Deficiency in Sport in Male Athletes: A Commentary on Its Presentation Among Selected Groups of Male Athletes. Int. J. Sport Nutr. Exerc. Metab. 2018, 28, 364–374. [Google Scholar] [CrossRef]
- Koehler, K.; Williams, N.I.; Mallinson, R.J.; Southmayd, E.A.; Allaway, H.C.M.; De Souza, M.J. Low resting metabolic rate in exercise-associated amenorrhea is not due to a reduced proportion of highly active metabolic tissue compartments. Am. J. Physiol. Endocrinol. Metab. 2016, 311, E480–E487. [Google Scholar] [CrossRef]
- Wells, K.R.; Jeacocke, N.A.; Appaneal, R.; Smith, H.D.; Vlahovich, N.; Burke, L.M.; Hughes, D. The Australian Institute of Sport (AIS) and National Eating Disorders Collaboration (NEDC) position statement on disordered eating in high performance sport. Br. J. Sports Med. 2020, 54, 1247–1258. [Google Scholar] [CrossRef]
- Burke, L.M.; Cox, G.R.; Culmmings, N.K.; Desbrow, B. Guidelines for daily carbohydrate intake: Do athletes achieve them? Sports Med. 2001, 31, 267–299. [Google Scholar] [CrossRef]
- Burke, L.M.; Ross, M.L.; Garvican-Lewis, L.A.; Welvaert, M.; Heikura, I.A.; Forbes, S.G.; Mirtschin, J.G.; Cato, L.E.; Strobel, N.; Sharma, A.P.; et al. Low carbohydrate, high fat diet impairs exercise economy and negates the performance benefit from intensified training in elite race walkers. J. Physiol. 2017, 595, 2785–2807. [Google Scholar] [CrossRef]
- Casarrubea, M.; Magnusson, M.S.; Roy, V.; Arabo, A.; Sorbera, F.; Santangelo, A.; Faulisi, F.; Crescimanno, G. Multivariate temporal pattern analysis applied to the study of rat behavior in the elevated plus maze: Methodological and conceptual highlights. J. Neurosci. Methods 2014, 234, 116–126. [Google Scholar] [CrossRef]
- Pic, M. Performance and Home Advantage in Handball. J. Hum. Kinet. 2018, 63, 61–71. [Google Scholar] [CrossRef] [PubMed]
Publisher’s Note: MDPI stays neutral with regard to jurisdictional claims in published maps and institutional affiliations. |
© 2020 by the authors. Licensee MDPI, Basel, Switzerland. This article is an open access article distributed under the terms and conditions of the Creative Commons Attribution (CC BY) license (http://creativecommons.org/licenses/by/4.0/).

