Abstract
In the early stage of product development, reliability evaluation is an indispensable step before launching a product onto the market. It is not realistic to evaluate the reliability of a new product by a host of reliability tests due to the limiting factors of time and test costs. Evaluating the reliability of products in a short time is a challenging problem. In this paper, an approach is proposed that combines a group of experts’ judgments and limited failure data. Novel features of this approach are that it can reflect various kinds of information without considering the individual weight and reduces aggregation error in the uncertainty quantification of multiple inconsistent pieces of information. First, an expert system is established by the Bayesian best–worst method and fuzzy logic inference, which collects and aggregates a group of expert opinions to estimate the reliability improvement factor. Then, an adaptive Bayesian melding method is investigated to generate a posterior by inaccurate prior knowledge and limited test data; this method is made more computationally efficient by implementing an improved sampling importance resampling algorithm. Finally, an application for the reliability evaluation of a subsystem of a CNC lathe is discussed to illustrate the framework, which is shown to validate the reasonability and robustness of our proposal.
1. Introduction
Reliability evaluation is an important process to judge whether a product meets the reliability requirements in the product development (PD) process. PD is often considered as the most influential process to gain a competitive advantage in different industries [1,2]. The modern industrial field needs to constantly update old products and introduce new ones to achieve market development; however, reliability evaluation should be done before a new product is launched onto the market.
In order to evaluate the reliability of products, Bayesian inference [3], the expectation– maximization algorithm [4], MLE [5], non-linear Benard’s median rank [6] and the Weibull probability plot [7] were developed. By these traditional methods, enough failure data need to be collected as the basis for reliability assessment. However, it is highly desirable to obtain a large amount of failure data on a product through extensive testing, which is very expensive, and the large amount of time and resources required makes it impractical. Limited failure data are prevalent in the industry due to the high reliability of products, which has been caused by technological advances and the testing time and budget constraints imposed by the competitive market. Risk managers need to make decisions with limited failure data [8]. NASA tested the xenon thruster through 30,352 h of testing, handling more than 495 kg of xenon propellant to validate the thruster life model and demonstrate the thruster’s propellant swallowing capability [9]. While a detailed analysis of each failure is highly desirable, it is also very expensive. The significant amount of time and resources required makes it impractical [10].
In recent years, some researchers have conducted evaluations of the reliability of products in the early stage of PD. Yadav et al. [11] proposed a framework to evaluate the reliability of a new product in the early stage of PD and used fuzzy inference methods to combine and quantify subjective information to reflect its impact on product reliability. Chan, Ip and Zhang [12] proposed a quality assurance method that incorporates risk analysis and failure analysis in the design phase of medical PD and predicted product failure and risk by the Markov chain technique. Wang et al. [13] provided a comprehensive evaluation of product reliability to evaluate a new product, integrating Bernoulli data, lifetime data and degradation data. Degradation data can provide important information for reliability assessment, and evaluation based on degradation has been studied extensively [14]. Although degradation data could provide a great deal of information on reliability over a certain period, nevertheless, it is not suitable for new products with unclear or diverse failure mechanisms, such as complex systems.
Expert judgment plays a relevant role in supporting the validity and scientific rigor of the reliability analysis [15], and experts can provide judgments regarding new products based on their experience and information on old products, which could be regarded as an important source for reliability evaluation. Nevertheless, experts’ judgments are subjective, and the judgement of experts in various fields should be incorporated. Therefore, the further refinement of expert judgment analysis is needed to make the experts’ decisions robust, but affordable and suitable for different applications [15,16]. In addition, limited failure data represent an important foundation for reliability evaluation, and thus a well-established framework or methodology is necessary to develop that integrates a variety of expert information combined with other prior information to evaluate the reliability of a new product in the early stage of PD.
In this paper, we only obtain limited failure data due to time and cost constraints. If quantitative failure data are inappropriate or inadequate, only qualitative data, such as expert opinions described in words, can be used to assess the safety and reliability of the system. The reliability scores of new products, expressed as fuzzy numbers or linguistic variables, are combined and processed by fuzzy inference methods so that experts can better judge the reliability level through their experience. To fuse experts’ judgments and limited failure data, Bayesian inference is used, which is a common method that is used to combine multiple sources of information. A practical framework is proposed to evaluate the reliability of a new product; this framework fully considers the capture of expert information and the fusion of all prior information, and these priors can be aggregated at once without needing to consider the weights of priors. First, an expert system is derived by the Bayesian best–worst method and fuzzy logic inference, which aggregates a group of expert decisions. Then, an adaptive Bayesian melding (ABM) method is investigated and modified to integrate experts’ judgments and limited test data, and a modified sampling importance resampling algorithm is employed to obtain the posterior distribution. Finally, this framework is applied to the evaluation of a new type of servo turret, which is an important subsystem of a CNC lathe.
The paper is organized as follows. Section 2 presents a review of the existing literature and further justifies the need for our approach. Section 3 establishes an expert system for collecting and aggregating experts’ judgments. Section 4 proposes an adaptive Bayesian melding method to generate the posterior distribution. Section 5 presents a case example and discusses the rationale for this approach. Section 6 draws some conclusions and discusses possible future research.
2. Literature Review
The reliability of a product is affected by multiple criteria, such as technical maturity, structural complexity, quality stability and so on. Multiple Criteria Decision Making (MCDM) has achieved great success as a vital and popular research branch of decision-making theory [17]. The analytic hierarchy process (AHP) is often used to determine the weight of each criterion as a utility-based MCDM technique. Simultaneously, Rezaei [18] proposed the best–worst method (BWM) to improve the efficiency of calculations and obtain more reliable results, and it has been widely used for risk assessment [19,20] and in supply chain management [21,22]. Furthermore, Mohammadi and Rezaei [23] introduced Bayesian theory into BWM; their approach finds the optimal weights of a set of criteria based on a group of experts. However, we not only need to obtain the weight of each criterion but also have experts quantitatively evaluate the reliability of the product against each criterion. A group of experts should be invited to evaluate the product to reduce subjectivity, and thus an expert system should be established that can collect and integrate evaluations to better reflect experts’ judgments.
Some objective data need to be simultaneously aggregated with the experts’ judgments. Information can be integrated from behavioral and mathematical perspectives. The behavioral approach is established to generate some type of group consensus among experts, often encouraging them to communicate with each other and share their opinions. In contrast to the behavioral approach, the mathematical approach maintains independence and prevents the biases that may arise due to their extensive interaction, and the outcome of the assessment is not controlled or even determined by a single expert [24]. In this paper, we only discuss the mathematical approach. Cai et al. [25] aggregated a small set of experts by a nonlinear function and proposed a linear feedback iteration scheme to solve the nonlinear function. Che et al. [26] established a multi-source information fusion technique that employed evidence theory, probability theory and information entropy—an example is used to elaborate the operation mechanism. Li et al. [27] developed a physics of failure-based reliability prediction method by multi-source information fusion, and this method is used to predict the reliability of the turbine blades of aero engines. Bayesian inference is a common method used to pool different information together and has been used for fault diagnosis [28,29], reliability evaluation [30,31] and residual life prediction [32,33]. These models and methods supplement the necessary foundation for the reliability evaluation of new products. Johnson et al. [34] developed a hierarchical Bayesian model to evaluate the reliability of complex systems in the early stage when no system-level fault data are available. Peng et al. [30] proposed a Bayesian model updating approach and constructed an information integration toolkit and information transition toolkit. Yontay and Pan [35] generalized a method for evaluating the reliability of a system; this method combined information from multiple sources and multiple levels of the system by a Bayesian network approach. Guo et al. [36] introduced the Bayesian melding method (BMM) for system reliability assessment with multi-source information, which includes the subsystem and system information. Under such a scenario, it is important to develop a well-established framework or methodology that can incorporate multiple inconsistent priors into a unified model, especially when the reliability test data are limited in the early stages of PD.
In this paper, we only obtain limited failure data due to time and cost constraints. If quantitative failure data are inappropriate or inadequate, only qualitative data, such as expert opinions described in words, can be used to assess the safety and reliability of the system. The reliability scores of new products, expressed as fuzzy numbers or linguistic variables, are combined and processed by fuzzy inference methods so that experts can better judge the reliability level of a product from their experience. To fuse experts’ judgments and limited failure data, Bayesian inference is used, which is a common method that is used to combine multiple sources of information [19,28]. There are several limitations of these methods: (i) experts’ judgments are qualitative information, and we need to convert this information into quantitative information; (ii) a group of experts must be invited to evaluate the reliability of new products, and integrating these expert opinions to accurately reflect the advice of experts is a challenge; (iii) a suitable prior should be selected for Bayesian inference.; and (iv) a simulation method must be investigated to calculate the posterior of Bayesian inference.
3. An Expert System to Estimate RIF
An expert system is established to obtain expert evaluations regarding product reliability, which contains a collection of expert-level knowledge and experience in a field and is capable of utilizing human expert knowledge and problem-solving methods to evaluate the reliability of a new product. In this paper, the established expert system uses Bayesian BWM to obtain the weight of each criterion and fuzzy inference to obtain experts’ judgments, respectively.
Experts’ judgments are subjective linguistic pieces of information that need to be converted to a mathematical form. Experts can also refer to some similar product reliability information, such as mean time between failure (MTBF) and failure rate. To obtain the subjective data of the experts through this subjective comparison, the intermediate quantity of the reliability improvement factor (RIF) is introduced as
where and are the reliability index (e.g., MTBF, failure rate) of the new products and old products, respectively.
As the reliability of products is determined by multiple standards, so is RIF. The expert system in this paper is composed of a group of experts, and it is therefore necessary to aggregate the judgments of experts. Suppose that criteria are considered to have an impact on product reliability; the aggregated weight of each criterion and aggregated experts’ judgments of each criterion of RIF are proposed to determine the RIF as Equation (2) shown. In this paper, the BMW method and fuzzy logic inference are adopted for obtaining and , respectively.
3.1. Bayesian Best–Worst Method
The BWM was proposed by Rezaei and applied in multi-criteria decision-making techniques to determine the weight of criteria [18,20,37]; this method has attracted many scholars’ attention due to its efficiency and good performance in maintaining consistency between judgments [17].
Nevertheless, the BWM can obtain optimal weights of a set of criteria from only one expert. Different experts will give different opinions based on their knowledge background and understanding of the product, and a group of experts’ judgments must therefore be aggregated into a single opinion. Normally, equal weights are given for all experts and the opinions of all people are arithmetically averaged, which results in ignoring the experts’ knowledge, expertise and experience. On the other hand, if each expert gives different weights based on their experience, the opinions of the higher-scoring experts will dominate the results [38]. There are indeed some studies that have been conducted on multiple BWMs as listed below, which were used to fuse the opinions of a group of experts [39,40]. However, these methods did not determine the final weight of the group by probability. While the Bayesian BWM computes the aggregated distribution and all the individual preferences at once using probabilistic modeling, at the same time, we can check the ranking of the weights from a probabilistic point of view [23,41]. If the relationship between the two criteria is associated with a high confidence level, the panel will be more certain, while a low-confidence-level relationship should be interpreted more carefully.
In this paper, we introduced Bayesian BWM to obtain the aggregated criterion without needing to consider expert weights; the steps of this are as follows:
- Determination of criteriaA set of criteria is determined that impact the reliability of a product.
- Determination of the best and worst criteriaThe best and worst criteria represent the criteria that have the most influential and least significant impact on the reliability of the set of criteria C. Each expert should select the best and the worst criteria from the set of criteria.
- Determination of vectors of the best-to-others and others-to-worst vectorsBased on step 2, the relative importance of the best criteria to others, and of the worst to others, can be obtained. The best-to-others and others-to-worst vectors are defined as follows:where indicates the relative importance of the best of the criteria ; similarly,where indicates the relative importance of the worst to other criteria .
- Determination of the aggregated weightThe aggregated weight is calculated by each expert’s optimal weight , and the Bayesian BWM can simultaneously calculate and . The best-to-others and others-to-worst vectors make up the priors that could be considered to be posterior. Thus, the following joint probability distribution is sought , which is the posterior of Bayesian inference. The distribution of the aggregated weight prior is assumed to follow the Dirichlet distribution, and is the likelihood function; thus, by the Bayes rule, the posterior distribution could be written asThere is not a closed-form solution for Equation (5); thus, the Markov-chain Monte Carlo (MCMC) approach is used to obtain the posterior.
3.2. Fuzzy Logic Inference
Experts’ judgments are uncertain as they cannot determine a crisp value of RIF for each criterion, and some studies have used fuzzy theory to obtain experts’ judgments [42,43,44]. A fuzzy judgment is determined by experts’ knowledge and experience of a product compared to a similar product. For example, for the criteria of technical maturity, they may choose variables such as negligible, low or high.
Suppose that a membership function corresponds to any fuzzy set A in the universe of discourse U. is the membership of A to U. describes that x is the full member of A, while means non-membership. The most common fuzzy number is the triangular fuzzy number, and the membership function of triangular fuzzy number can be described as
Because the RIF is determined by the fuzzy number, we need to diffuse the fuzzy number to obtain a crisp number. The centroid of the area is the most frequent method used for defuzzification [45]. The center of gravity of the triangular fuzzy number is also its mean value, which is defined as
where X is the crisp number of defuzzification, is the aggregated membership function and x is variable.
A group of experts give their judgments about the RIF for each criterion. As experts’ judgments are described by fuzzy logic, the similarity aggregation method is used to aggregate the opinions of a homogeneous/heterogeneous group of experts. Finally, the aggregated experts’ judgments for the RIF of the ith criterion can be calculated as
where is the consensus coefficient degree of expert i and is the judgment of expert i.
4. An Adaptive Bayesian Melding Method
In the routine Bayesian method, we usually derive prior probabilities based on experts’ judgments and build the available data into a likelihood function; then, the posterior is obtained by successive updates to the prior [46]. In contrast, we have induced priors and a direct prior in this paper, which are two different priors. The Bayesian melding method has been extensively used to combine various priors into a corresponding posterior. This method initially was used to infer deterministic simulation models [47], and it has been used in the field of predicting air pollution [48], marine mammal tracking [19] and reliability analysis [36,46]. In this paper, an adaptive Bayesian melding method is investigated and modified to reduce the error of aggregation.
Suppose that and are parameters used to model the subsystem and system reliability. and are priors from experts’ judgments for each subsystem and the system reliability test. The relationship between the system and subsystems can be described by a deterministic model , . If is revertible, the induced system prior distribution could be described as
where is the Jacobian matrix.
In order to pool the induced prior and natural prior together, it has been proven that the logarithmic pooling operator is the only pooling operator that is externally Bayesian; thus, the pooled system is
where is the pooling weight.
After that, a new prior distribution , named the updated subsystem prior, can be obtained. However, the deterministic model is irreversible for a regular system, because the system is made up of several subsystems; in other words, the dimension of is less than that of . The most reasonable method is split by the proportion to the subsystem as
The posterior distribution is obtained as
where and are likelihood functions of and .
The pooling weight balances the contribution of the natural prior and induced prior distribution, and a fixed value is usually selected as the weight. For some practical cases in which the prior information is imperfect, fixed pooled weights may lead to significant estimation errors. Yang et al. [46] proposed an adaptive Bayesian melding method that introduced the uniform distribution as the prior of weights. The uniform distribution is a special case of beta distribution; the beta distribution offers considerable flexibility and ease of use, and it satisfies the required properties of weights very well. In this paper, the beta distribution is introduced as the prior of weights to simulate various probability distributions.
Meanwhile, as shown in Equation (12), the posterior distribution inference includes the prior distribution, pooling weight and likelihood function, and it is too difficult to obtain an analytic solution. Sampling importance re-sampling (SIR) is a common method that is used to compute the posterior distribution based on complex prior information. However, a biased estimate would be obtained due to the unevenly distributed high-importance weights by the SIR method; that is, a few extremely large weights dominate the entire resampling process, so it is highly unlikely that other small weighted samples will be generated. To avoid the concentration of posterior sets caused by large weights, a wider sample range was explored by splitting the larger weights into smaller ones, which also proved that the results remained unbiased [49]. The process of inferring a posterior based on the ABM method is shown in Figure 1 and listed as follows:
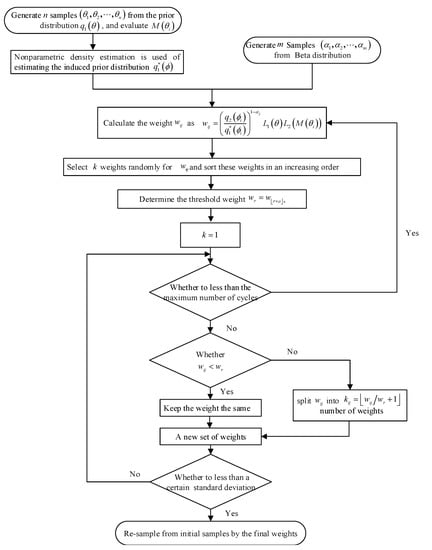
Figure 1.
The process of inferring a posterior based on the adaptive Bayesian melding (ABM) method.
- Step 1
- Generate n samples from the subsystem prior distribution and generate m samples from the beta distribution;
- Step 2
- Nonparametric density estimation is used to estimate the induced prior distribution ;
- Step 3
- Calculate the weight as
- Step 4
- Select a weights randomly for and sort these weights in increasing order;
- Step 5
- Determine the threshold weight , where r is an empirical threshold percentage, and is the floor value of ;
- Step 6
- Examine all importance weights and split any weight into number of weights to re-sample the corresponding ;
- Step 7
- Repeat steps 4–6 until the weights reach a certain deviation;
- Step 8
- Re-sample from the initial samples by the final weights of step 7.
5. A Case Study
5.1. Problem Description
The servo turret is a complex electromechanical hydraulic subsystem in a lathe which is directly involved in the machining process and bears the cutting force. A related study showed that the servo turret exhibits the highest failure rate of a CNC lathe [50]. With the continuous upgrading of the servo turret, its MTBF is around 5000 h. However, a reliability test must be carried out after the upgrade of the new product to ensure its quality. If a large amount of fault data are required in the traditional reliability evaluation method, this will not be feasible if we wish to put the product into the market quickly. Due to the complex structure of the servo turret, there are many failure modes, and it is difficult to assess its reliability based on an accelerated test or degradation test. Therefore, the method proposed in this paper is applied for the reliability evaluation of a servo turret with few failure data.
A new turret was designed based on a similar turret. We used the reliability test system to test the reliability of the turret as shown in Figure 2. During the test, a total of four servo turrets were tested, and two faults occurred at 667 h and 2685 h, as shown in Figure 3; the right-censored data were at 570 h, 910 h, 2200 h and 7850 h.
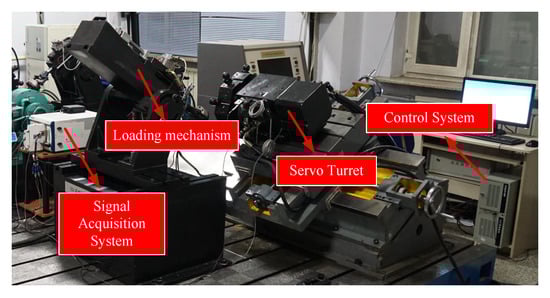
Figure 2.
Reliability test system of the servo turret.
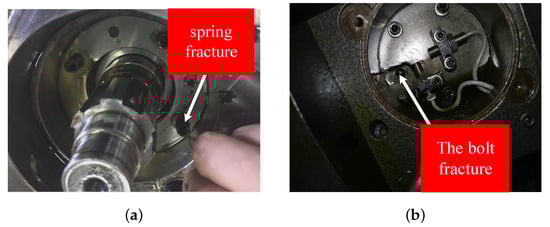
Figure 3.
Two failures in the reliability test: (a) a failure of the lock and loosen component, (b) a failure of the signal component.
5.2. Calculating the RIF for Each Subsystem
Five criteria are used to determine the RIF: structural complexity (S), technical maturity (T), manufacturing stability (M), assembly stability (A) and environmental conditions (E). Five experts were invited to provide their judgments: two of the experts had a Master’s degree in engineering and had been working in the design of servo turrets for five years, two had been in charge of after-sales for six years, and the last expert obtained his doctorate in reliability analysis and also had been working for three years on reliability evaluation. Table 1 shows the “best” and “worst” criteria based on the experts’ judgments. In this paper, we use the scale (1, 2, …, 9) to describe the relevant importance of the “best” or “worst” criteria. The matrices of “best-to-others” and “others-to-worst” are shown in Table 1. The five experts had different judgments for “best”—T, S, A, M, E—while the judgments for “worst” were almost the same—E, E, E, E, A. Furthermore, the “best-to-others” matrices and “worst-to-others” matrices were determined by expert i, where a scale from 1 to 9 was used to evaluate the relative importance, reflecting the preference of the best over others or the others over the worst (the higher the number, the more important the factor). Then, the Bayesian BWM was used to obtain weights as shown in Equation (5) by MCMC: The weights were 0.263, 0.290, 0.184, 0.159 and 0.105.

Table 1.
The “best-to-others” and “worst-to-others” evaluation matrices. S: structural complexity; T: technical maturity; M: manufacturing stability; A: assembly stability; E: environmental conditions.
In this work, we used the linguistic variable as shown in Table 2; then, each expert gave the RIF corresponding to each criterion according to the update to the servo turret and their knowledge. Usually, it is assumed that the lifetime of a product follows some common distribution, and the Weibull distribution is most prominently used. In this work, we used the Weibull distribution to describe the reliability model of the servo turret. Because the working principle of the servo turret did not change, we assumed that the shape parameter did not change in the process of the update but that only the scale parameter possibly did, as shown in Table 3.
Table 2.
The correspondence of linguistic terms and linguistic values.
Table 3.
The reliability model of each subsystem before and after the upgrade. RIF: reliability improvement factor.
One criterion is usually judged to be more important than the other, and we only compare the weights. Mohammadi and Rezaei [23] introduced the notion of creedal ranking that can describe the degree to which one criterion is superior to another, and a directed graph is used for visualization where the nodes are each criterion and each edge indicates that criterion M is more important than at a confidence level of v. Figure 4 shows the credal ranking of criteria by a weight-directed graph. For example, structural complexity (S) is certainly more important than environmental conditions (E), but it is more desirable than manufacturing stability (M) with a confidence of 0.71. The weights obtained by the arithmetic mean are found to be equal for S and T, while the weights obtained by Bayesian BWM are obtained from the probability perspective, as shown in Figure 4. It can be found that the importance of criterion T is higher than S with a confidence interval of 0.63, which means that it is more reasonable for criterion T to be higher than S.
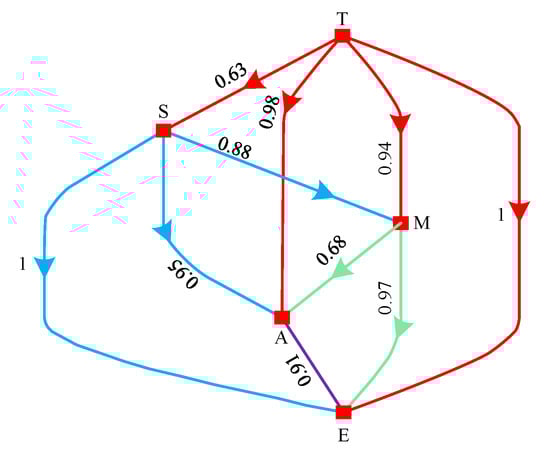
Figure 4.
The weight-directed graph for different criteria.
5.3. Evaluating the Reliability of Servo Turret
As mentioned above, we obtained two failures in the reliability test and could regard others that did not fail as right-censored data. The likelihood function under Weibull distribution is as follows:
where is the shape parameter, is the scale parameter, is the failure time or censored time and is the censoring indicator; if the ith data is censored, , and if it failed.
Taking derivatives of Equation (15) with respect to the parameters and , the following log-likelihood equations are obtained as shown in Equation (15). Thus, the shape parameter and shape parameter .
Based on the above, the prior of the system using limited failure data could be obtained. The posterior could be evaluated by the ABM method combined with experts’ judgements. First, the induced system prior was evaluated based on the system structure, and as the servo turret was a series system, the induced system reliability model was , where is the subsystem reliability distribution. To reflect the need to use ABM, the different weights were compared as shown in Figure 5. It can be seen that the results vary significantly with the pooling weight. In this case, the subsystem prior from the experts and system prior system from the reliability test were used for reliability evaluation, and these priors were collected from different domains. In this case, the subsystem prior information from experts and system prior information from the reliability test were available. It was necessary to aggregate the inconsistent information induced through the expert system and the data-driven observation function. Since this information was collected from different domains, a suitable prior of pooling weights needed to be determined to reduce the error in the uncertainty quantification.
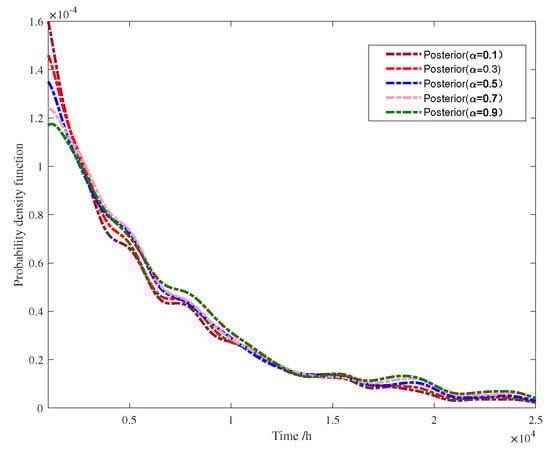
Figure 5.
The posterior of the probability density function by different weights.
Different experts’ judgements were aggregated by the mean and ABM, as proposed by this paper and shown in Figure 6. In practice, it seems reasonable to perform aggregation using a simple equal-weight weighted average; because of the many uncertainties in the assessment, it is difficult to defend the difference in expert weights. However, five experts were invited to estimate the RIF in this paper and covered a very wide range, and the weights assigned as a measure of confidence in the estimates differed greatly. The approach proposed for reliability evaluation in this paper balanced the judgment of these experts and the limited reliability of the test results, obtaining the result by probabilistic modeling and avoiding subjective weight allocation.
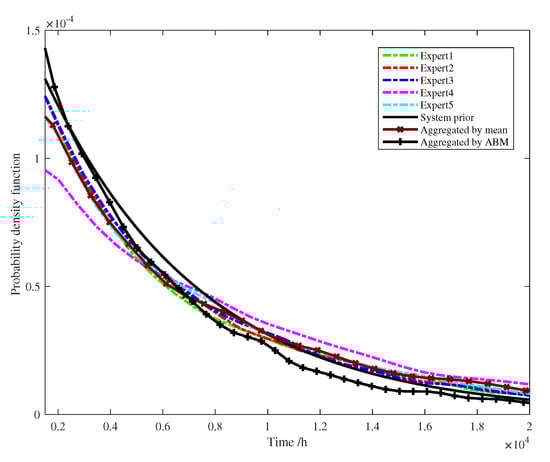
Figure 6.
Comparisons of each expert’s judgment, aggregated by the mean and adaptive Bayes melding (ABM) method.
Finally, the proposed framework was used to evaluate the posterior. The number of original sampled importance weights was set to , the number of selected weights was assigned as , and the percentage parameter for determining the threshold weight value was 90%. The weight splitting process stopped when the standard deviation of importance weights was smaller than 0.01. To use the reliability test data as the main basis for the evaluation, we assumed a priori that the weights obeyed the beta distribution of , . Finally, the mean time of failure time was 5878.31 h, and the 95% credible interval was .
6. Discussion
In this paper, a reliability assessment framework with Bayesian inference was established for a high-reliability product for which limited failure data could be obtained over a period of time. In order to verify the validity and scientifically of the proposed framework, the proposed expert system and different priors for ABM are discussed in this section.
Different experts make different judgments about the criteria by which a products’ reliability are affected, as shown in Table 4; e.g., expert 1 felt that the most important factor was T, while expert 2 stated that the most important factor was S. The results of the Bayesian BWM largely revolved around the mean value for each individual, which also suggested that the Bayesian BWM was valid and reasonable. However, there was a fundamental difference between the two approaches. The arithmetic mean method needs to first calculate the weights of each expert using the BWM method and then average them. whereas the Bayesian BWM calculates the final weights at once by a probability model. Moreover, more information could be obtained by Bayesian BWM, as shown in the figure: it could obtain the extent to which one criterion was superior to the other.
Table 4.
The comparison of the weights obtained by each expert, the arithmetic mean method and the Bayesian best–worst method (BWM).
The ABM method introduced the beta distribution as the prior of weights; in this work, we compared the results obtained by the uniform distribution and beta distribution, as shown in Table 5. Overall, the means obtained by the two methods were essentially the same, but the widths of 95% credible intervals were 258.13 h and 244.80 h, respectively. This shows that the prior by beta distribution was superior both in terms of accuracy and uncertainty reduction.
Table 5.
Comparisons for different priors.
Based on the above analysis, it is clear that the framework proposed in this paper is effective and reliable. The method has the following advantages: (1) the proposed framework not only considers limited failure data, but also introduces an expert system for more information; (2) the established expert system does not need to consider the weight of each opinion, meaning that the result will not be dominated by one expert; (3) the ABM introduces the beta distribution as the prior of aggregation, and the confidence interval indicates that the results obtained are more reliable.
In this paper, we applied this framework to the reliability assessment of a servo turret, and this framework can be extrapolated to the reliability assessment of complex systems such as spacecraft, aircraft, reactors, etc., to verify the feasibility of this approach. Moreover, only binary data are used for reliability evaluation. In order to describe the product more accurately, future research could describe a product using a multi-state system.
7. Conclusions
In this paper, a framework is proposed to solve the problem of limited failure data for reliability evaluation at the early stage of product development. The method established in this paper needs to be supported by information about similar products to support experts’ judgments and be used in combination with limited failure data. This framework includes an expert system that is used to obtain experts’ judgments and aggregates their judgments without needing to consider weights, and an advanced Bayesian melding method is adopted to fuse the limited failure data and the result of experts’ judgments, which is then finally applied to evaluate the reliability of the servo turret. The established expert system converts the qualitative information into quantitative information in a mathematical form, and the creedal ranking is obtained to describe the degree to which one criterion is superior to another. The advanced Bayesian melding method is investigated, and the beta distribution is introduced as the prior of pooling weights; the result is proven to be more accurate and results in a reduction of uncertainty by a 95% confidence interval. The reliability evaluation for a servo turret was conducted using the proposed framework; the mean value was 5878.31 h, and the 95% credible intervals were .
In the future, this framework should be applied to more products for reliability evaluation with a standard expert selection system, and degradation models of multiple failure modes should be developed to obtain more prior information.
Author Contributions
Conceptualization, B.S., Z.Y. and N.B.; methodology, B.S. and C.C.; software, B.S.; validation, B.S., C.C. and H.T.; investigation, W.L.; writing—original draft preparation, B.S. and C.C.; writing—review and editing, N.B., H.T. and W.L.; funding acquisition, Z.Y. and H.T. All authors have read and agreed to the published version of the manuscript.
Funding
This work was supported by [National Science and Technology Major Project] under Grant [number 2019ZX04024001]; [National Natural Science Foundation] under Grant [number 51975249 and 51675227]; [Jilin Province Science and Technology Development Funds] under Grant [number 20180201007GX and 20190302017GX]; [Technology development and research of Jilin Province] under Grant [number 2019C037-01]; [Changchun Science and Technology Planning Project] under Grant [number 19SS011]; and [Fundamental Research Funds for the Central Universities].
Acknowledgments
The research was carried out when the first author made a research visit to McMaster University, Canada; thanks go to Balakrishnan N. for his guidance during this period. Our deepest gratitude goes to the editors and reviewers for their constructive suggestions on the paper. We also thank the authors of the references, whose work contributed greatly to the completion of this paper.
Conflicts of Interest
The authors declare no conflict of interest.
References
- Büyüközkan, G.; Güleryüz, S. A new integrated intuitionistic fuzzy group decision making approach for product development partner selection. Comput. Ind. Eng. 2016, 102, 383–395. [Google Scholar] [CrossRef]
- Lee, C.K.H. A knowledge-based product development system in the chemical industry. J. Intell. Manuf. 2019, 30, 1371–1386. [Google Scholar] [CrossRef]
- Jia, X. Reliability analysis for Weibull distribution with homogeneous heavily censored data based on Bayesian and least-squares methods. Appl. Math. Model. 2020, 83, 169–188. [Google Scholar] [CrossRef]
- Elmahdy, E.E. A new approach for Weibull modeling for reliability life data analysis. Appl. Math. Comput. 2015, 250, 708–720. [Google Scholar]
- Huang, W.; Dietrich, D.L. An alternative degradation reliability modeling approach using maximum likelihood estimation. IEEE Trans. Reliab. 2005, 54, 310–317. [Google Scholar] [CrossRef]
- Abernethy, R.B. The New Weibull Handbook: Reliability and Statistical Analysis for Predicting Life, Safety, Supportability, Risk, Cost and Warranty Claims; R.B. Abernethy: University Park, PA, USA, 2004. [Google Scholar]
- Murthy, D.N.P.; Xie, M.; Jiang, R. Weibull Models; John Wiley: Hoboken, NJ, USA, 2004. [Google Scholar]
- Olteanu, D.; Freeman, L. The Evaluation of Median-Rank Regression and Maximum Likelihood Estimation Techniques for a Two-Parameter Weibull Distribution. Qual. Eng. 2010, 56, 147–148. [Google Scholar] [CrossRef]
- Shastry, R.; Herman, D.; Soulas, G.; Patterson, M. NASA’s Evolutionary Xenon Thruster (NEXT) Long- Duration Test as of 736 kg of Propellant Throughput. In Proceedings of the 48th AIAA/ASME/SAE/ASEE Joint Propulsion Conference & Exhibit, Atlanta, GA, USA, 30 July–1 August 2012; p. 4023. [Google Scholar]
- Zhang, C.W.; Zhang, T.; Xu, D.; Xie, M. Analyzing highly censored reliability data without exact failure times: An efficient tool for practitioners. Qual. Eng. 2013, 25, 392–400. [Google Scholar] [CrossRef]
- Yadav, O.P.; Singh, N.; Chinnam, R.B.; Goel, P.S. A fuzzy logic based approach to reliability improvement estimation during product development. Reliab. Eng. Syst. Saf. 2003, 80, 63–74. [Google Scholar] [CrossRef]
- Chan, S.; Ip, W.; Zhang, W. Integrating failure analysis and risk analysis with quality assurance in the design phase of medical product development. Int. J. Prod. Res. 2012, 50, 2190–2203. [Google Scholar] [CrossRef]
- Wang, Y.; Deng, C.; Wu, J.; Xiong, Y. Failure time prediction for mechanical device based on the degradation sequence. J. Intell. Manuf. 2015, 26, 1181–1199. [Google Scholar] [CrossRef]
- Elsayed, E.A. Overview of reliability testing. IEEE Trans. Reliab. 2012, 61, 282–291. [Google Scholar] [CrossRef]
- Zio, E. Reliability engineering: Old problems and new challenges. Reliab. Eng. Syst. Saf. 2009, 94, 125–141. [Google Scholar] [CrossRef]
- Hemming, V.; Armstrong, N.; Burgman, M.A.; Hanea, A.M. Improving expert forecasts in reliability: Application and evidence for structured elicitation protocols. Qual. Reliab. Eng. Int. 2020, 36, 623–641. [Google Scholar] [CrossRef]
- Mi, X.; Tang, M.; Liao, H.; Shen, W.; Lev, B. The state-of-the-art survey on integrations and applications of the best worst method in decision making: Why, what, what for and what’s next? Omega 2019, 87, 205–225. [Google Scholar] [CrossRef]
- Rezaei, J. Best-worst multi-criteria decision-making method. Omega 2015, 53, 49–57. [Google Scholar] [CrossRef]
- Liu, Y.; Zidek, J.V.; Trites, A.W.; Battaile, B.C. Bayesian data fusion approaches to predicting spatial tracks: Application to marine mammals. Ann. Appl. Stat. 2016, 10, 1517–1546. [Google Scholar] [CrossRef]
- Li, X.; Ran, Y.; Zhang, G.; He, Y. A failure mode and risk assessment method based on cloud model. J. Intell. Manuf. 2019, 31, 1–14. [Google Scholar] [CrossRef]
- Bai, C.; Kusi-Sarpong, S.; Badri Ahmadi, H.; Sarkis, J. Social sustainable supplier evaluation and selection: A group decision-support approach. Int. J. Prod. Res. 2019, 57, 7046–7067. [Google Scholar] [CrossRef]
- Rezaei, J.; Papakonstantinou, A.; Tavasszy, L.; Pesch, U.; Kana, A. Sustainable product-package design in a food supply chain: A multi-criteria life cycle approach. Packag. Technol. Sci. 2019, 32, 85–101. [Google Scholar] [CrossRef]
- Mohammadi, M.; Rezaei, J. Bayesian best-worst method: A probabilistic group decision making model. Omega 2019, 96, 102075. [Google Scholar] [CrossRef]
- Ouchi, F. A literature review on the use of expert opinion in probabilistic risk analysis. Policy Res. Work. Pap. Ser. 2004. [Google Scholar] [CrossRef]
- Cai, M.; Lin, Y.; Han, B.; Liu, C.; Zhang, W. On a simple and efficient approach to probability distribution function aggregation. IEEE Trans. Syst. Man Cybern. Syst. 2016, 47, 2444–2453. [Google Scholar] [CrossRef]
- Che, X.; Mi, J.; Chen, D. Information fusion and numerical characterization of a multi-source information system. Knowl. Based Syst. 2018, 145, 121–133. [Google Scholar] [CrossRef]
- Li, H.; Huang, H.Z.; Li, Y.F.; Zhou, J.; Mi, J. Physics of failure-based reliability prediction of turbine blades using multi-source information fusion. Appl. Soft Comput. 2018, 72, 624–635. [Google Scholar] [CrossRef]
- Jin, S.; Liu, Y.; Lin, Z. A Bayesian network approach for fixture fault diagnosis in launch of the assembly process. Int. J. Prod. Res. 2012, 50, 6655–6666. [Google Scholar] [CrossRef]
- Wang, B.; Xu, F.; Shu, L. A Bayesian approach to diagnosing covariance matrix shifts. Qual. Reliab. Eng. Int. 2020, 36, 736–752. [Google Scholar] [CrossRef]
- Peng, W.; Huang, H.Z.; Li, Y.; Zuo, M.J.; Xie, M. Life cycle reliability assessment of new products—A Bayesian model updating approach. Reliab. Eng. Syst. Saf. 2013, 112, 109–119. [Google Scholar] [CrossRef]
- Wang, L.; Pan, R.; Wang, X.; Fan, W.; Xuan, J. A Bayesian reliability evaluation method with different types of data from multiple sources. Reliab. Eng. Syst. Saf. 2017, 167, 128–135. [Google Scholar] [CrossRef]
- Di Maio, F.; Tsui, K.L.; Zio, E. Combining relevance vector machines and exponential regression for bearing residual life estimation. Mech. Syst. Signal Process. 2012, 31, 405–427. [Google Scholar] [CrossRef]
- Wang, X.; Jiang, P.; Guo, B.; Cheng, Z. Real-time reliability evaluation with a general Wiener process-based degradation model. Qual. Reliab. Eng. Int. 2014, 30, 205–220. [Google Scholar] [CrossRef]
- Johnson, V.E.; Moosman, A.; Cotter, P. A hierarchical model for estimating the early reliability of complex systems. IEEE Trans. Reliab. 2005, 54, 224–231. [Google Scholar] [CrossRef]
- Yontay, P.; Pan, R. A computational Bayesian approach to dependency assessment in system reliability. Reliab. Eng. Syst. Saf. 2016, 152, 104–114. [Google Scholar] [CrossRef]
- Guo, J.; Li, Z.S.; Jin, J.J. System reliability assessment with multilevel information using the Bayesian melding method. Reliab. Eng. Syst. Saf. 2018, 170, 146–158. [Google Scholar] [CrossRef]
- Safari, H.; Faraji, Z.; Majidian, S. Identifying and evaluating enterprise architecture risks using FMEA and fuzzy VIKOR. J. Intell. Manuf. 2016, 27, 475–486. [Google Scholar] [CrossRef]
- Kabir, S.; Walker, M.; Papadopoulos, Y.; Rüde, E.; Securius, P. Fuzzy temporal fault tree analysis of dynamic systems. Int. J. Approx. Reason. 2016, 77, 20–37. [Google Scholar] [CrossRef]
- Hafezalkotob, A.; Hafezalkotob, A. A novel approach for combination of individual and group decisions based on fuzzy best-worst method. Appl. Soft Comput. 2017, 59, 316–325. [Google Scholar] [CrossRef]
- Mou, Q.; Xu, Z.; Liao, H. An intuitionistic fuzzy multiplicative best-worst method for multi-criteria group decision making. Inf. Sci. 2016, 374, 224–239. [Google Scholar] [CrossRef]
- Mohammadi, M.; Rezaei, J. Evaluating and comparing ontology alignment systems: An MCDM approach. J. Web Semant. 2020, 64, 100592. [Google Scholar] [CrossRef]
- Jung, H.; Jeong, S.J. Managing demand uncertainty through fuzzy inference in supply chain planning. Int. J. Prod. Res. 2012, 50, 5415–5429. [Google Scholar] [CrossRef]
- Gok, A. A new approach to minimization of the surface roughness and cutting force via fuzzy TOPSIS, multi-objective grey design and RSA. Measurement 2015, 70, 100–109. [Google Scholar] [CrossRef]
- Daneshvar, S.; Yazdi, M.; Adesina, K.A. Fuzzy smart failure modes and effects analysis to improve safety performance of system: Case study of an aircraft landing system. Qual. Reliab. Eng. Int. 2020, 36, 890–909. [Google Scholar] [CrossRef]
- Ross, T.J. Properties of membership functions, fuzzification, and defuzzification. In Fuzzy Logic with Engineering Applications; Wiley: Hoboken, NJ, USA, 2010; pp. 89–116. [Google Scholar]
- Yang, L.; Guo, Y.; Kong, Z. On the performance evaluation of a hierarchical-structure prototype product using inconsistent prior information and limited test data. Inf. Sci. 2019, 485, 362–375. [Google Scholar] [CrossRef]
- Poole, D.; Raftery, A.E. Inference for deterministic simulation models: The Bayesian melding approach. J. Am. Stat. Assoc. 2000, 95, 1244–1255. [Google Scholar] [CrossRef]
- Shaddick, G.; Thomas, M.L.; Green, A.; Brauer, M.; van Donkelaar, A.; Burnett, R.; Chang, H.H.; Cohen, A.; Van Dingenen, R.; Dora, C.; et al. Data integration model for air quality: A hierarchical approach to the global estimation of exposures to ambient air pollution. J. R. Stat. Soc. Ser. C (Appl. Stat.) 2018, 67, 231–253. [Google Scholar] [CrossRef]
- Yuan, C.; Druzdzel, M.J. Improving importance sampling by adaptive split-rejection control in Bayesian networks. In Proceedings of the 20th Conference of the Canadian Society for Computational Studies of Intelligence, Montreal, QC, Canada, 28–30 May 2007; pp. 332–343. [Google Scholar]
- Wang, Y.; Yam, R.C.; Zuo, M.J.; Tse, P. A comprehensive reliability allocation method for design of CNC lathes. Reliab. Eng. Syst. Saf. 2001, 72, 247–252. [Google Scholar] [CrossRef]


Publisher’s Note: MDPI stays neutral with regard to jurisdictional claims in published maps and institutional affiliations. |
© 2020 by the authors. Licensee MDPI, Basel, Switzerland. This article is an open access article distributed under the terms and conditions of the Creative Commons Attribution (CC BY) license (http://creativecommons.org/licenses/by/4.0/).