Stress Transfer Mechanism of Flange in Split Hopkinson Tension Bar


Abstract
:Featured Application
Abstract
1. Introduction
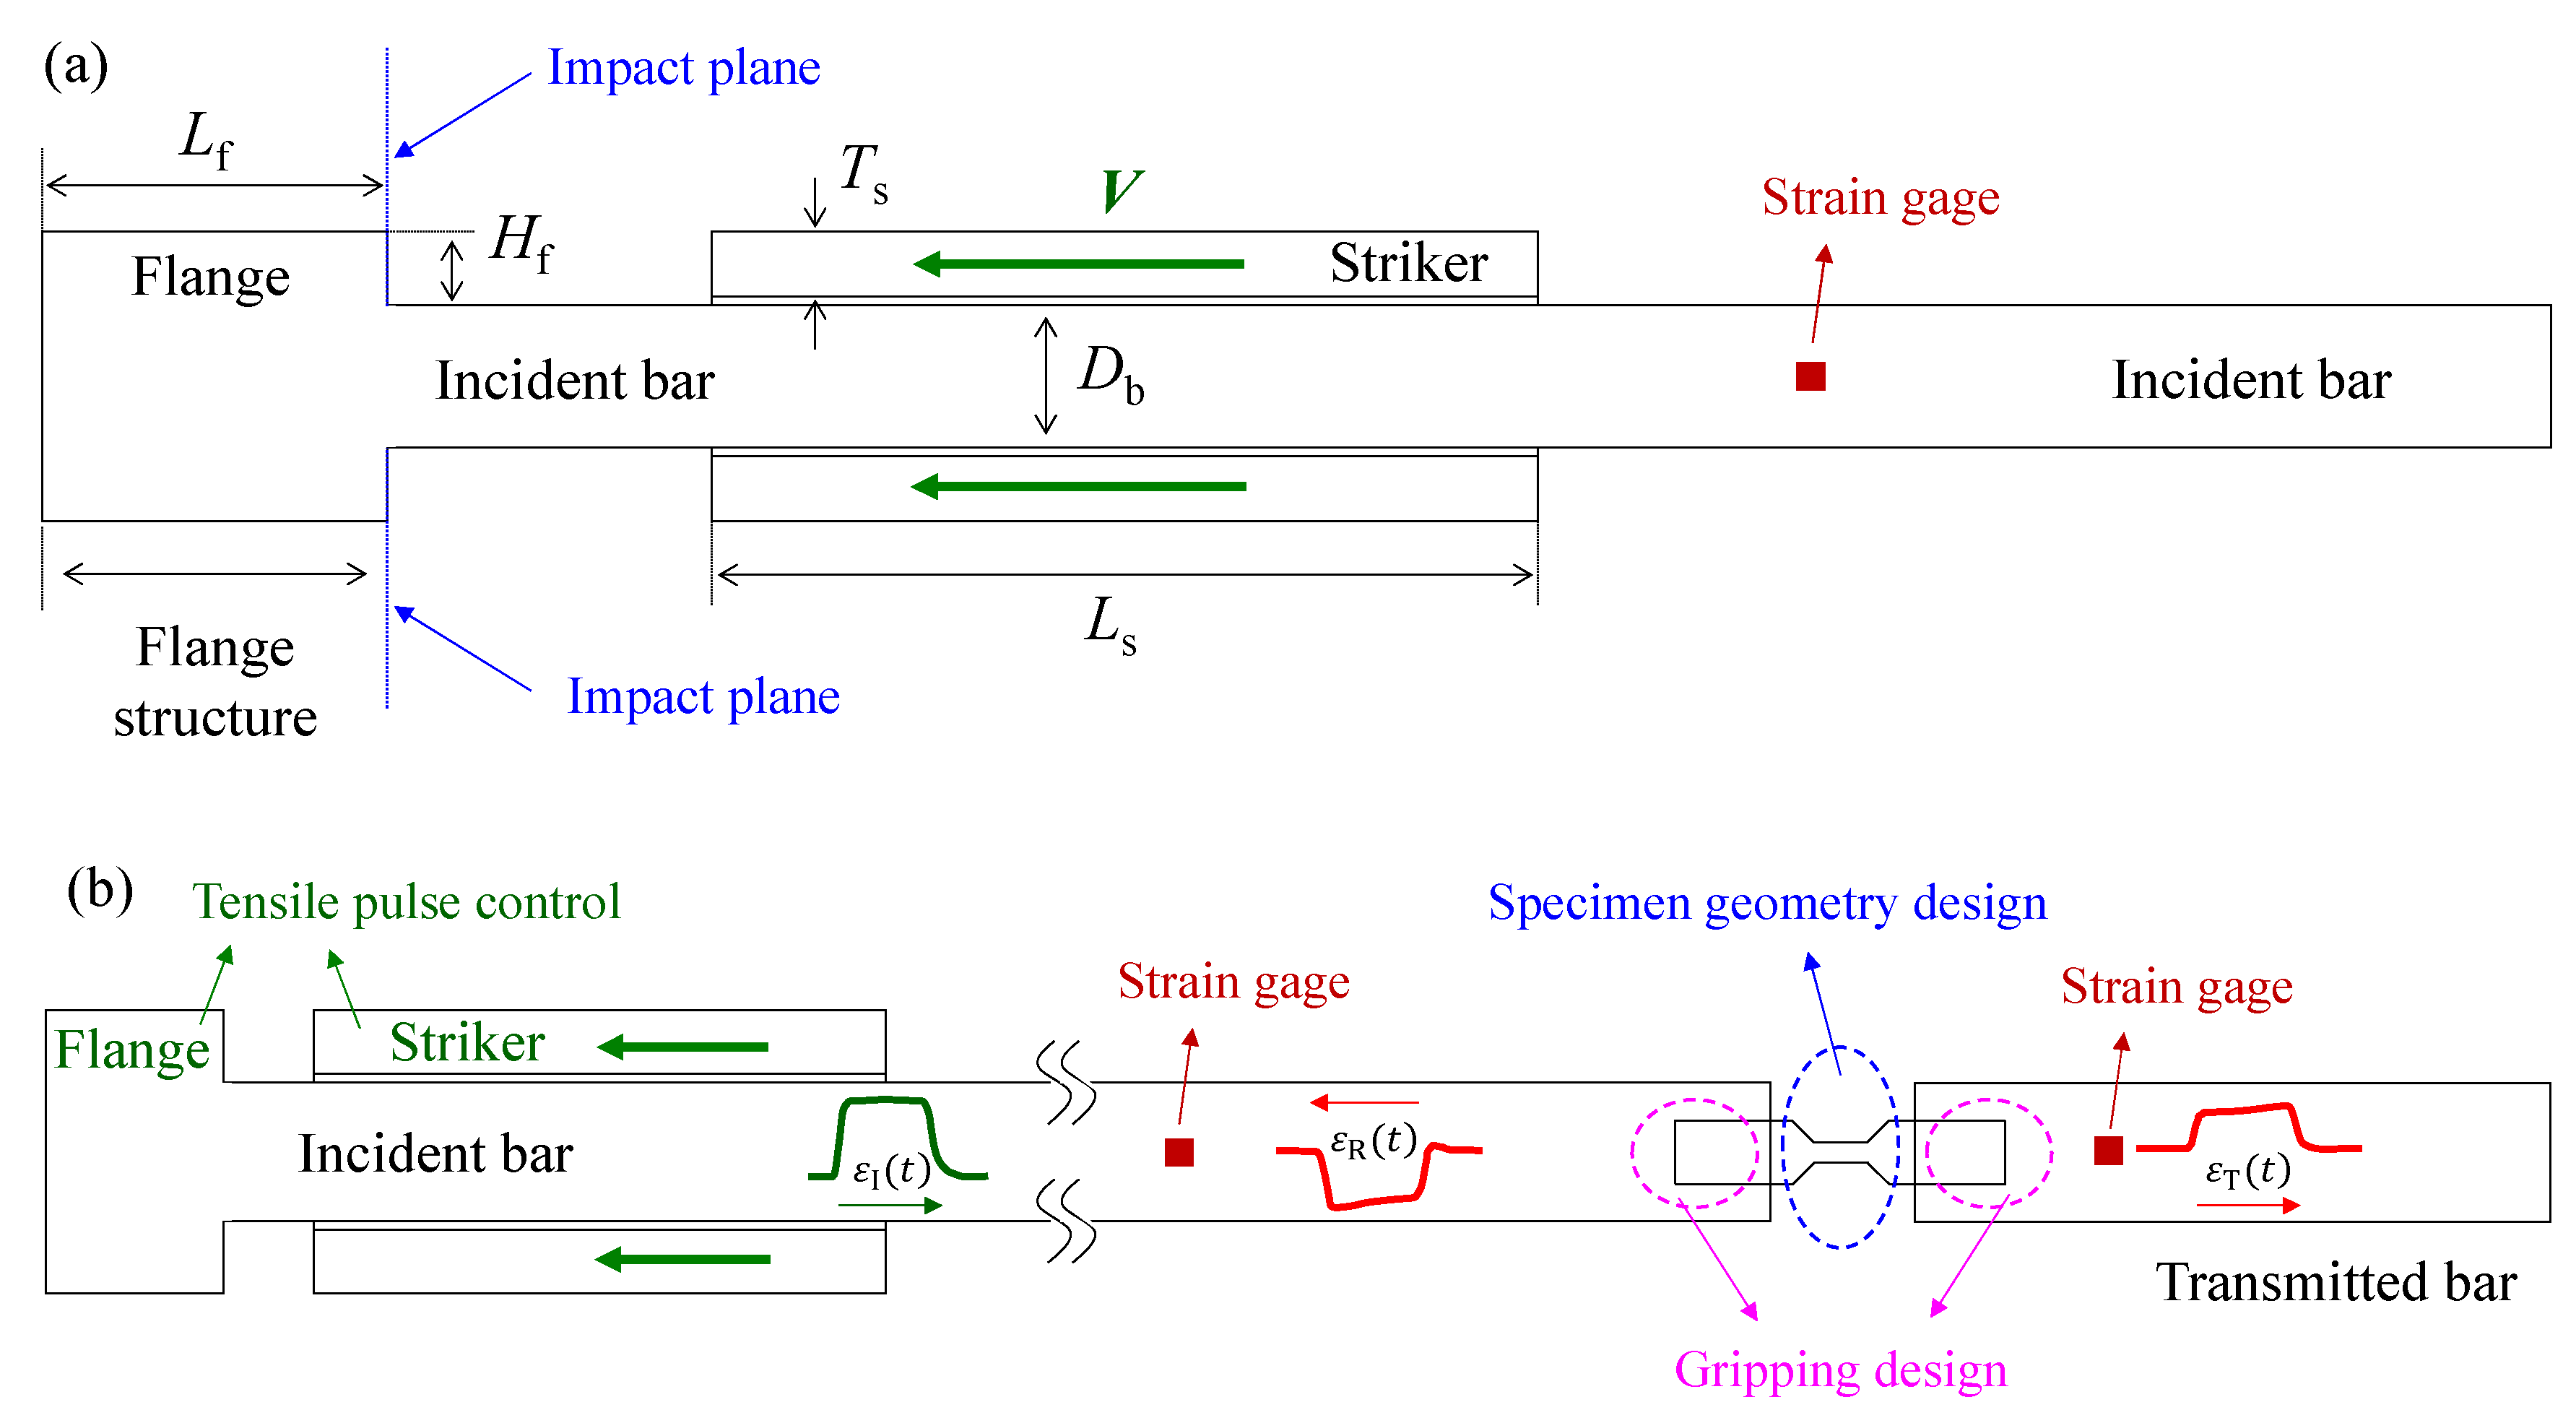
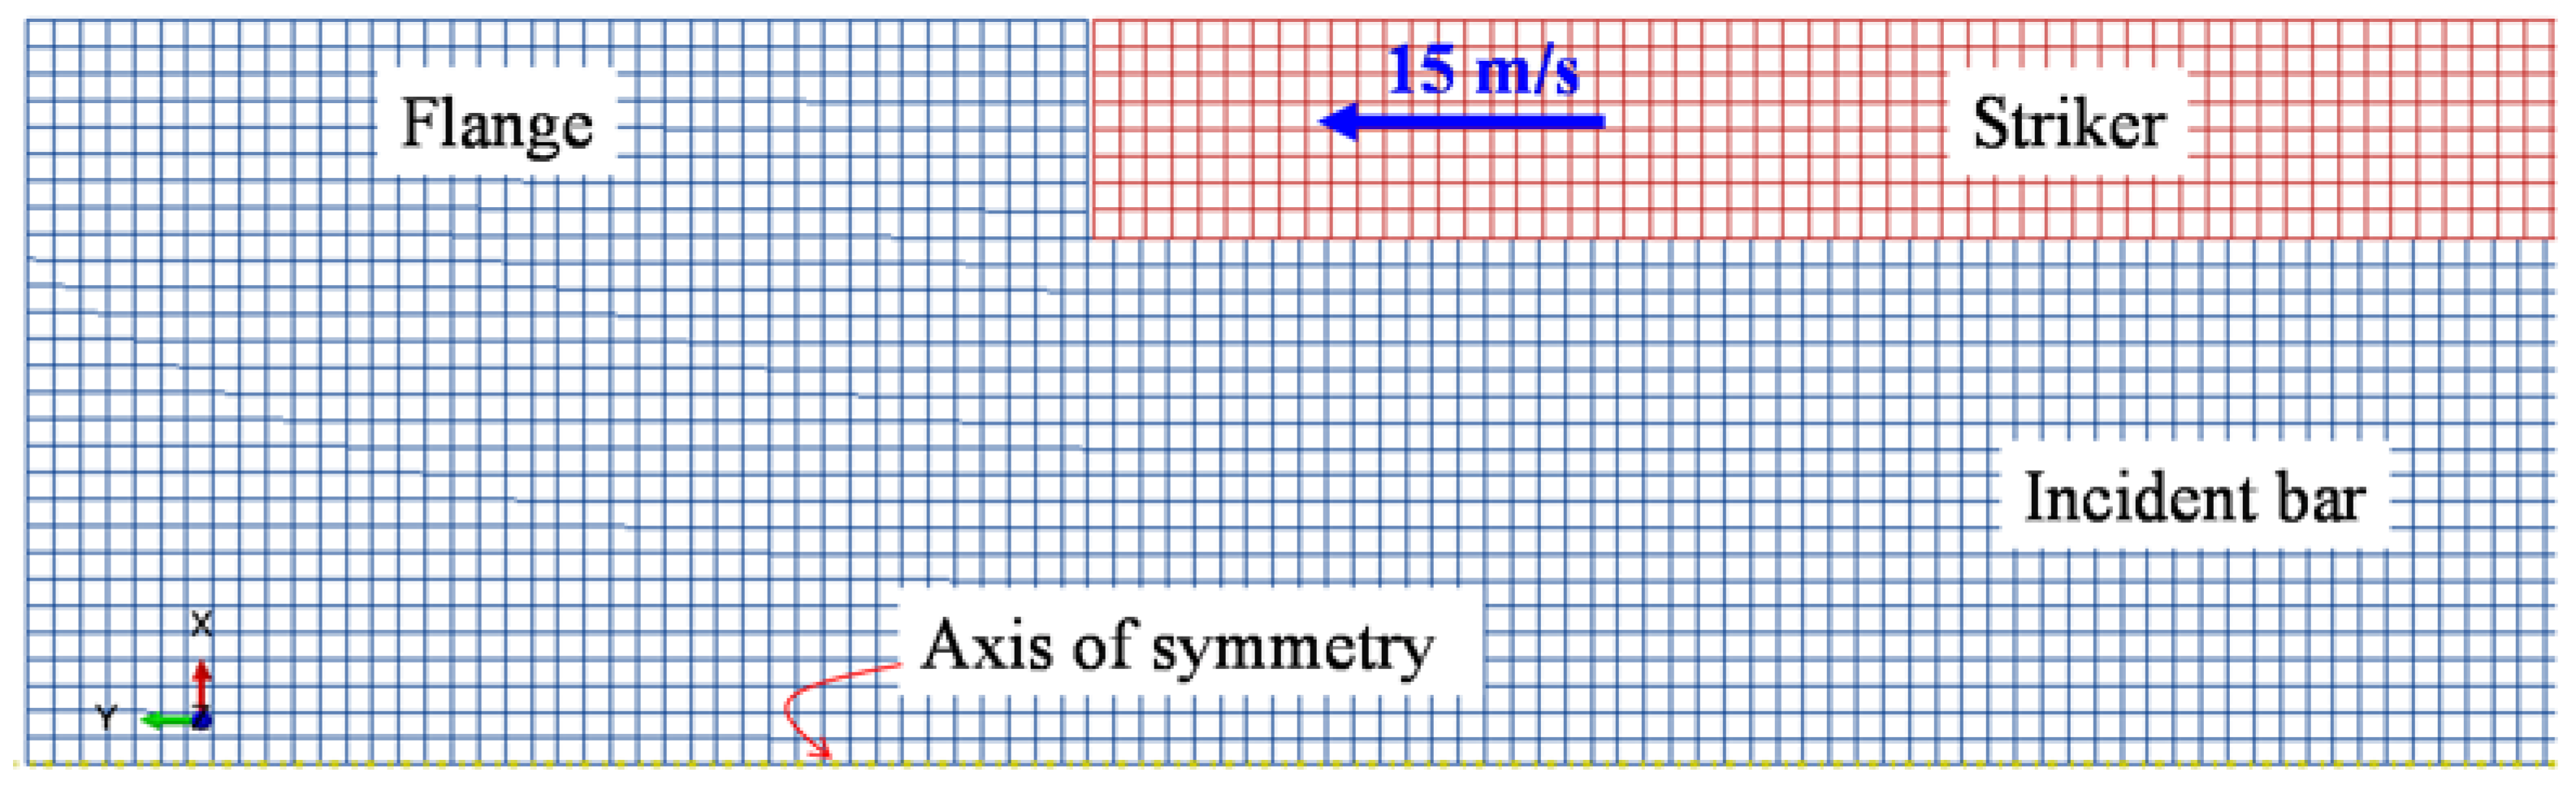
2. Methods
3. Results and Discussion
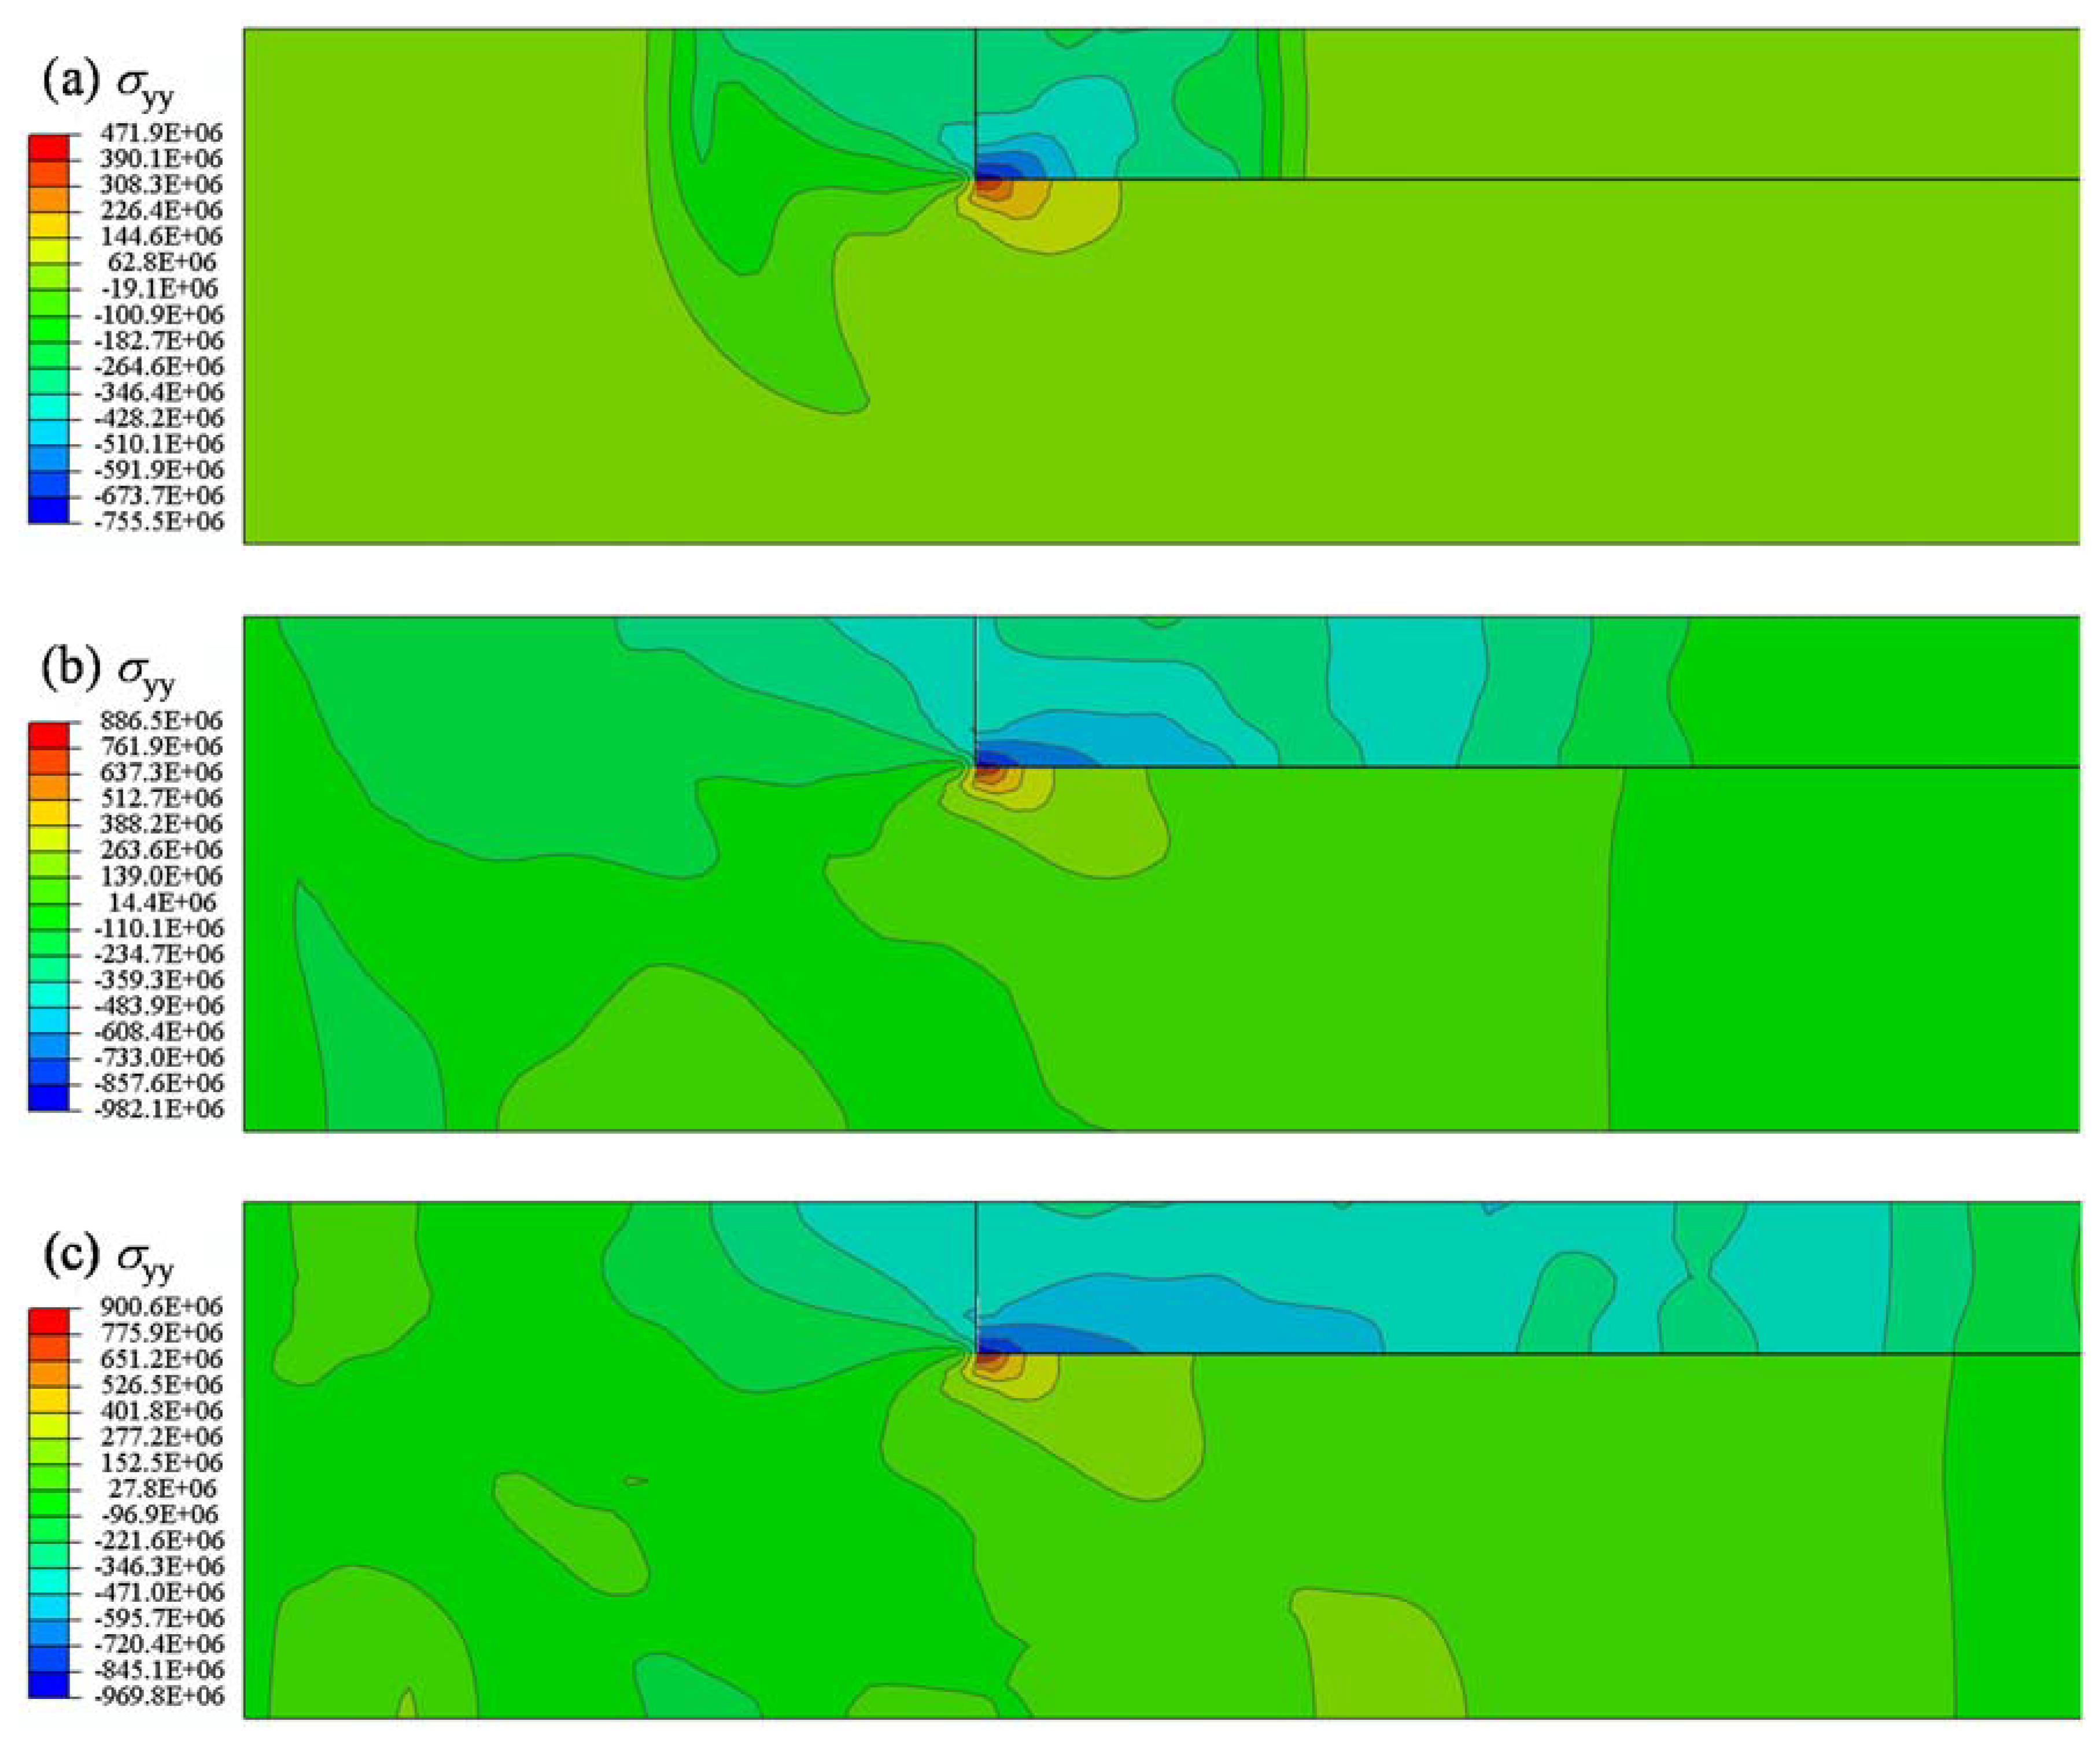
3.1. Stress Contours around Flange Structure
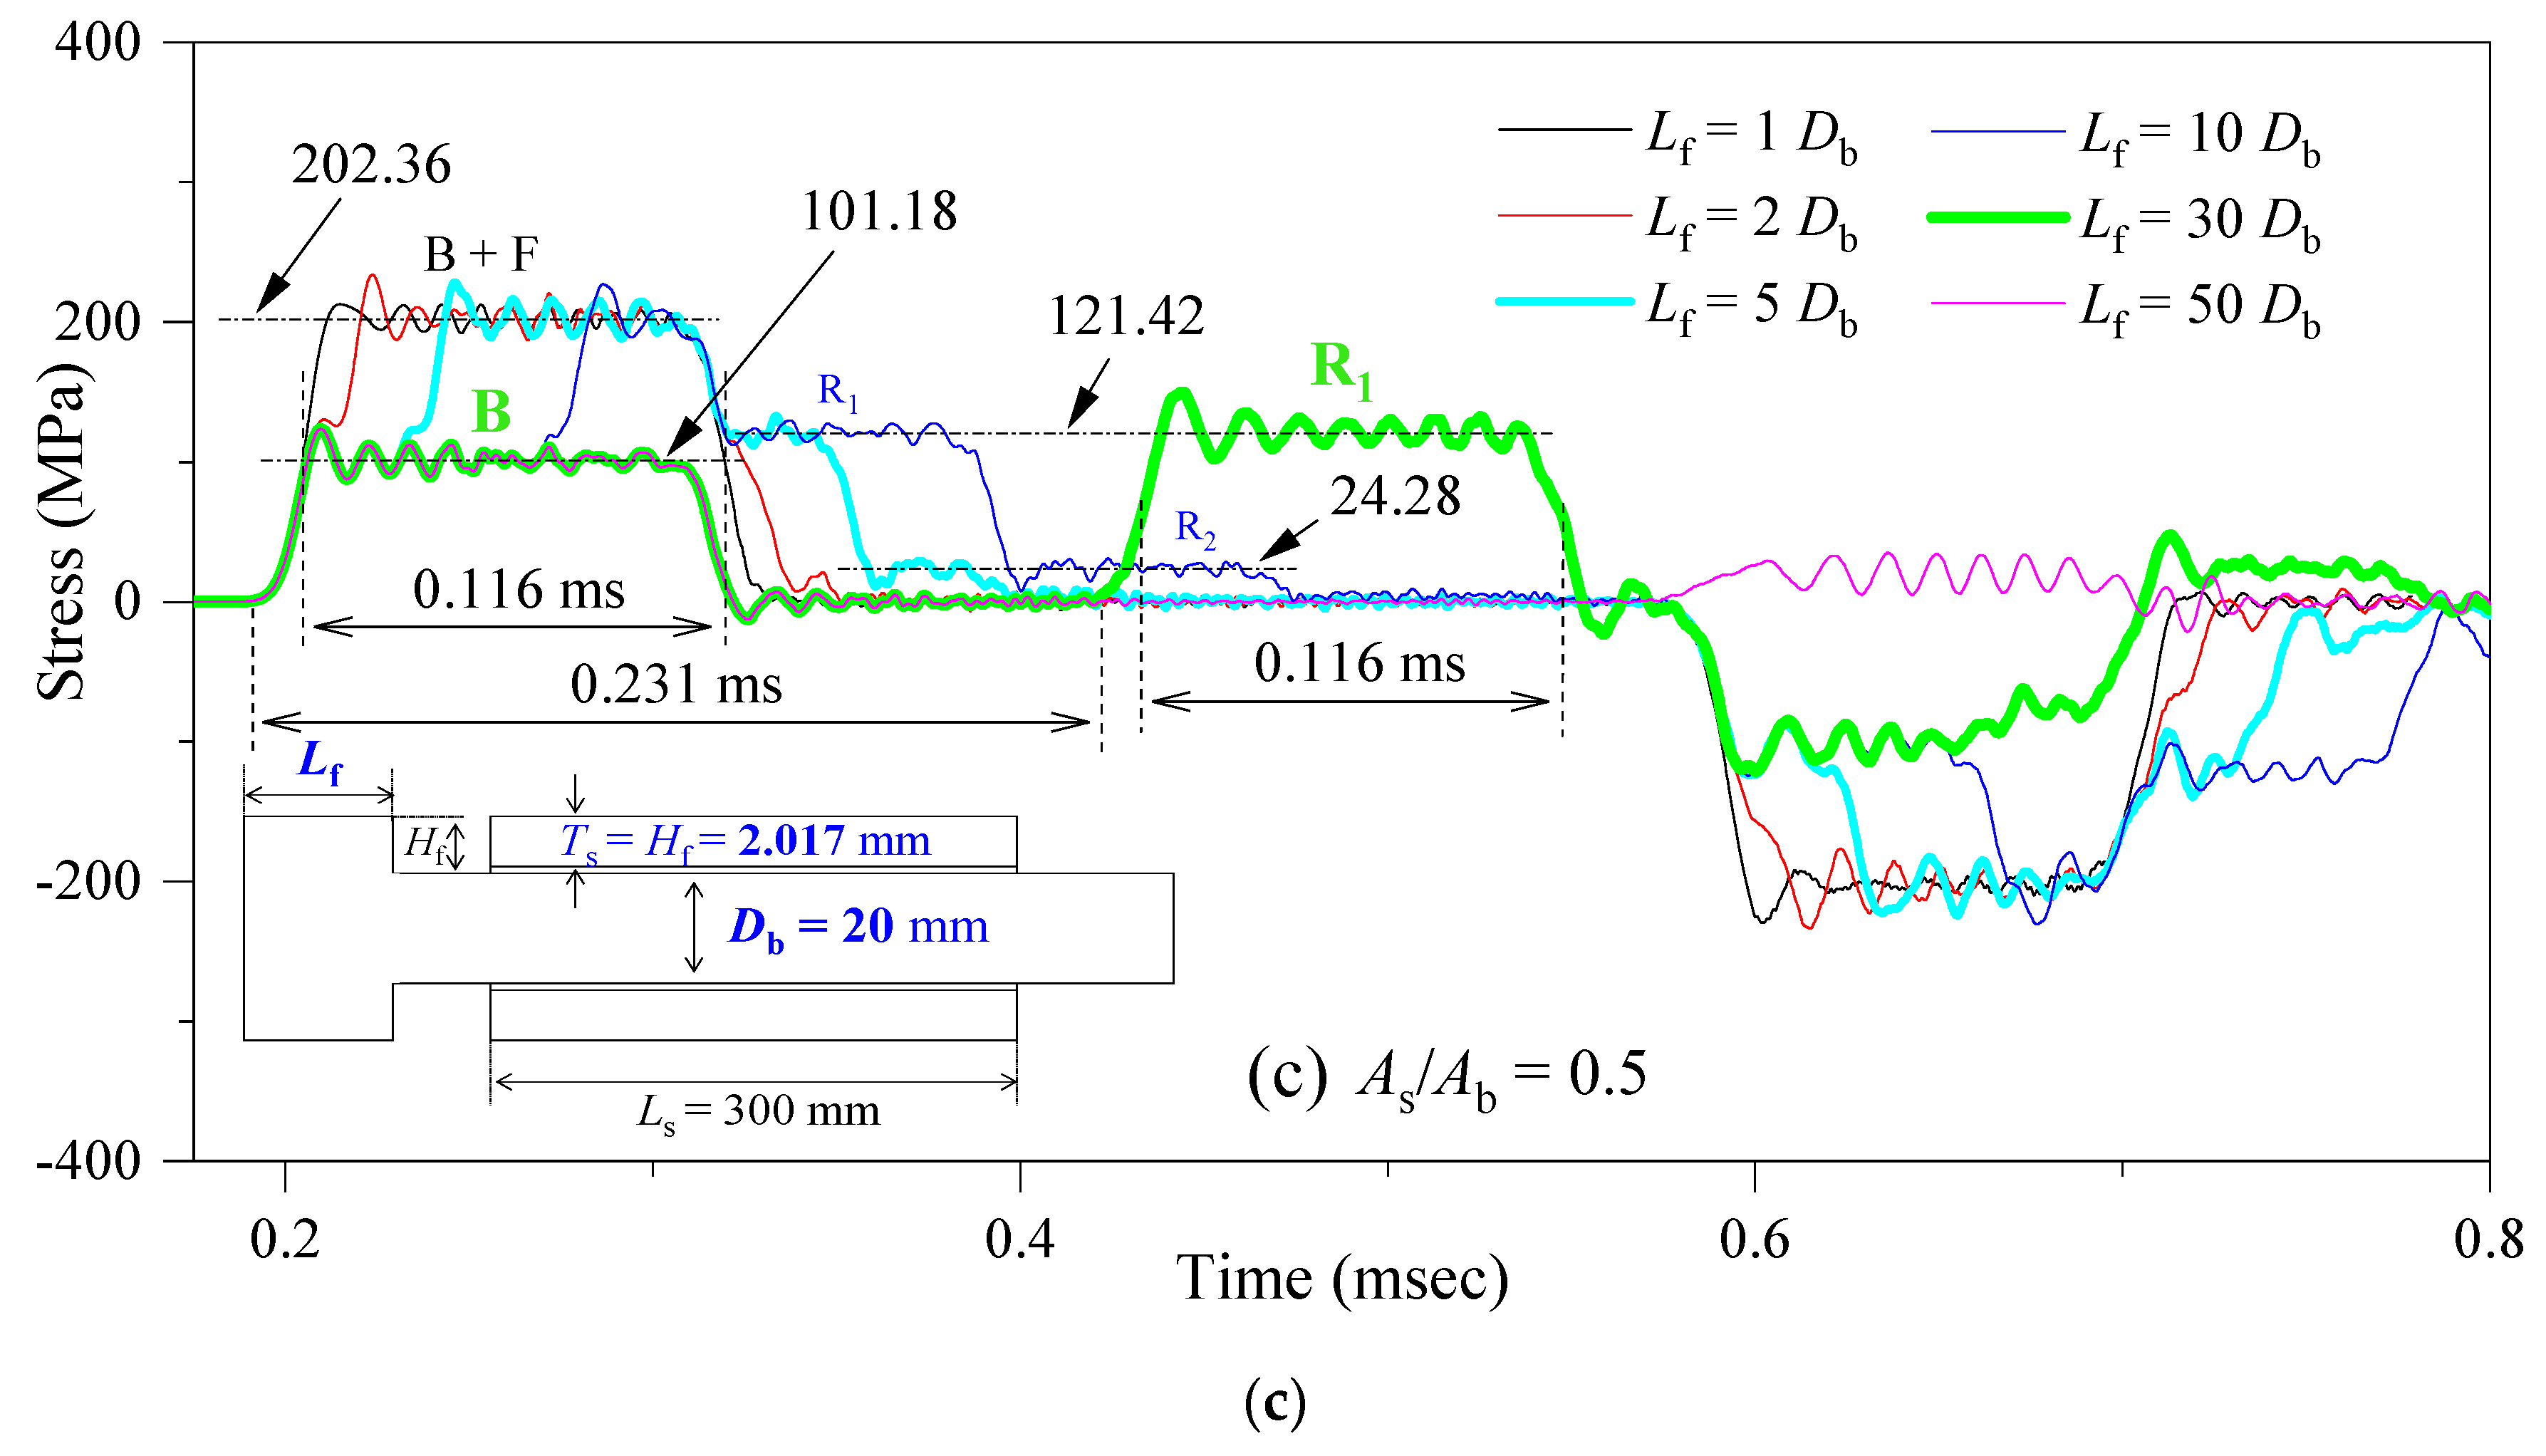
3.2. Stress Profiles at Strain Gage of Incident Bar
3.3. Three Types of Stress Waves
3.4. Stress Transfer Mechanism
3.4.1. Long Flange (Lf > Ls)
3.4.2. Intermediate Flange (~Db < Lf < Ls)
3.4.3. Short Flange (Lf < ~Db)
3.5. Overall Discussion
4. Conclusions
Author Contributions
Funding
Acknowledgments
Conflicts of Interest
References
- Kolsky, H. An investigation of the mechanical properties of materials at very high rates of loading. Proc. Phys. Soc. Lond. Sect. B 1949, 62, 676–700. [Google Scholar] [CrossRef]
- Johnson, G.R.; Cook, W.H. A constitutive model and data for metals subjected to large strains, high strain rates and high temperatures. In Proceedings of the 7th International Symposium on Ballistics, The Hague, The Netherlands, 19–21 April 1983; pp. 541–547. [Google Scholar]
- Shin, H.; Kim, J.-B. A phenomenological constitutive equation to describe various flow stress behaviors of materials in wide strain rate and temperature regimes. J. Eng. Mater. Technol. 2010, 132, 021009. [Google Scholar] [CrossRef]
- Lee, W.; Lee, H.-J.; Shin, H. Ricochet of a tungsten heavy alloy long-rod projectile from deformable steel plates. J. Phys. D Appl. Phys. 2002, 35, 2676–2686. [Google Scholar] [CrossRef] [Green Version]
- Pyka, D.; Kurzawa, A.; Bocian, M.; Bajkowski, M.; Magier, M.; Sliwinski, J.; Jamroziak, K. Numerical and experimental studies of the ŁK type shaped charge. Appl. Sci. 2020, 10, 6742. [Google Scholar] [CrossRef]
- Lu, Y.; Zhang, Q.; Xue, Y.; Liu, W.; Long, R. High-velocity impact performance of aluminum and B4C/UHMW-PE composite plate for multi-wall shielding. Appl. Sci. 2020, 10, 721. [Google Scholar] [CrossRef] [Green Version]
- Yoo, Y.H.; Paik, S.H.; Kim, J.B.; Shin, H. Performance of a flying cross bar to incapacitate a long-rod penetrator based on a finite element model. Eng. Comput. 2012, 29, 409–415. [Google Scholar] [CrossRef]
- Chen, W.W.; Song, B. Split Hopkinson (Kolsky) Bar—Design, Testing and Applications; Springer: New York, NY, USA, 2011. [Google Scholar]
- Shin, H.; Kim, J.-B. Evolution of specimen strain rate in split Hopkinson bar test. Proc. Inst. Mech. Eng. Part C J. Mech. Eng. Sci. 2019, 233, 4667–4687. [Google Scholar] [CrossRef] [Green Version]
- Panowicz, R.; Konarzewski, M. Influence of imperfect position of a striker and input bar on wave propagation in a split Hopkinson pressure bar (SHPB) setup with a pulse-shape technique. Appl. Sci. 2020, 10, 2423. [Google Scholar] [CrossRef] [Green Version]
- Shin, H.; Kim, J.-B. Understanding the anomalously long duration time of the transmitted pulse from a soft specimen in a Kolsky bar experiment. Int. J. Precis. Eng. Manuf. 2016, 17, 203–208. [Google Scholar] [CrossRef]
- De Matteis, G.; Brando, G.; Mazzolani, F.M. Pure aluminium: An innovative material for structural applications in seismic engineering. Constr. Build. Mater. 2012, 26, 677–686. [Google Scholar] [CrossRef]
- Curosu, I.; Mechtcherine, V.; Forni, D.; Cadoni, E. Performance of various strain-hardening cement-based composites (SHCC) subject to uniaxial impact tensile loading. Cem. Concr. Res. 2017, 102, 16–28. [Google Scholar] [CrossRef]
- Verleysen, P.; Degrieck, J.; Verstraete, T.; Van Slycken, J. Influence of specimen geometry on split Hopkinson tensile bar tests on sheet materials. Exp. Mech. 2008, 48, 587–598. [Google Scholar] [CrossRef]
- Rotbaum, Y.; Rittel, D. Is there an optimal gauge length for dynamic tensile specimens? Exp. Mech. 2014, 54, 1205–1214. [Google Scholar] [CrossRef]
- Ledford, N.; Paul, H.; Ganzenmüller, G.; May, M.; Höfemann, M.; Otto, M.; Petrinic, N. Investigations on specimen design and mounting for split Hopkinson tension bar (SHTB) experiments. Eur. Phys. J. Web Conf. 2015, 94, 01049. [Google Scholar] [CrossRef] [Green Version]
- Nguyen, K.-H.; Kim, H.C.; Shin, H.; Yoo, Y.H.; Kim, J.B. Numerical investigation into the stress wave transmitting characteristics of threads in the split Hopkinson tensile bar test. Int. J. Impact Eng. 2017, 109, 253–263. [Google Scholar] [CrossRef]
- Shin, H.; Lee, J.-H.; Kim, J.-B.; Sohn, S.-I. Design guidelines for the striker and transfer flange of a split Hopkinson tension bar and the origin of spurious waves. Proc. Inst. Mech. Eng. Part C J. Mech. Eng. Sci. 2020, 234, 137–151. [Google Scholar] [CrossRef]
- Acosta, J.F. Numerical and Experimental Studies on the Use of a Split Hopkinson Pressure Bar for High Strain Rate Tension Testing. Ph.D. Thesis, Department Aerospace Engineering, Wichita State University, Wichita, KN, USA, 2012. [Google Scholar]
- Prabowo, D.A.; Kariem, M.A.; Gunawan, L. The Effect of specimen dimension on the results of the split-Hopkinson tension bar testing. Procedia Eng. 2017, 173, 608–614. [Google Scholar] [CrossRef]
- Chen, X.; Liu, Z.; He, G.; Xie, H. A novel integrated tension-compression design for a mini split Hopkinson bar apparatus. Rev. Sci. Instrum. 2014, 85, 035114. [Google Scholar] [CrossRef]
- Ganzenmüller, G.C.; Blaum, E.; Mohrmann, D.; Langhof, T.; Plappert, D.; Ledford, N.; Paul, H.; Hiermaier, S. A simplified design for a split Hopkinson tension bar with long pulse duration. Procedia Eng. 2017, 197, 109–118. [Google Scholar] [CrossRef]
- Isakov, M.; Hiermaier, S.; Kuokkala, V.-T. Improved specimen recovery in tensile split Hopkinson bar. Philos. Tans. R. Soc. A 2014, 372, 20130194. [Google Scholar] [CrossRef] [Green Version]
- Gerlach, R.; Kettenbeil, C.; Petrinic, N. A new split Hopkinson tensile bar design. Int. J. Impact Eng. 2012, 50, 63–67. [Google Scholar] [CrossRef]
- Huang, S.; Chen, R.; Xia, K.W. Quantification of dynamic tensile parameters of rocks using a modified Kolsky tension bar apparatus. J. Rock Mech. Geotech. Eng. 2010, 2, 162–168. [Google Scholar] [CrossRef] [Green Version]
- Miao, Y.; Du, B.; Ma, C.; Hu, H.; Deng, Q. Some fundamental problems concerning the measurement accuracy of the Hopkinson tension bar technique. Meas. Sci. Technol. 2019, 30, 055009. [Google Scholar] [CrossRef]
- Tzibula, S.; Lovingera, Z.; Rittel, D. Dynamic tension of ductile polymers: Experimentation and modelling. Mech. Mater. 2018, 123, 30–42. [Google Scholar] [CrossRef]
- Gerlach, R.; Sathianathan, S.K.; Siviour, C.; Petrinic, N. A novel method for pulse shaping of split Hopkinson tensile bar signals. Int. J. Impact Eng. 2011, 38, 976–980. [Google Scholar] [CrossRef]
- Yang, X.; Xiong, X.; Yin, Z.; Wang, H.; Wang, J.; Chen, D. Interrupted test of advanced high strength steel with tensile split Hopkinson bar method. Exp. Mech. 2014, 54, 641–652. [Google Scholar] [CrossRef]
- Cao, K.; Wang, Y.; Wang, Y. Experimental investigation and modeling of the tension behavior of polycarbonate with temperature effects from low to high strain rates. Int. J. Solids Struct. 2014, 51, 2539–2548. [Google Scholar] [CrossRef] [Green Version]
- Young, K. Development of a Tensile Split Hopkinson Pressure Bar Testing Facility. Master’s Thesis, Department of Mechanical, Automotive and Materials Engineering, Windsor University, Windsor, ON, Canada, 2015. [Google Scholar]
- Suga, K.; Okamotob, K.; Takagi, K.; Nakatani, H.; Ogihara, S.; Kikuchi, M. Numerical validation of split Hopkinson pressure bar technique for evaluating tensile mechanical properties of CFRP laminates. Adv. Compos. Mater. 2012, 21, 21–232. [Google Scholar] [CrossRef]
- Guzman, O.; Frew, D.J.; Chen, W.A. Kolsky tension bar technique using a hollow incident tube. Meas. Sci. Technol. 2011, 22, 045703. [Google Scholar] [CrossRef]
- Lim, J.; Chen, W.W.; Zheng, J.Q. Dynamic small strain measurements of Kevlar 129 single fibers with a miniaturized tension Kolsky bar. Polym. Test. 2010, 29, 701–705. [Google Scholar] [CrossRef]
- Owens, A.T.; Tippur, H.V. A Tensile split Hopkinson bar for testing particulate polymer composites under elevated rates of loading. Exp. Mech. 2009, 49, 799–811. [Google Scholar] [CrossRef]
- Fu, S.; Wang, Y.; Wang, Y. Tension testing of polycarbonate at high strain rates. Polym. Test. 2009, 28, 724–729. [Google Scholar] [CrossRef]
- Naik, N.K.; Perla, Y. Mechanical behaviour of acrylic under high strain rate tensile loading. Polym. Test. 2008, 27, 504–512. [Google Scholar] [CrossRef]
- Owens, A.T. Development of a Split Hopkinson Tension Bar for Testing Stress–Strain Response of Particulate Composites under High Rates of Loading. Master’s Thesis, Department of Mechanical Engineering, Auburn University, Auburn, AL, USA, 2007. [Google Scholar]
- Huh, H.; Kang, W.J.; Han, S.S. Tension split Hopkinson bar for investigating the dynamic behavior of sheet metals. Exp. Mech. 2002, 42, 8–17. [Google Scholar] [CrossRef]
- Chen, W.; Lu, F.; Cheng, M. Tension and compression tests of two polymers under quasistatic and dynamic loading. Polym. Test. 2002, 21, 113–121. [Google Scholar] [CrossRef]
- Li, M.; Wang, R.; Han, M.-B. A Kolsky Bar: Tension, Tension-tension. Exp. Mech. 1993, 33, 7–14. [Google Scholar] [CrossRef]
- Nemat-Nasser, S.; Isaacs, J.B.; Starrett, J.E. Hopkinson techniques for dynamic recovery experiments. Proc. R. Soc. A 1991, 435, 371–391. [Google Scholar]
- Ogawa, K. Impact-tension compression test by using a split-Hopkinson bar. Exp. Mech. 1983, 24, 81–86. [Google Scholar] [CrossRef]
- Harding, J.; Wood, E.O.; Campbell, J.D. Tensile testing of materials at high rates of strain. Exp. Mech. 1981, 21, 177–185. [Google Scholar]
- Nguyen, K.H.; Lee, C.-W.; Shin, H.; Lee, J.H.; Kim, J.-B. A study on the effects of specimen geometry on measurement accuracy of dynamic constitutive properties of metals using SHTB. Int. J. Precis. Eng. Manuf. 2020, 21, 1687–1695. [Google Scholar] [CrossRef]
- Paslar, N.; Farzampour, A.; Hatami, F. Infill plate interconnection effects on the structural behavior of steel plate shear walls. Thin-Walled Struct. 2020, 149, 106621. [Google Scholar]
- Farzampour, A.; Eatherton, M.R. Parametric computational study on butterfly-shaped hysteretic dampers. Front. Struct. Civ. Eng. 2019, 13, 1214–1226. [Google Scholar]
- Mansouri, I.; Arabzadeh, A.; Farzampour, A.; Hu, J.W. Seismic behavior investigation of the steel multi-story moment frames with steel plate shear walls. Steel Compos. Struct. 2020, 37, 91–98. [Google Scholar]
- Farzampour, A.; Khatibinia, M.; Mansouri, I. Shape optimization of butterfly-shaped shear links using grey wolf algorithm. Ing. Sismica 2019, 36, 27–41. [Google Scholar]
- Dassault Systèmes. Abaqus Analysis User’s Manual (Abaqus 6.14); © Dassault Systèmes: Vélizy-Villacoublay, France, 2014. [Google Scholar]
- MatWeb, Material Property Data. Available online: http://www.matweb.com/ (accessed on 28 October 2020).
- Shin, H.; Kim, D. One dimensional analyses of striker impact on bar with different general impedance. Proc. Inst. Mech. Eng. Part C J. Mech. Eng. Sci. 2020, 234, 589–608. [Google Scholar]
- Punmia, B.C.; Jain, A.K.; Jain, A.K. Mechanics of Materials; Laxmi Publications, Ltd.: New Delhi, India, 2001. [Google Scholar]
- Kim, D.; Shin, H. Minimum required distance of strain gauge from specimen for measuring transmitted signal in split Hopkinson pressure bar test. MATEC Web Conf. 2020, 308, 04005. [Google Scholar]
- Meyers, M.A. Dynamic Behavior of Materials; John Wiley & Sons, Inc.: New York, NY, USA, 1994. [Google Scholar]


Publisher’s Note: MDPI stays neutral with regard to jurisdictional claims in published maps and institutional affiliations. |
© 2020 by the authors. Licensee MDPI, Basel, Switzerland. This article is an open access article distributed under the terms and conditions of the Creative Commons Attribution (CC BY) license (http://creativecommons.org/licenses/by/4.0/).
Share and Cite
Shin, H.; Kim, S.; Kim, J.-B. Stress Transfer Mechanism of Flange in Split Hopkinson Tension Bar. Appl. Sci. 2020, 10, 7601. https://doi.org/10.3390/app10217601
Shin H, Kim S, Kim J-B. Stress Transfer Mechanism of Flange in Split Hopkinson Tension Bar. Applied Sciences. 2020; 10(21):7601. https://doi.org/10.3390/app10217601
Chicago/Turabian StyleShin, Hyunho, Sanghoon Kim, and Jong-Bong Kim. 2020. "Stress Transfer Mechanism of Flange in Split Hopkinson Tension Bar" Applied Sciences 10, no. 21: 7601. https://doi.org/10.3390/app10217601
APA StyleShin, H., Kim, S., & Kim, J.-B. (2020). Stress Transfer Mechanism of Flange in Split Hopkinson Tension Bar. Applied Sciences, 10(21), 7601. https://doi.org/10.3390/app10217601