Creep Behaviours of Argillaceous Sandstone: An Experimental and Modelling Study


 and
and
Abstract
:1. Introduction
2. Creep Tests of AS
2.1. AS Samples
2.2. Experimental Scenarios
2.3. Results and Analysis
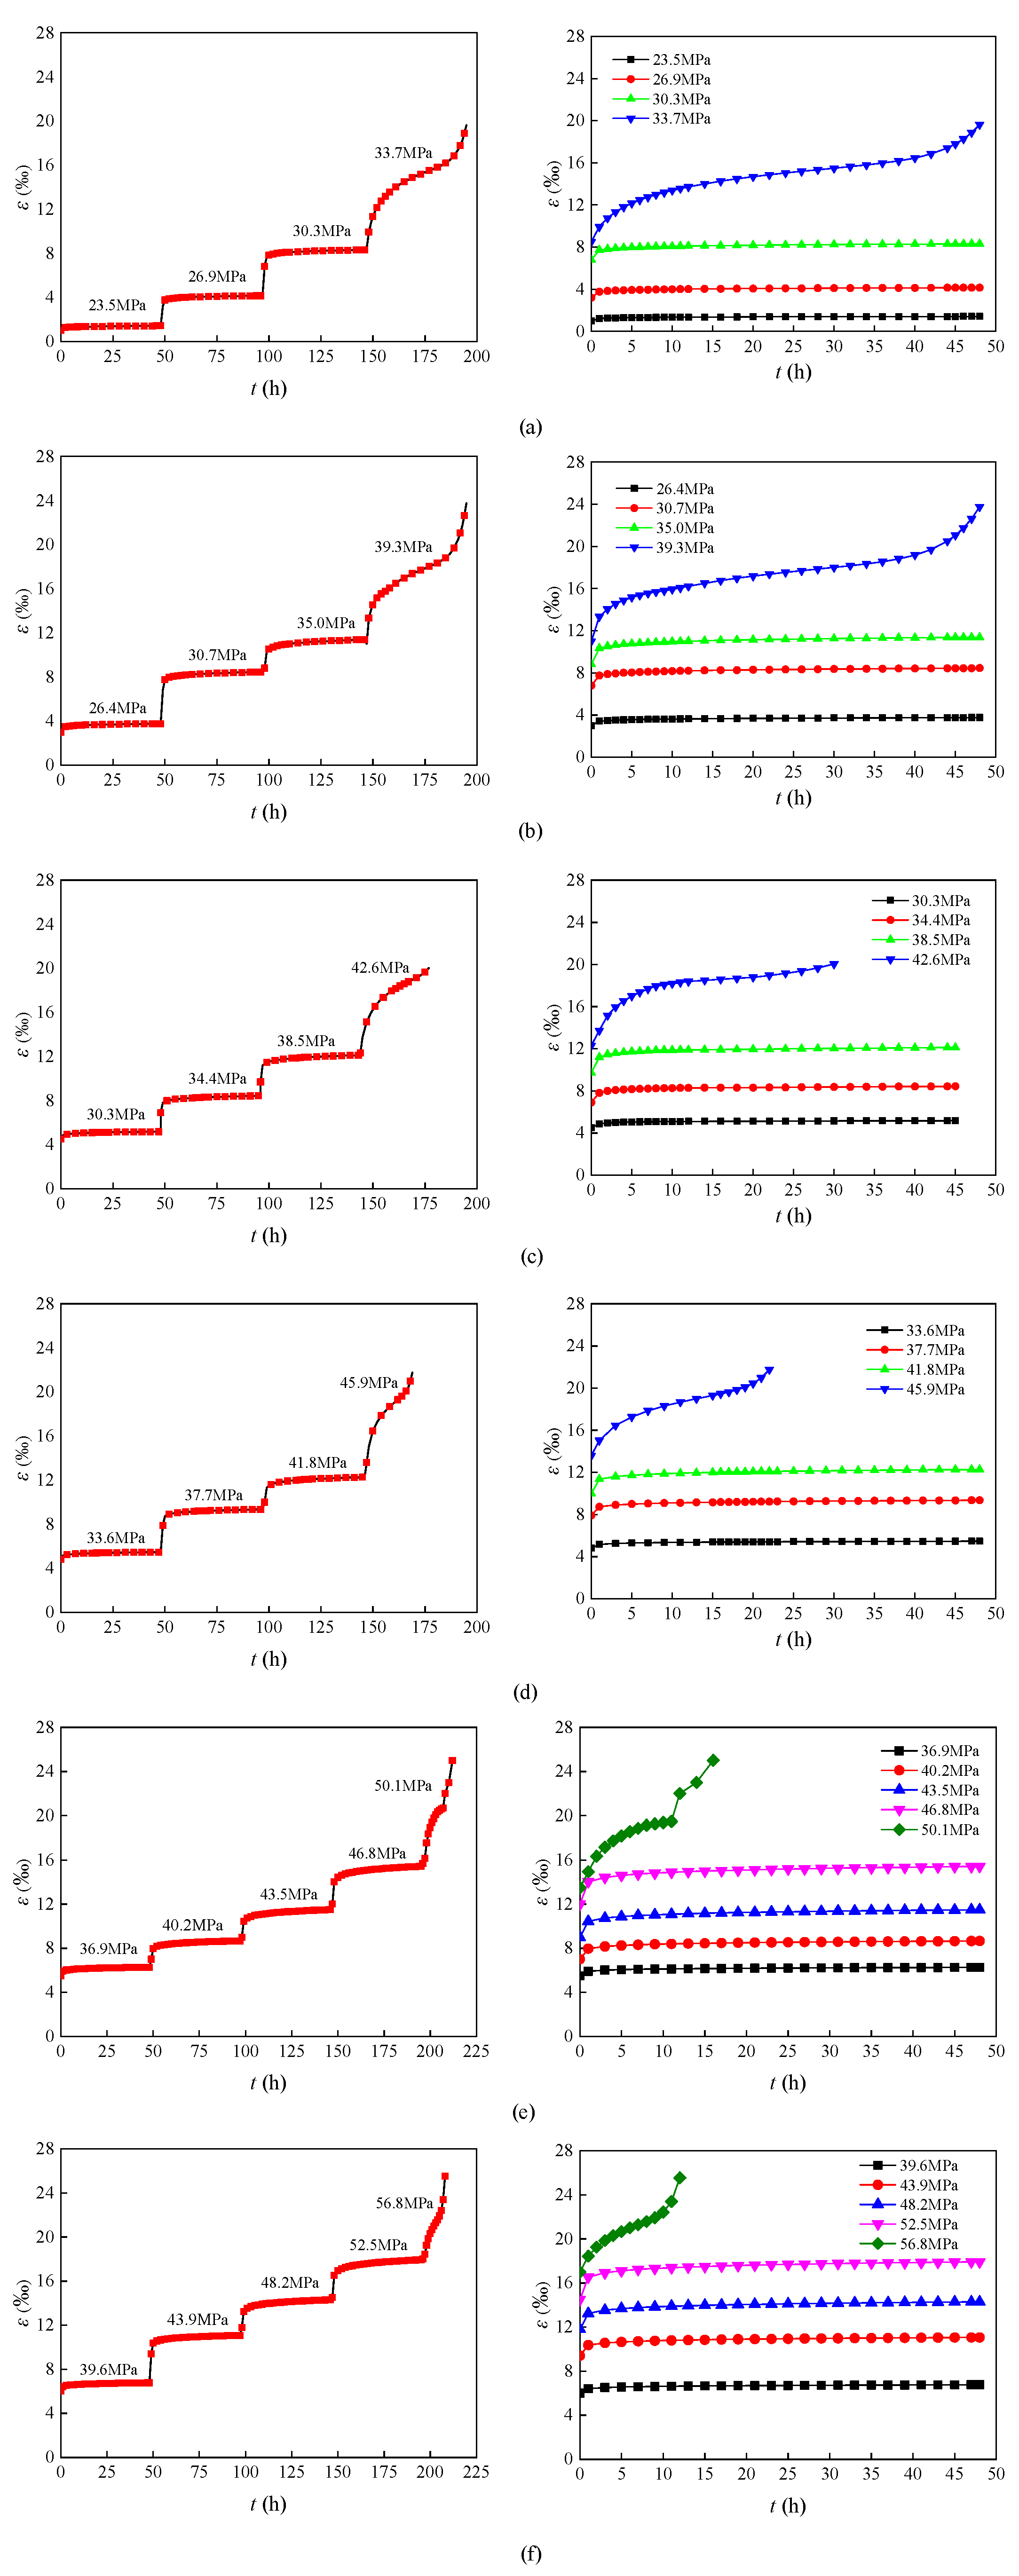
2.3.1. Strain-Time Curves and Creep Characteristic Curves of AS
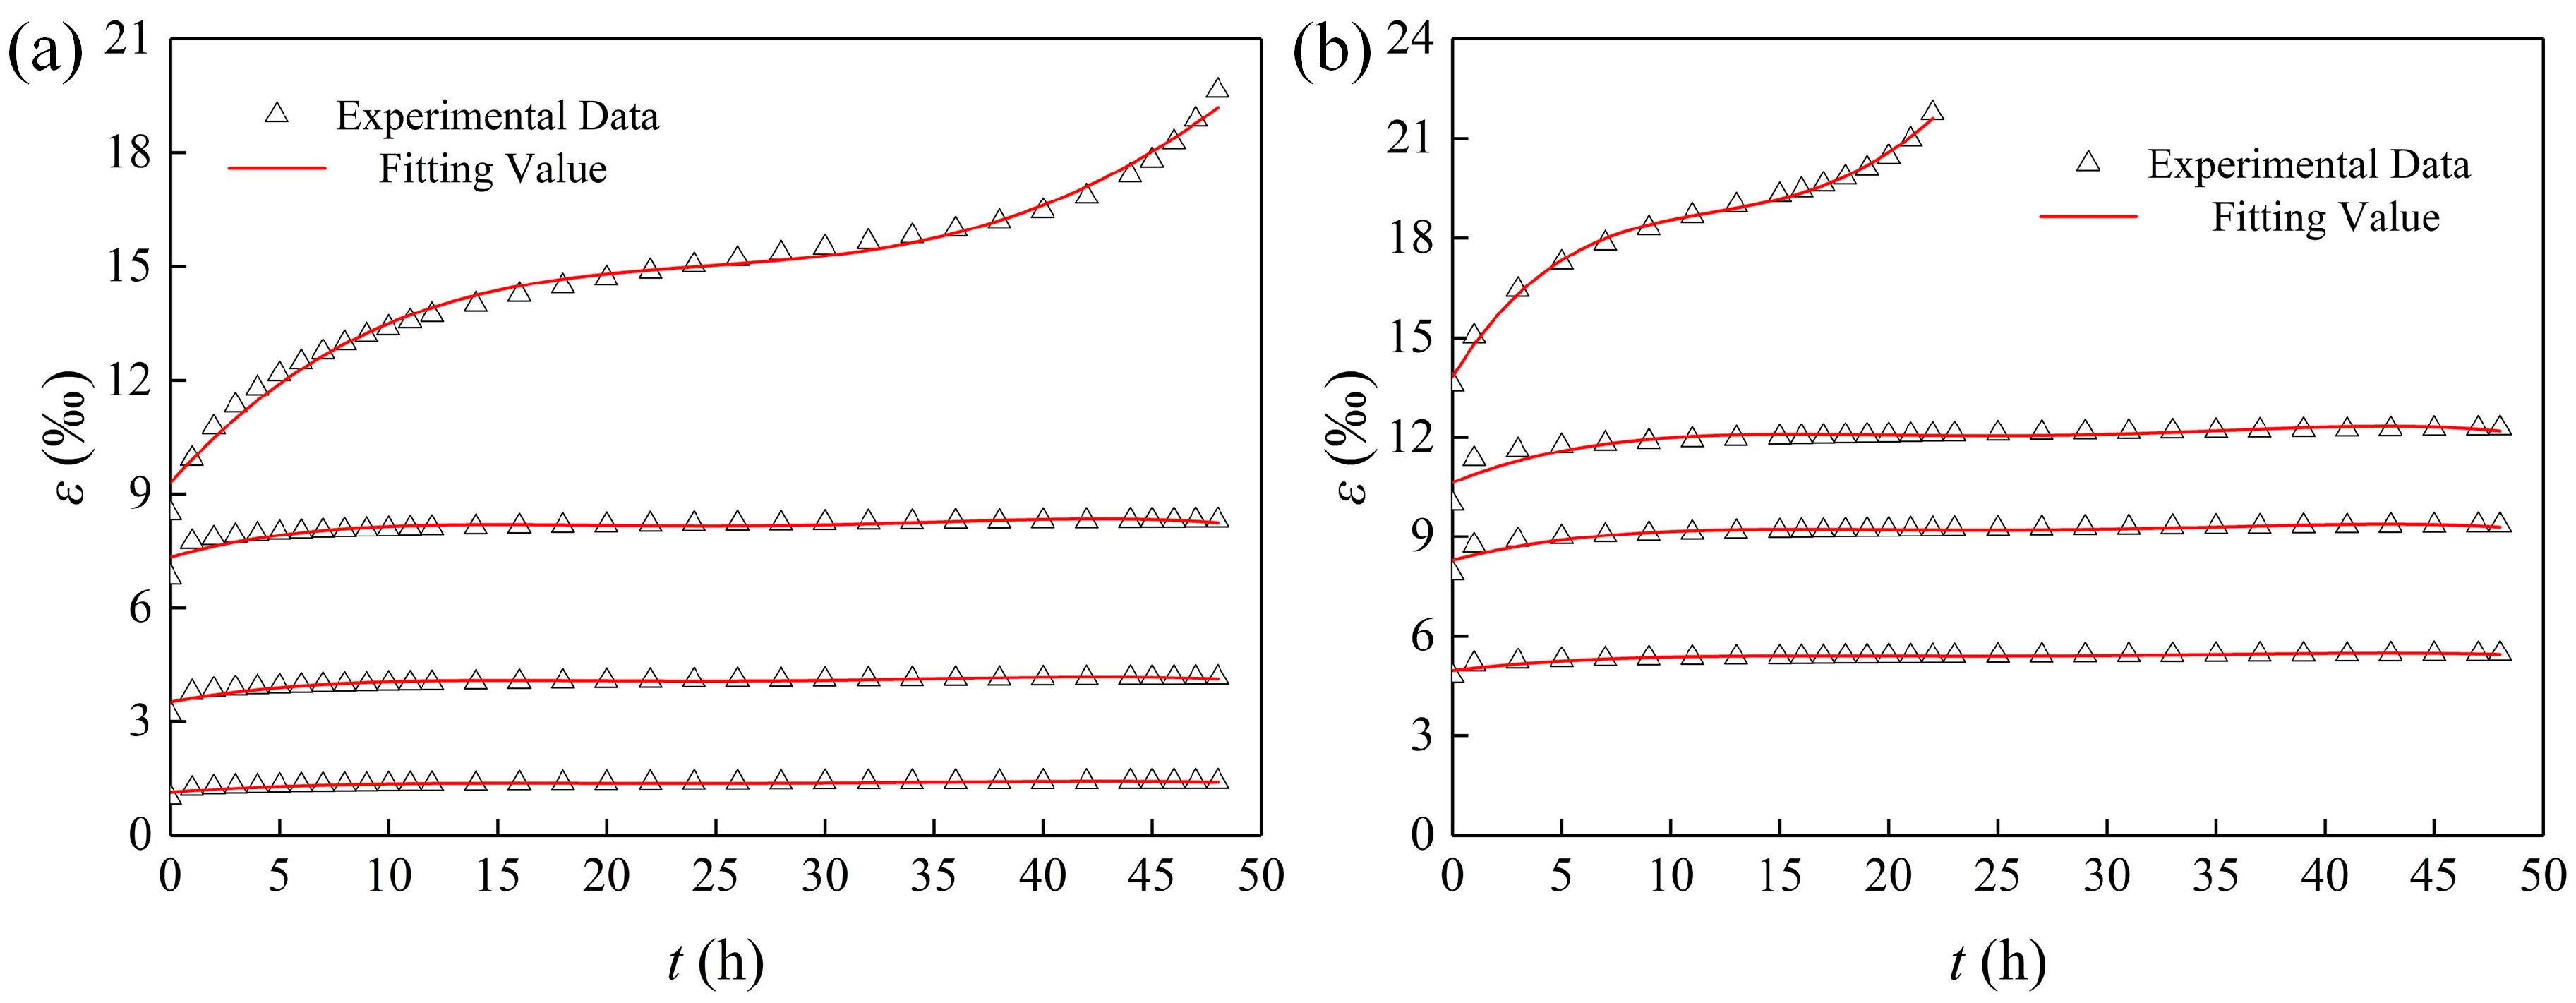
- Regardless of the confining pressure, the deformation of AS samples at the initial loading stage increased with time, although at a decelerating rate. This stage is known as the primary creep stage. With continuous loading, the strain of the AS samples exhibited a linear response with time, and this stage is known as the secondary creep stage. At the final loading stage, which is known as the tertiary stage, the strain increased exponentially with time until the failure of samples. All AS samples exhibited three complete creep stages.
- For creep tests with the same confining pressure, a certain amount of instantaneous deformation was observed when the stress loading at each stage was applied. Moreover, the deformation magnitude increased with increasing stress level. Instantaneous strain was the main component of the total strain.
- With increasing confining pressure, the total instantaneous strain increased gradually. For example, when the confining pressure was increased from 3 MPa to 6 MPa, 9 MPa, 12 MPa, 15 MPa, and 18 MPa, the ratios of instantaneous strain to total strain were 61.2%, 63.1%, 65.2%, 67.3%, 70.2%, and 73.5%, respectively.
- With increasing confining pressure, the failure load at the tertiary creep stage increased gradually. However, the failure load from the creep tests was less than the corresponding failure load from the conventional triaxial compressive tests.
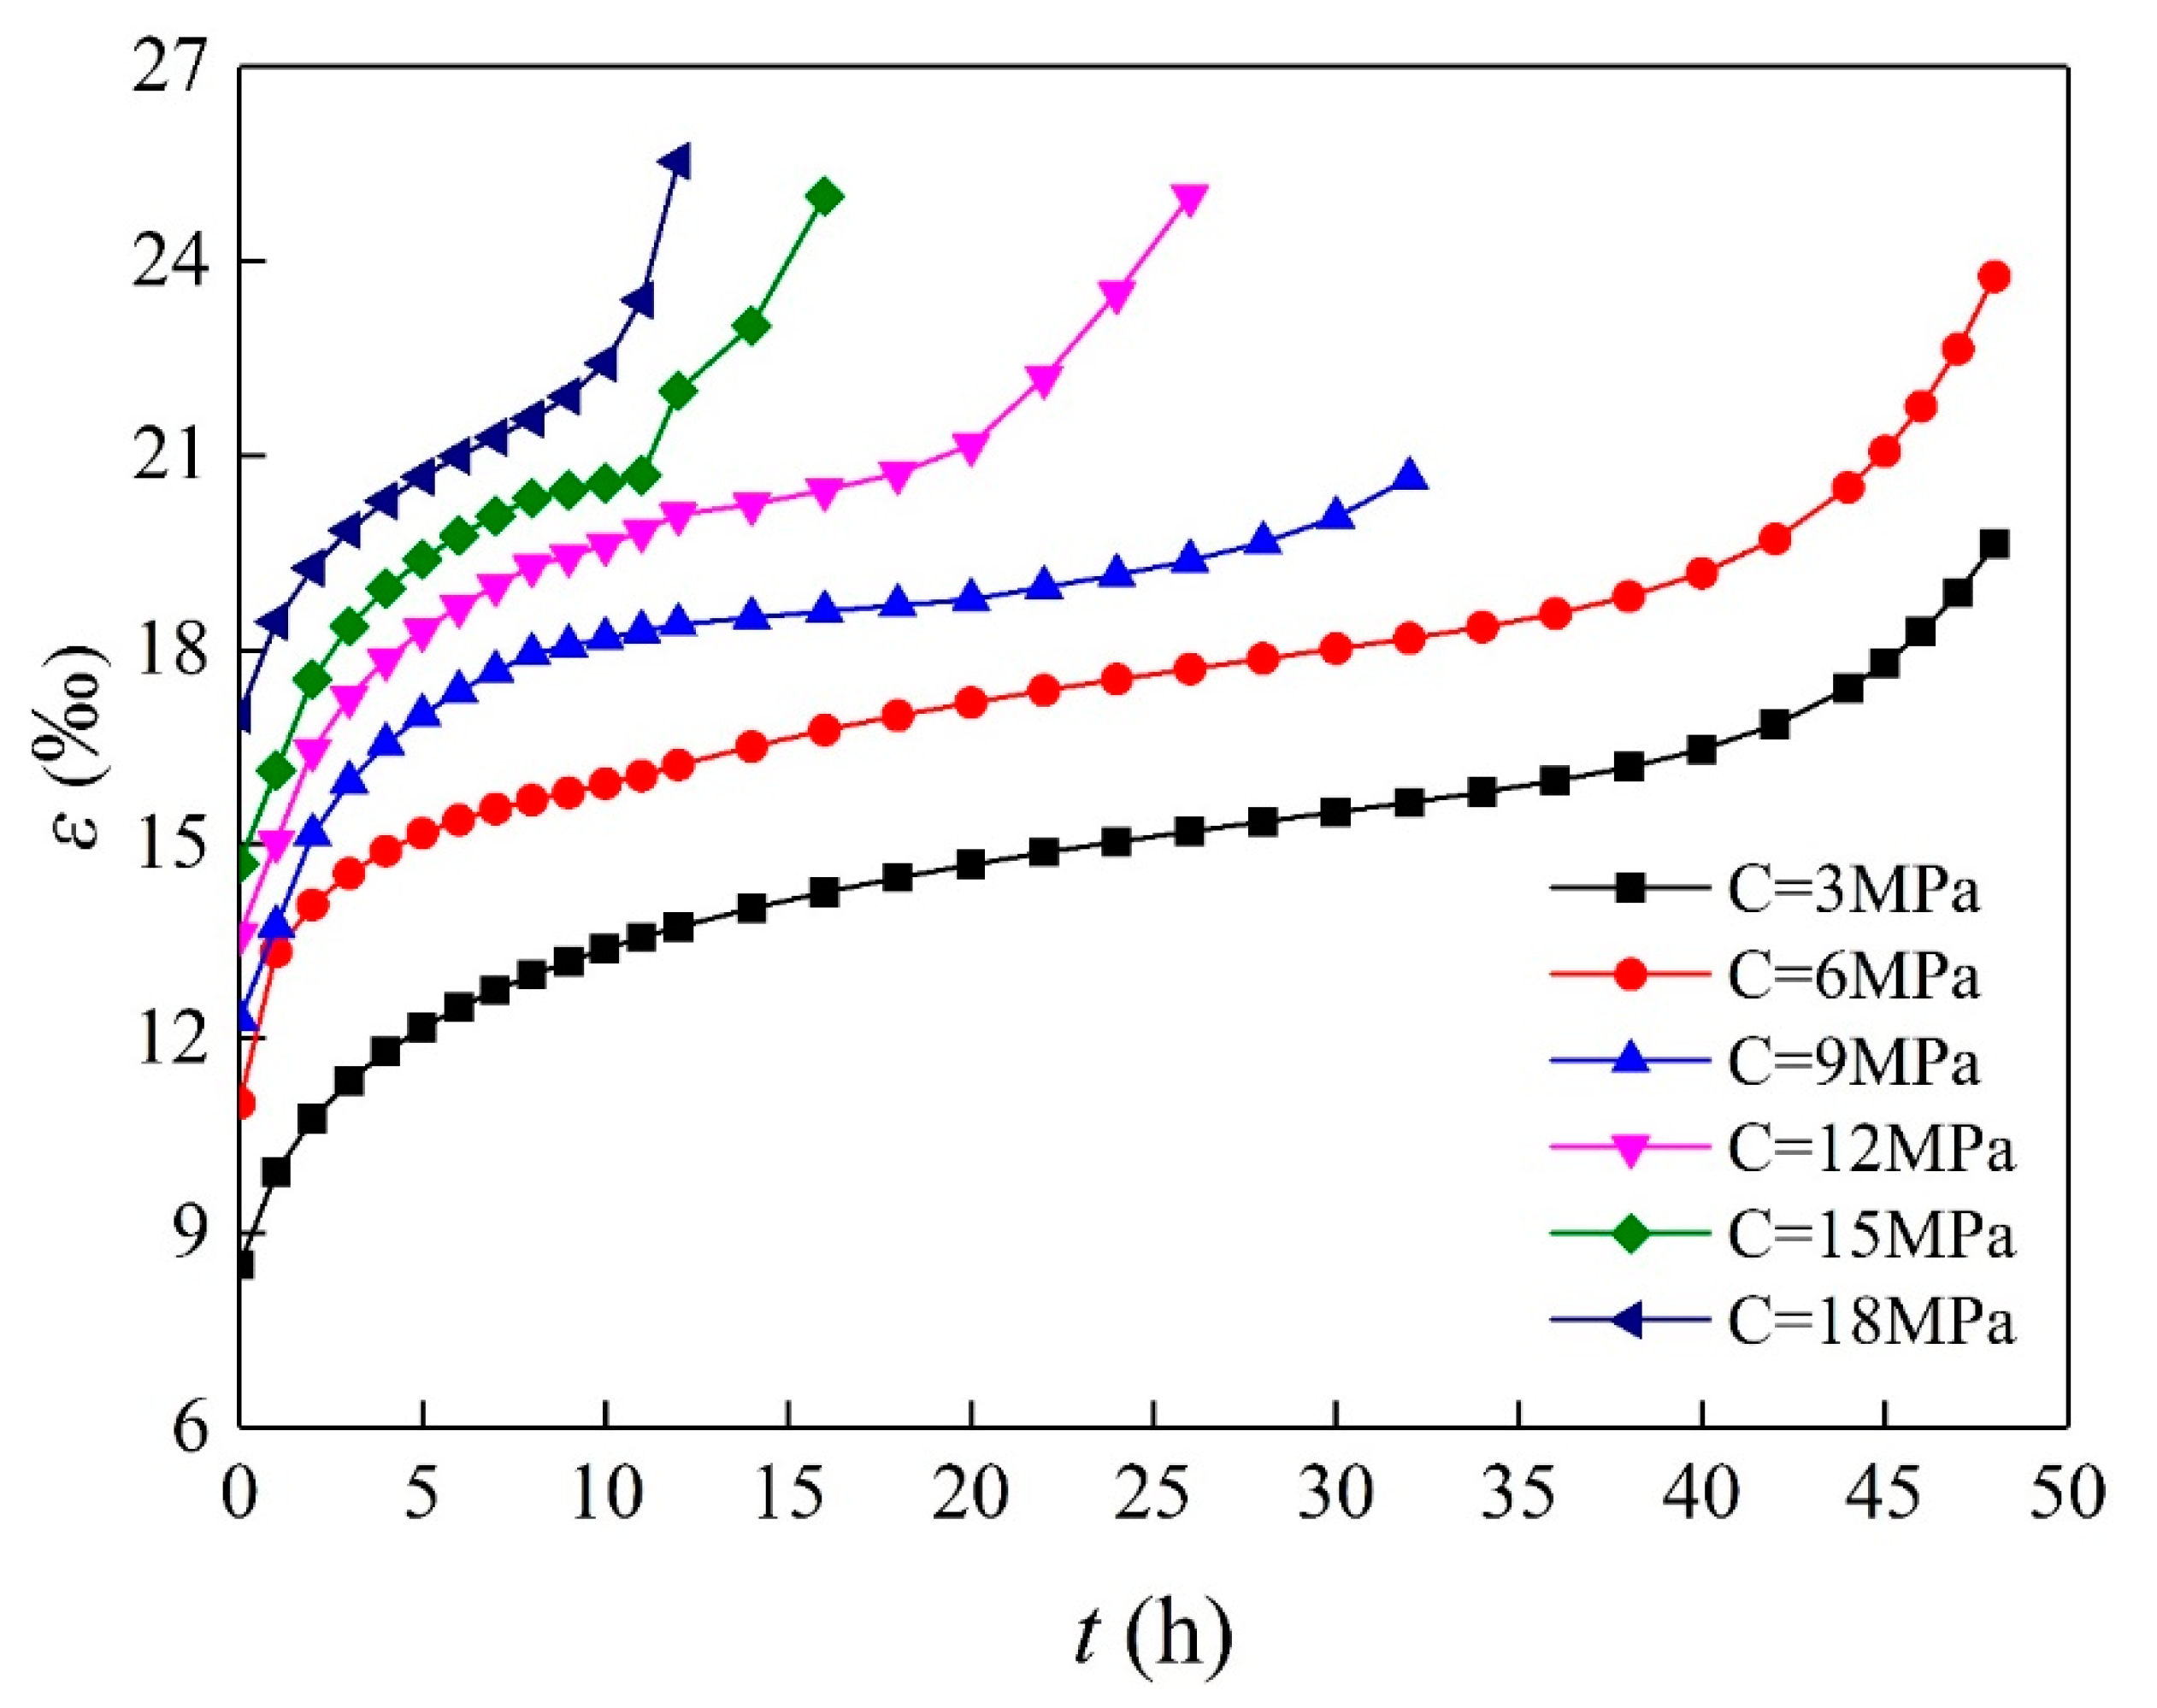
2.3.2. Creep Deformation Rate
- Based on different confining pressures, the deformation rates of AS samples showed a fast decrease at the beginning. The deformation rate became stable within 7 to 9 h.
- With increasing confining pressure, the average deformation rates in the stable stage were similar. However, evident differences were observed in the duration of the stable stage, which decreased gradually with increasing confining pressure. For example, when C = 6 MPa, the stable stage lasted approximately 30 h, and the average creep rate was 0.112 × 10⁻³ mm/h. When C = 12 MPa, the stable stage lasted only approximately 5 h, and the average creep rate was 0.08 × 10⁻³ mm/h. An interesting phenomenon was that the stable stage disappeared when C = 18 MPa.
- The influence of the confining pressure on the deformation rate at the acceleration stage was also evident. With increasing confining pressure, the duration of the acceleration stage decreased gradually. Meanwhile, the acceleration rate increased sharply. The nonlinear acceleration stage was due to the expansion of the internal cracks. At high confining pressure, the axial load of the AS samples was high, leading to a high speed of crack expansion. The crack expansion in turn accelerated the creep failure. Thus, the nonlinear acceleration stage of the deformation rate was observed.
2.3.3. Volume Expansion of AS Samples
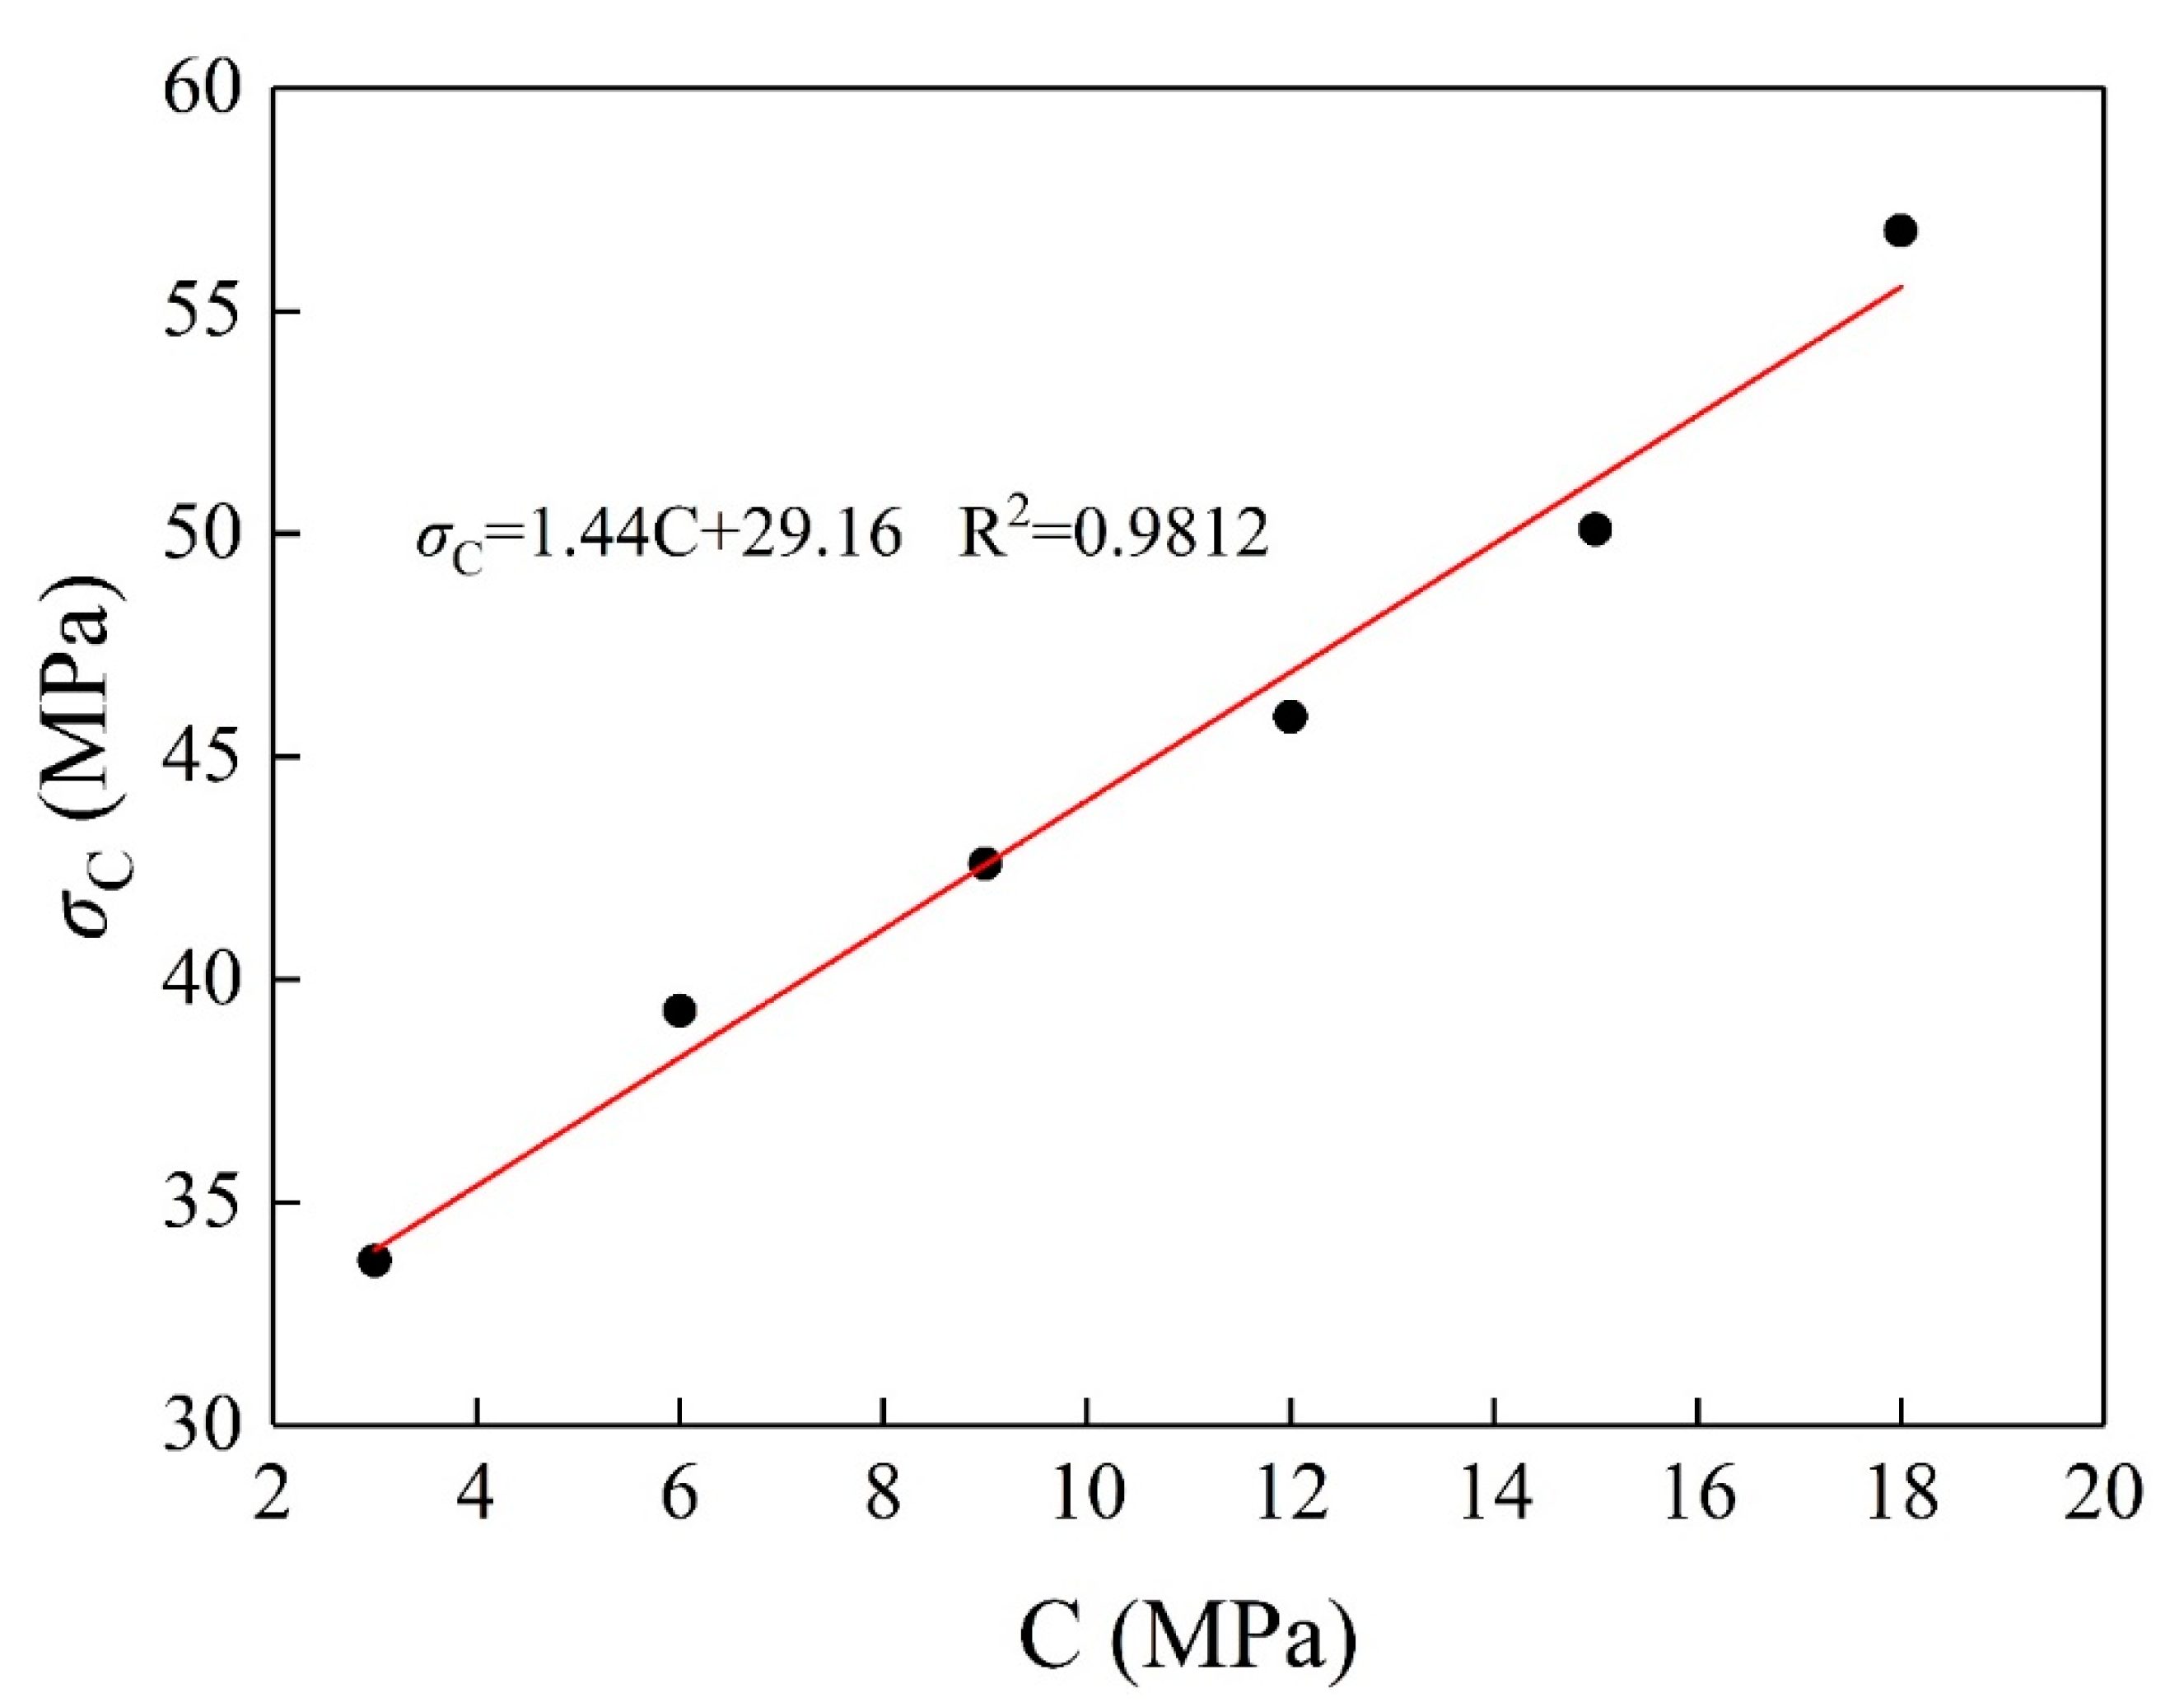
2.3.4. Creep Failure Strength
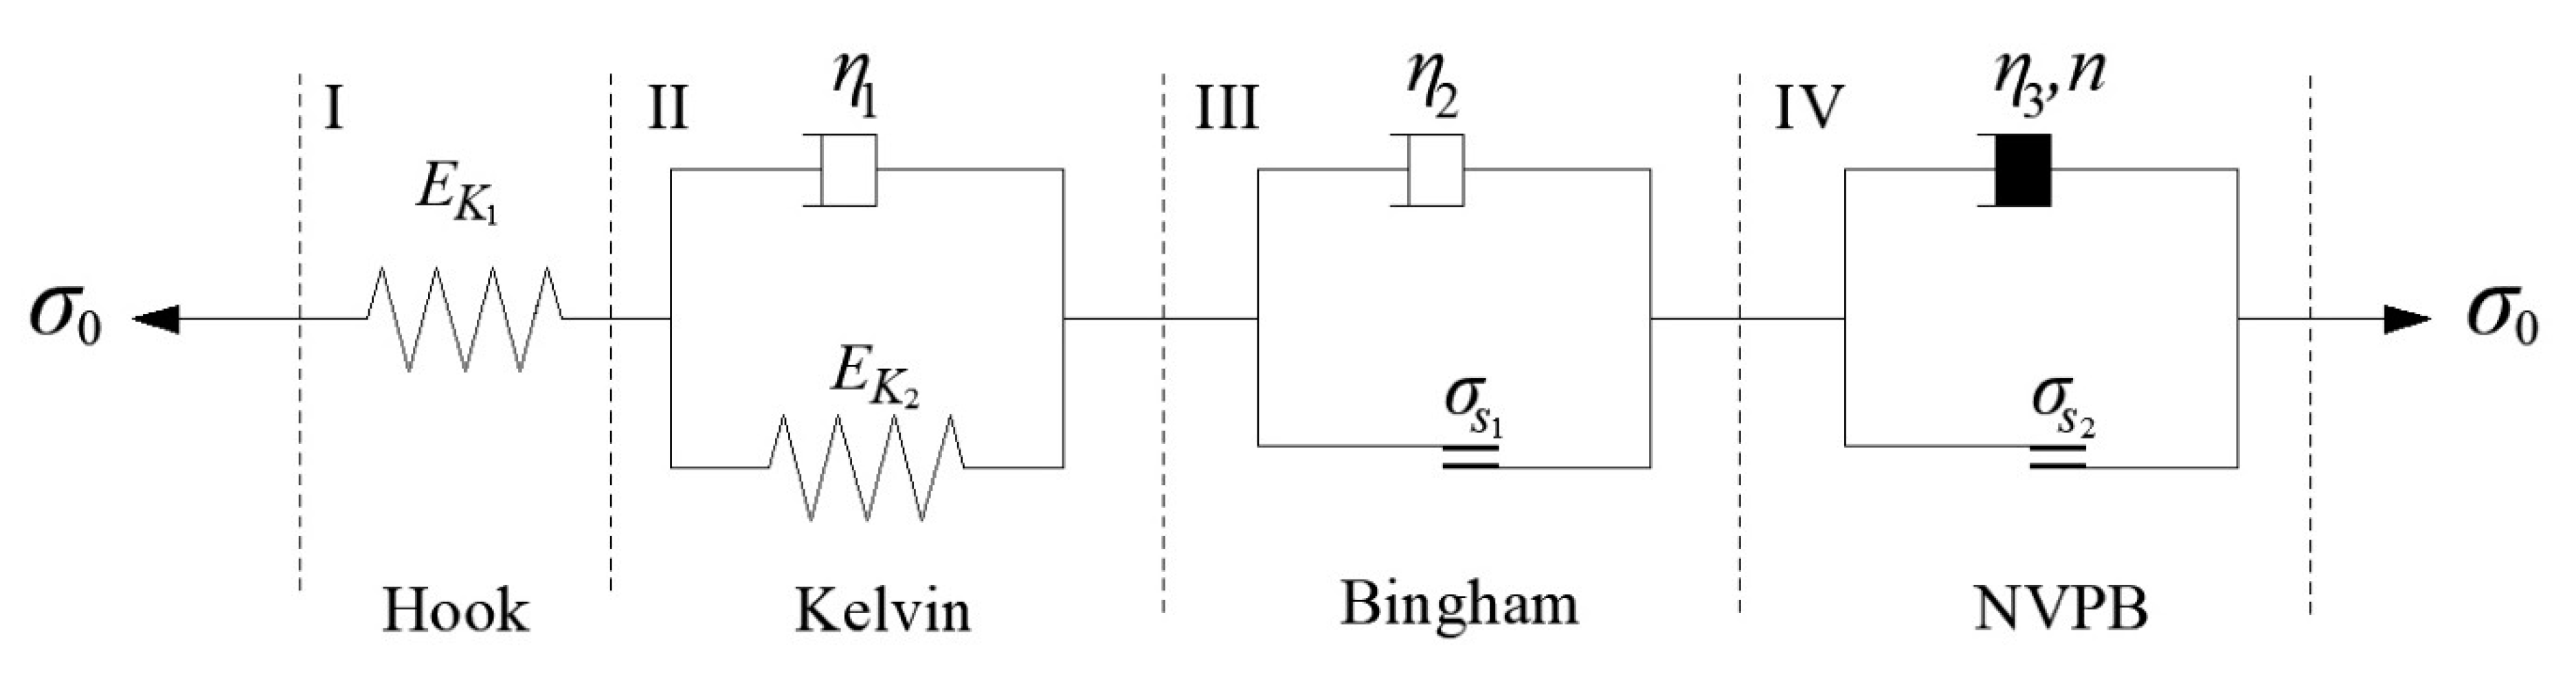
3. Nonlinear Creep Model of AS
3.1. Establishment of Nonlinear Creep Model
3.2. Nonlinear Creep Model in Three Dimensions
3.3. Determination of Creep Parameters
3.3.1. Cracking Stress and Creep Dilatancy Stress
3.3.2. Determination of the Remaining Creep Parameters
- Arbitrarily select initial values of a set of coefficients to ;
- Calculate ;
- Substitute and into (2 − 46) (28) to obtain ;
- Take , …, as the approximate values of the regression coefficients;
- Using , …, as the initial values of the regression coefficients, repeat the above steps until , , …, are small enough;
- Obtain the final values of the creep model parameters and the rheological index , which are the values of the final iterative regression coefficients to .
4. Numerical Implementation of the Nonlinear Creep Model of AS
4.1. Finite Difference Form of the Nonlinear Creep Model
4.2. Numerical Implementation in FLAC3D
4.3. Numerical Model Verification
5. Conclusions
- During the creep tests, the AS samples under various confining pressures exhibited four stages: instantaneous deformation, primary creep, secondary creep, and tertiary creep. With increasing confining pressure, the acceleration rate of the AS samples increased, and the creep failure strength gradually increased. However, due to the confining effect of confining pressure, the final volume gradually decreased.
- The nonlinear creep model of AS was constructed by adding another element, the NVPB element, to the traditional Nishihara model. The three-dimensional form of the creep model was deduced to simulate the rock creep problem under the equal confining pressure of surrounding rock masses. The parameters of the creep model could be obtained by fitting the least squares method.
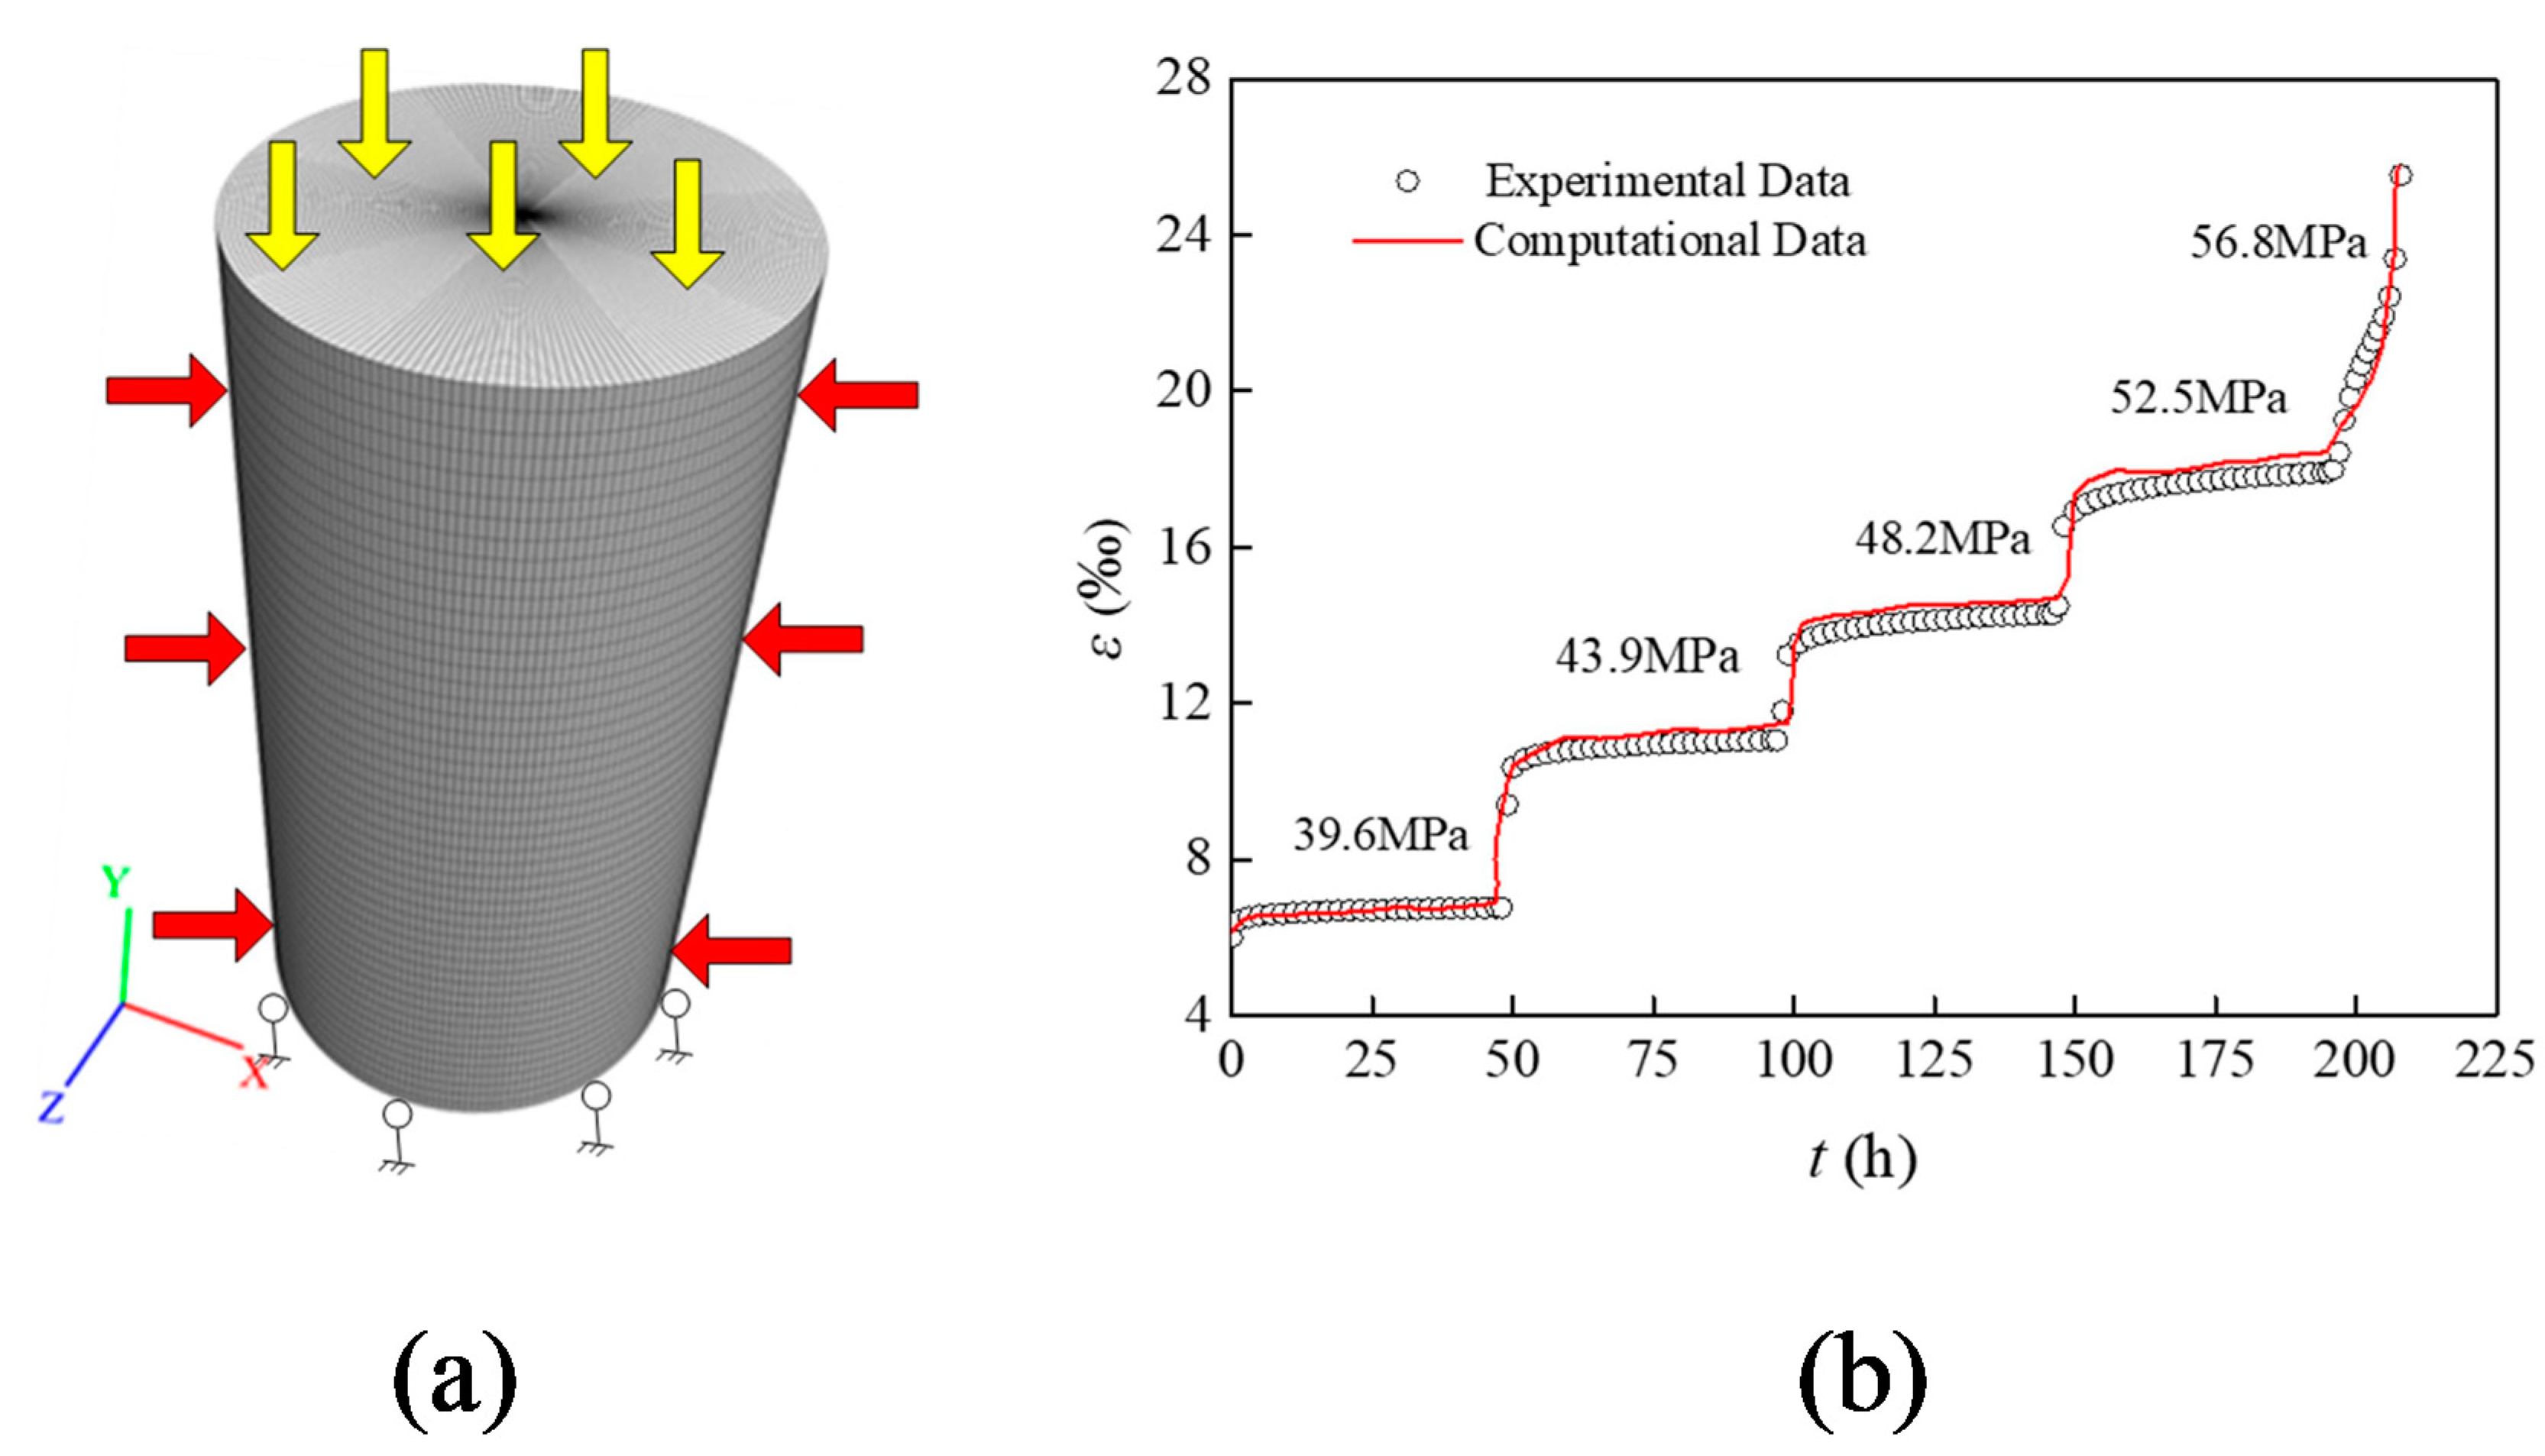
- Based on the principle of finite difference, the finite difference form of the nonlinear creep model of AS was derived, and the model was embedded in the FLAC3D software. The numerical calculation model of AS was established. The creep behaviors of specimens under a confining pressure of 18 MPa were calculated and verified with experimental data. A good agreement was observed between the numerical and experimental results, indicating the feasibility of the creep model.
- The creep and rupture process of rock is a process of damage accumulation essentially, which is not only related to the confining pressure, but also closely affiliated with factors such as loading rate and initial damage degree etc. In this paper, as the dominant factor in the engineering case, the confining pressure is used as a variable to carry out creep test research, which has certain limitations and will be supplemented in the future.
Author Contributions
Funding
Conflicts of Interest
Abbreviation
| AS | Argillaceous sandstone |
| σc | Deviatoric strength |
| σi | Creep loading at i stage |
| δ | Ratio of creep loading |
| C | Confining pressure |
| NVPB | Nonlinear volume plasticity Bingham model |
| and | Elastic moduli of elastic elements in Hook and Kelvin–Voigt bodies |
| , and | Viscous coefficients of viscous elements in Kelvin, Bingham, and NVPB bodies |
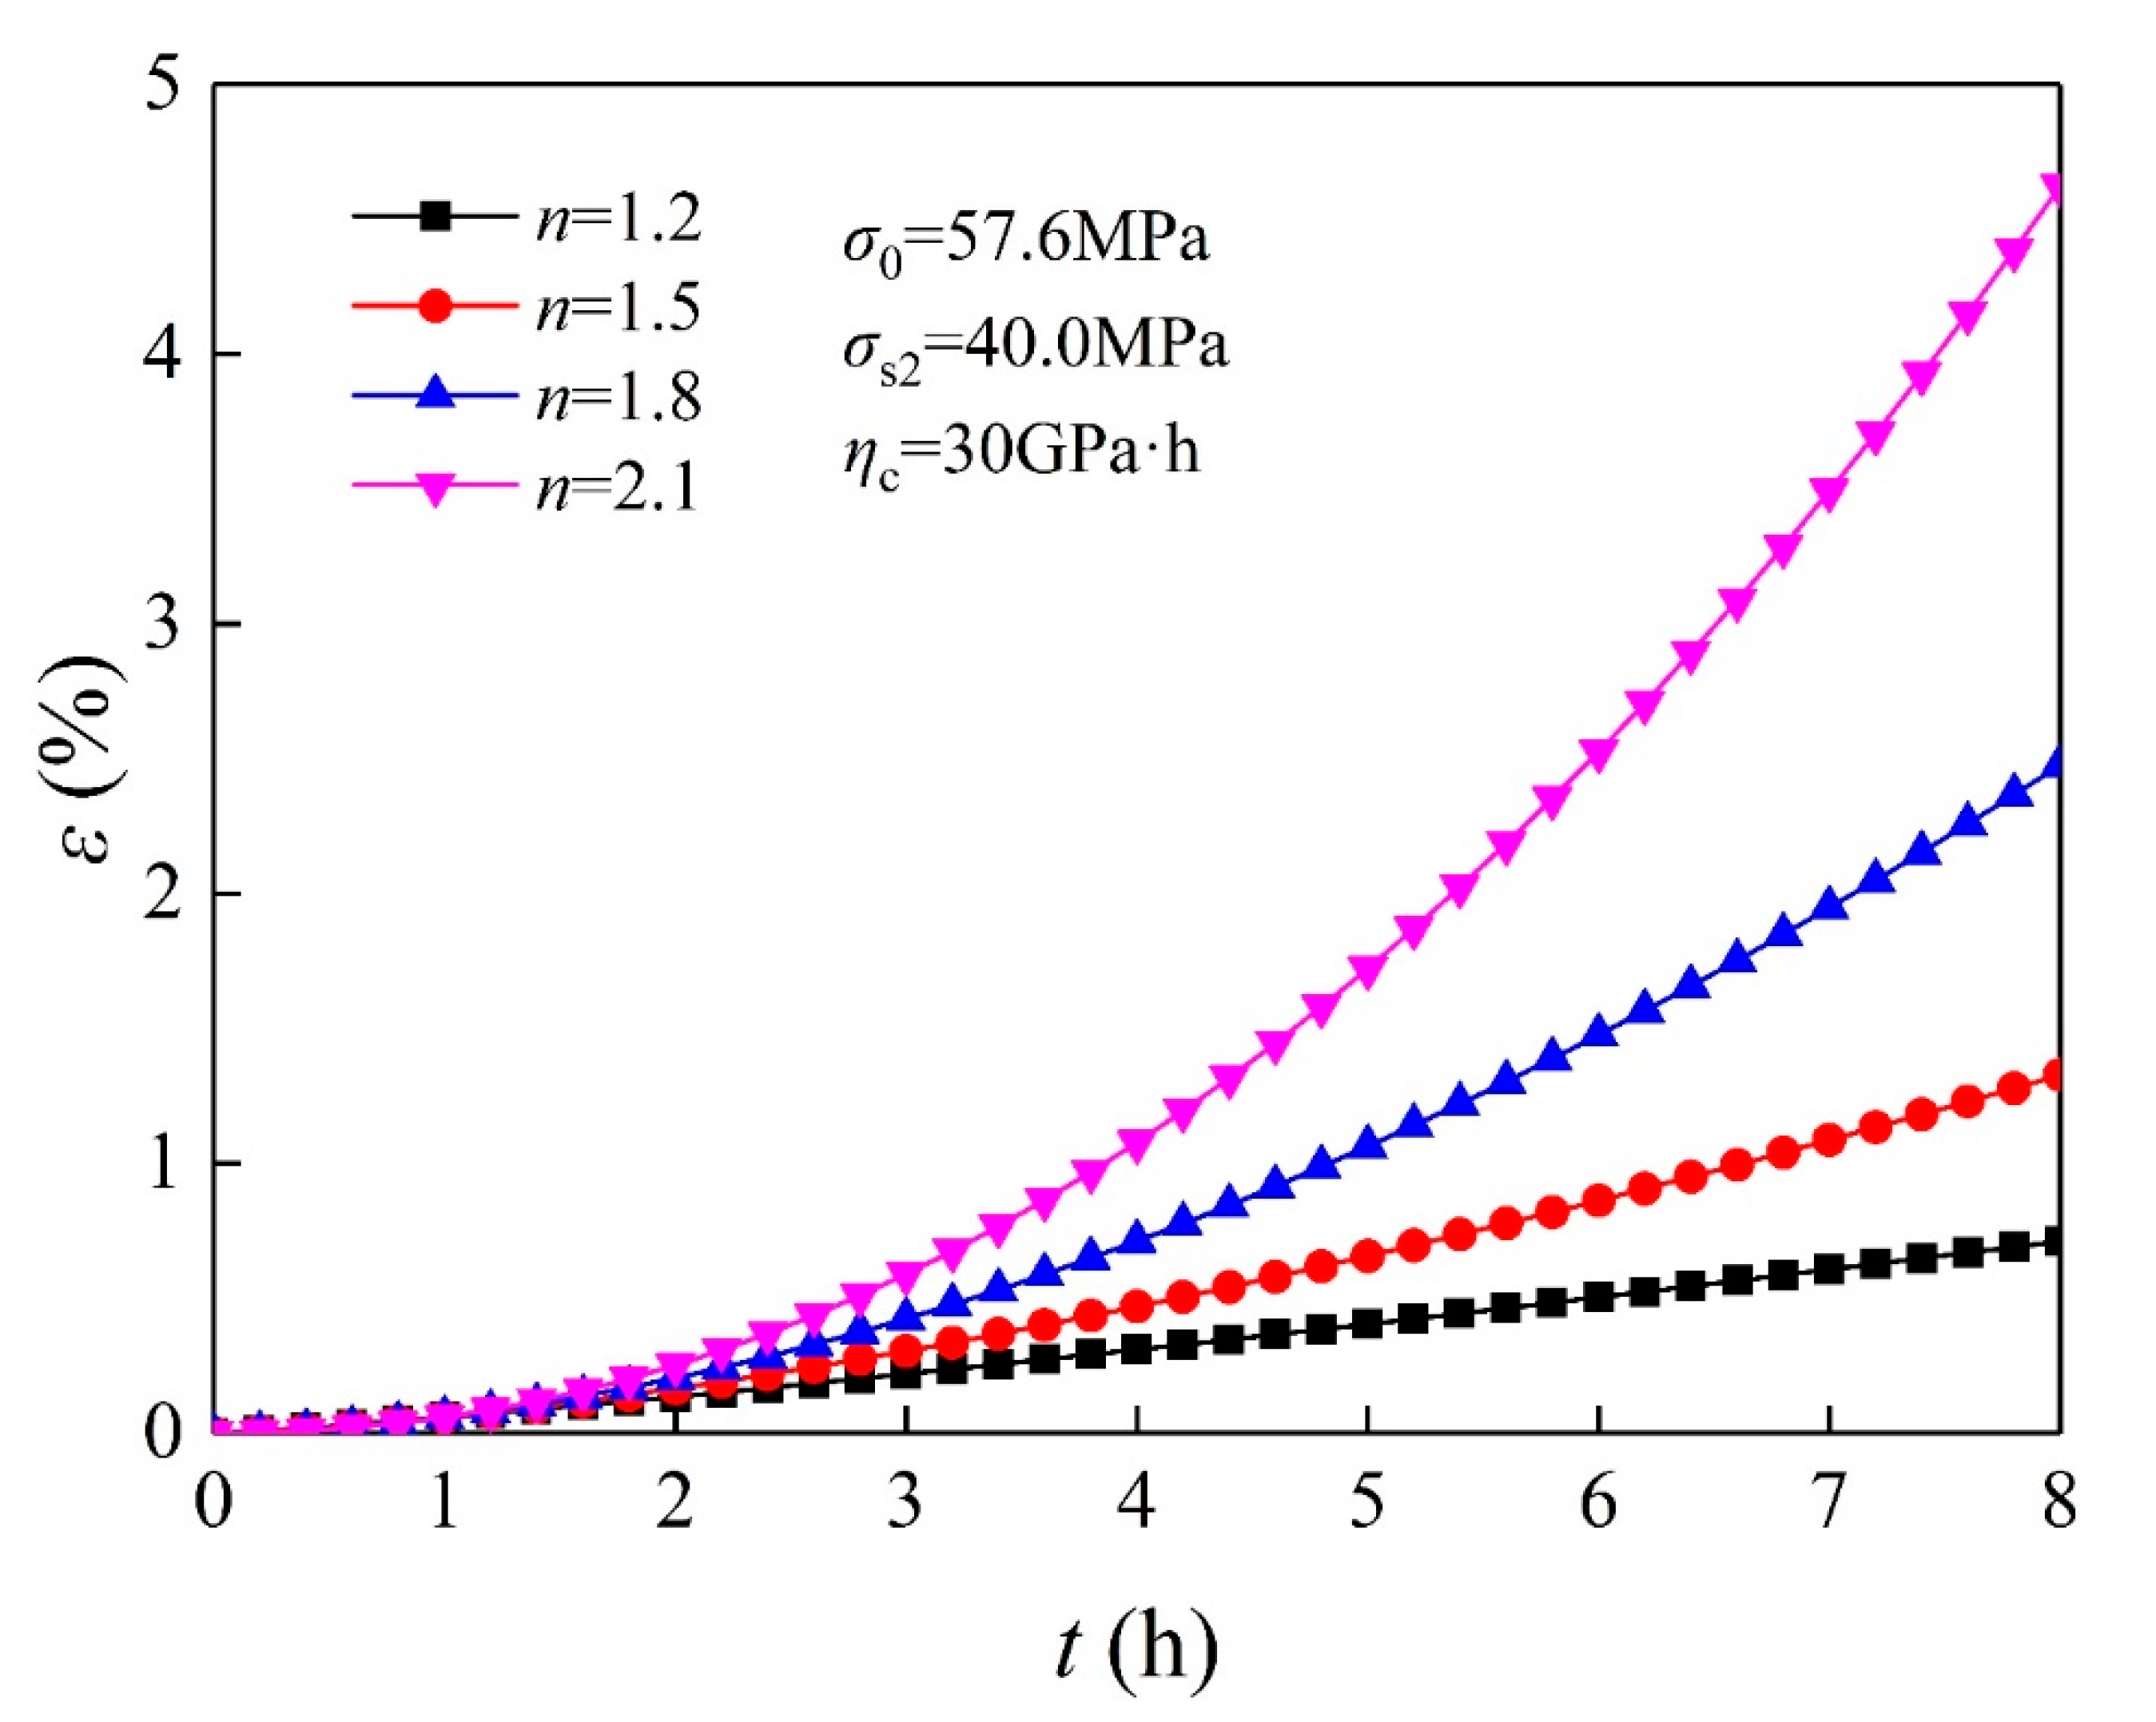
| N | Accelerated rheological rate of rock |
| and | Crack initiation stress and the expansion stress of the rock |
| Relative reference time | |
| Equivalent viscosity coefficient of the NVPB model | |
| and | Stress spherical tensor and stress deviatoric tensor |
| and | Strain spherical tensor and strain deviatoric tensor |
| K and G | Bulk modulus and shear modulus of rock mass |
| and | Initial values of yield function and yield function |
| F | Plastic potential function |
| bi | Arbitrary selection of initial values of coefficient |
| , | Partial strains of Hook, Kelvin, Bingham, and NVPB bodies |
| Deviatoric (partial) stresses of Hook, Kelvin, Bingham, and NVPB bodies | |
| and | Bulk modulus of the rock |
| Time increment step | |
| and | Average deviating stress and bias strain in a time increment |
| N and O | New and old values in a computing time step |
| ρ | Density |
| E and μ | Young’s modulus and Poisson’s ratio |
| σc and σt | Uniaxial compressive strength and uniaxial tensile strength |
| c and φ | Cohesion and internal friction angle |
References
- Bonini, M.; Debernardi, D.; Barla, M.; Barla, G. The mechanical behaviour of clay shales and implications on the design of tunnels. Rock Mech. Rock Eng. 2007, 42, 361. [Google Scholar] [CrossRef]
- Hasanpour, R.; Rostami, J.; Barla, G. Impact of advance rate on entrapment risk of a double-shielded TBM in squeezing ground. Rock Mech. Rock Eng. 2015, 48, 1115–1130. [Google Scholar] [CrossRef]
- Qi, C.; Fourie, A. Numerical investigation of the stress distribution in backfilled stopes considering creep behaviour of rock mass. Rock Mech. Rock Eng. 2019, 52, 3353–3371. [Google Scholar] [CrossRef]
- Hashiba, K.; Fukui, K. Time-dependent behaviors of granite: Loading-rate dependence, creep, and relaxation. Rock Mech. Rock Eng. 2016, 49, 2569–2580. [Google Scholar] [CrossRef]
- Yu, C.; Tang, S.; Duan, D.; Zhang, Y.; Liang, Z.; Ma, K.; Ma, T. The effect of water on the creep behavior of red sandstone. Eng. Geol. 2019, 253, 64–74. [Google Scholar] [CrossRef]
- Günther, R.-M.; Salzer, K.; Popp, T.; Lüdeling, C. Steady-state creep of rock salt: Improved approaches for lab determination and modelling. Rock Mech. Rock Eng. 2015, 48, 2603–2613. [Google Scholar] [CrossRef]
- Zhang, Y.; Shao, J.; Xu, W.; Jia, Y. Time-dependent behavior of cataclastic rocks in a multi-loading triaxial creep test. Rock Mech. Rock Eng. 2016, 49, 3793–3803. [Google Scholar] [CrossRef]
- Chen, L.; Liu, J.; Wang, C.; Liu, J.; Wang, J. Experimental investigation on the creep behaviour of Beishan granite under different temperature and stress conditions. Eur. J. Environ. Civ. Eng. 2015, 19, s43–s53. [Google Scholar] [CrossRef]
- Xu, T.; Zhou, G.L.; Heap, M.J.; Zhu, W.C.; Chen, C.F.; Baud, P. The influence of temperature on time-dependent deformation and failure in granite: A mesoscale modeling approach. Rock Mech. Rock Eng. 2017, 50, 2345–2364. [Google Scholar] [CrossRef]
- Ye, G.-L.; Nishimura, T.; Zhang, F. Experimental study on shear and creep behaviour of green tuff at high temperatures. Int. J. Rock Mech. Min. Sci. 2015, 79, 19–28. [Google Scholar] [CrossRef]
- Nicolas, A.; Fortin, J.; Regnet, J.B.; Verberne, B.A.; Plümper, O.; Dimanov, A.; Spiers, C.J.; Guéguen, Y. Brittle and semibrittle creep of tavel limestone deformed at room temperature. J. Geophys. Res. Solid Earth 2017, 122, 4436–4459. [Google Scholar] [CrossRef]
- Rybacki, E.; Herrmann, J.; Wirth, R.; Dresen, G. Creep of posidonia shale at elevated pressure and temperature. Rock Mech. Rock Eng. 2017, 50, 3121–3140. [Google Scholar] [CrossRef]
- Eslami Andargoli, M.B.; Shahriar, K.; Ramezanzadeh, A.; Goshtasbi, K. The analysis of dates obtained from long-term creep tests to determine creep coefficients of rock salt. Bull. Eng. Geol. Environ. 2019, 78, 1617–1629. [Google Scholar] [CrossRef]
- Mishra, B.; Verma, P. Uniaxial and triaxial single and multistage creep tests on coal-measure shale rocks. Int. J. Coal Geol. 2015, 137, 55–65. [Google Scholar] [CrossRef]
- Tomanovic, Z.; Miladinovic, B.; Zivaljevic, S. Criteria for defining the required duration of a creep test. Can. Geotech. J. 2015, 52, 883–889. [Google Scholar] [CrossRef]
- Jiang, Q.; Qi, Y.; Wang, Z.; Zhou, C. An extended Nishihara model for the description of three stages of sandstone creep. Geophys. J. Int. 2013, 193, 841–854. [Google Scholar] [CrossRef]
- Qi, C.; Fourie, A. A real-time back-analysis technique to infer rheological parameters from field monitoring. Rock Mech. Rock Eng. 2018, 51, 3029–3043. [Google Scholar] [CrossRef]
- Vrakas, A.; Anagnostou, G. Ground response to tunnel re-profiling under heavily squeezing conditions. Rock Mech. Rock Eng. 2016, 49, 2753–2762. [Google Scholar] [CrossRef]
- Yang, F.; Zhang, C.; Zhou, H.; Liu, N.; Zhang, Y.; Azhar, M.U.; Dai, F. The long-term safety of a deeply buried soft rock tunnel lining under inside-to-outside seepage conditions. Tunn. Undergr. Space Technol. 2017, 67, 132–146. [Google Scholar] [CrossRef]
- Wang, X.; Yin, Y.; Wang, J.; Lian, B.; Qiu, H.; Gu, T. A nonstationary parameter model for the sandstone creep tests. Landslides 2018, 15, 1377–1389. [Google Scholar] [CrossRef]
- Zhou, H.W.; Wang, C.P.; Han, B.B.; Duan, Z.Q. A creep constitutive model for salt rock based on fractional derivatives. Int. J. Rock Mech. Min. Sci. 2011, 48, 116–121. [Google Scholar] [CrossRef]
- Barla, G.; Debernardi, D.; Sterpi, D. Time-dependent modeling of tunnels in squeezing conditions. Int. J. Geomech. 2012, 12, 697–710. [Google Scholar] [CrossRef]
- Debernardi, D.; Barla, G. New viscoplastic model for design analysis of tunnels in squeezing conditions. Rock Mech. Rock Eng. 2009, 42, 259. [Google Scholar] [CrossRef]
- Jia, S.P.; Zhang, L.W.; Wu, B.S.; Yu, H.D.; Shu, J.X. A coupled hydro-mechanical creep damage model for clayey rock and its application to nuclear waste repository. Tunn. Undergr. Space Technol. 2018, 74, 230–246. [Google Scholar] [CrossRef]
- Zhao, Y.; Zhang, L.; Wang, W.; Wan, W.; Ma, W. Separation of elastoviscoplastic strains of rock and a nonlinear creep model. Int. J. Geomech. 2018, 18, 04017129. [Google Scholar] [CrossRef]
- Liu, H.Z.; Xie, H.Q.; He, J.D.; Xiao, M.L.; Zhuo, L. Nonlinear creep damage constitutive model for soft rocks. Mech. Time-Depend. Mater. 2017, 21, 73–96. [Google Scholar] [CrossRef]
- Zhou, W.; Shi, X.; Lu, X.; Qi, C.; Luan, B.; Liu, F. The mechanical and microstructural properties of refuse mudstone-GGBS-red mud based geopolymer composites made with sand. Constr. Build. Mater. 2020, 253, 119193. [Google Scholar] [CrossRef]


| Specimens | No. | ρ/g·cm−3 | E/GPa | μ | σc/MPa | σt/MPa | C/MPa | φ/° |
|---|---|---|---|---|---|---|---|---|
| AS | 1 | 0.287 | 2.2 | 0.22 | 44.66 | 4.79 | 4.8 | 32 |
| 2 | 0.289 | 1.8 | 0.25 | 29.01 | 3.44 | 5.3 | 29 | |
| 3 | 0.243 | 2.6 | 0.23 | 37.05 | 4.65 | 5.1 | 30 | |
| Average | 0.240 | 2.2 | 0.23 | 36.91 | 4.29 | 5.06 | 30 |
| C (Mpa) | σc (MPa) | σi (MPa) | ||||
|---|---|---|---|---|---|---|
| σI/δ | σII/δ | σIII/δ | σIV/δ | σV/δ | ||
| 3 | 42.5 | 23.5/55.29% | 26.9/63.29% | 30.3/71.29% | 33.7/79.29% | 37.1/87.29% |
| 6 | 47.35 | 26.4/55.76% | 30.7/64.84% | 35/73.92% | 39.3/83.00% | 43.6/92.08% |
| 9 | 52.75 | 30.3/57.44% | 34.4/65.21% | 38.5/72.99% | 42.6/80.76% | 46.7/88.53% |
| 12 | 57.37 | 33.6/58.57% | 37.7/65.71% | 41.8/72.86% | 45.9/80.01% | 50.0/87.15% |
| 15 | 62.92 | 36.9/58.65% | 40.2/63.89% | 43.5/69.14% | 46.8/74.38% | 50.1/79.62% |
| 18 | 67.3 | 39.6/58.84% | 43.9/65.23% | 48.2/71.62% | 52.5/78.01% | 56.8/84.40% |
| C (MPa) | ||||
|---|---|---|---|---|
| 3 | 30.3/71.29% | 24.24 | 33.7/79.29% | 28.65 |
| 6 | 35.0/73.92% | 28.00 | 39.3/83.00% | 33.41 |
| 9 | 38.5/72.99% | 30.80 | 42.6/80.76% | 36.21 |
| 12 | 41.8/72.86% | 33.44 | 45.9/80.01% | 39.02 |
| 15 | 46.8/74.38% | 37.44 | 50.1/79.62% | 42.59 |
| 18 | 52.5/78.01% | 42.00 | 56.8/84.40% | 48.28 |
| C/MPa | ||||||||
|---|---|---|---|---|---|---|---|---|
| 3 | 23.5 | 9.33 | 8.31 | 48.32 | 865.71 | - | - | - |
| 26.9 | 17.52 | 2.43 | 23.24 | 280.35 | - | - | - | |
| 30.3 | 3.14 | 2.17 | 17.57 | 215.63 | 3.6 | - | - | |
| 33.7 | 8.57 | 5.70 | 188.23 | 670.53 | 1660.12 | 51.31 | 2 | |
| 6 | 26.4 | 9.98 | 7.83 | 281.56 | 755.48 | - | - | - |
| 30.7 | 10.37 | 6.72 | 260.34 | 691.35 | - | - | - | |
| 35.0 | 9.84 | 6.02 | 210.73 | 466.83 | 3434.97 | - | ||
| 39.3 | 9.96 | 5.87 | 169.85 | 349.77 | 556.42 | 49.10 | 3 | |
| 9 | 30.3 | 10.55 | 6.73 | 281.53 | 841.71 | - | - | - |
| 34.4 | 10.78 | 5.75 | 226.87 | 768.69 | - | - | - | |
| 38.5 | 10.63 | 5.15 | 189.38 | 647.36 | 1436.64 | - | - | |
| 42.6 | 10.63 | 4.83 | 167.38 | 527.84 | 690.32 | 50.44 | 4 | |
| 12 | 33.6 | 11.35 | 6.47 | 298.46 | 954.37 | - | - | - |
| 37.7 | 12.02 | 6.68 | 260.14 | 857.67 | - | - | - | |
| 41.8 | 11.15 | 5.53 | 210.35 | 724.68 | 2857.64 | - | - | |
| 45.9 | 10.86 | 5.66 | 170.75 | 687.63 | 1557.86 | 57.48 | 4 | |
| 15 | 36.9 | 12.12 | 7.56 | 360.93 | 1033.75 | - | - | - |
| 40.2 | 12.45 | 7.54 | 326.67 | 957.34 | - | - | - | |
| 43.5 | 11.55 | 7.01 | 291.64 | 890.48 | - | - | - | |
| 46.8 | 11.68 | 6.82 | 242.88 | 824.35 | 3687.85 | - | - | |
| 50.1 | 11.48 | 5.82 | 190.51 | 783.42 | 1868.52 | 58.81 | 5 | |
| 18 | 39.6 | 12.13 | 8.37 | 409.65 | 1247.55 | - | - | - |
| 43.9 | 12.84 | 7.87 | 341.67 | 1001.58 | - | - | - | |
| 48.2 | 12.69 | 6.36 | 317.64 | 1034.75 | - | - | - | |
| 52.5 | 11.77 | 6.82 | 271.53 | 977.46 | 2436.32 | - | - | |
| 56.8 | 12.03 | 6.52 | 217.32 | 960.73 | 1982.54 | 55.53 | 6 |
Publisher’s Note: MDPI stays neutral with regard to jurisdictional claims in published maps and institutional affiliations. |
© 2020 by the authors. Licensee MDPI, Basel, Switzerland. This article is an open access article distributed under the terms and conditions of the Creative Commons Attribution (CC BY) license (http://creativecommons.org/licenses/by/4.0/).
Share and Cite
Zheng, H.; Cai, Q.; Zhou, W.; Lu, X.; Li, M.; Qi, C.; Jiskani, I.M.; Zhang, Y. Creep Behaviours of Argillaceous Sandstone: An Experimental and Modelling Study. Appl. Sci. 2020, 10, 7602. https://doi.org/10.3390/app10217602
Zheng H, Cai Q, Zhou W, Lu X, Li M, Qi C, Jiskani IM, Zhang Y. Creep Behaviours of Argillaceous Sandstone: An Experimental and Modelling Study. Applied Sciences. 2020; 10(21):7602. https://doi.org/10.3390/app10217602
Chicago/Turabian StyleZheng, Huaiguo, Qingxiang Cai, Wei Zhou, Xiang Lu, Ming Li, Chongchong Qi, Izhar Mithal Jiskani, and Yu Zhang. 2020. "Creep Behaviours of Argillaceous Sandstone: An Experimental and Modelling Study" Applied Sciences 10, no. 21: 7602. https://doi.org/10.3390/app10217602