1. Introduction
In the past decade, due to climate changes there has been an increasing attention on reducing greenhouse gas (GHG) emissions. In accordance with the Paris Agreement (Council Decision (EU) 2016/1841 of the 5 October 2016) from 2023, every 5 years a comprehensive assessment of the progress of the parties will be made on the basis of scientific data and the situation regarding the reduction of emissions, the adjustments made and the support provided will be analysed. Compared to 1990, the mandatory target set for 2030 is at least a 40% domestic reduction economy-wide greenhouse gas (GHG) emissions [
1].
Agricultural biomass is considered one of the most important renewable energy resources and contributes to the development of bioenergy generation. It consists of annual and perennial energy crops (green biomass for animals feed), residues from agricultural production (straw, corn stalks, corn cobs, sugar cane, etc.,) and the food industry (residues from dairy industry, sugar industry, etc.,). In recent years, there has been an increasing trend in obtaining bioethanol from renewable resources such as straws resulted from cereals harvesting. However, huge quantities of wheat straws (WS) are generated annually which could be used for the production of cellulosic bioethanol [
2,
3]. Liquid biofuels can partially or completely replace conventional fuels and can be an alternative source in the transport sector (aviation, shipping and heavy freight trucks). Therefore, liquid biofuels are an important solution because they do not require major changes in distribution infrastructure or the transport fleet. International Renewable Energy Agency (IRENA) argues that a reduction in carbon emissions by 2050 is only possible if there is a five-fold increase in biofuel consumption, from 130 billion litres in 2016 to almost 650 billion litres in 2050 [
4].
Wheat (Triticum sp.) is the third most cultivated cereal in the world. Based on the data provided by Food and Agriculture Organization of the United Nations (FAOSTAT) in 2020, the worldwide cereal production is 2789.8 million tons. The worldwide cereal production in 2020 (2789.8 million tons) is higher by 3% compared to 2019 (2708.5 million tons) [
5]. In 2019/2020 the estimated global wheat production is 762.2–764.1 million tons in comparison with the production of 2018/2019 which was 732.1 million tons (
Figure 1) [
6,
7]. Therefore, if we take into account a coefficient of 1.3 [
8,
9], in 2019/2020 an amount of 990.86–993.33 million tons of wheat residues were produced.
The wheat straw is consisted of internodes (57 ± 10%), nodes (10 ± 2%), leaves (18 ± 3%), straw (9 ± 4%) and the central axis (6 ± 2 %). The chemical composition of the wheat straw contains cellulose (34–40%), hemicellulose (20–25%) and lignin (20%) [
10,
11,
12,
13].
Cellulose is a linear polymer composed of β-
D-glucopyranosyl units linked at 1,4 positions [
14]. The utilisation of cellulose and hemicellulose sugars present in the hydrolysate of lignocellulosic biomass is essential for the production of bioethanol [
15]. Hemicellulose is a complex polysaccharide, found in the cell walls of plants, composed of neutral monosaccharide units:
D-xylose,
D-manose,
D-galactose,
D-glucose,
L-arabinose,
D-glucuronic acid etc. Hemicellulose fractions consist of β-
D-xylopyranose backbone residues linked at 1,4 positions to the units of
L-arabinose,
D-galactose and/or
D-glucuronic acid [
16].
The mechanical pretreatment of lignocellulosic materials is an important stage in the process of obtaining bioethanol which reduces the particle size and crystallinity of cellulose, increases the contact surface, dissociates tissues and disintegration of the cell wall [
17,
18,
19]. All these parameters contribute significantly to the conversion of saccharides during hydrolysis. Talebnia et al. (2010) reported in their study that mechanical pretreatment (chopping and grinding) contributes significantly to the improvement of enzymatic hydrolysis of WS. It was established that, after 24 h of hydrolysis, the content of glucose and xylose was increased by 39% and 20% respectively when the particle size was reduced from 2–4 cm to 53–149 μm [
8]. However, the very small particles is a disadvantage because it leads to a high energy consumption in the milling phase. On the other hand, the additional elimination of lignin contributes significantly to the decrease of energy consumption [
20].
The acid pretreatment leads to the formation of inhibitory compounds at a low value of pH, high temperature and pressure. The degradation of lignin and hemicellulose produces free organic acids (acetic, formic and levulinic acid) or phenolic derivatives (4-hydroxynenzoic acid or vanillin), and 2-furaldehyde (furfural–FF) with 5-hydroxymethyl-2-furaldehyde (hydroxymethylfurfural–HMF) which affect negatively the chemical composition, enzymatic hydrolysis and fermentation. The FF and HMF are obtained from the transformation of pentoses (xylose and arabinose) and hexoses (glucose, mannose and galactose) [
21]. Acid pretreatment is a significant phase for obtaining bioethanol which destroys the crystalline structures of cellulose and increases the accessibility of the enzyme during enzymatic hydrolysis [
22,
23]. Zheng et al. (2017) studied the impact of acid pretreatment on WS, using 2% and 4% of H
2SO
4. This pretreatment led to the elimination of high amount of hemicellulose [
24]. The acid pretreatment is most suitable for WS, but also has some disadvantages, such as acid pollution of the environment and feed, and production of secondary compounds [
25,
26,
27]. Tian et al. (2018) established that pretreatment with 2% diluted H
2SO
4 improved the rate of lignin removal from WS [
27]. Mardetko et al. (2018) reported that pretreatment with 0.5% H
2SO
4 was more effective in obtaining a higher amount of glucose (4.84 g/L) for 10 min at 200 °C compared to 4.09 g/L glucose obtained by using 2% H
3PO
4 [
28].
During pretreatment, HMF can be converted to formic and levulinic acid, while FF to formic acid [
19]. The structure of hemicellulose is composed of acetylated sugars which can turn into acetic acid during pretreatment. Also, during lignin pretreatment, significant amount of phenolic and aromatic compounds was achieved [
29]. These compounds limit the transformation of sugars into bioethanol which reduce the final yield of this alcohol.
Enzymatic hydrolysis is the most efficient method of releasing carbohydrates from lignocellulosic materials. Thus, the hydrolysis of cellulose is catalysed by a class of enzymes, called cellulases. This type of hydrolysis is influenced by the lignocellulosic substrate, enzyme activity and process conditions [
8]. By hydrolysis, high concentrations of acetic and formic acids were detected, with values between 4.9–9.4 g/L and 1.6–10.3 g/L, respectively, and levulinic acid of 0.3–0.6 g/L. Acetic acid, furfural and HMF are the products that result from hydrolysis and has inhibitory effects on the fermentation process [
30].
The aim of this paper is to obtain bioethanol as a result of the superior recovery of wheat straw. A number of objectives have also been set for monitoring the whole process, such as the pretreatment, enzymatic hydrolysis and fermentation steps. To find out which is the most indicated option for pretreatment of wheat straws and its effect on the hydrolysis step, a diluted concentration of 1, 2 and 3% (v/v) H2SO4 was used.
2. Materials and Methods
2.1. Materials
Wheat straws (WS) used in this study were collected on 21st of July 2020, from Mitocu Dragomirnei (Suceava county, Romania, 47°45′14.0″ N 26°13′44.0″ E).
The analytical reagents, standard materials and enzymes used in this study were purchased from Sigma-Aldrich. The utilised enzymes Viscozyme® L and Celluclast® 1.5 L (Novozyme Corp, Bagsvaerd, Denmark) were used for enzymatic hydrolysis. The yeast, fermentation activator and diammonium phosphate (DAP) were purchased from Enzymes & Derivates, Neamț. Milli-Q water (Direct-Q® 3 UV, Milipore SAS 67120, Molsheim, France) was used in the preparation of reagents, standards and samples.
Viscozyme® L contains a multienzymatic complex of carbohydrates such as arabanase, cellulase, β-glucanase, hemicellulase and xylanase. This is a clear liquid enzyme produced by Aspergillus aculeatus which has brown color and has a density of approx. 1.2 g/mL, enzymatic activity ≥ 100 FBG/g (β-glucanase fungal units) with activity under optimal conditions at pH between 3.3 and 5.5 and a temperature of 25–55 °C. The enzyme must be stored at a temperature of 2–8 °C.
Celluclast® 1.5 L is an enzyme (endoglucanase) that hydrolyses the (1,4)-β-D-glucoside bonds in cellulose and other β-glucans. This is a brown liquid enzyme and is produced by Trichoderma reesei, has a density of approx. 1.22 g/mL, enzymatic activity ≥ 700 EGU/g (β-glucanase fungal units) with activity in optimal conditions at pH between 4 and 6 and a temperature of 25–55 °C. At lower temperatures (5–10 °C) the shelf life is considerably increased.
Hydra PC is a yeast activator that helps strengthen its plasma membrane and gives it increased resistance in unfavourable environments. This product contains a significant amount of magnesium that contributes to cell division, increases the speed of yeast development.
DistillaMax SR is a special yeast of the species Saccharomyces cerevisiae that produces low levels of higher alcohols and has good resistance to osmotic pressure, organic acids and high temperatures. The recommended amount is between 10 and 50 g/hL, and the fermentation temperature is 30–35 °C.
2.2. Methods
2.2.1. Chemical Composition of WS
Total of 5 g of ground WS was accurately weighed on analytical balance (Partner Corporation, Bracka 28, Poland) and heated at 105 °C for 4 h to a constant mass in an oven [
31]. Then, the ash content was determined by weighing 1 g of ground WS and calcining at 575 ± 25 °C for 3 h [
32] in a furnace (Thermo Scientific Thermolyne, Kerper blvd Dubuque, Iowa, USA). The content of cellulose [
31] and lignin [
32] was determined using the methods described by Ishtiaq et al. (2010) and Sluiter et al. (2012) respectively.
2.2.2. Pretreatments of WS
A. Mechanical pretreatment. The WS were cut into small pieces and then heated at 40 °C for 24 h in an oven (Memmert, Schwabach, Germany). Then, WS were milled and sieved in a shaker (Sieve shaker Retsch, Haan, Germany). In this study, the particle size used of wheat straws grounded (WSG) was <1 mm.
B. Physico-chemical pretreatment. Total of 2 g of WSG were weighed with accuracy and precision of 0.001. The samples were added in borosilicate glass bottles with polypropylene cap and pouring ring and were boiled for 1 h at 100 °C in a water bath (Precisdig JP Selecta, Abrera, Barcelona, Spain) with different concentration of H2SO4 (1, 2 and 3% (v/v)) and solid/liquid (S/L) ratio (1/20, 1/25 and 1/30 w/v). Then, the samples were rapidly cooled using cold water.
2.2.3. Enzymatic Hydrolysis of Pretreated WS
The preatreated samples were filtered under vacuum using Whatman qualitative filter paper, grade 5 and washed with 100 mL of Milli-Q water to remove enzymatic inhibitory compounds. Then, the solid fraction was transferred into borosilicate glass bottles with polypropylene cap and pouring ring, and Milli-Q water was added over the solid fraction, maintaining the S/L ratio of 1/20, 1/25 and 1/30 respectively. The pH of obtained samples was corrected to 4.5 with 3 M NaOH using a pH meter (Mettler-Toledo, model SevenCompact S210). The enzyme activities were described by Ghose (1987) and used by Vintilă et al. (2019) [
33,
34,
35]. Afterwards, 30/30 µL/g or 20 FPU/g, 60/60 µL/g or 40 FPU/g and 90/90 µL/g or 60 FPU/g (Viscozyme
® L and Celluclast
® 1.5 L) were dosed in the pretreated WS. The order of addition of the enzymes was Viscozyme
® L and Celluclast
® 1.5 L, respectively, which were allowed to act for 24 h at 52 °C.
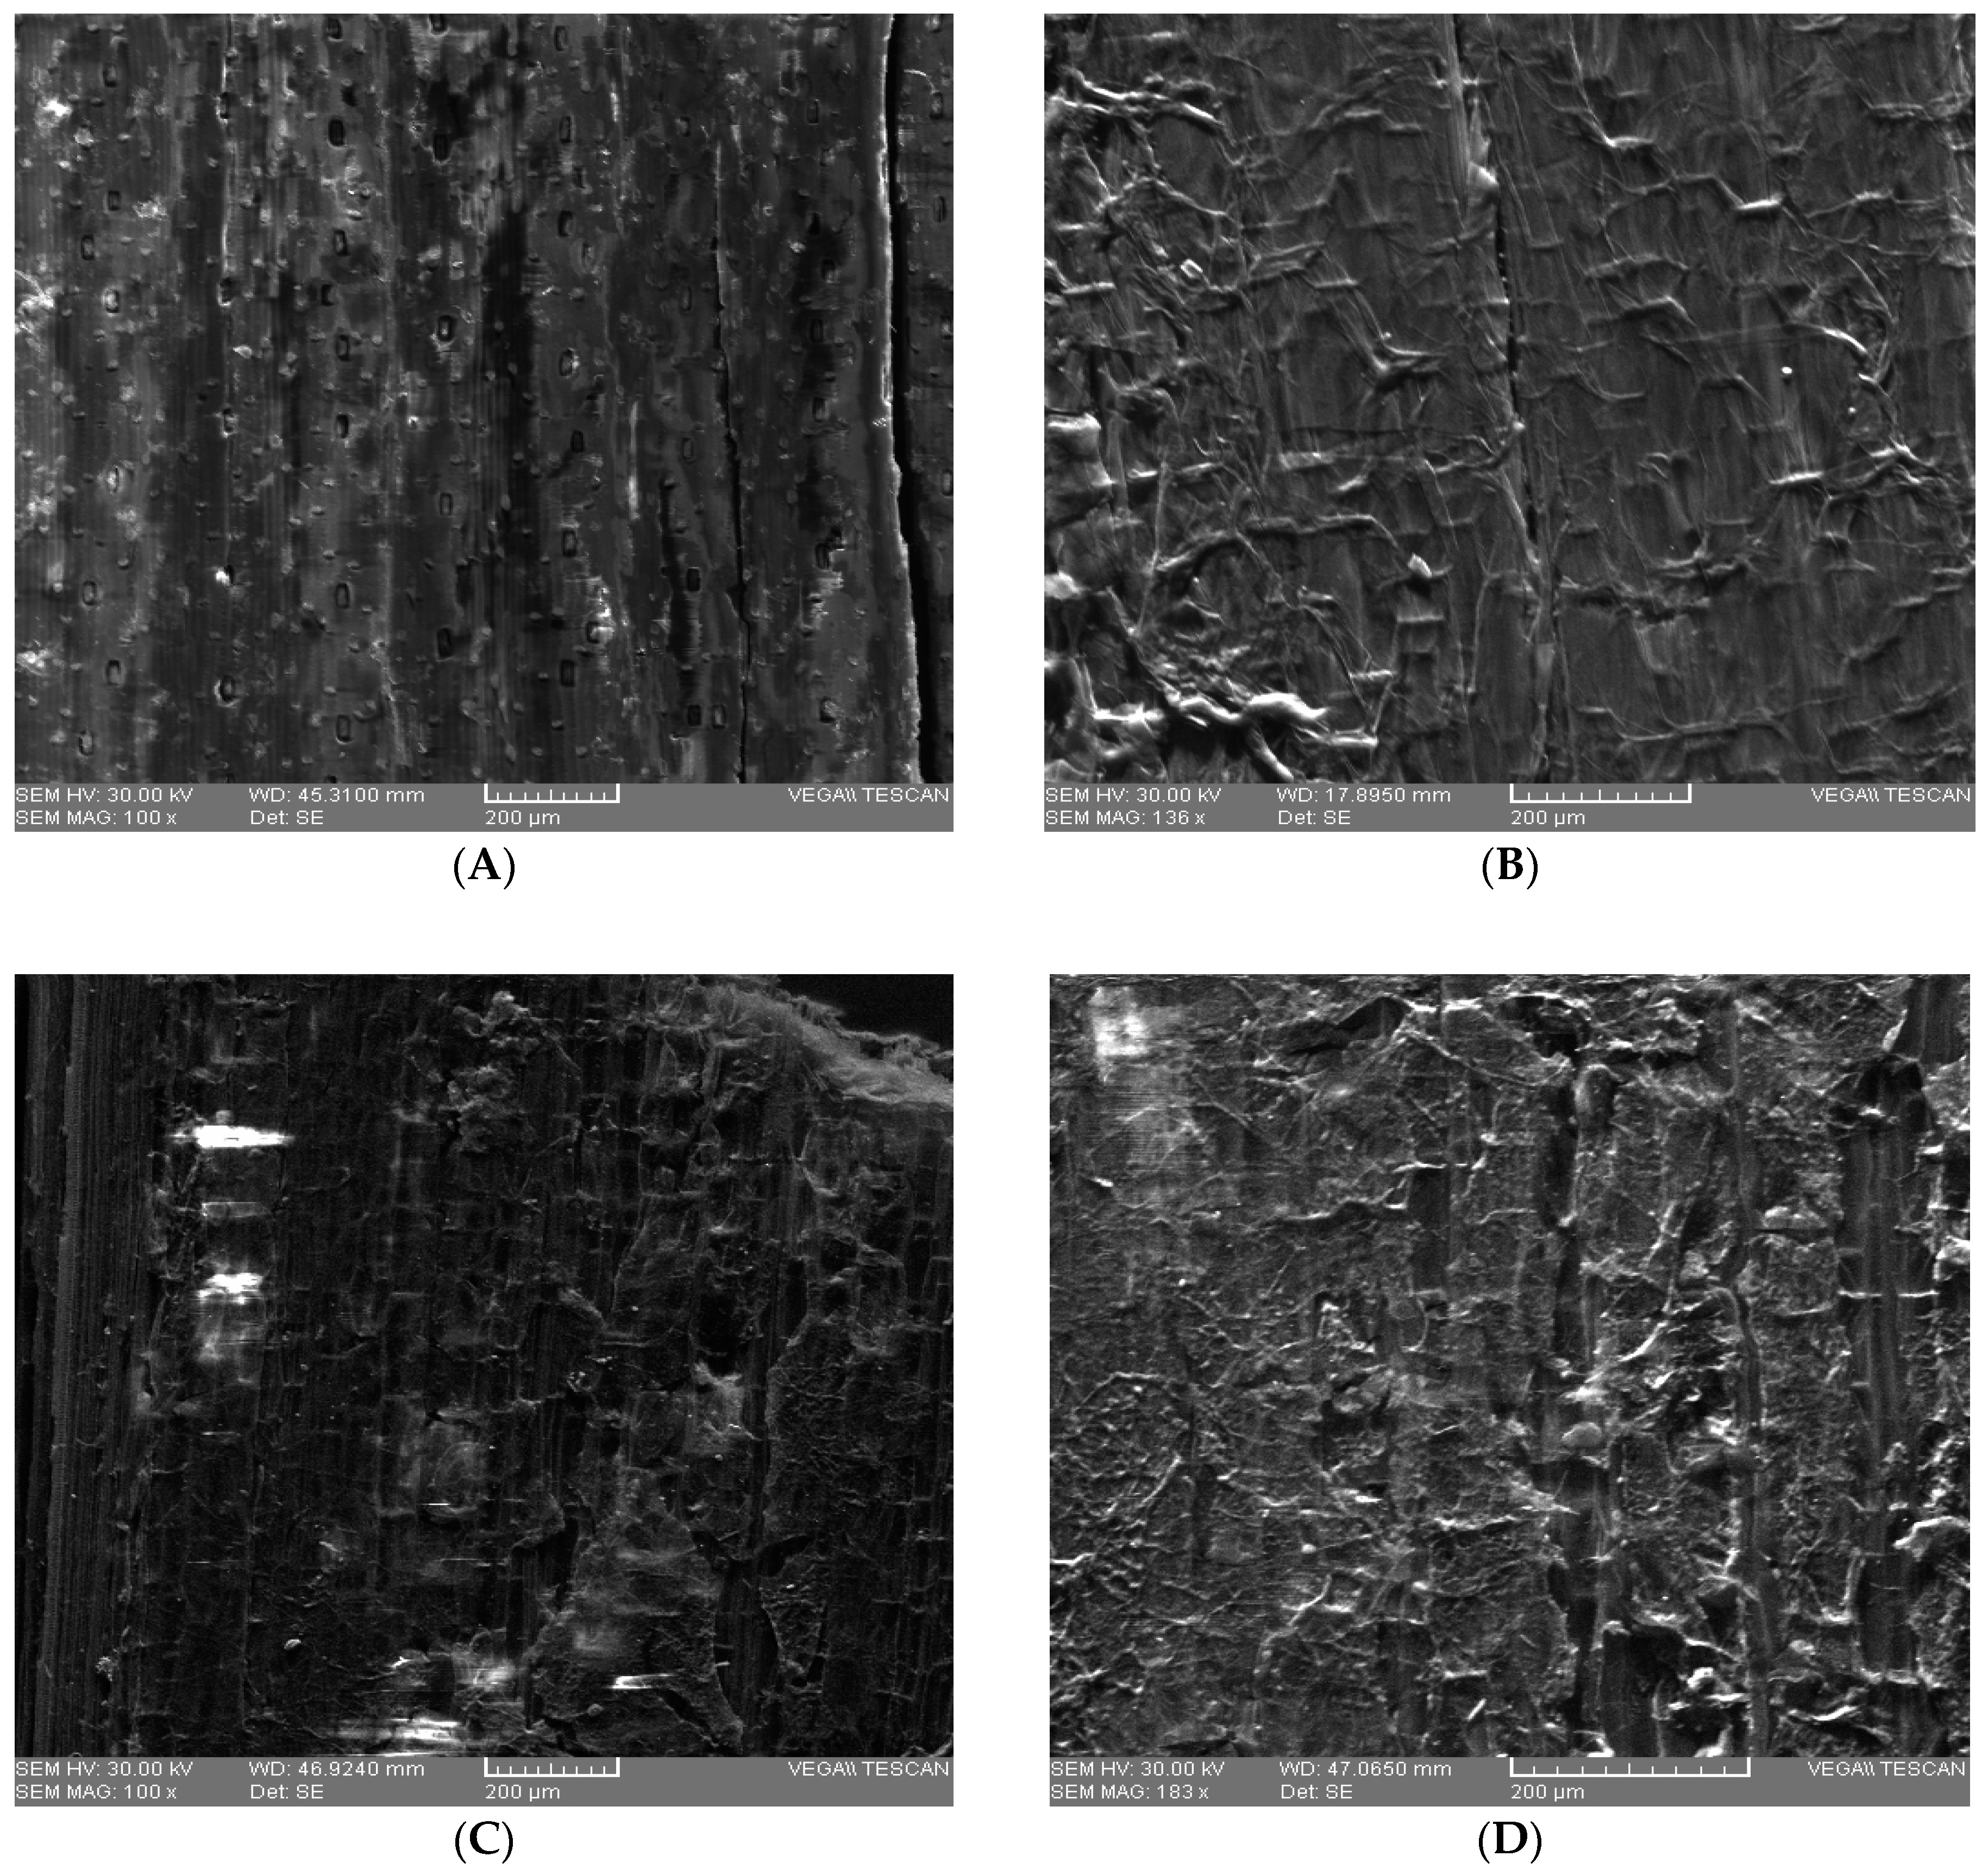
2.2.4. Scanning Electron Microscope (SEM) Analysis
The acid pretreated and enzyme-hydrolysed samples were dried and analysed with SEM Tescan Vega II LMU (Tescan Orsay Holding, Brno, Czech Republic), operated at 30 kV.
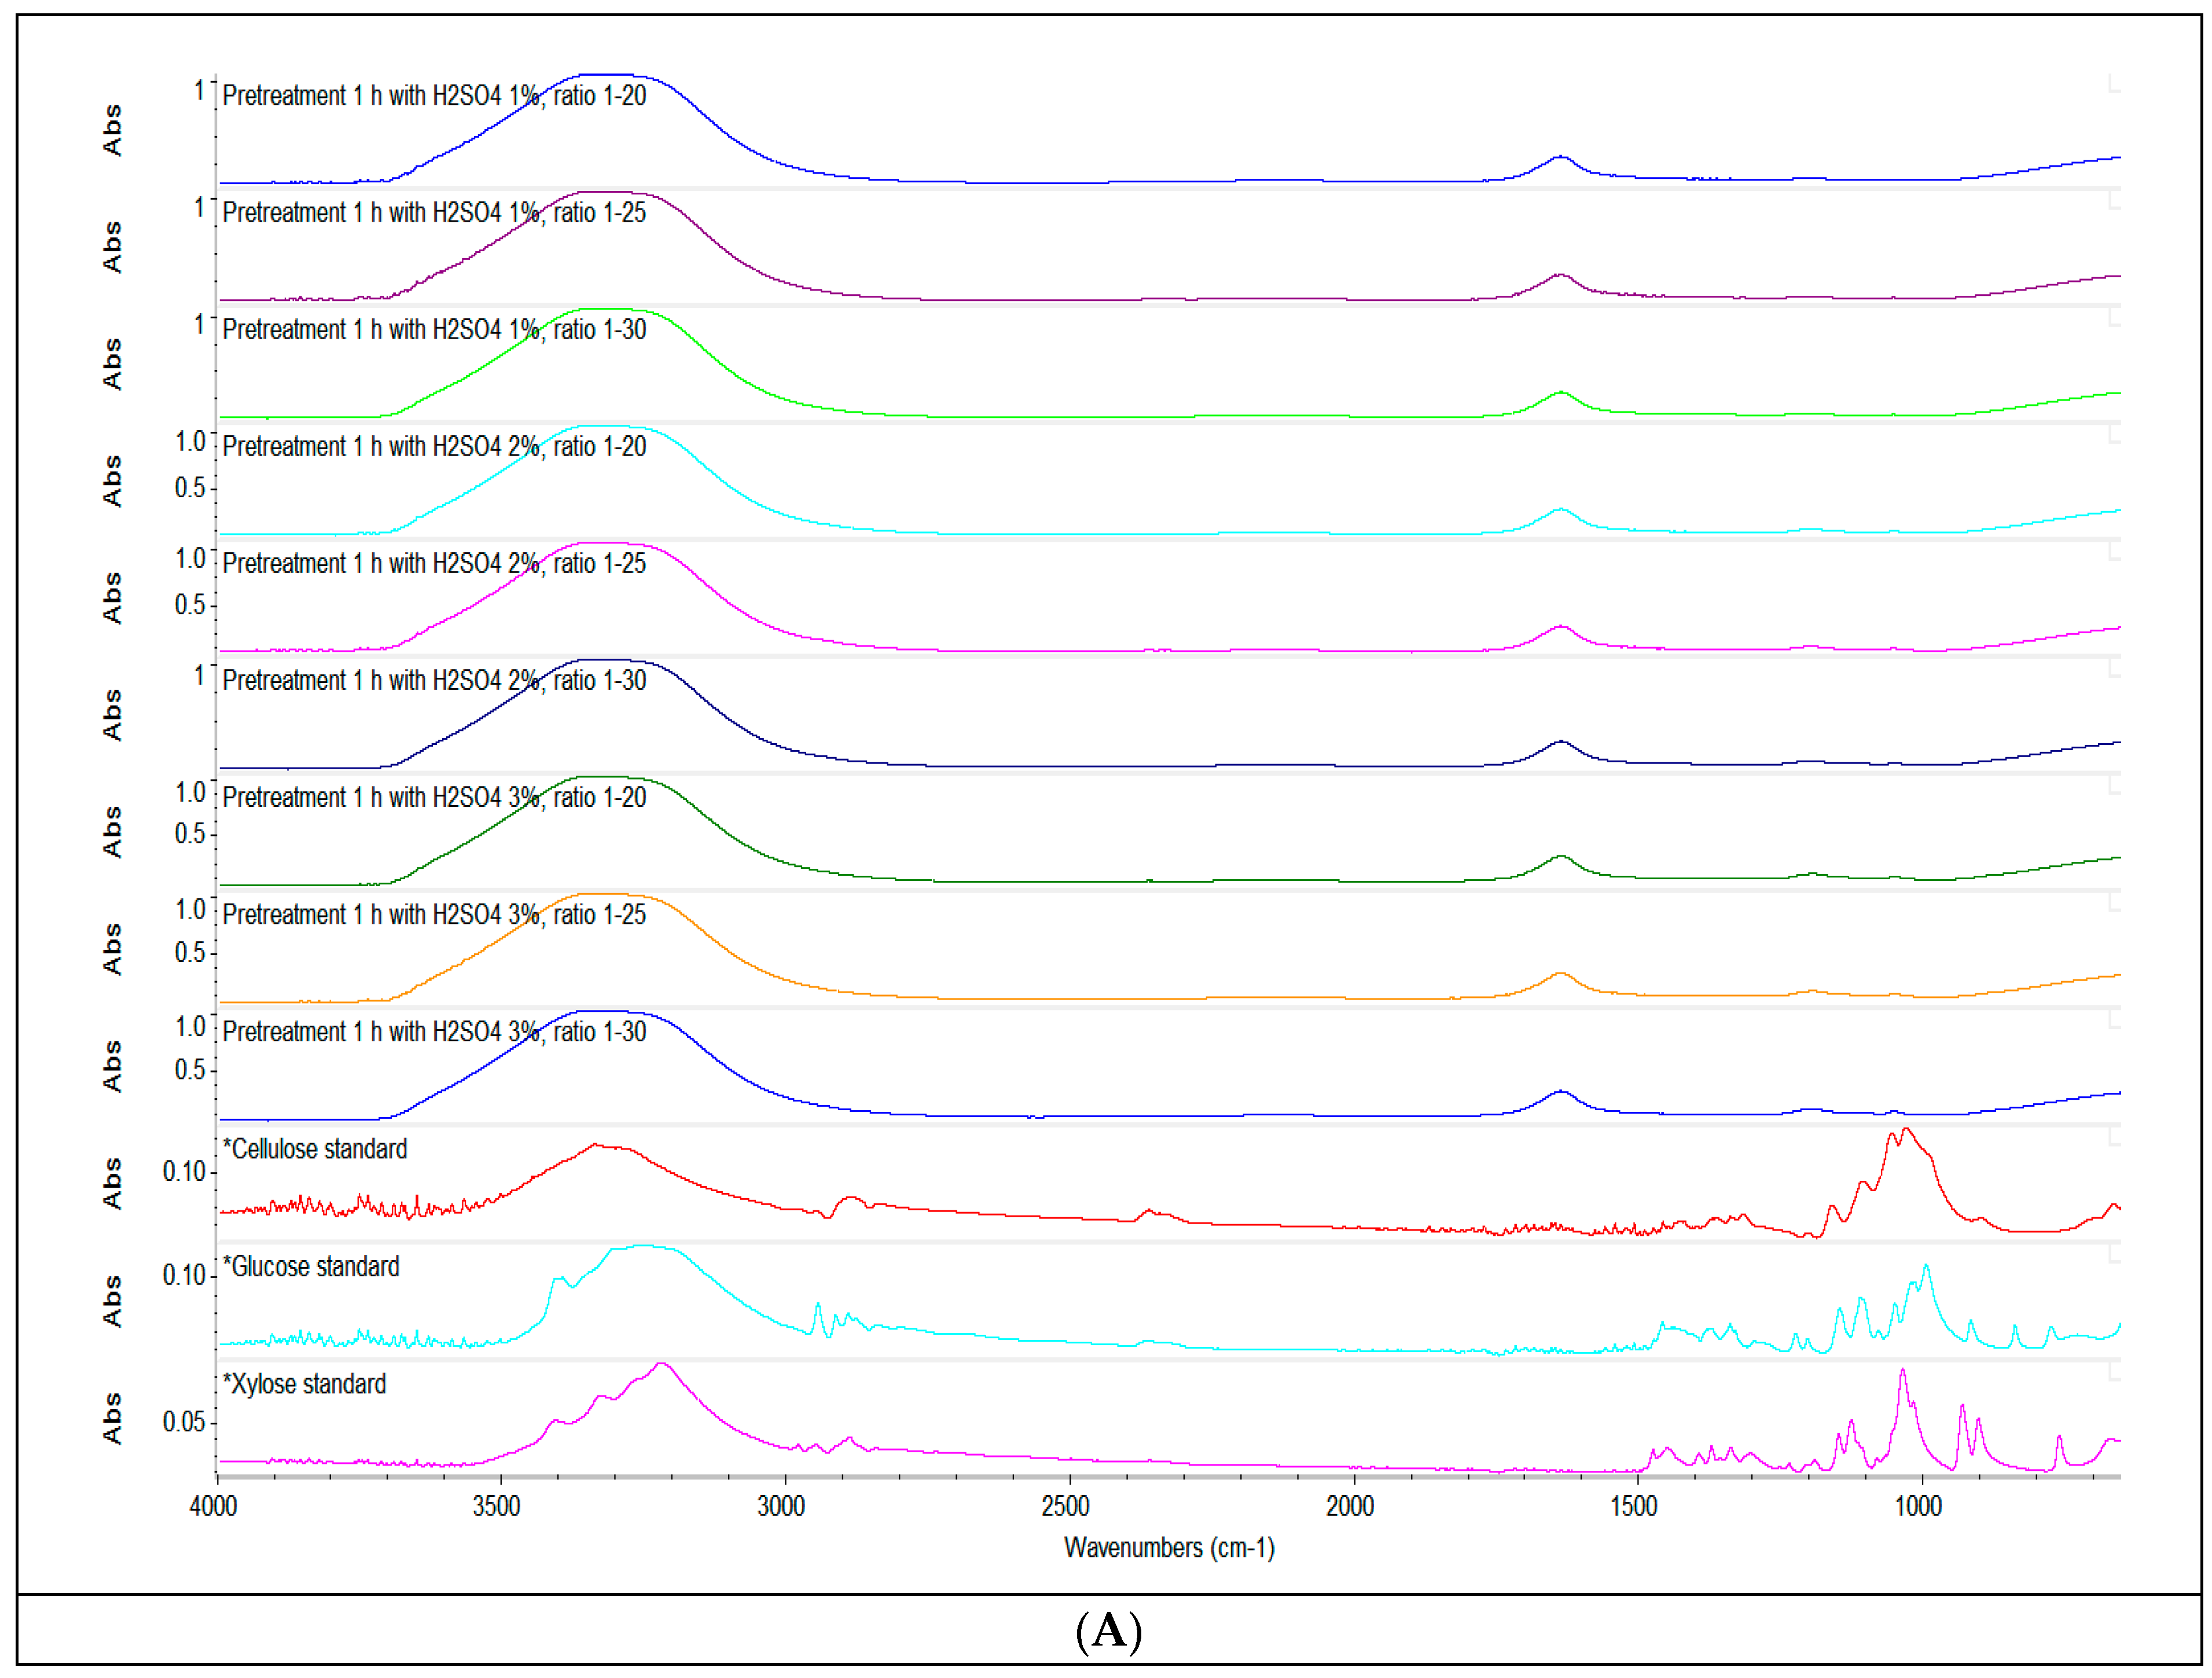
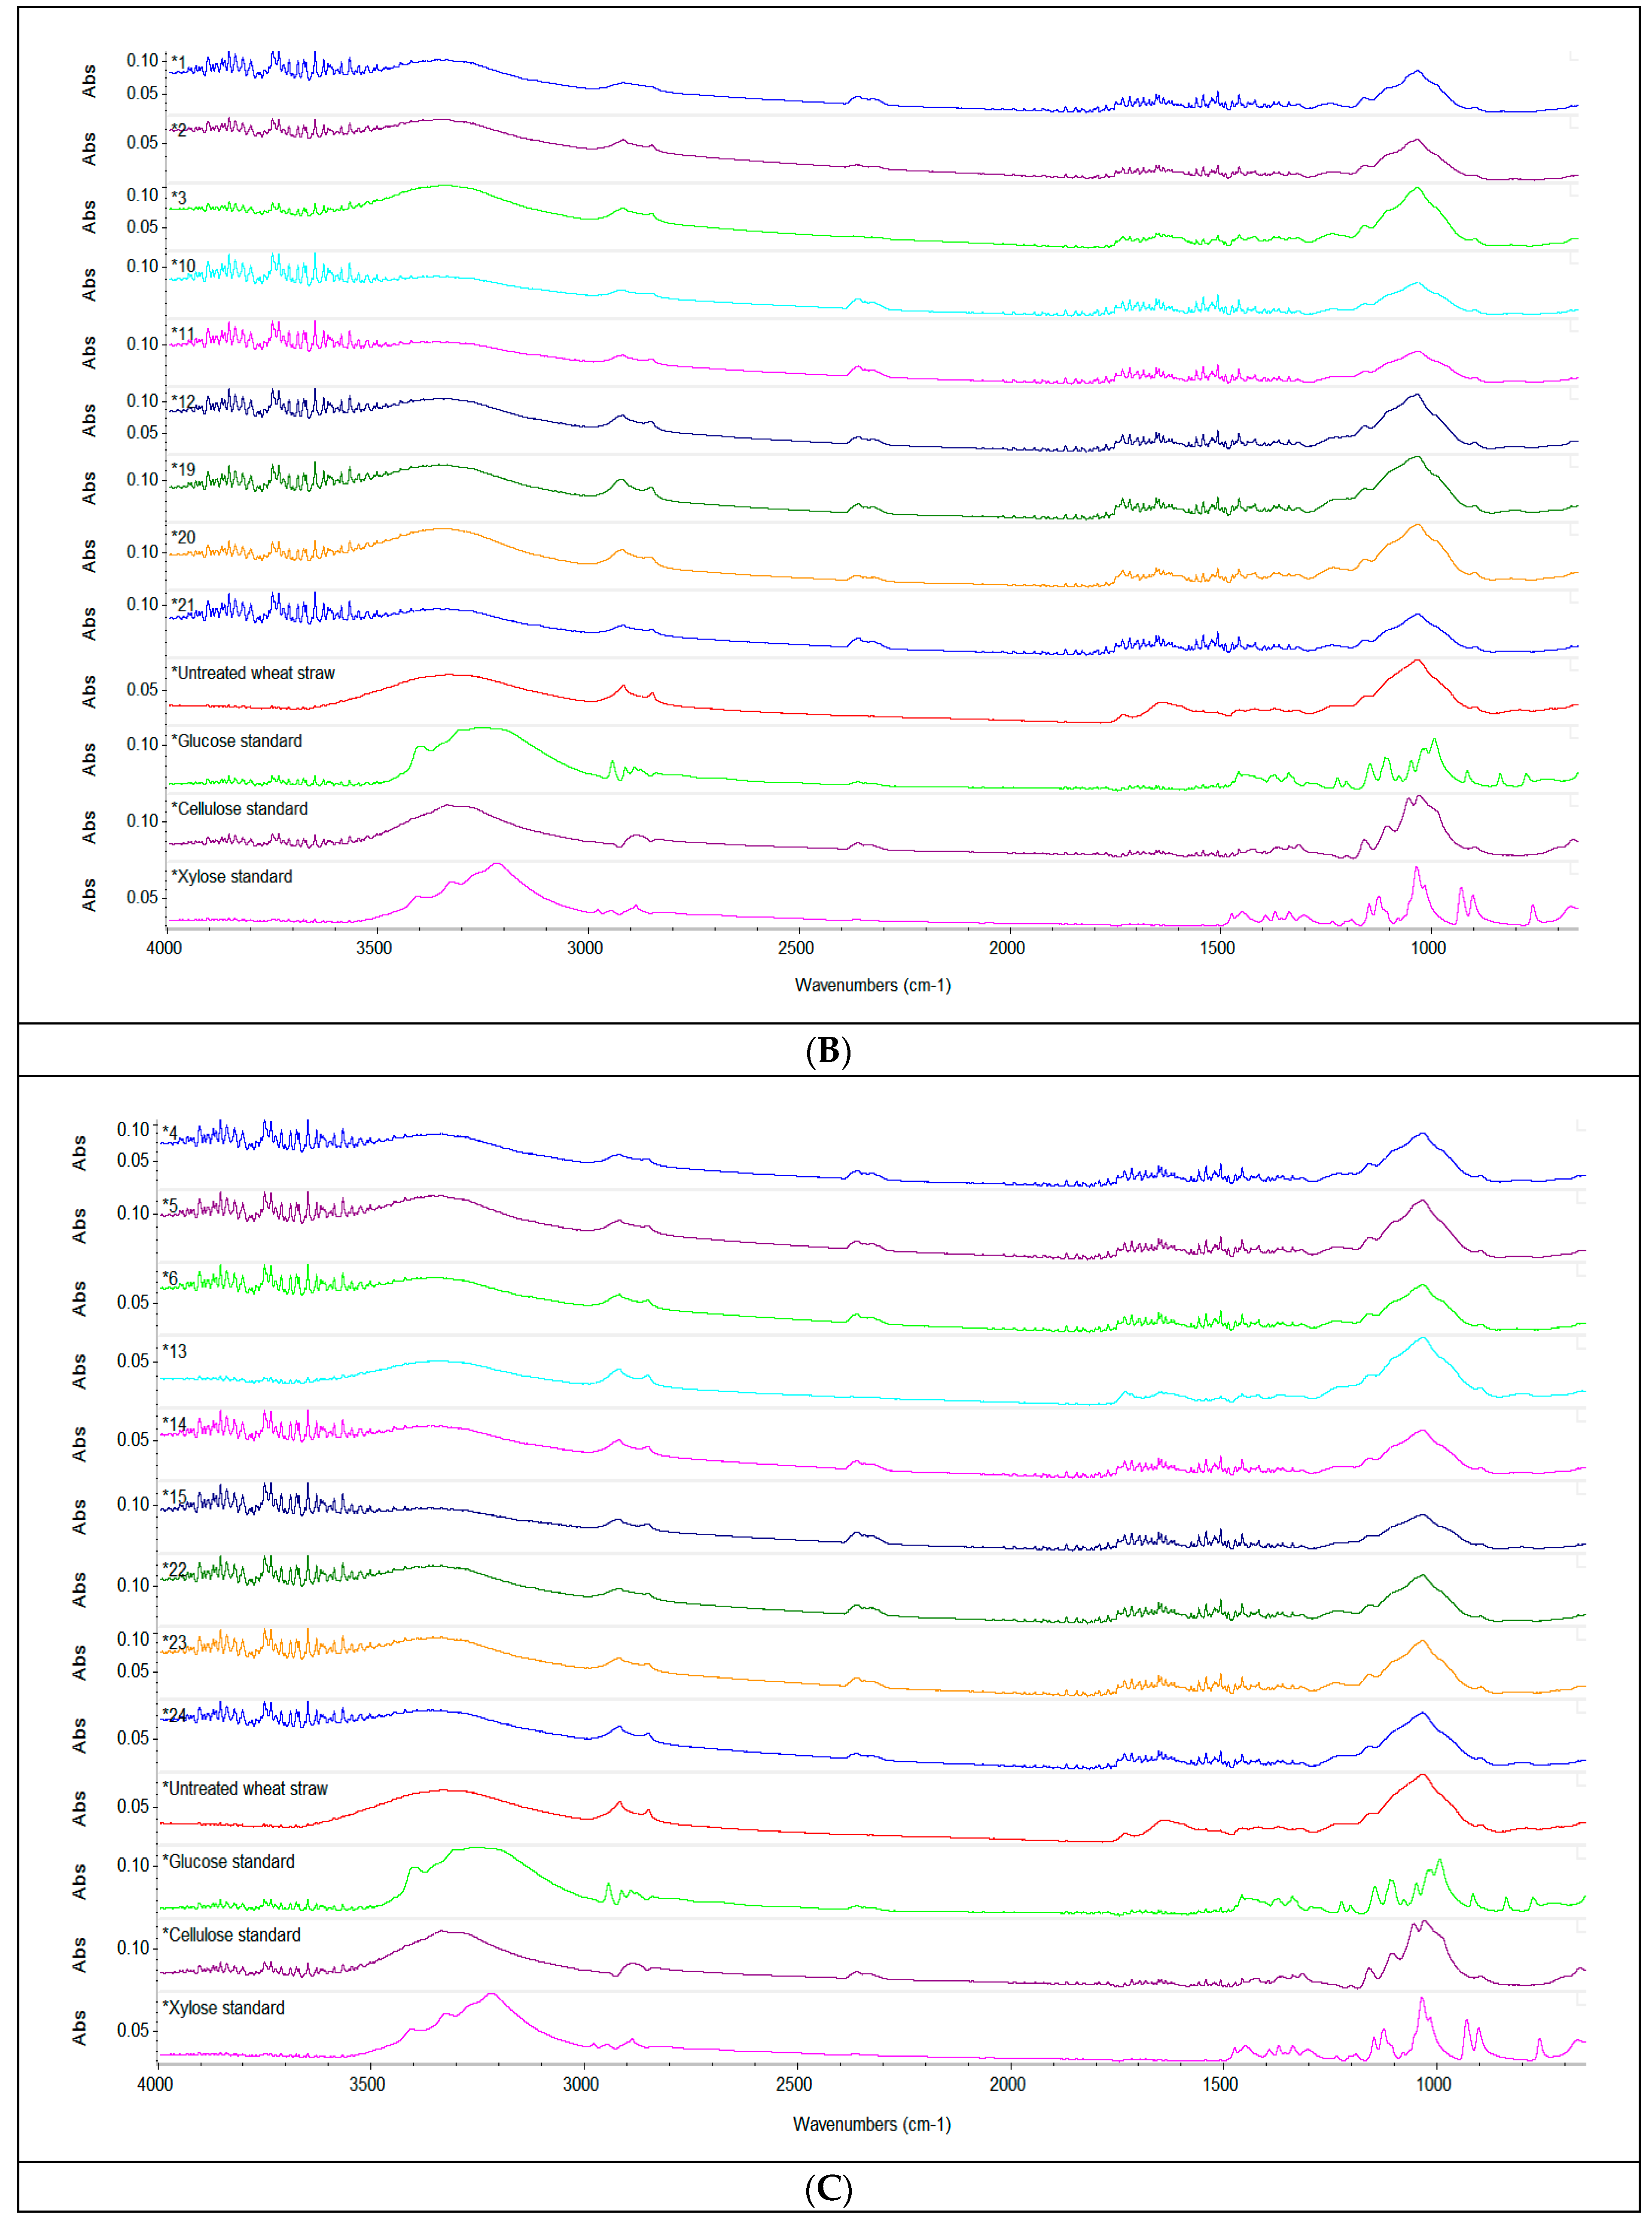
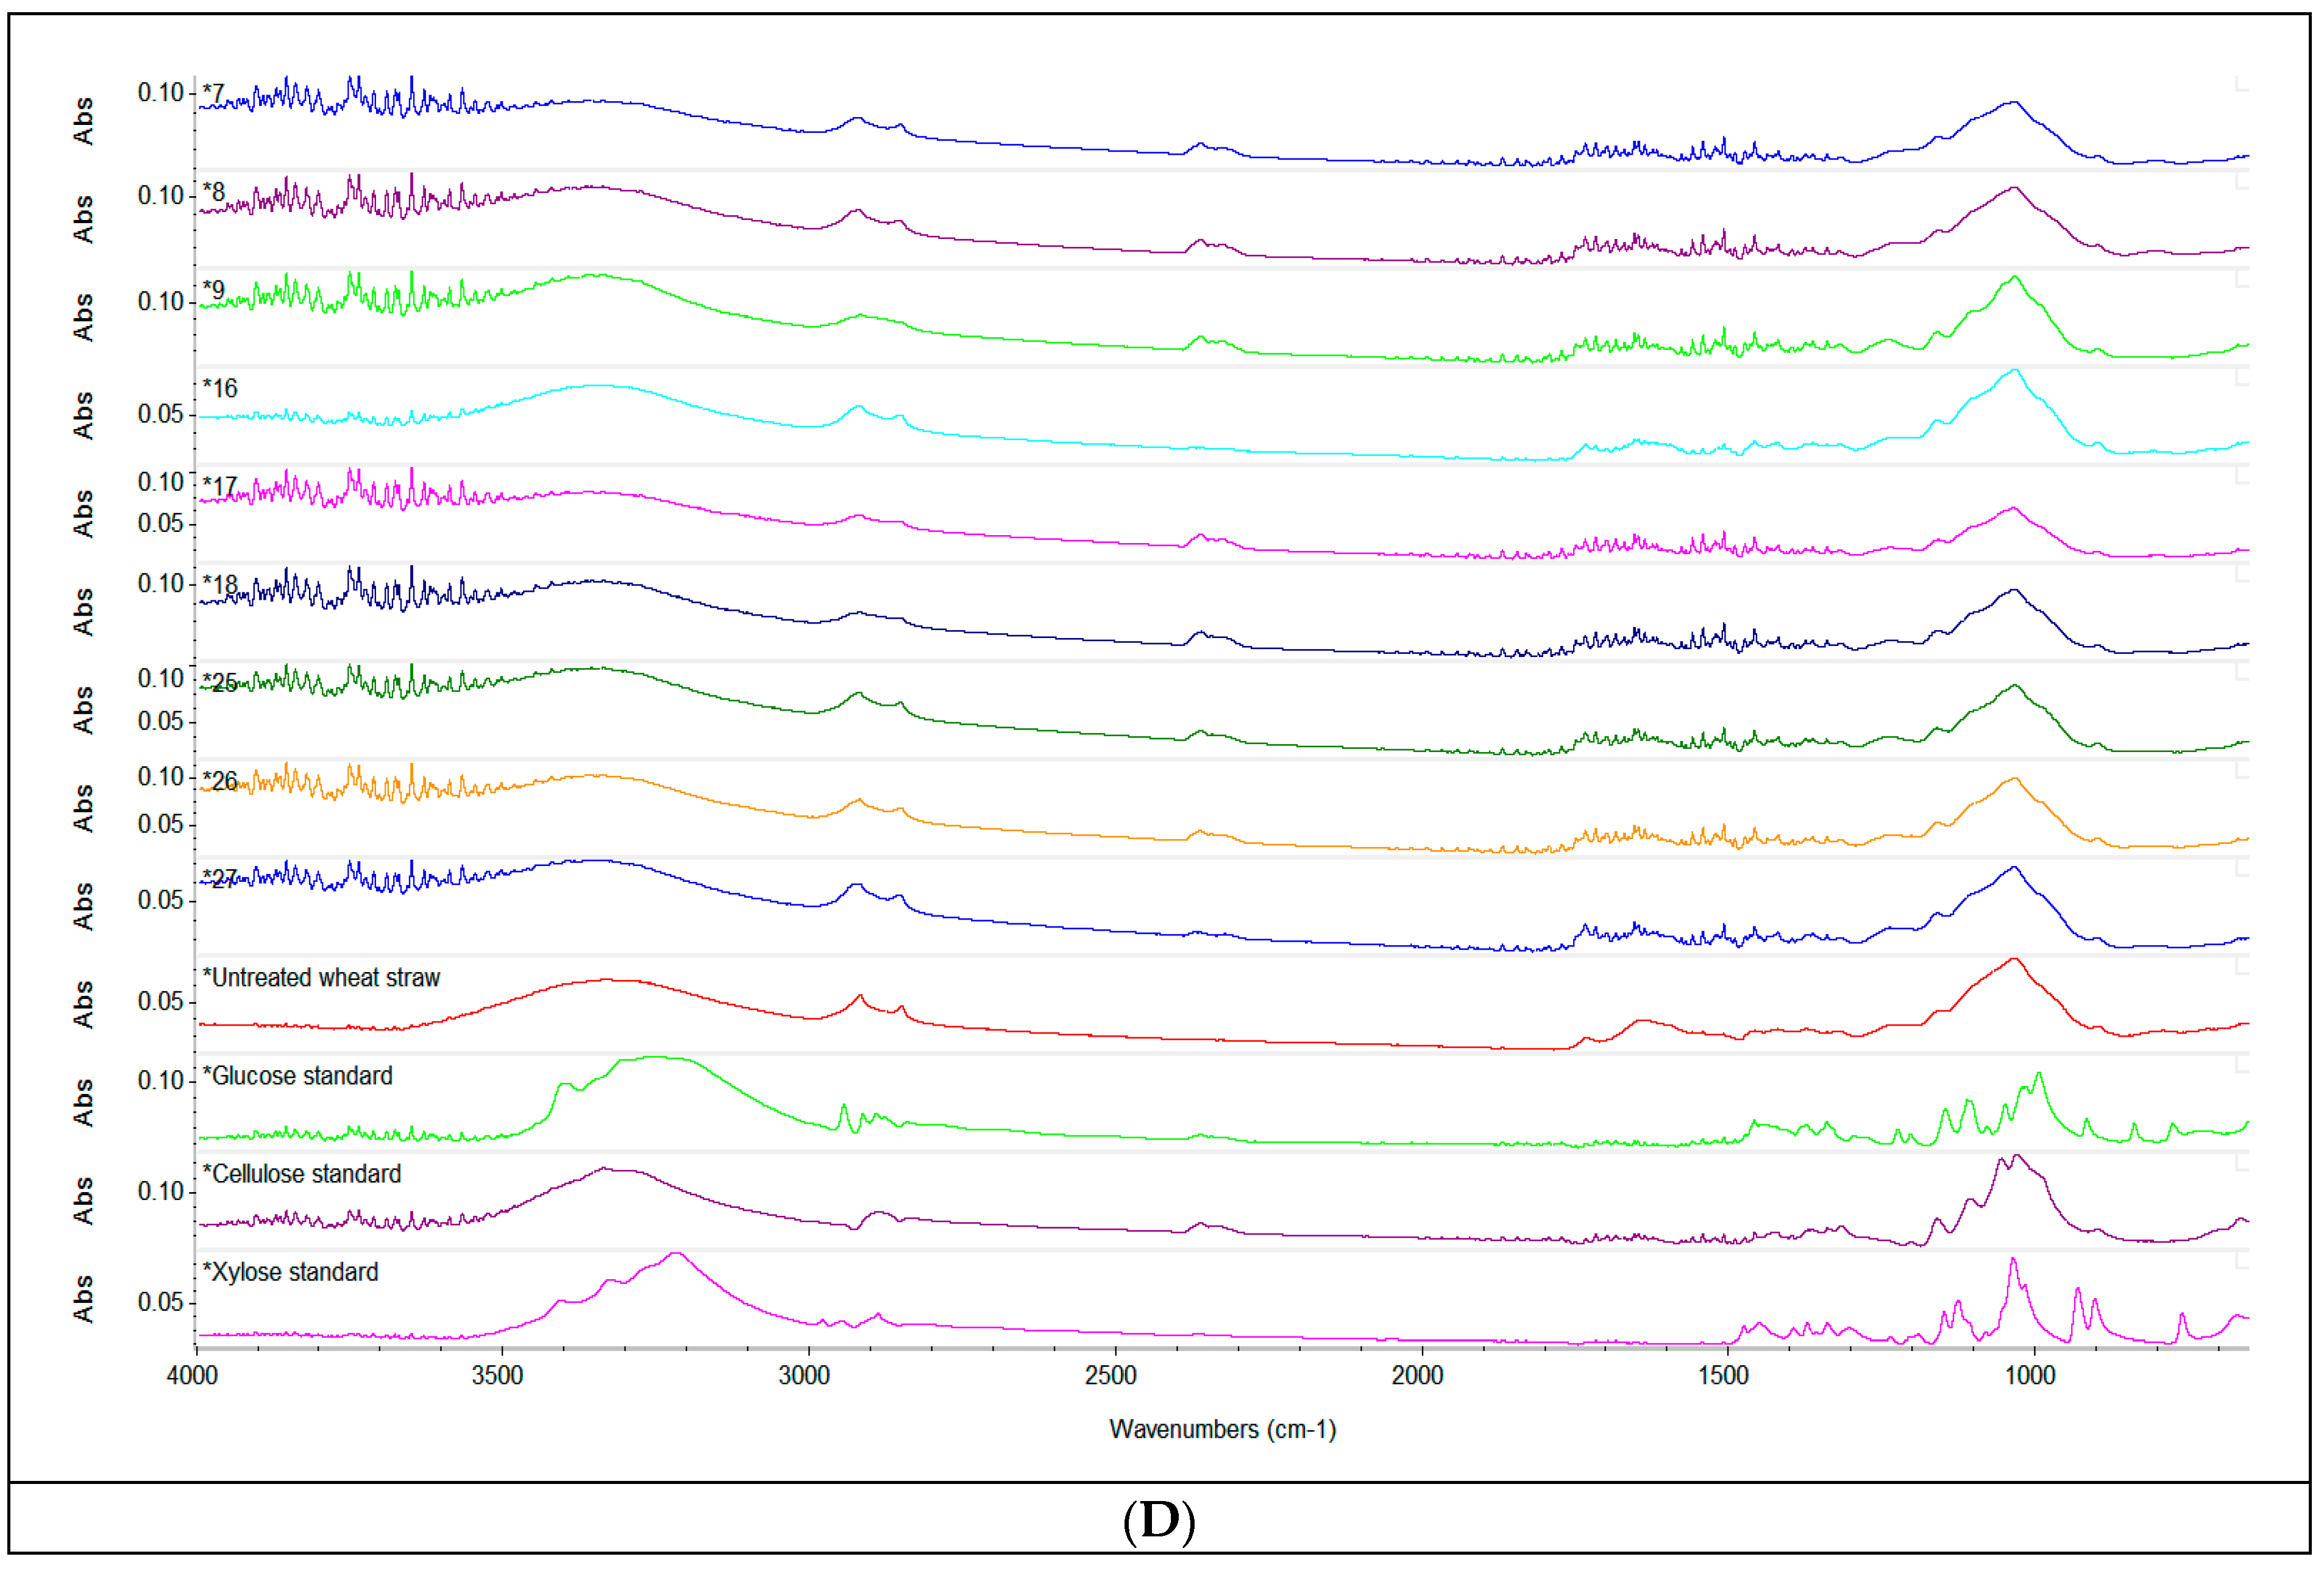
2.2.5. ATR-FTIR Analysis
FT-IR analysis was performed to detect the modifications in the functional groups in dried raw material, pretreated with acid and enzyme-hydrolysed WS. The FT-IR spectra of samples were achieved with a FT-IR spectrometer (Thermo Scientific, Karlsruhe, Dieselstraße, Germany) with ATR IX option. The results were obtained within a range of 400–4000 cm−1 with a detector at 4 cm−1.
2.2.6. HPLC Instrumentation and Separation Conditions
The individual phenolic compounds, organic acids and individual carbohydrates were analysed using a high-performance liquid chromatography (HPLC) (Shimadzu, Kyoto, Japan) equipped with a LC-20 AD liquid chromatograph, SIL-20A autosampler, CTO-20AC coupled with a SPD-M20A diode array detector (DAD) and RID-10A refractive index detector (RID) respectively. The separation of phenolic compounds, organic acids and individual carbohydrates was performed in a column specific to each constituent analysed. The standards of phenolic compounds, organic acids and individual carbohydrates were determined based on the retention times and quantified based on their calibration curves (all the curves had R
2 higher than 0.98). For samples, the limits of detection (LOD) and limits of quantification (LOQ) were calculated according to Kuppusamy et al. (2018) [
36,
37,
38].
Determination of Individual Phenolic Compounds
For the analysis of the individual phenolic compounds resulting from the acid pretreatment and from the enzymatic hydrolysates, the following was performed: 1 mL of solution from each sample pretreated with acid and respectively 1 mL of solution from the enzyme-hydrolysed samples for 24 h were filtered through PTFE membrane with 0.45-μm dimension of pores and were stored at −20 °C until analysis. The obtained samples were analysed using HPLC-DAD. The separation of individual polyhenols was performed into a Phenomenex Kinetex
® 2.6 μm Biphenyl 100 Å column, LC Column 150 × 4.6 mm and thermostated at 25 °C (Column oven). The utilised method of analysis was described by Palacios et al. (2011) and used by Pauliuc et al. (2020) with some modifications [
39,
40,
41,
42]. The identification of the 12 phenolic compounds from pretreated and enzyme-hydrolysed samples of WS was performed at 280 nm for gallic, protocatechuic, vanillic and p-hydroxybenzoic acid; at 320 nm for chlorogenic, caffeic, p-coumaric and rosmarinic acid, quercitin, luteolin and kaempferol. The 12 phenolic compounds were injected individually to identify their retention time, then a mix of them was made. The final concentration of each identified phenolic compound was expressed in mg/L.
Determination of Organic Acids
In order to identify the organic acids resulting from the acid pretreatment and from the enzymatic hydrolysates, the following was performed: 1 mL of solution pretreated with acid samples and 1 mL of solution enzyme-hydrolysed samples for 24 h were filtered through PTFE membrane with 0.45 μm dimension of pores and were stored at −20 °C until analysis. The obtained mixtures were analysed using HPLC-DAD equipment. The separation of organic acids was performed into a Phenomenex Kinetex
® 5 μm C18 100 Å HPLC Column 250 × 4.6 mm. The utilised method of analysis was described by Özcelik et al. [
42,
43]. The standards of individual organic acid (gluconic, acetic, formic, succinic, propionic, lactic and butyric acid) and mixed solution of them were prepared to determine the concentration of organic acids, expressed in mg/L.
Determination of Individual Carbohydrates After Enzymatic Hydrolysis
After 24 h of enzymatic hydrolysis, 1 mL of each sample was filtered through PTFE 0.45 μm dimension of pores and analysed for determination of carbohydrates using HPLC-RID. The separation of carbohydrates was performed in a Phenomenex Luna
® Omega 3 μm de SUGAR 100 Å column, 150 × 4.6 mm. The utilised method of analysis was described by Bogdanov et al. (2002) [
44]. Before analysis, the inactivation of enzymes was achieved by exposing the samples for 5 min at 121 °C [
45]. The identification of carbohydrates was performed based on the standards (Carbohydrates Kit (CAR10-KIT) de D-(−)-Arabinose, ≥98% (A3131-5G), D-(−)-Ribose, ≥99%, (R7500-5G), D-(+)-Xylose, ≥99% (X1500-5G), D-(−)-Fructose, ≥99% (F0127-5G), D-(+)-Glucose, ≥99.5%, (G8270-5G-KC), D-(+)-Galactose ≥99.5% (G0750-5G), α-Lactose monohydrate, ≥99% total lactose basis, (L3625-5G), Sucrose ≥99.5% (S9378-5G-KC), D-(+)-Mannose, wood, ≥99% (M2069-5G), D-(+)-Maltose monohydrate, from potato, ≥99%, (M5885-5G) which were injected to identify the retention times, then a mixed solution of them was prepared to determinate the concentration of carbohydrates, expressed in mg/L.
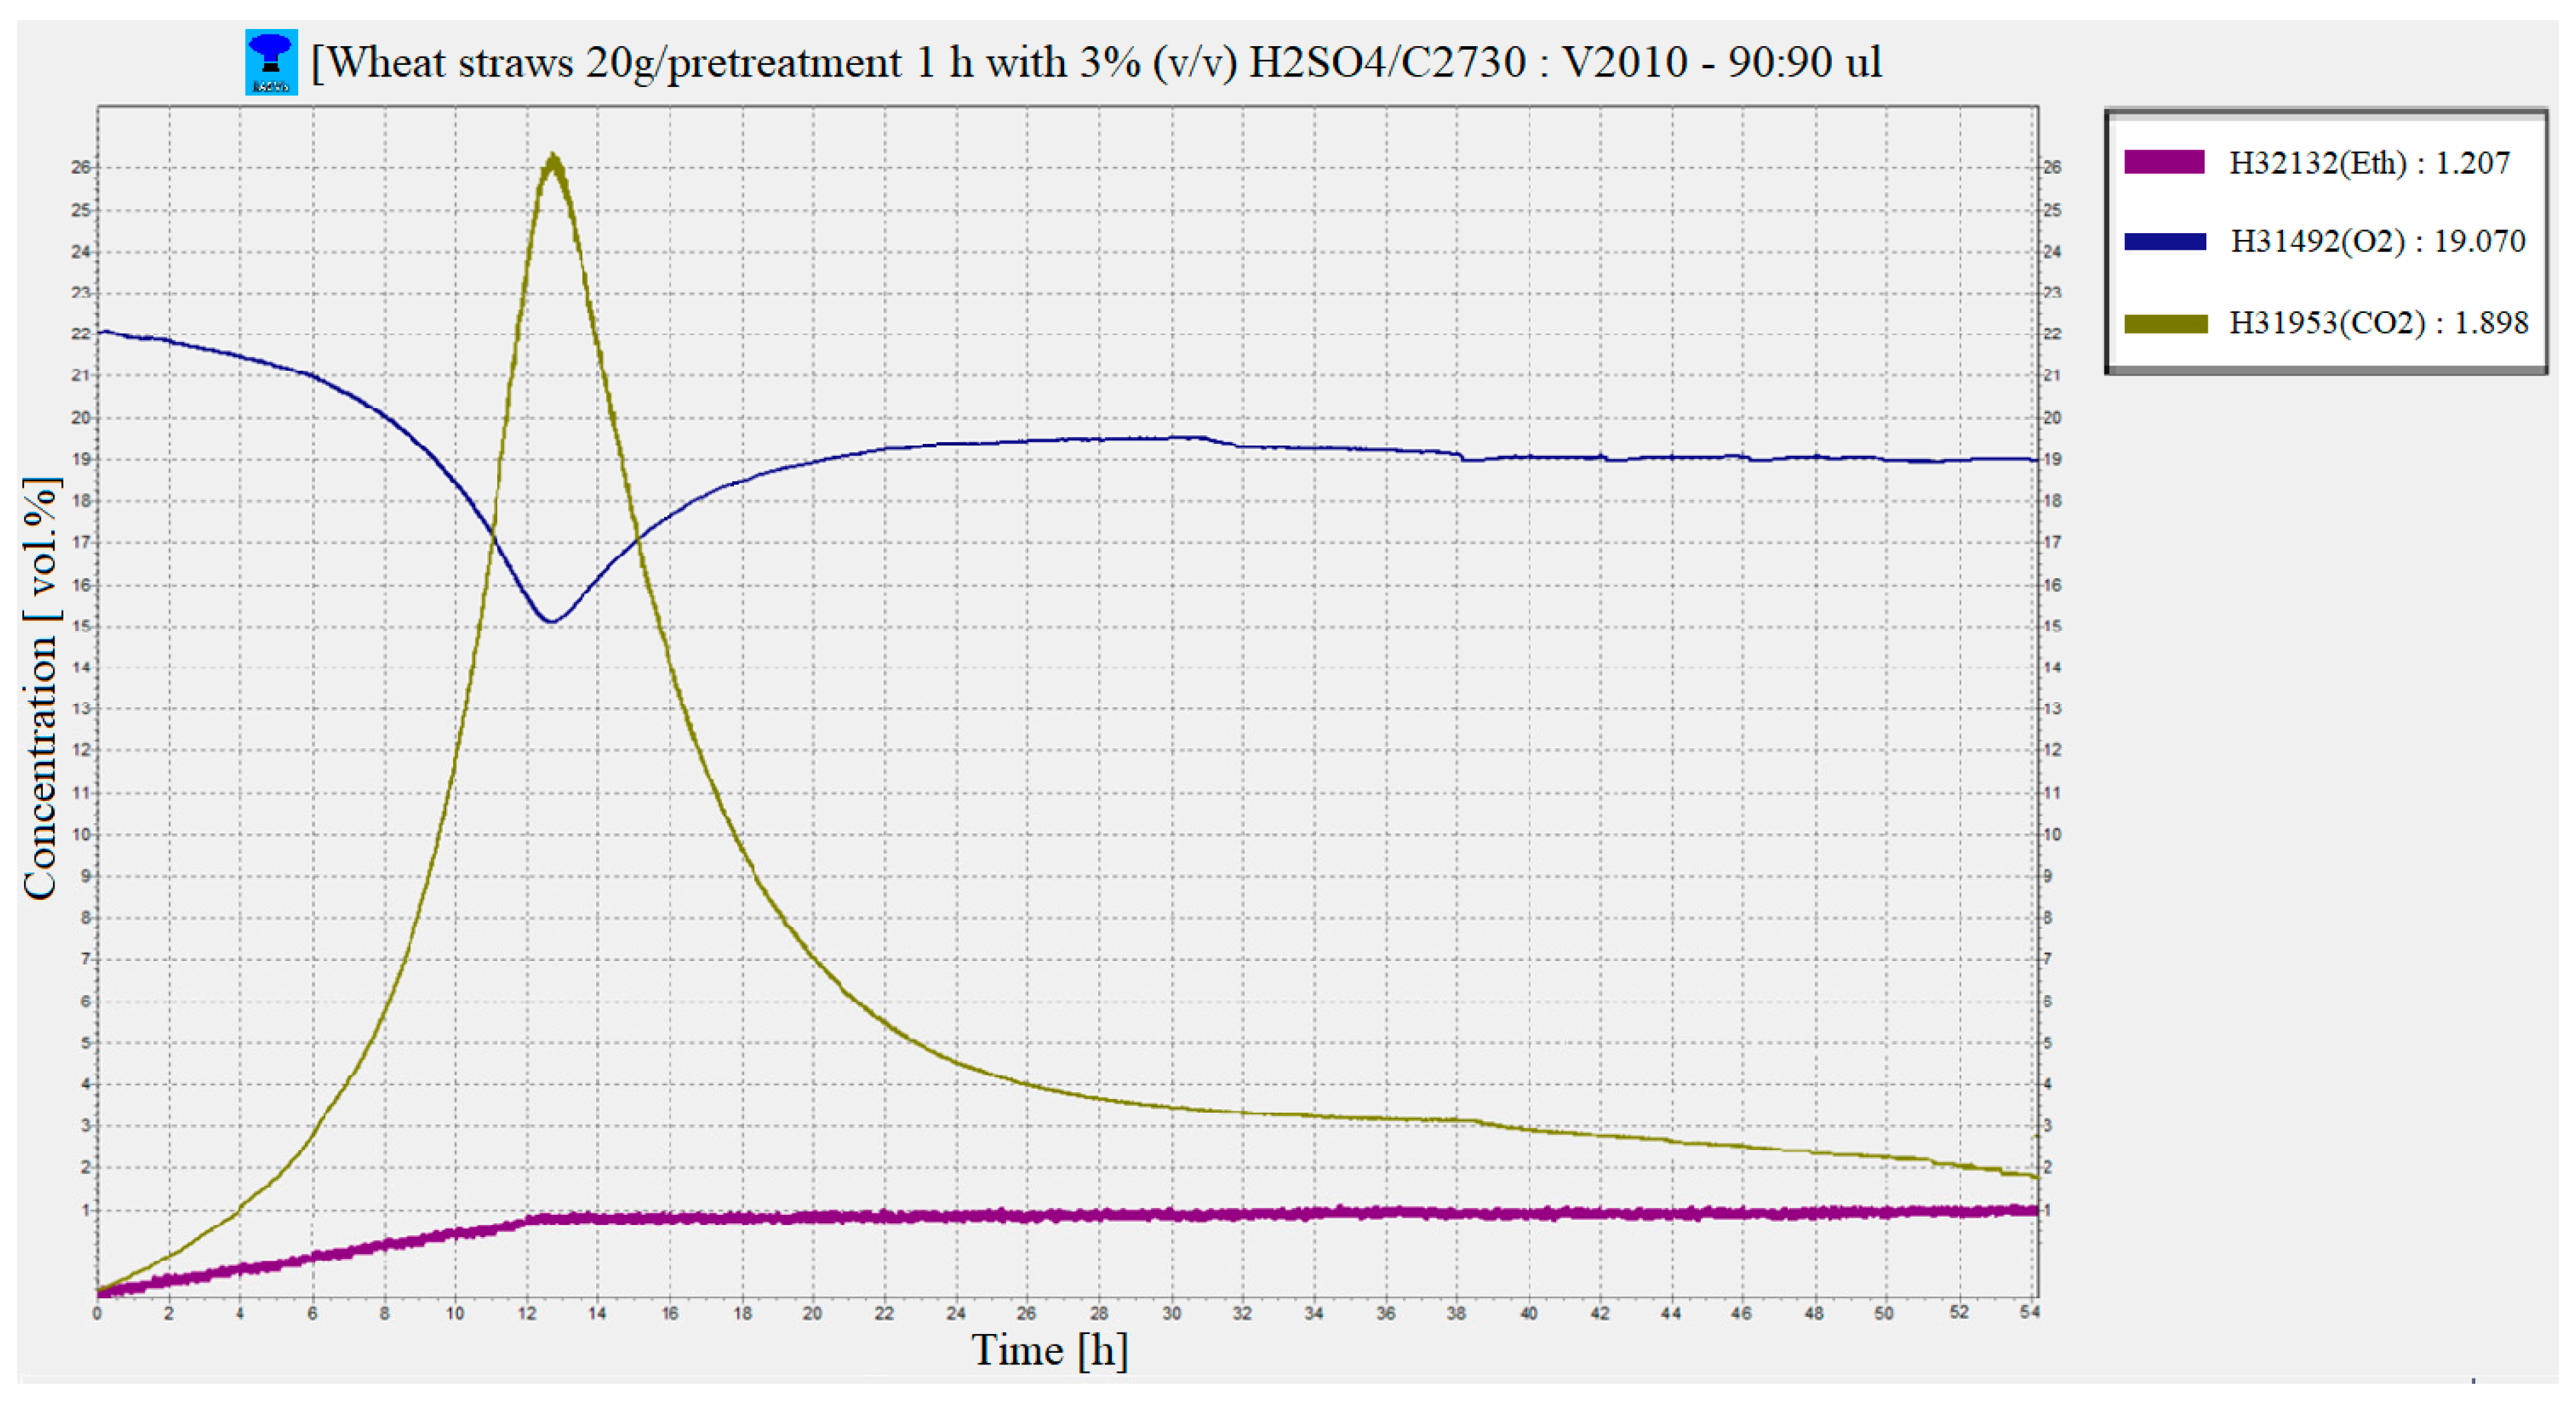
2.2.7. Monitoring of Bioethanol Concentration
About 20 ± 0.001 g of WSG with <1 mm particle size was pretreated with 3% H
2SO
4 (
v/
v) following the procedure in
Section 2.2.1, then the resulting solid fraction was hydrolysed using enzymes as described in
Section 2.2.2. After 24 h of hydrolysis, the mash was cooled to 35 °C (optimal condition for yeast
Saccharomyces cerevisiae). The pH of the mash was adjusted to 4.5 using a 3 M NaOH solution. The 2.5 g of Hydra PC activator was dissolved in 50 mL Milli-Q water (42 °C, conc. 5%), then the obtained mix was cooled to 38 °C and pH was adjusted to 4.5 using a solution of 3 M NaOH. Afterward, the cooled mix was used for the activation of 40 mg of dry yeast
Saccharomyces cerevisiae. After 20 min, mash and 50 mL of solution with activated yeast were transferred to the fermentation flask. The temperature of the mash was maintained at 35 °C throughout the fermentation process.
The fermentation process was conducted using BlueSens gas sensors GmbH, Germany which monitors the content of carbon dioxide (CO
2), oxygen (O
2) and ethanol (C
2H
5OH) of the mash from lignocellulosic materials. The CO
2 (H31953 series), O
2 (H32132 series) and C
2H
5OH (H32132) sensors were connected via the BACCom 12 multiplexer data which allows a connection of 12 sensors to the software. The processing and transmission data were performed in real time via BacVis software. The equipment used to monitor the fermentation process processes the information by means of three spectral sensors in the IR range, which are mounted on each hole of the fermentation vessel. BlueSens sensors allow continuous monitoring of the content of CO
2, oxygen and ethanol in fermenters [
46]. The use of this equipment facilitates the conditions of controlled study by the simultaneous analysis of metabolic processes. The monitoring of CO
2 and O
2 concentrations is performed in the fermenter continuously and directly, where the fermentation processes take place. The parallel measurement of CO
2, O
2 and ethanol allows the analysis of metabolic processes without interruption during the entire fermentation process.
2.2.8. Experimental Design and Statistical Analysis
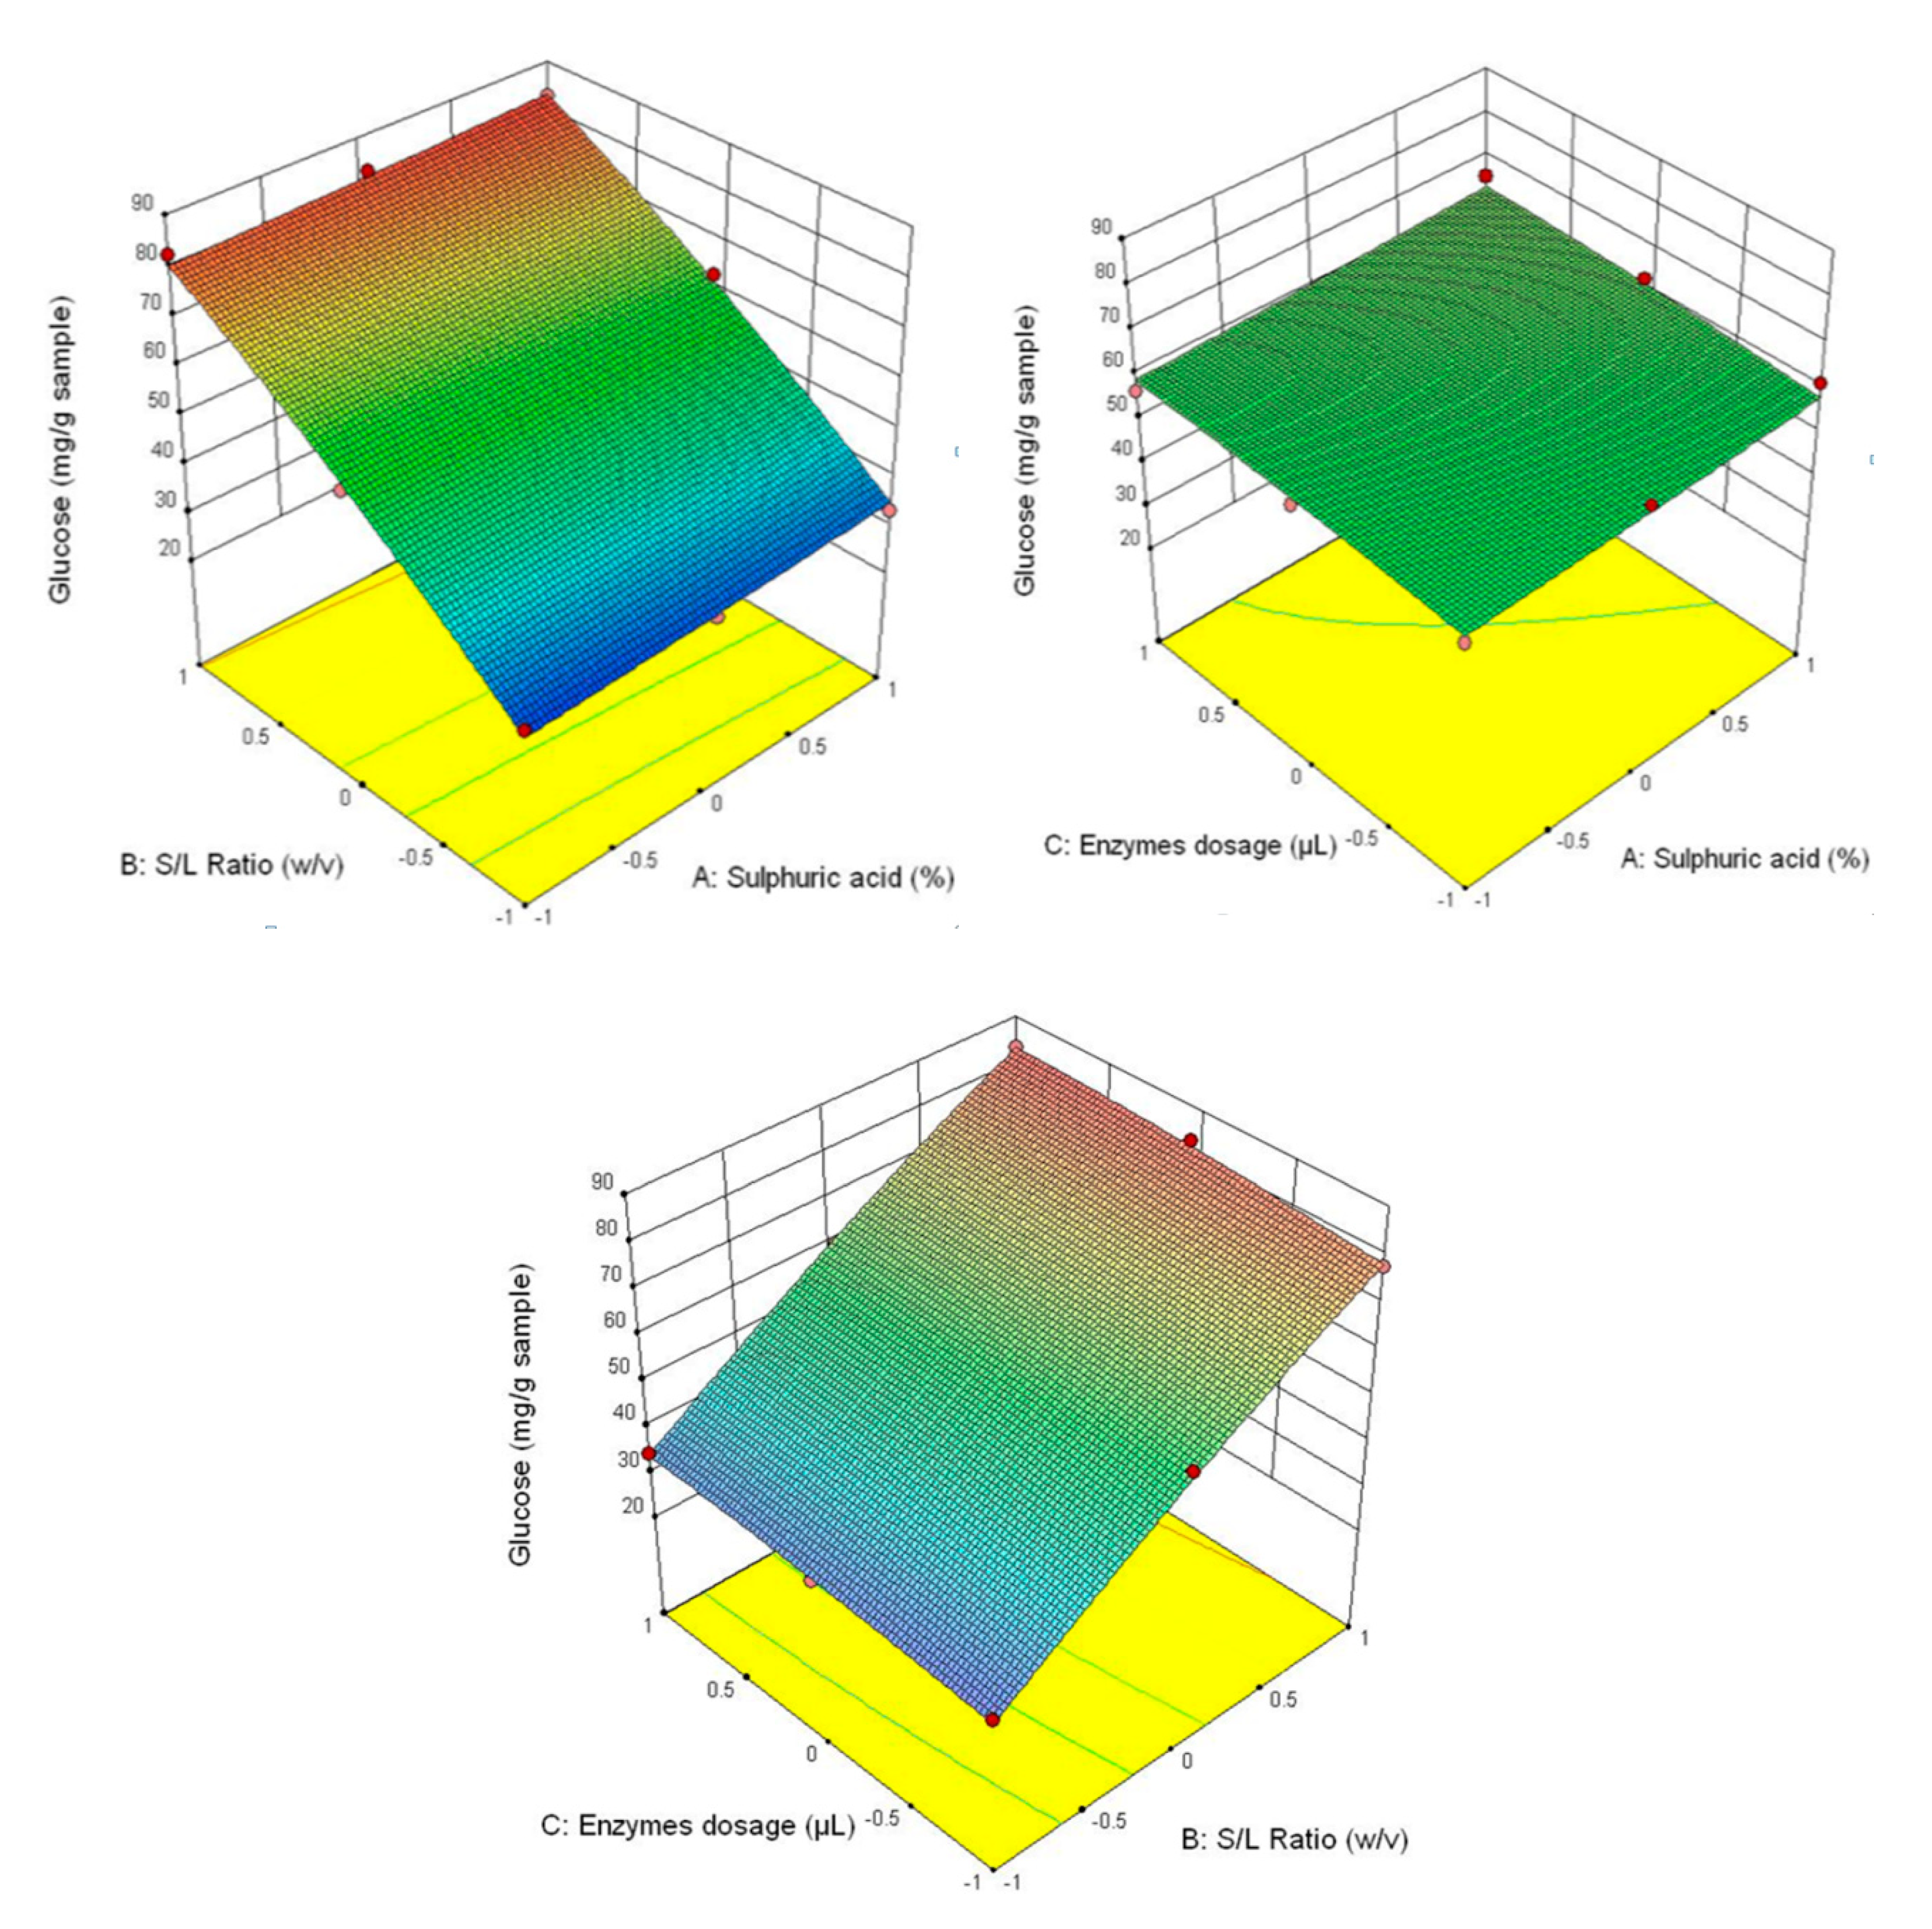
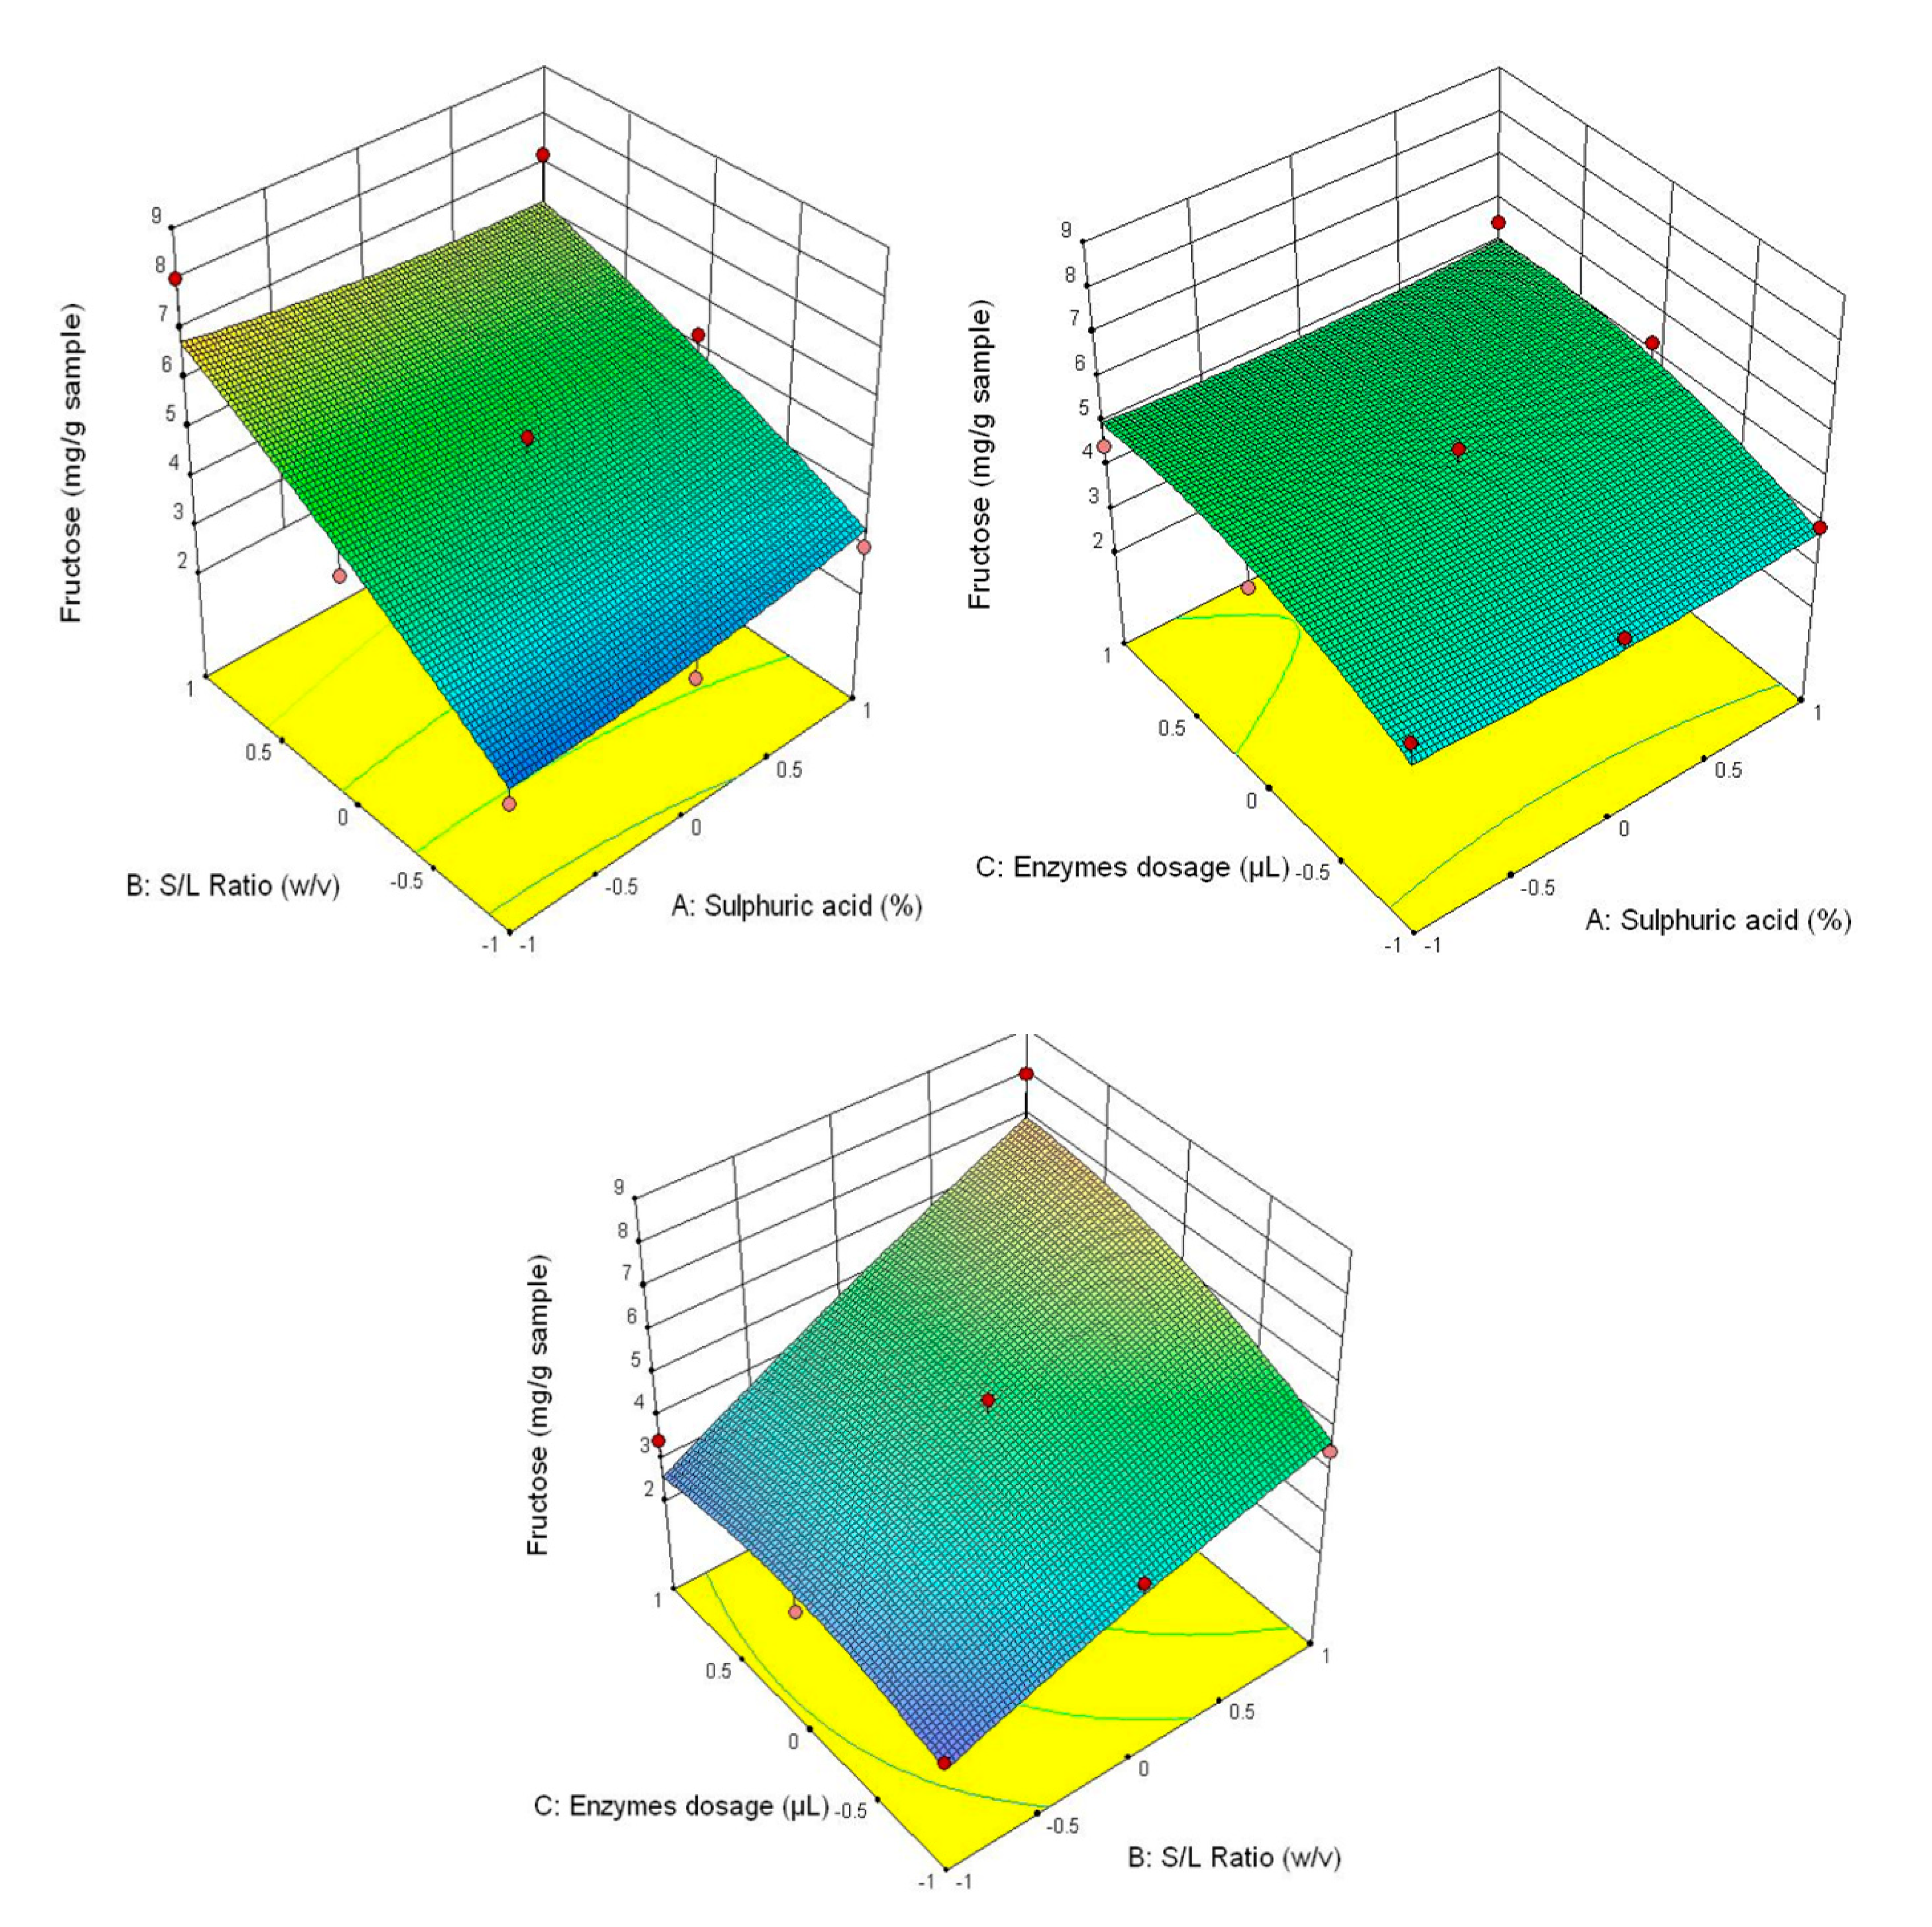
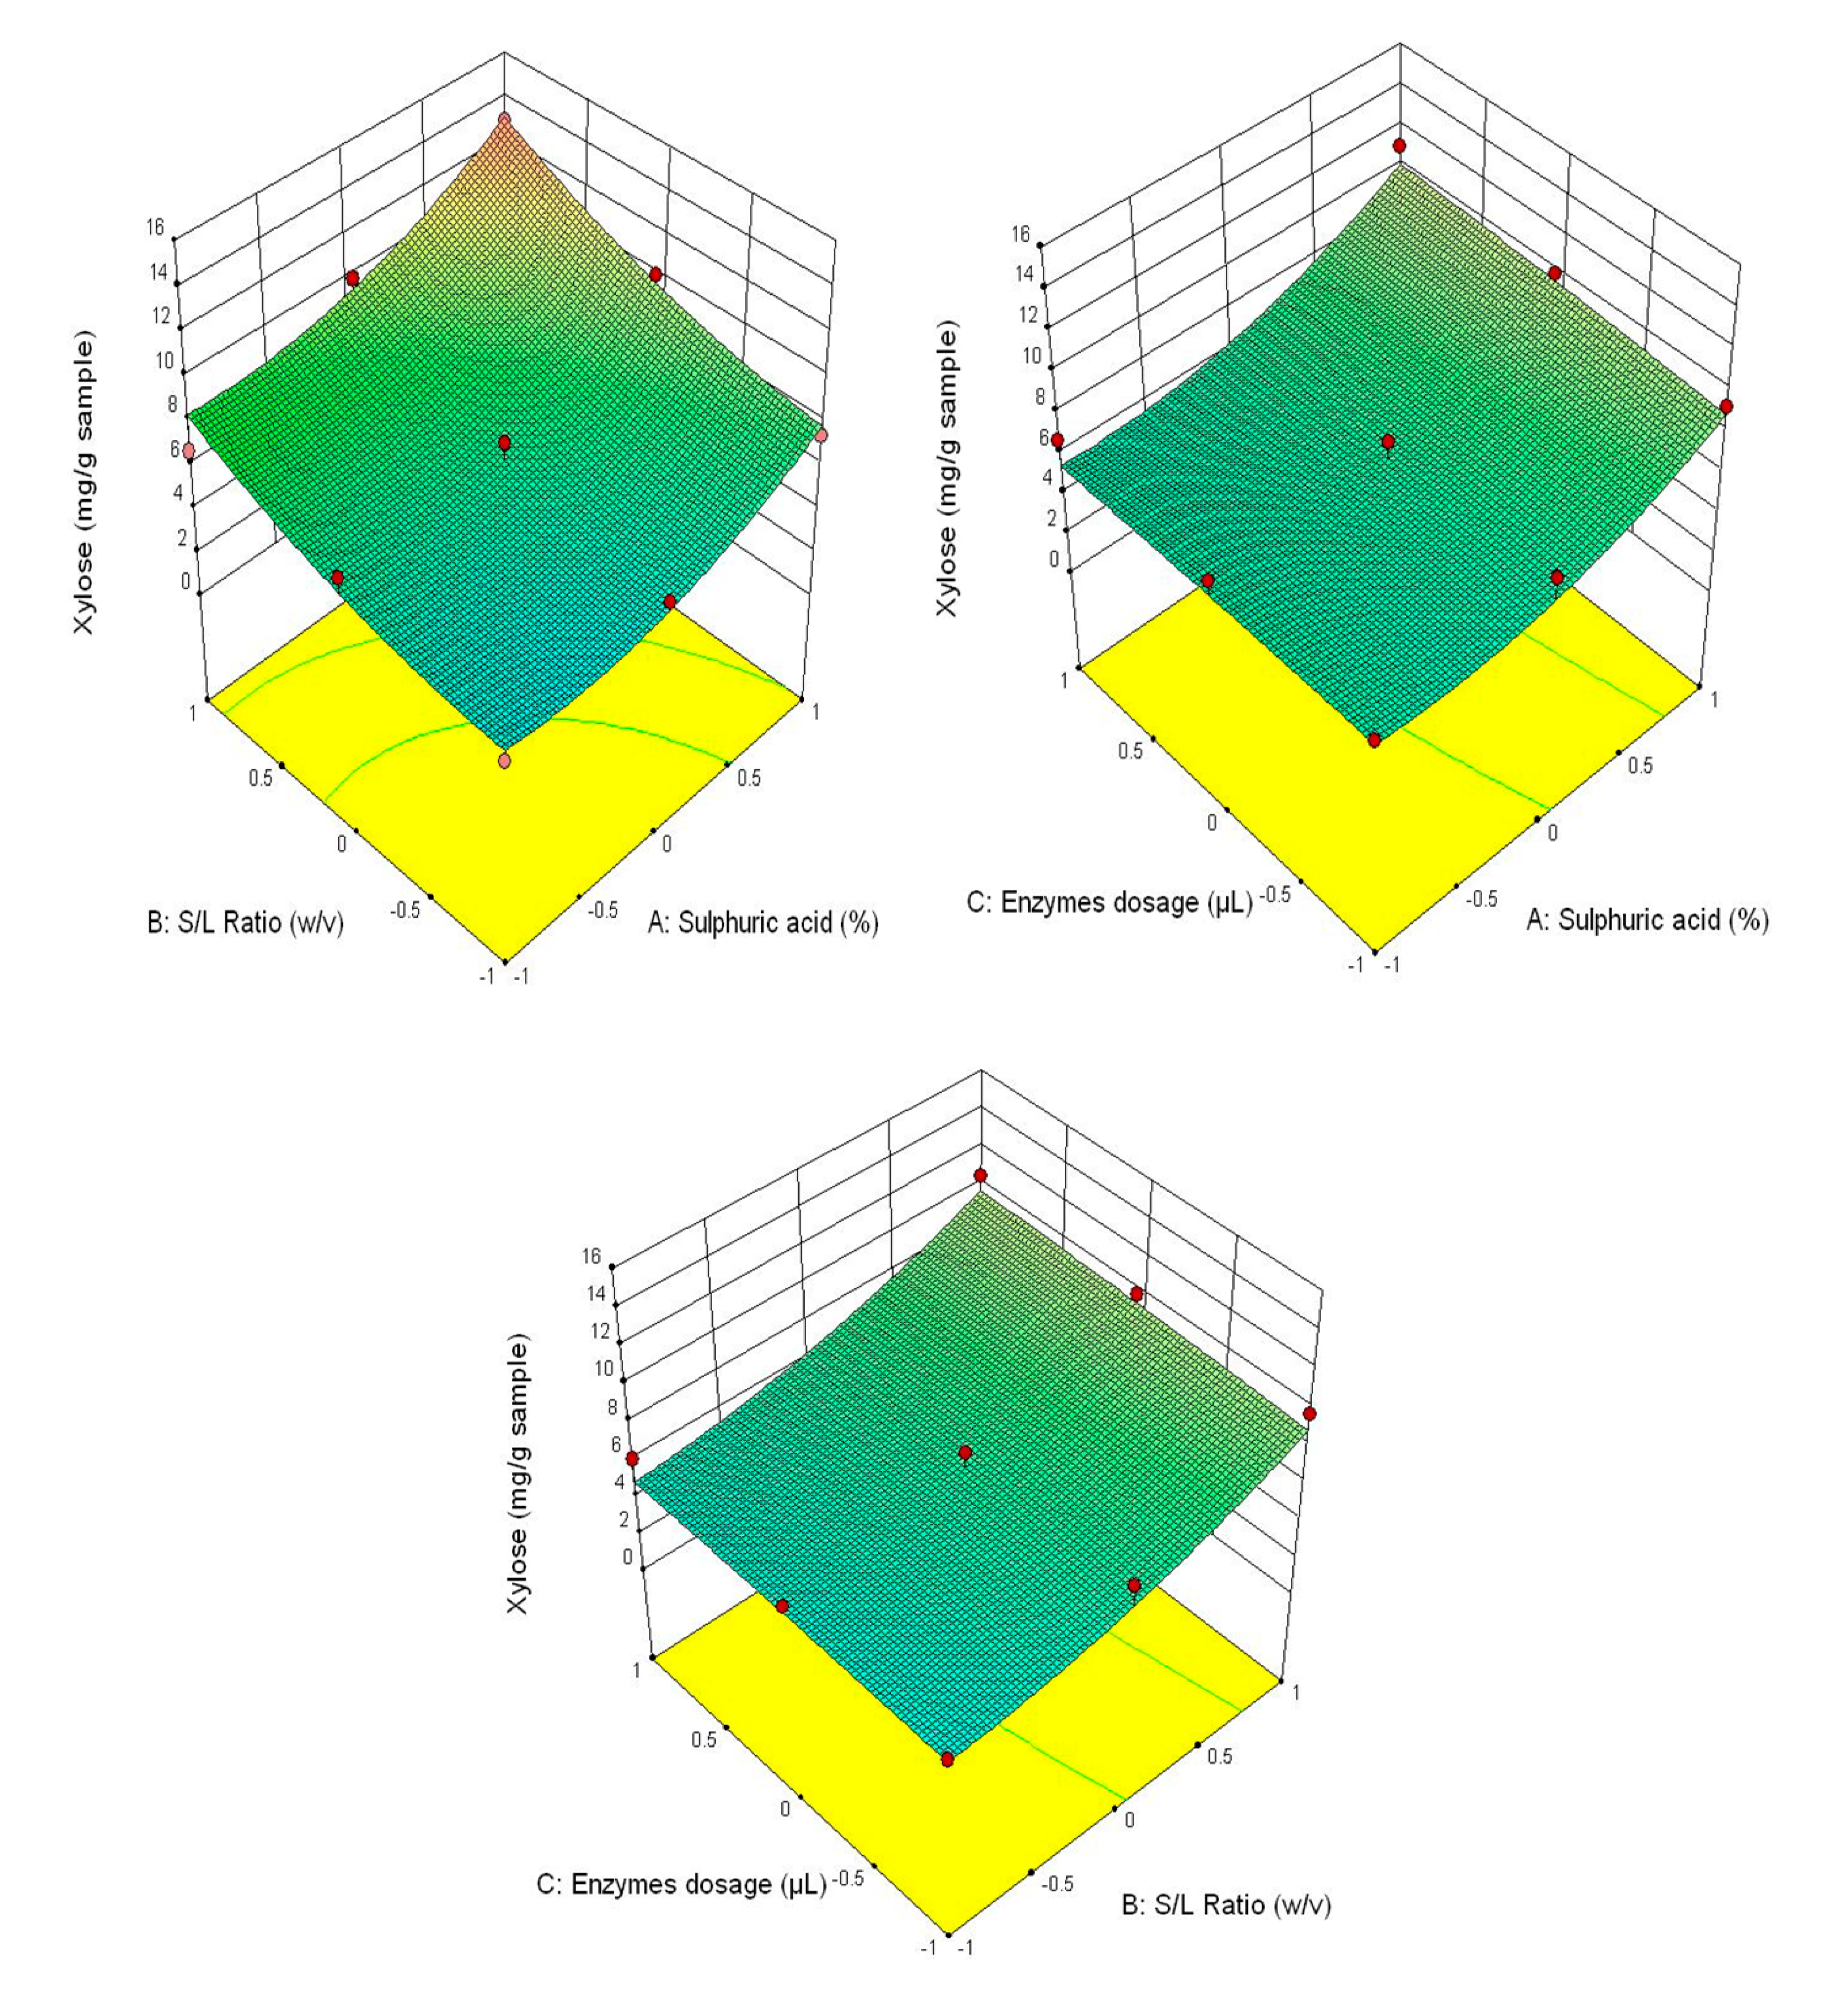
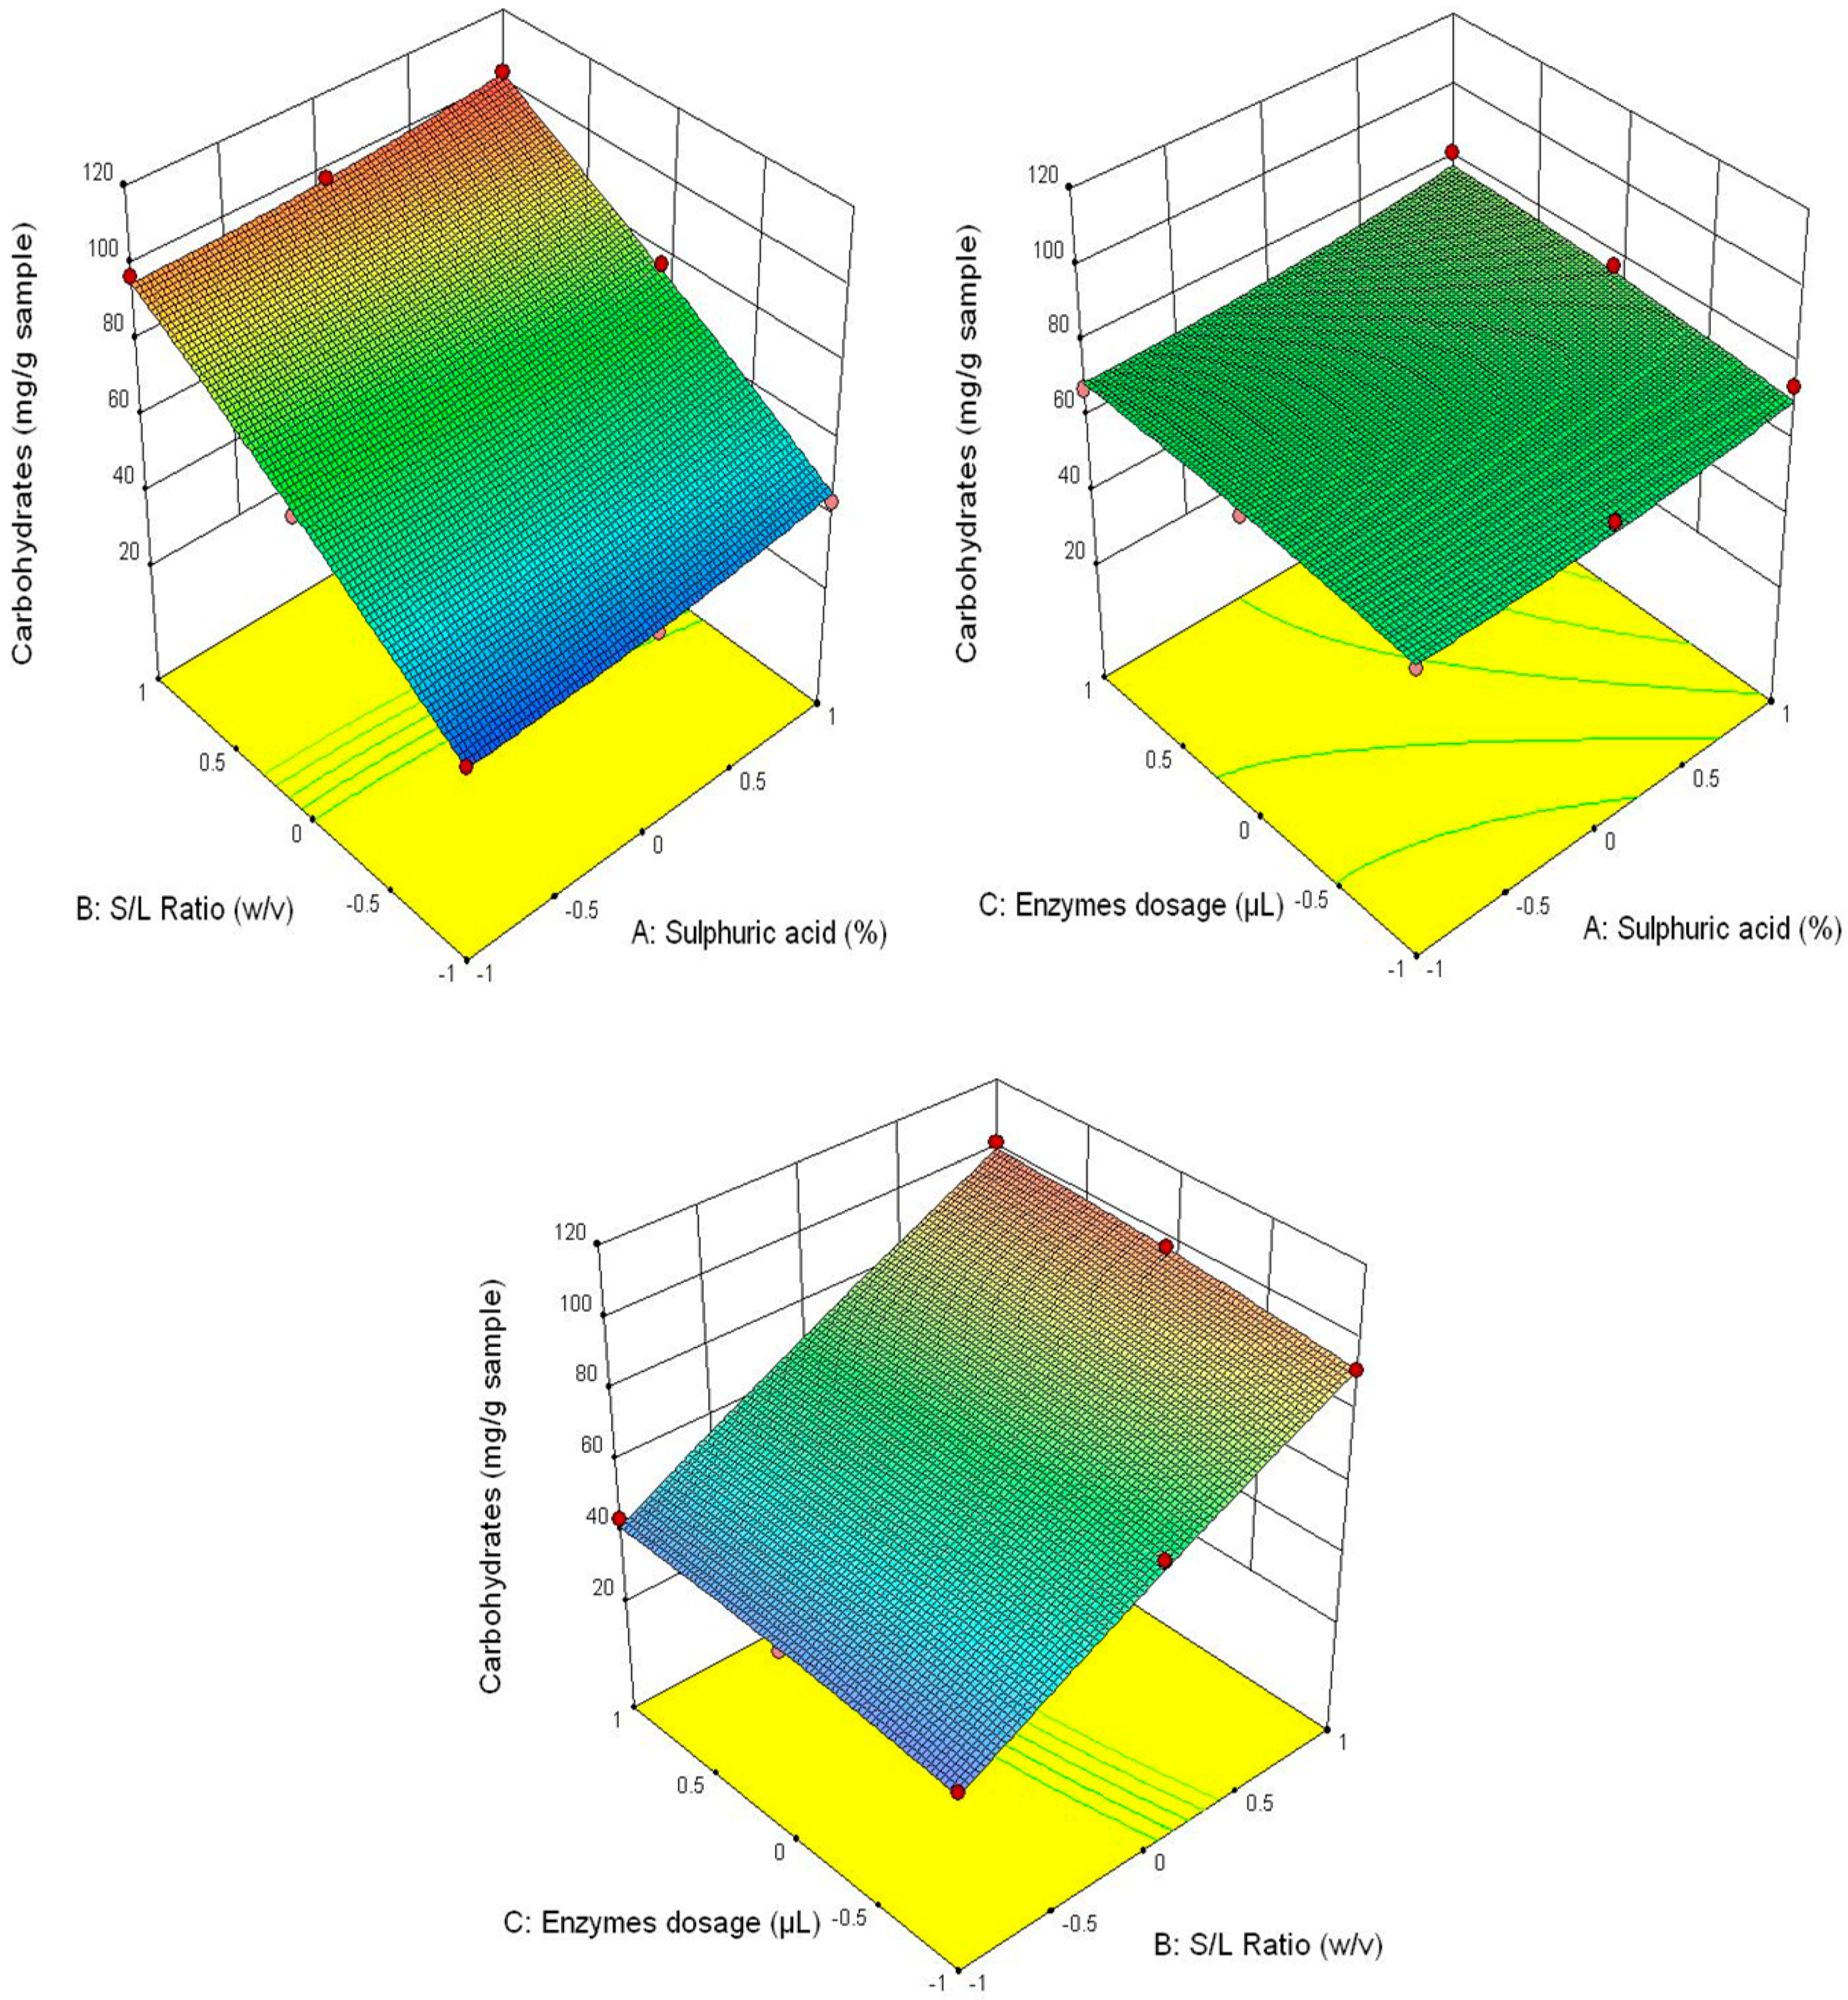
The experiment was conducted into three factor full factorial experiment for each type of carbohydrate (glucose, fructose and xylose) and total of carbohydrates. Each independent variable (concentration of sulphuric acid, ratio S/L and enzymes dosage) had 3 levels, as follows: concentration of sulphuric acid (1%, 2% and 3% respectively), ratio S/L (1/20 w/v, 1/25 w/v and 1/30 w/v respectively) and enzymes dosage (30/30 µL, 60/60 µL and 90/90 µL). The response of design were considered total of carbohydrates, glucose, fructose and xylose. The full factorial designed was made using Design-Expert 10.0 (Stat-Ease, Inc., Minneapolis, MN, USA).
The model used to predict the evolution of carbohydrates was a quadratic polynomial response surface model which can be applied to fit the experimental data obtained by Box-Behnken design. The quadratic polynomial response surface model which describes the relationship between the experimental data is [
47,
48]:
where:
—predicted response,
stands for the coded levels of the design variable (concentration of sulphuric acid, ratio S/L and enzymes dosage—
Table 1),
is a constant,
—linear effects,
—quadratic effects and
—interaction effects.
The results of acid organics and individual phenolic compounds were presented to analysis of variance (ANOVA) using Statgraphics Centurion XVIII software (Manugistics Corp., Rockville, MD, USA trial version).
4. Conclusions
Our results highlighted a highest degradation of lignocellulosic material in the case of pretreatment with 3% (v/v) H2SO4 compared to other concentrations of the same acid. This pretreatment led to an increasing of phenolics and organic acids content, especially of protocatechuic (34.72 ± 0.06 µg/g), vanillic (18.92 ± 0.02 µg/g) and 4-hydroxybenzoic (18.74 ± 0.01 µg/g), while the value of acid gluconic was 22.59 ± 0.05 mg/g, formic acid was 2.69 ± 0.02 mg/g and acetic acid was 0.94 ± 0.01 mg/g. The SEM microstructure of the pretreated samples revealed the changes which occurred on the surface of the straws undergoing pretreatment. Significant results were obtained in the case of treatment with 3% (v/v) H2SO4. ATR-FTIR analysis showed reduction in the intensity of the peaks characteristic to cellulose, hemicellulose and lignin at increased enzyme doses and S/L ratios, thus confirming the efficiency of the pretreatment and the enzymatic hydrolysis. This study showed that the pretreatment with 3% (v/v) H2SO4, in a S/L ratio of 1/30 (w/v) and with a dose of enzyme of 90/90 µL/g wheat straw led to the highest concentrations of carbohydrates (xylose 14.31 ± 0.11 mg/g, fructose 5.94 ± 0.13 mg/g, glucose 84.75 ± 0.23 mg/g and total carbohydrates 105.01 mg/g) and as a result the highest ethanol yield after the fermentation process.
The yield of ethanol (47.61 ± 2.3 g/Kg WS) could be improved if the concentration of H2SO4 (v/v) is increased in the pretreatment step, which would probably lead to a more significant disruption of the complex structure of the WS, hence facilitating the action of enzyme mixtures.


