Article

Analytical Determination of Geometric Parameters of the Rotary Kiln by Novel Approach of TLS Point Cloud Segmentation

1
Institute of Geodesy, Cartography and Geographical Information Systems, Faculty of Mining, Ecology, Process Control and Geotechnology, Technical University Kosice, Park Komenského 19, 04001 Košice, Slovak Republic
2
Department of Special Geodesy, Faculty of Civil Engineering, Czech Technical University in Prague, Thákurova 7, 166 36 Prague 6, Czech Republic
*
Author to whom correspondence should be addressed.
Appl. Sci. 2020, 10(21), 7652; https://doi.org/10.3390/app10217652
Submission received: 6 October 2020 / Revised: 23 October 2020 / Accepted: 26 October 2020 / Published: 29 October 2020
(This article belongs to the Special Issue Spatial Modeling in Environmental Analysis and Civil Engineering)

Abstract

:
This research focused on determining a rotary kiln’s geometric parameters in a non-traditional geodetic way—by deriving them from a survey realized by a terrestrial laser scanner (TLS). The point cloud obtained by TLS measurement was processed to derive the longitudinal axis of the RK. Subsequently, the carrier tires’ geometric parameters and shell of the RK during the shutdown were derived. Manual point cloud selection (segmentation) is the base method for removing unnecessary points. This method is slow but precise and controllable. The proposed analytical solution is based on calculating the distance from each point to the RK’s nominal axis (local radius). Iteration using a histogram function was repeatedly applied to detect points with the same or similar radiuses. The most numerous intervals of points were selected and stored in separate files. In the comparison, we present the conformity of analytically and manually obtained files and derived geometric values of the RK-radiuses’ spatial parameters and coordinates of the carrier tires’ centers. The horizontal (X and Y directions) and vertical (Z-direction) of root–mean–square deviation (RMSD) values are up to 2 mm. RMSD of the fitting of cylinders is also up to 2 mm. The center of the carrier tires defines the longitudinal axis of the RK. Analytical segmentation of the points was repeated on the remaining point cloud for the selection of the points on the outer shell of the RK. Deformation analysis of the shell of the RK was performed using a cylinder with a nominal radius. Manually and analytically processed point clouds were investigated and mutually compared. The calculated RMSD value is up to 2 mm. Parallel cuts situated perpendicularly to the axis of the RK were created. Analysis of ovality (flattening) of the shell was performed. Additionally, we also present the effect of gradually decreasing density (number) of points on the carrier tires for their center derivation.

1. Introduction

Rotary kiln (RK) is large‑scale machinery operating under conditions of high temperature (about 1200 °C) and rapidly changing mechanical stress. RK is used mainly for metallurgical purposes when drying, roasting, sintering loose raw materials, and burning of limestone, bauxite, and sulfur. The material passes through a slightly inclined (in some cases horizontal) rotating cylindrical shell of the kiln with refractory brick lining. The length of the RK is usually between 40 and 200 m, with a cylinder diameter of 2–6 m. The weight of the kiln is up to several hundred tons, depending on its length. The slope of the furnace is usually between 0% and 6%. The outer temperature of the shell during operation reaches up to 450 °C. The speed of the steady rotation is 1 to 1.5 rpm.
The body of RK is placed on several pairs of radial rollers. Rotation of the shell is provided by rings (carrier tires) made of cast steel. The radial rollers are placed in bearings. Bearings of the rollers are mounted on base frames made of cast steel, on a concrete basement. The radial rollers’ position defines the longitudinal axis’s spatial position, and they are used for its rectification. Axial rollers ensure the position of the shell in the longitudinal direction. Figure 1 shows the generalized scheme of the configuration of elements of the rotary kiln: Where (a) is a shell of RK, (b) are carrier tires, (c) are radial rollers, (d) is an axial roller, (e) are basement pillars.
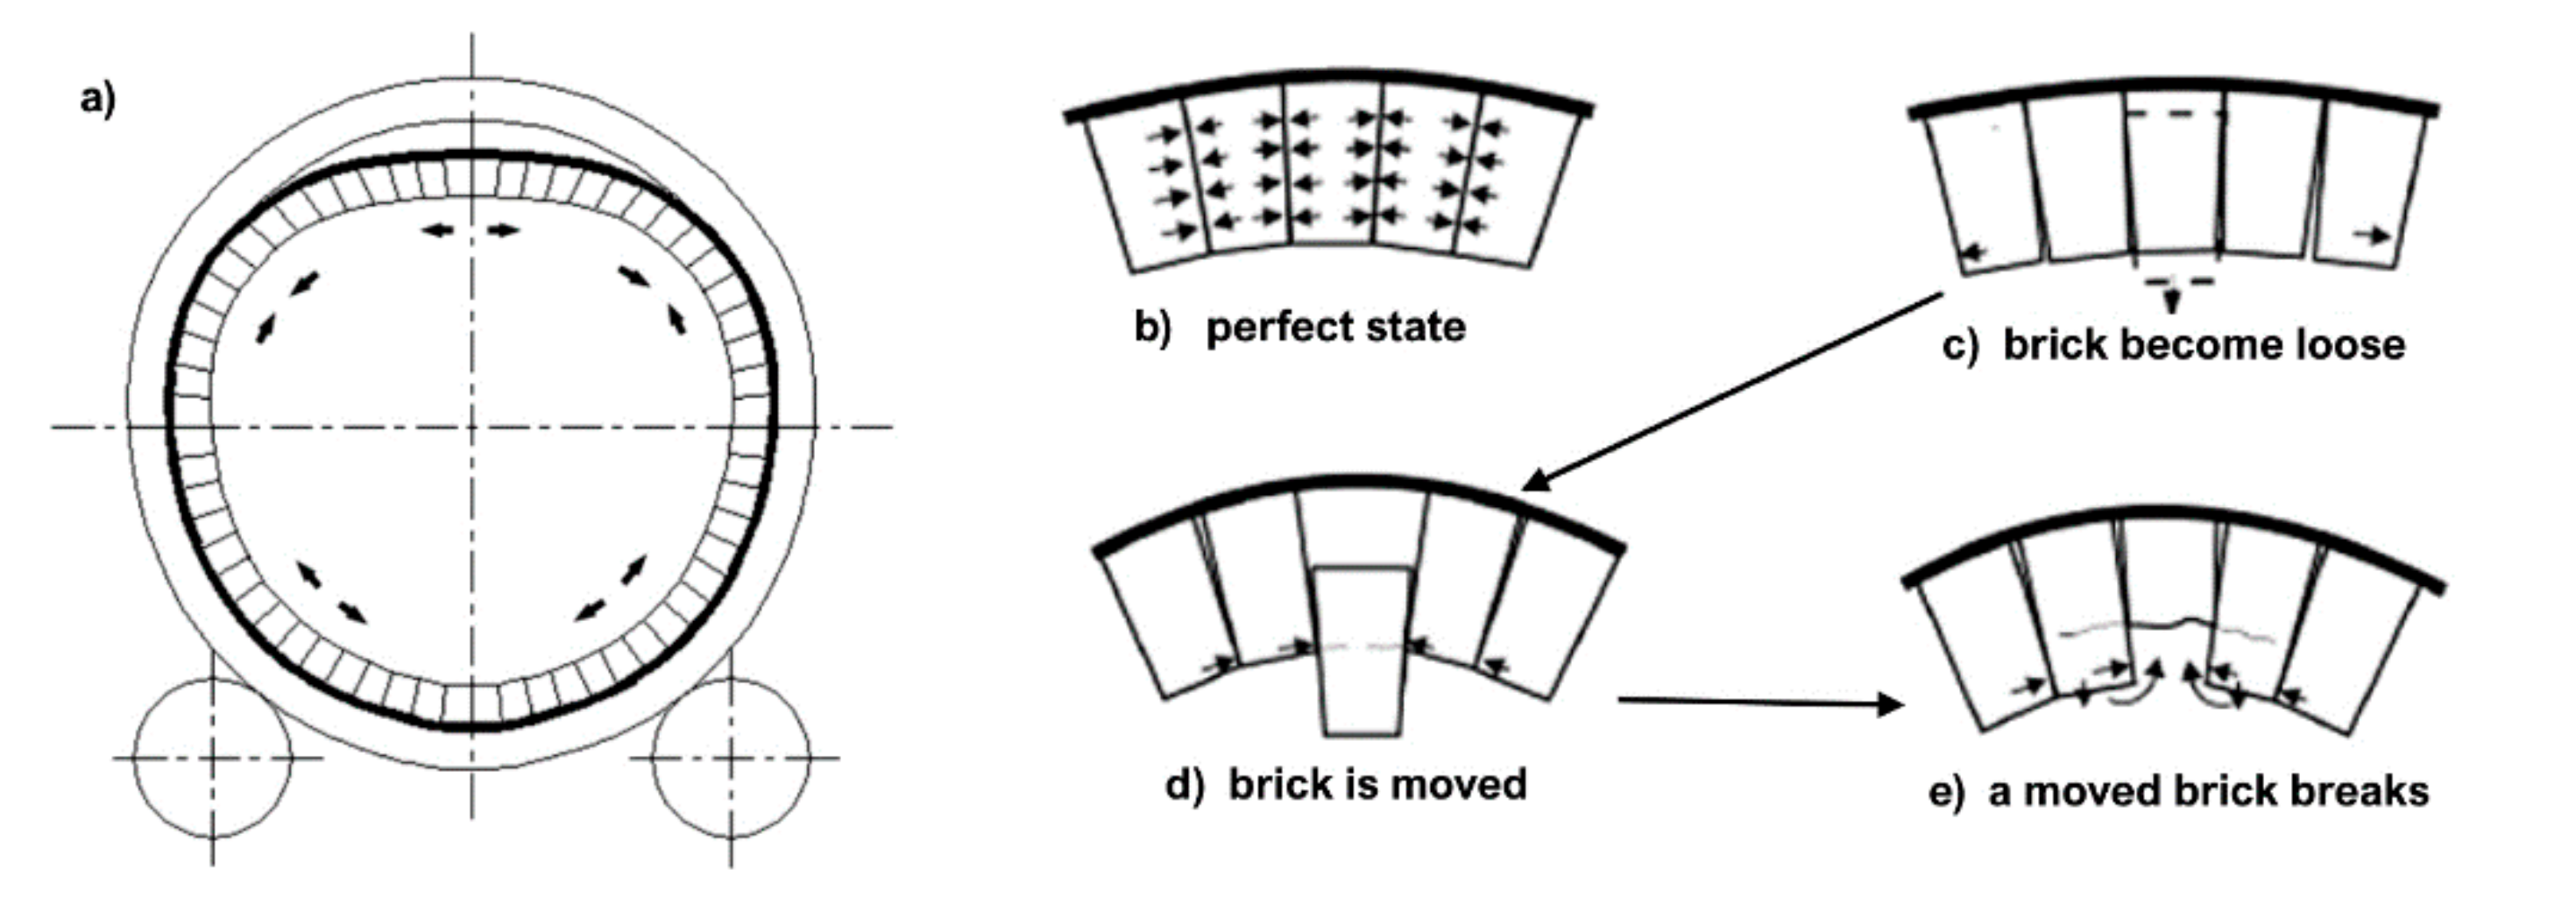
Inconsistency of geometrical parameters—in particular, the symmetry of the support rollers and the kiln shell along the longitudinal axis can result in permanent or temporary deformation of the shell (Figure 2a). As a result of this deformation, the inner refractory lining is damaged. When the kiln shell is deformed during its rotation, the kiln lining is loosened (Figure 2c) against the perfect state (Figure 2b), followed by a movement of a brick (Figure 2d), and finally breaking the lining of the kiln (Figure 2e). The damaged area of the shell without lining is prone to overheats and local damages of the kiln shell. Such a condition then requires a long-term overhaul [1].
Overheating is the main cause of shell deformation [2]. Problems of deformation of rotary kilns are dealt with in contributions [3,4,5,6,7].
The RK shell’s actual shape in every cross-section is simplified to an ellipse with semiaxes a and b. The degree of ovality is described by the formula ω = 2(a − b). Practically, the angle between the maximum and minimum value is not equal to 90°. Therefore, the formula for ovality calculation can be generalized as ω = 2(rmax − rmin) where rmax and rmin are maximal and minimal radiuses of the shell. In practice, the percentage of the ovality and the following equation are used
ω 0 = r m a x     r m i n r   · 100 %
where r is the known nominal radius of RK shell [8].
The main geometric conditions for the operation of RK are: The longitudinal axis of the kiln and the axes of the carrier tires must be identical during operation; axes of the bearing of the radial rollers must be parallel and symmetrical with the longitudinal axis of the kiln; the correct clearance must be between the axial rollers and sidewalls of the tires, with respect to the temperature compensation in the longitudinal direction. Additional measurements are mainly a control measurement of the radius of bearing rings and radial rollers and the measurement of the RK shell [9,10].
The RK measurement methodology consists of the reference system’s design and realization (local horizontal and vertical coordinate system) [11]. Next is the measurement of the spatial relationships of the longitudinal axis of the kiln and axes of rollers (measurements of position, height, additional, and special measurements) and eventually of determination of the rectifying parameters [12].
In the traditional method used to determine RK’s geometric parameters, the sight/alignment line method is used for positional measurement. Precise optical theodolites are usually used. In such a case, the reference system points have the shape of one or two shifted alignment lines stabilized by markers on RK’s basements. The local coordinate system is generally chosen so that one of its axes’ direction is identical with the alignment line’s direction and the RK’s longitudinal axis. For height measurements, the method of leveling is used. The height measurement aims to determine the absolute or relative heights of the radial rollers’ axes and the height of the carrier tire of RK shell. Precision analysis of geometric parameters for the RK’s alignment in the cold state is described in [12].
The use of total stations (TS) and especially TLS are currently the preferred technologies of geodetic measurements of spatial objects [13,14,15]. Lots of experts also make achievements using TLS in several areas of research in construction and industry [8]. Malowany in [11] used a TLS method for the determination of the boiler geometry. Nuttens [16,17,18] assessed the applicability of terrestrial laser scanning for ovality monitoring of newly built tunnels. Wang applied the TLS method for tunnel measurements in [19]. Stability monitoring of architectural structure using laser scanning technique deals Xue in paper [20]. TLS method has also been used in the monitoring of bridges [21,22]. TLS was applied for the measurement of defects on concrete surfaces in [23]. For the deformation measurement of objects, the TLS method was used in works [24,25,26]. TLS is also a proven method of collecting spatial data; it is used as a reference for verification of reliability for other methods [27].
There are only a few current articles dealing with the rotary kiln geometry. Mostly older articles are available as [28,29,30].
Many online commercials confirm the importance of research of options for RK measurement, such as [31,32,33,34,35]. In doing so, companies use standard classical measurement methods. Only in [36] the TLS approach to determine the parameters of the RK is indicated.
The accuracy of scan registration using the planar target is shown in [37,38,39]. The accuracy of the TLS method is dealt with in the works [40,41,42] with excellent results. We have therefore decided to apply it to the measurement of a rotary kiln. An integral part of the processing of the acquired point cloud is segmentation, which is laborious. Point cloud segmentation groups points with similar attributes with respect to geometric, colorimetric, radiometric, and/or other information. There are different methods and approaches. Segmentation of points based on geometry, intensity, or color is described, for example, in [43,44,45,46]. Automated and semi-automated procedures are listed in [47,48,49,50,51,52,53]. Due to the specific shape of the object and the purpose of the work, we designed and tested a new procedure based on an analytical solution of the RK shell’s geometry in correlation with the number of points in the histogram intervals.
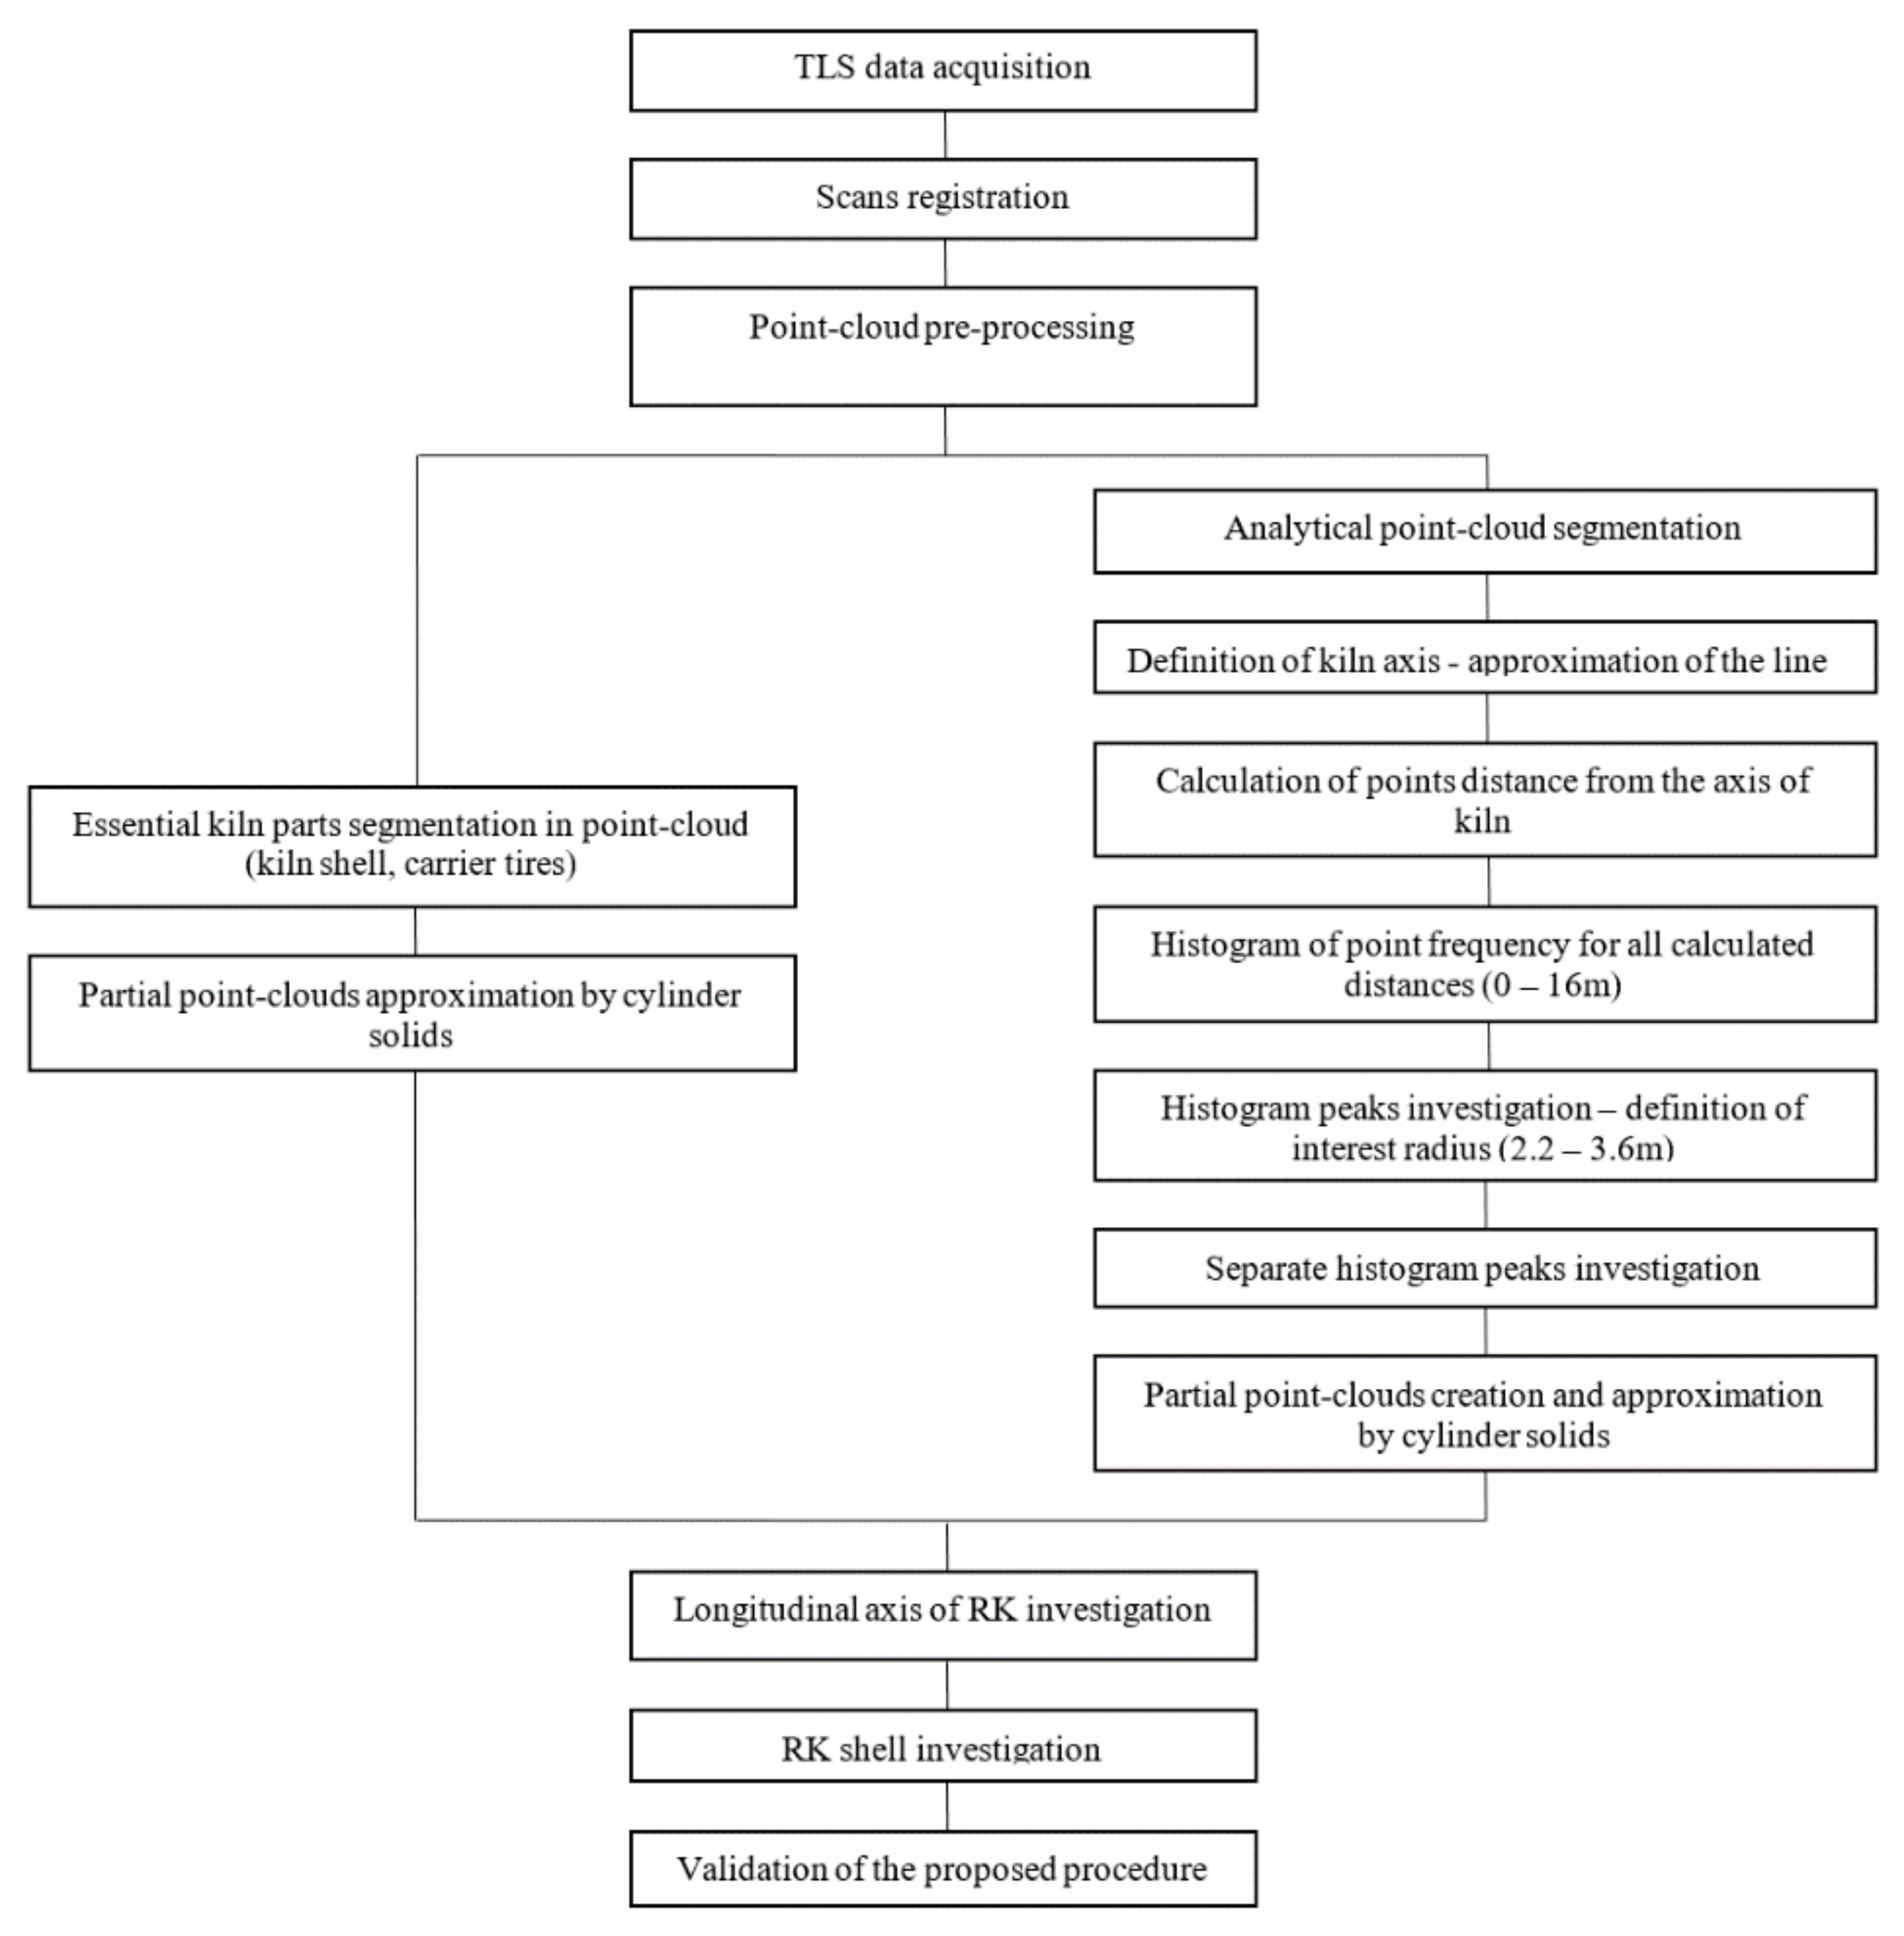
The aim of our research is the application of TLS measurement and verification of the analytical solution for the selection of relevant points on the RK object to determine its geometry and rectification parameters. According to the scope of this study, a workflow scheme (Figure 3) was prepared.

2. Materials and Methods

2.1. Study Area—The Object of Research

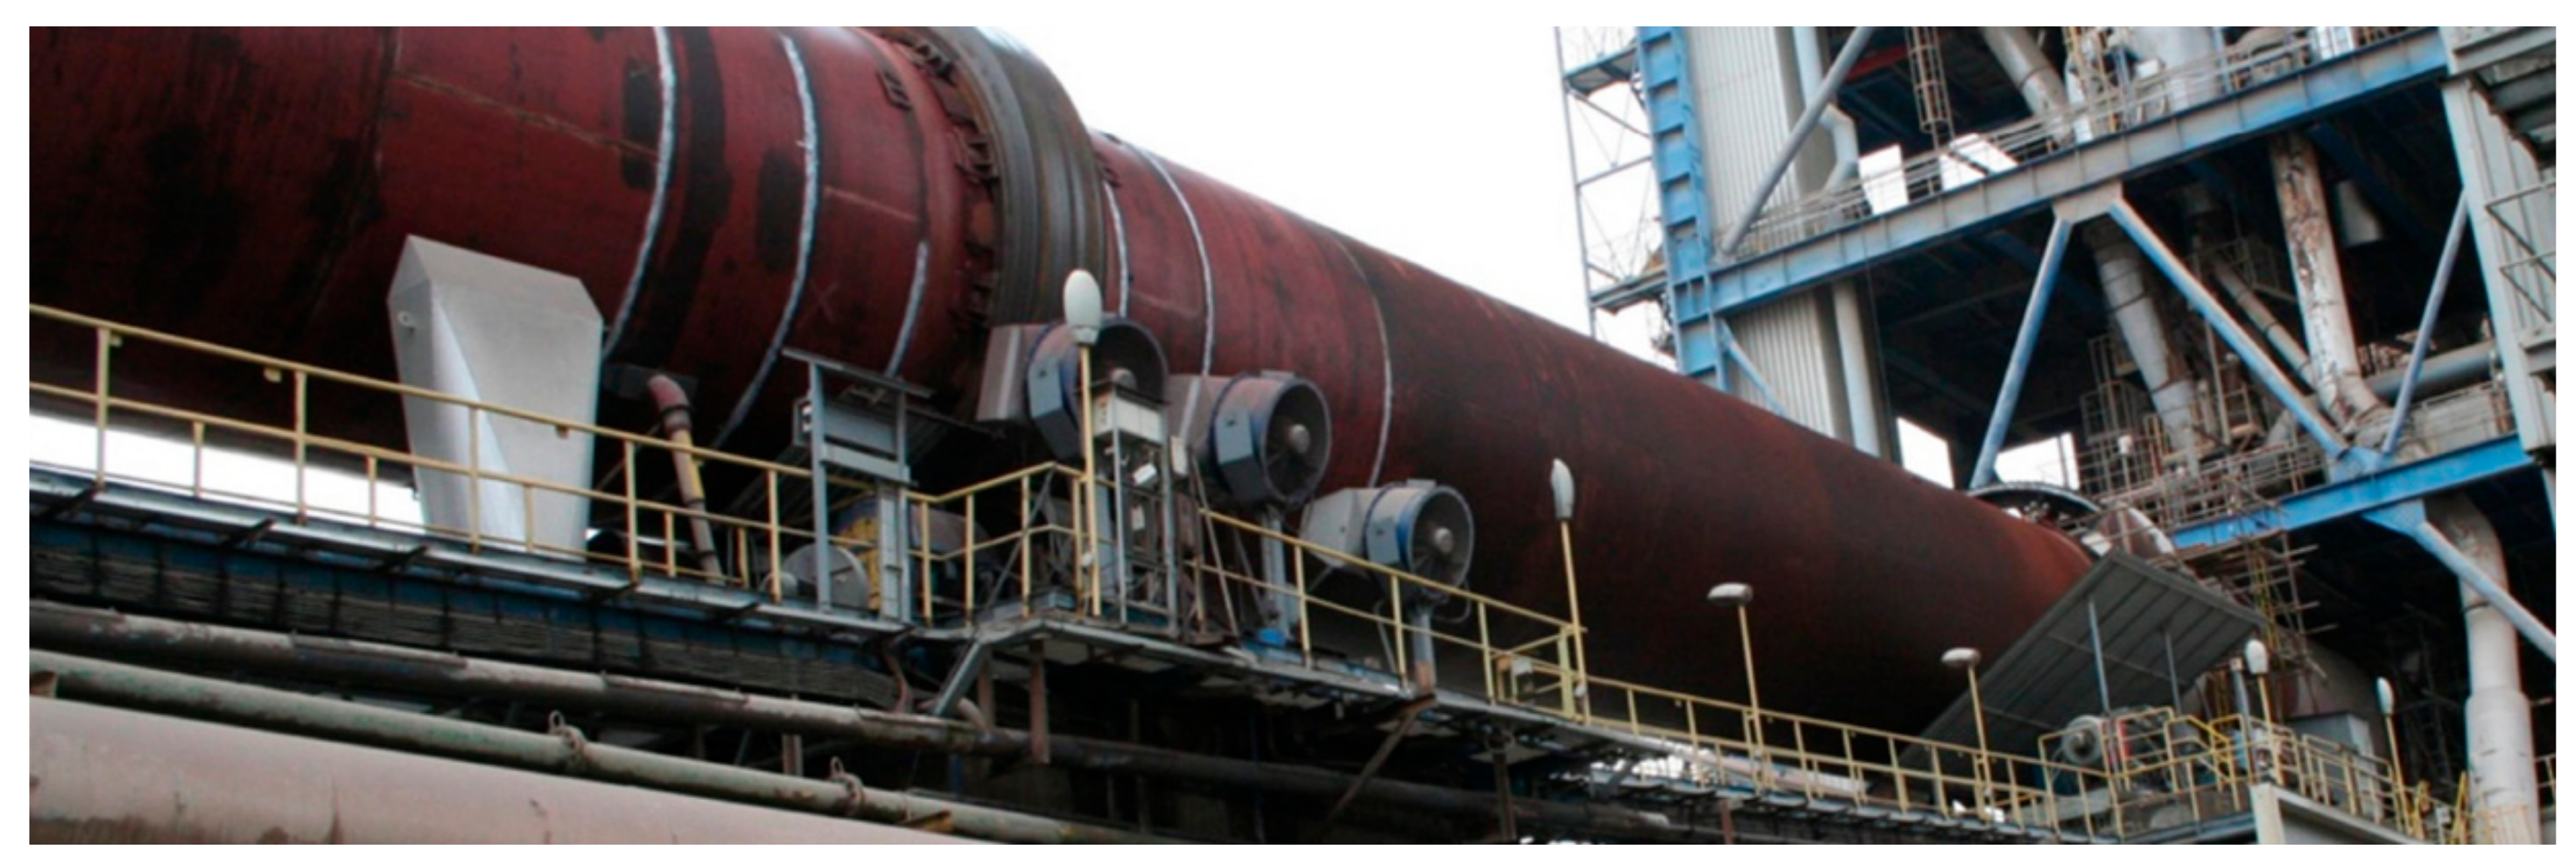
The TLS survey was realized for the rotary kiln in a cement plant near Košice, Slovakia (Figure 4). The kiln is approximately 80 m long, the theoretical inclination of the longitudinal axis is 3.5%, the diameter is 5000 m. The rotary kiln is placed above the ground on three separate foundations. The propulsion with the gearbox is located in the first basement. The transmission of rotary force is provided by a gear tire engaged with the pinion of the gearbox. An axial roller guarantees the stability of the RK in the longitudinal direction on the first basement. This RK is on duty for more than 45 years.

2.2. Surveying Equipment and Data Acquisition

The in-situ TLS survey was realized during the kiln shutdown and its overhaul—the so-called “cold state”. The measurement was carried out in the local coordinate system used across the whole factory. The positive direction of the axis Y is parallel to the nominal axis of the RK.
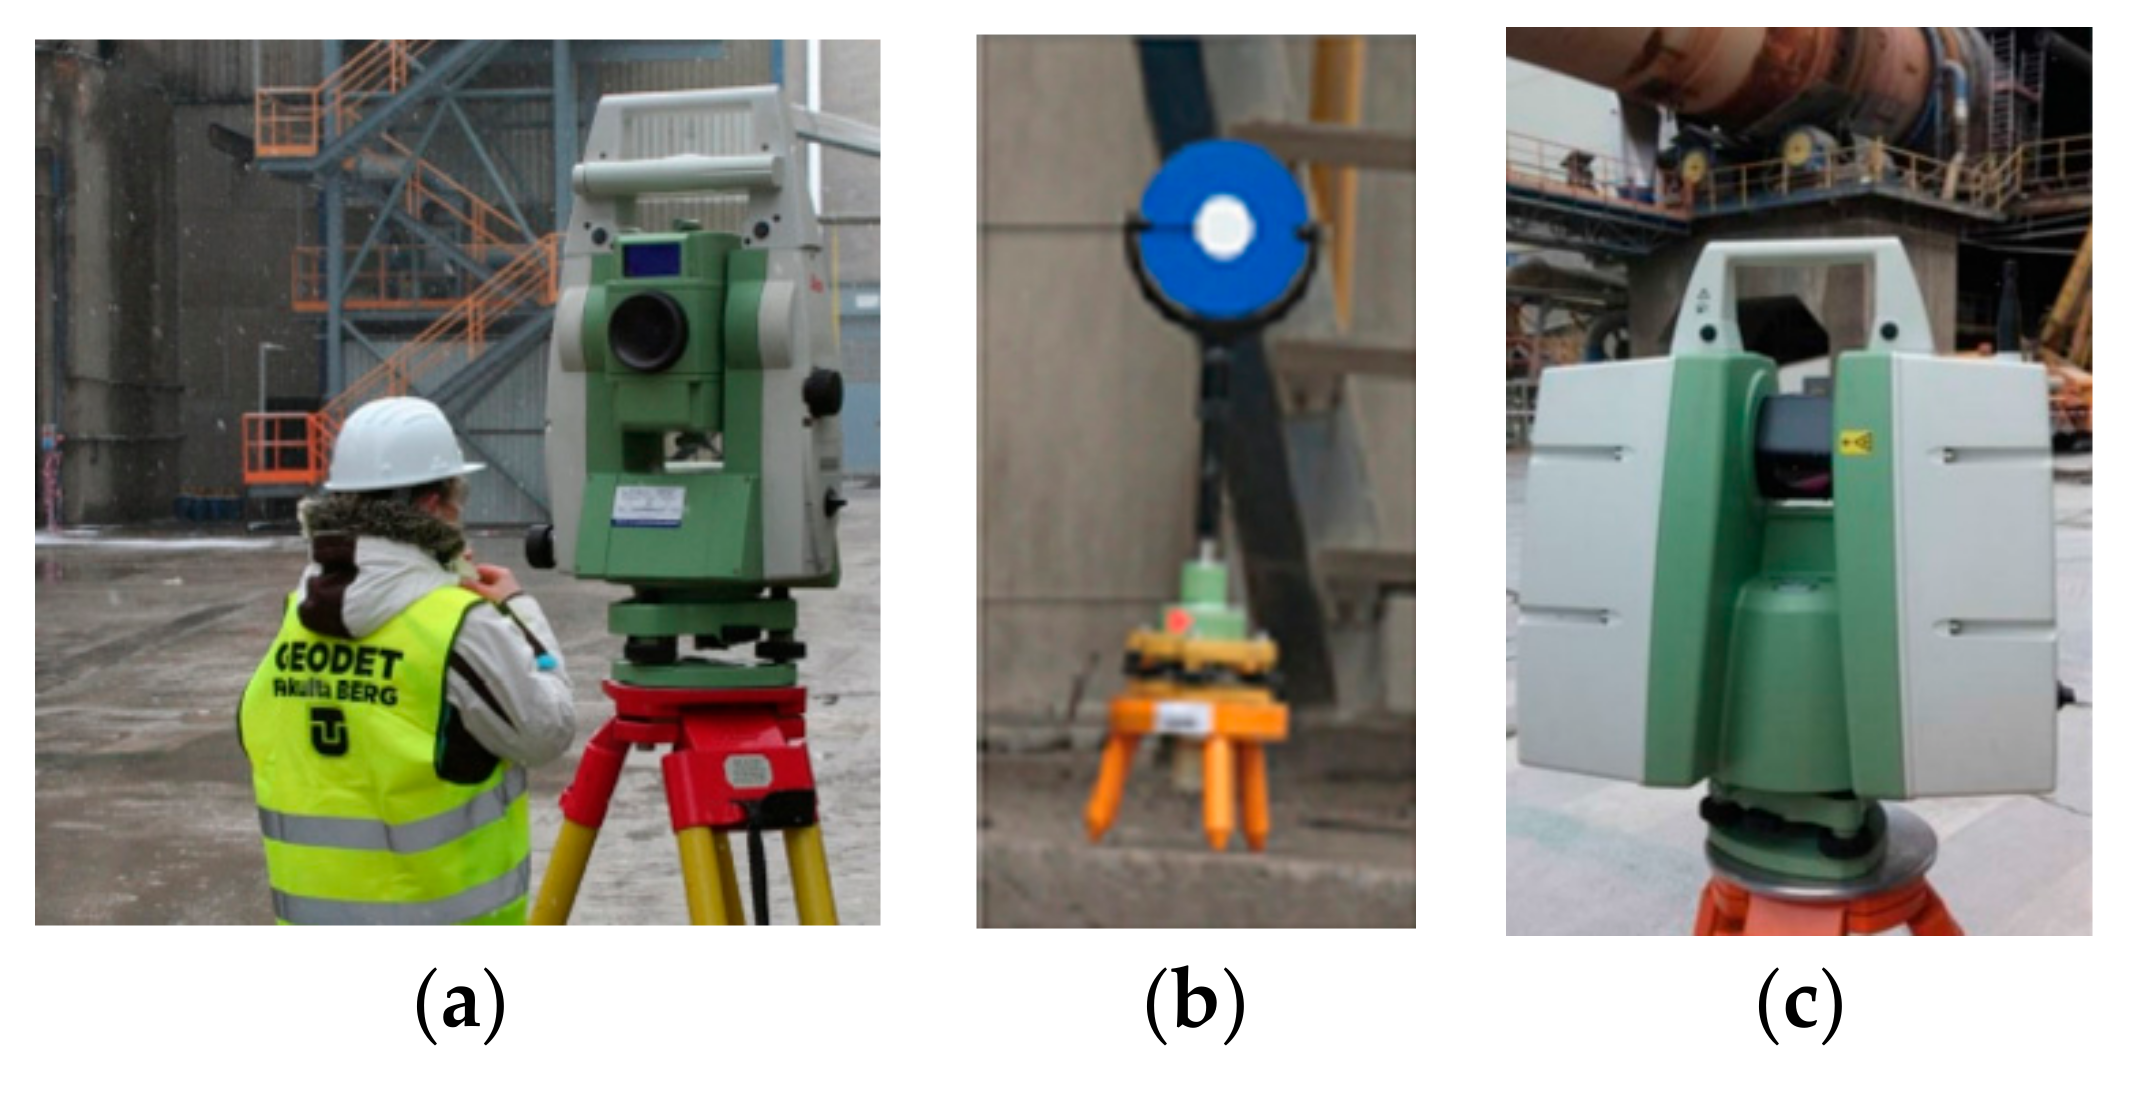
The survey was connected to the points of the local survey net of the plant in the vicinity of the RK. The location of all survey points distinguished by color is shown in Figure 5. Given its size, this net is established as planar, i.e., the net scale factor is 1. The connection points are marked by nails in the concrete foundations of buildings and technological objects. Leica TCRA 1201+ total station (TS) and the method of the temporary station for the connection measurement were used (Figure 6a). The horizontal (X and Y directions) and vertical (Z-direction) RMSD of these points and coordinates of free station derived from the reference network points is less than ±1 mm.
Ground Control Points (GCP) for the TLS were marked temporarily. Leica circular HDS targets on geodetic tripods and mini-tripods and magnetic targets (Figure 6b) were used to connect the TLS survey to a common coordinate system. The spatial polar method with reflectorless distance measurement from a single set-up was used to determine the center of the targets’ coordinates. The measurement was done in two faces of instruments’ telescope.
Total station’s selected technical specifications include an angular accuracy (horizontal and vertical) of 0.3 mgon, and the distance measurement accuracy, which is according to ISO 17123‑4 1 mm + 1.5 ppm in the standard measurement mode. A red laser with a 633 nm wavelength may be used in the phase measurement configuration when accuracy reaches 2 mm + 2 ppm [54]. For measurement of the orientations, Leica GMP 111 mini prism was used. Automatic Target Recognition (ATR) was applied. The ATR accuracy 0.3 mgon (standard deviation), according to ISO 17123-3.
The horizontal accuracy of GCP determination is expressed by the standard deviation mp of the measured point according to Equation (2):
m P 2 = m p A 2 + sin 2 z . m S 2 + s 2 . cos 2 z . m z ρ 2 + s 2 . sin 2 z . m ω ρ 2
where:
mpA—standard positional deviation of the connection points,
s—slope distance,
z—zenith angle,
mω—standard deviation of the horizontal angle,
mz—standard deviation of the zenith angle,
ms—standard deviation of the distance,
ρ—coefficient of angular conversion
The vertical accuracy of GCP is determined by the standard deviation mh derived for trigonometric height measurement by Equation (3):
m h 2 = m h A 2 + cos 2 z . m S 2 + s 2 . sin 2 z . m z ρ 2
where:
mhA—standard height deviation of the connection points.
For the GCP internal accuracy for the furthest measured points from the standpoint, where s = 80 m, z = 105 g; the values of standard deviations were calculated mp ≤ 2 mm and mh = ≤ 2 mm.
For the TLS survey, Leica ScanStation C10 laser scanner instrument (Figure 6c) was used. The technical parameters of the scanner are described in [55]. The TLS survey was performed from five survey stations with a direct connection to GCPs by the resection method. The mutual registration of scans was performed directly in the field. The total accuracy of scan registration was up to 2 mm. This corresponds to the value of RMSD in determining a temporary station. The scanning resolution was set to 1 cm at a distance of 40 m.
During the surveying time, some obstacles to measuring the entire rotary kiln shell were detected, the permanent ones were, e.g., fans, pipelines, heat and dust deflection shields, and safety shields (Figure 7). Due to the RK’s ongoing reconstruction, a work construction platform was placed at the outlet part of the RK.
Our verification measurement of RK’s shell by TS was done in three sections, approximately in the middle part of RK. It was used for selective control of the laser scanning cloud. Since the TS measurement with the spatial polar method is a more precise method, we consider it as a reference.

3. Data Processing

The merged TLS point cloud with overlapped scans was unified by spatial filtering to 10 mm resolution in the preprocessing data phase with the use of Trimble Realworks® software. To verify the quality of the scanned point cloud of RK, CloudCompare was used (function Cloud to Cloud was applied, with local modeling enabled (Table Local modeling, Local model option 2D1/2 Triangulation)). RMSD 2 mm with a maximum 4 mm characterizes a sufficient match of TS and TLS measurements. The RK shell has a cylindrical shape, so this comparison compares by matching the shell radius to the match of its position in the Y, Z axes. Therefore, we consider TLS data to be correctly localized for this study. The general equation for the RMSD is following:
R M S D = 1 n r i r 2 n
where ri are the determined radiuses, and r is the nominal, or approximate radius of the RK.

3.1. Preliminary Longitudinal Axis Investigation

The raw point cloud contains all points obtained by a laser scanner—about 20 million points. It was necessary to cut and remove unwanted points manually and retain points on the kiln body for further processing.
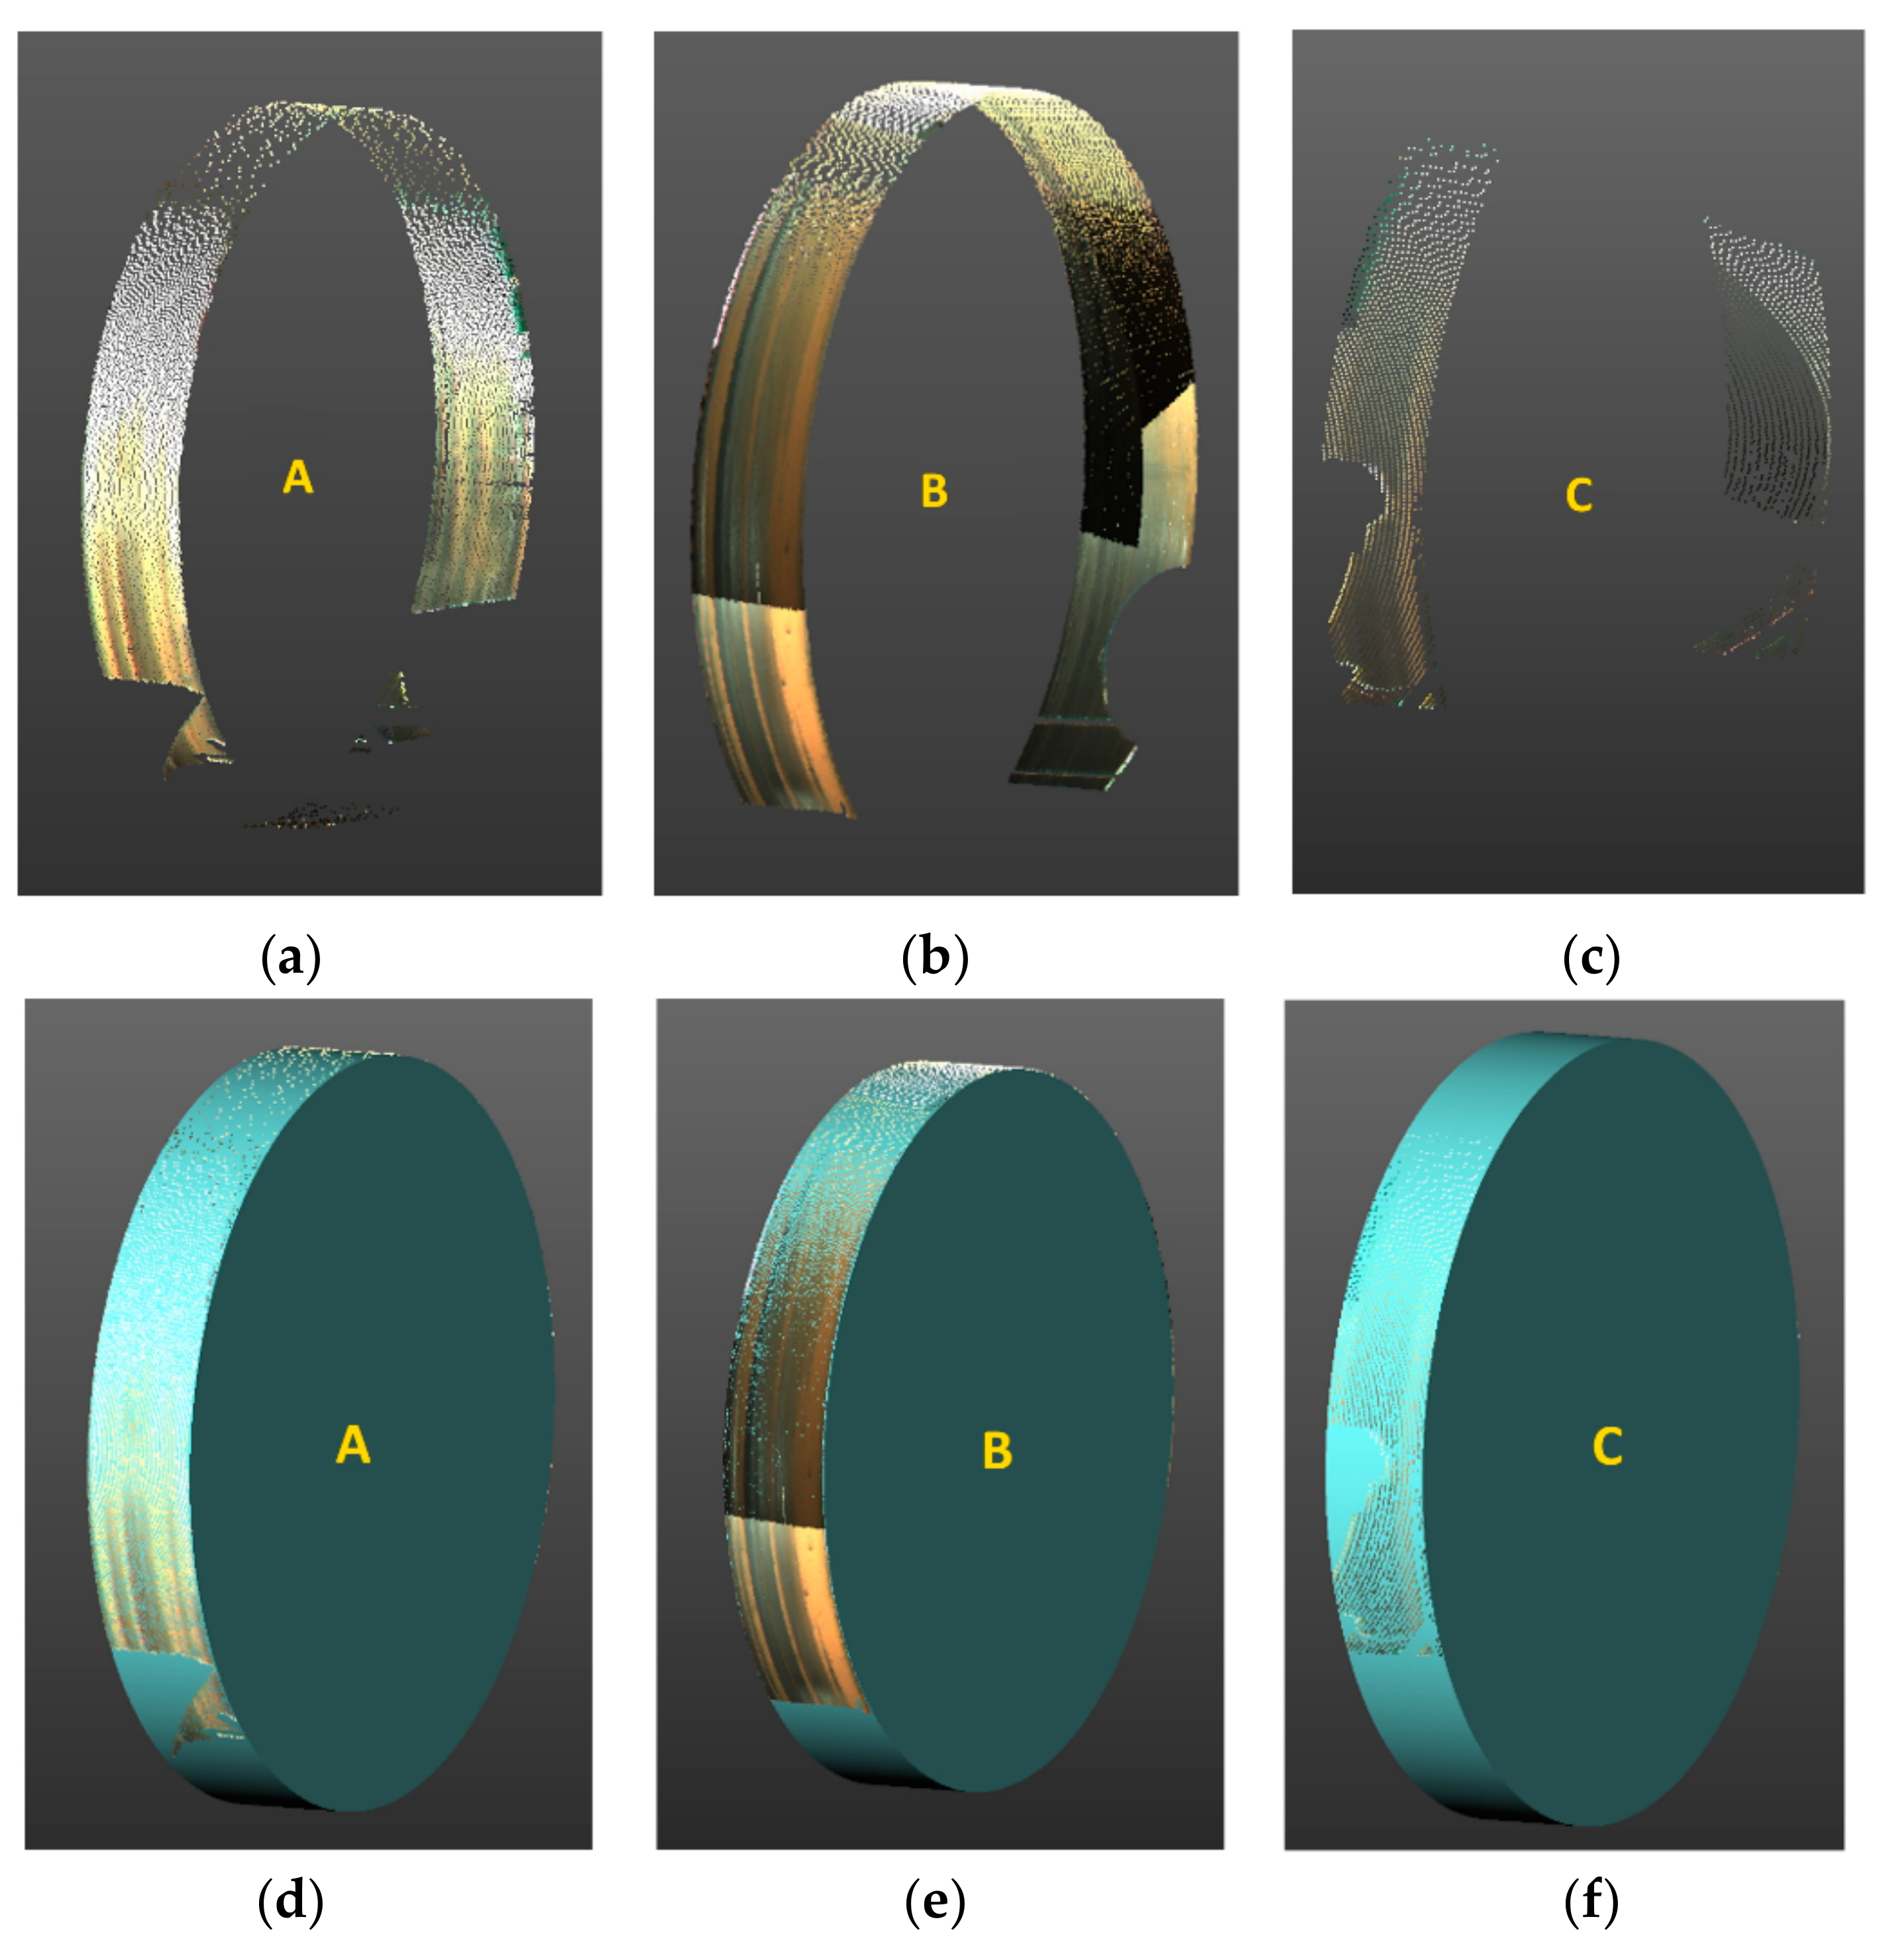
Carrier tires with radial rollers are the only carrier feature of the whole RK. They have a determining influence on all other parts of the RK’s geometry, including its shell. Therefore, the centers of the support rings define the longitudinal axis of the kiln. The measured points on the surface of rings A to C were manually segmented and stored in separate files (Figure 8 above). To determine the centers of the rings, mathematically defined cylindrical bodies were translated by these data in the Trimble Realworks® software (Figure 8 below). The number of points in the sets, the fitting parameters, and the cylindrical bodies’ positions are given in Table 1; Table 2. In the overall view are displayed on Figure 9.

3.2. Analytical Point Cloud Segmentation

The longitudinal axis of RK investigation was a prerequisite for the proposed analytical solution, and at the same time, its exact position in the factory coordinate system was up to now unreliable. Graphical or manual selection of interesting features in a large point cloud is very time-consuming and error-prone. The analytical solution’s basic idea is based on calculating the distance of the point from the line, which is represented by two points on the RK’s real axis. Processing of the partially cut raw point cloud was performed in MatLab® environment. The core part of the procedure is shown in the following paragraphs.
The distance of a point to a line (Figure 10) in a three-dimensional Euclidean space ε3 is mathematically defined as follows: Consider a point B and line p, which is given by the point A and by the direction vector of the line u, then the shortest distance d of the point to the line is defined by the formula:
d = u × AB u
where
d—A distance of a point in the point cloud to the real axis of RK,
u—direction vector of the true longitudinal axis of RK,
AB—vector defined by the point of the RK axis and point of the point cloud.
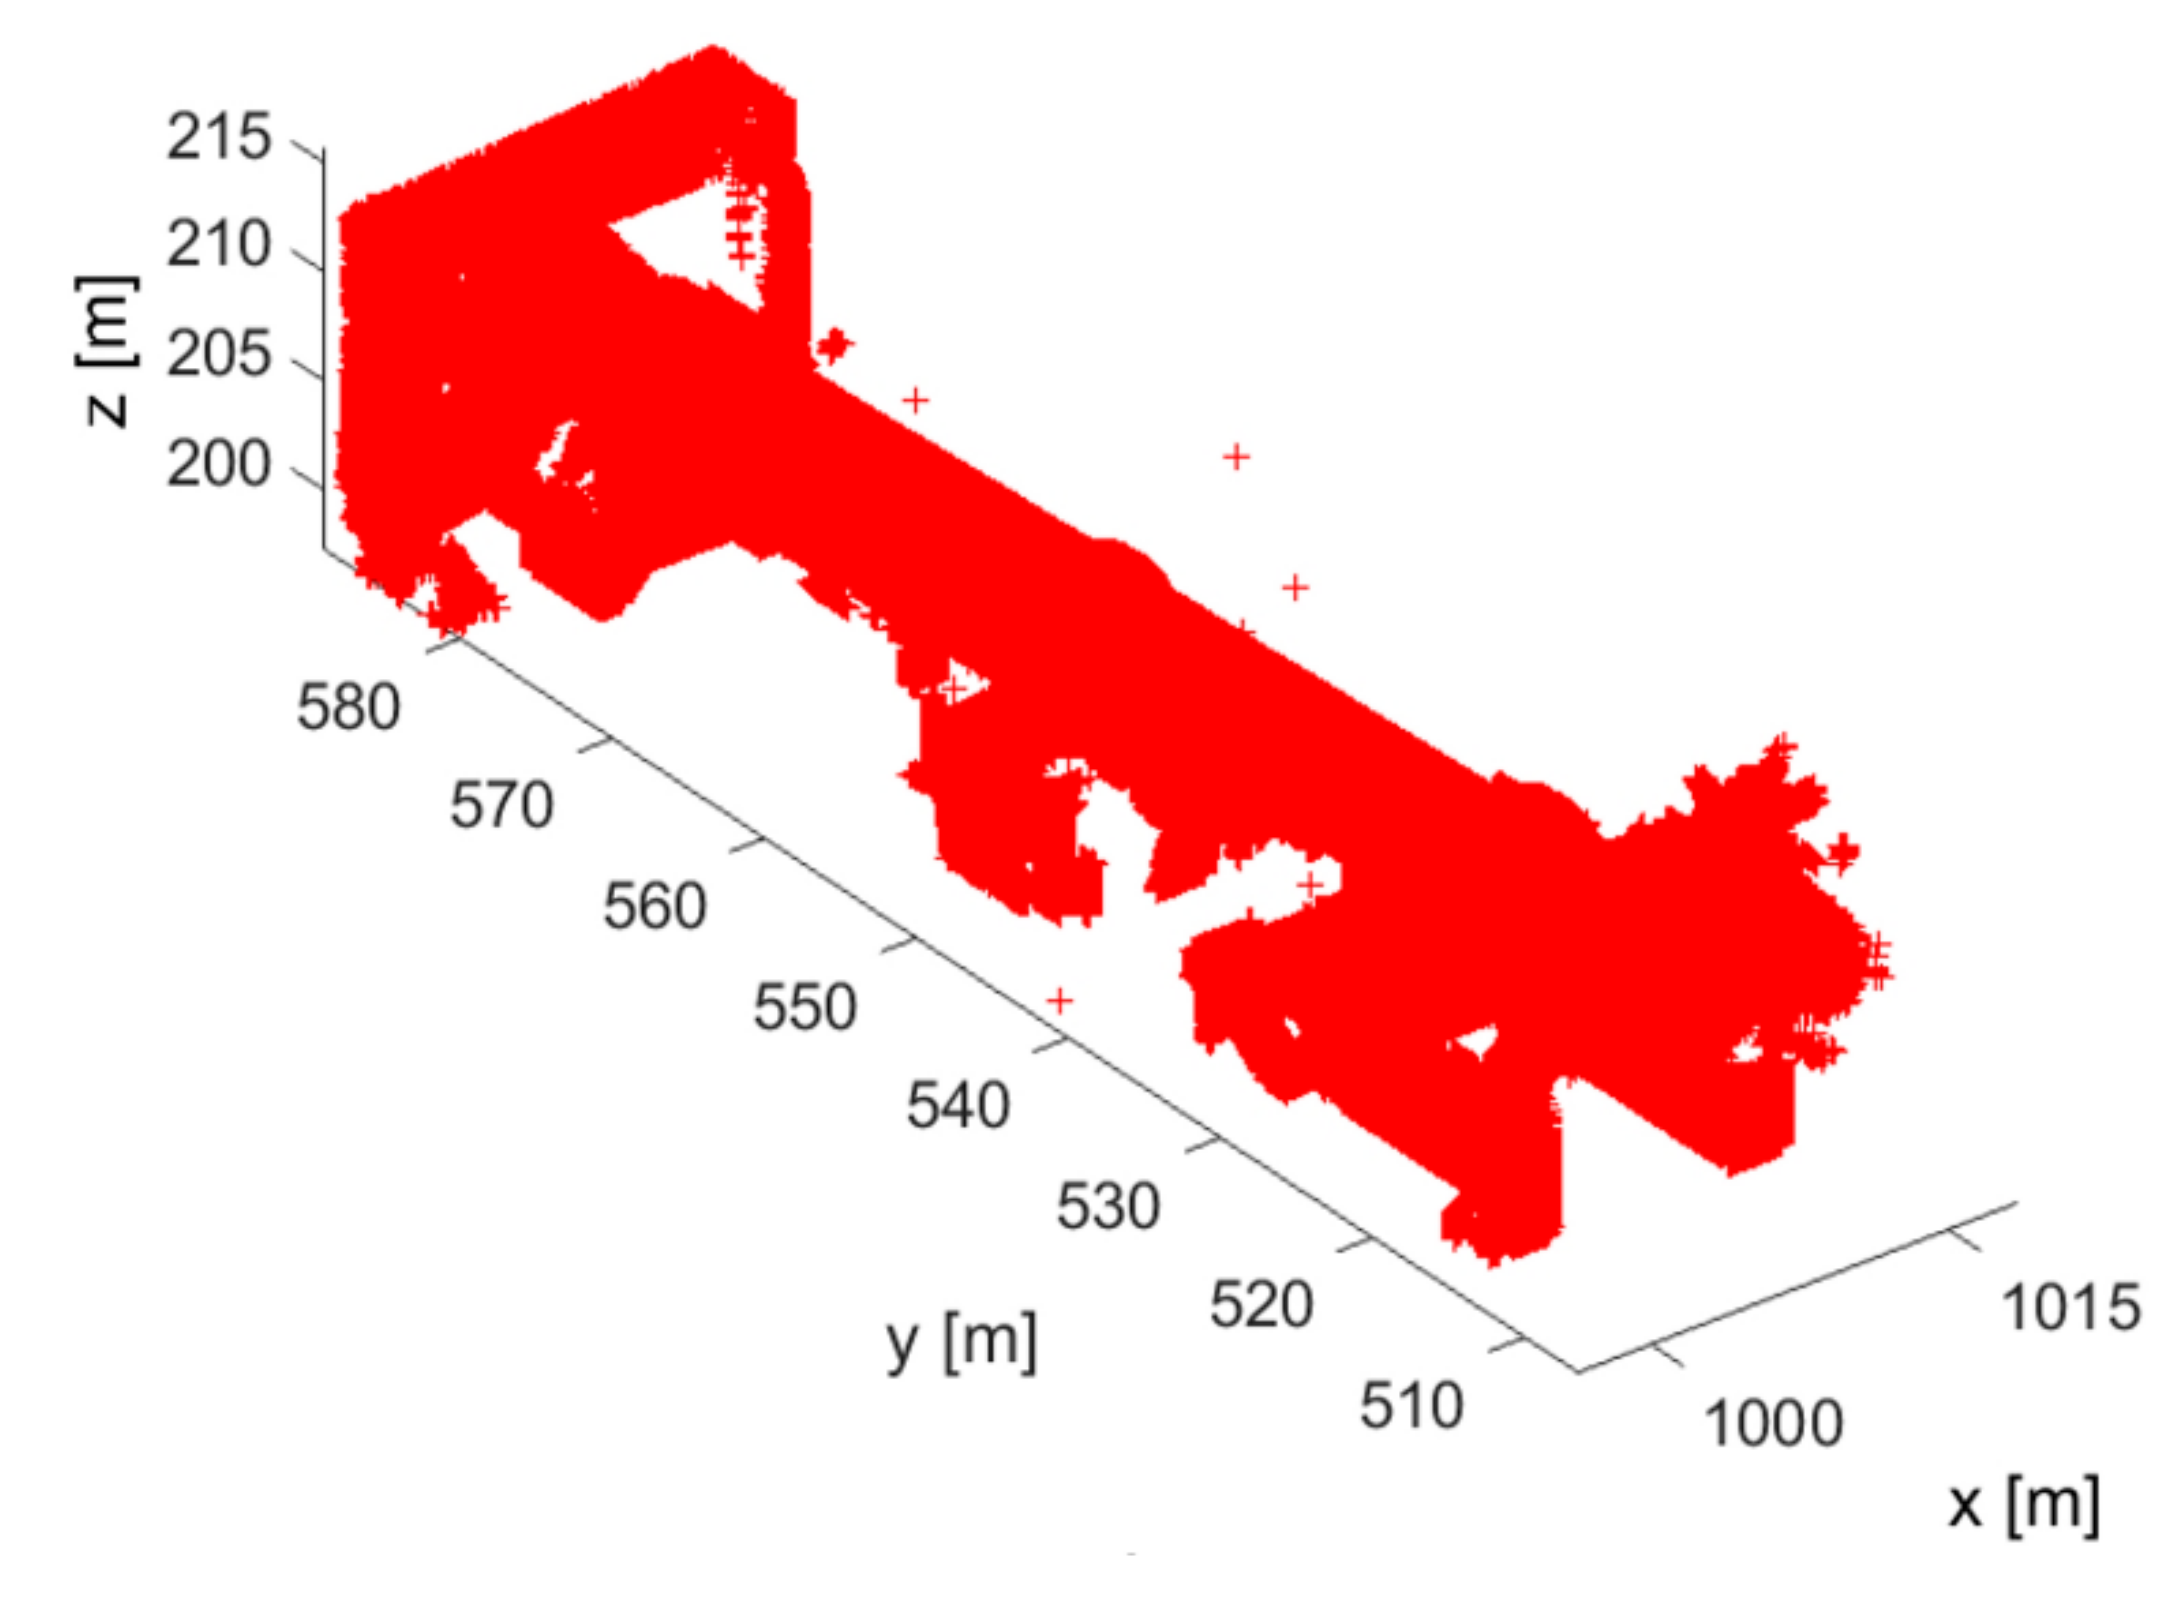
For every point in the point cloud, the distance to the real kiln axis was calculated. The whole raw point cloud contained about 20 million points, including unnecessary points on a distant object. The manually cut point cloud, which contained 6,422,263 points (Figure 11) on RK and its periphery, was processed by MatLab software. As a result, the perpendicular distances of each point to the kiln axis were obtained. The histogram function was repeatedly applied to count the number of points in each interval. The peaks of the function were traced and reviewed. Separate data files for the partial point clouds were created for every investigated peak.
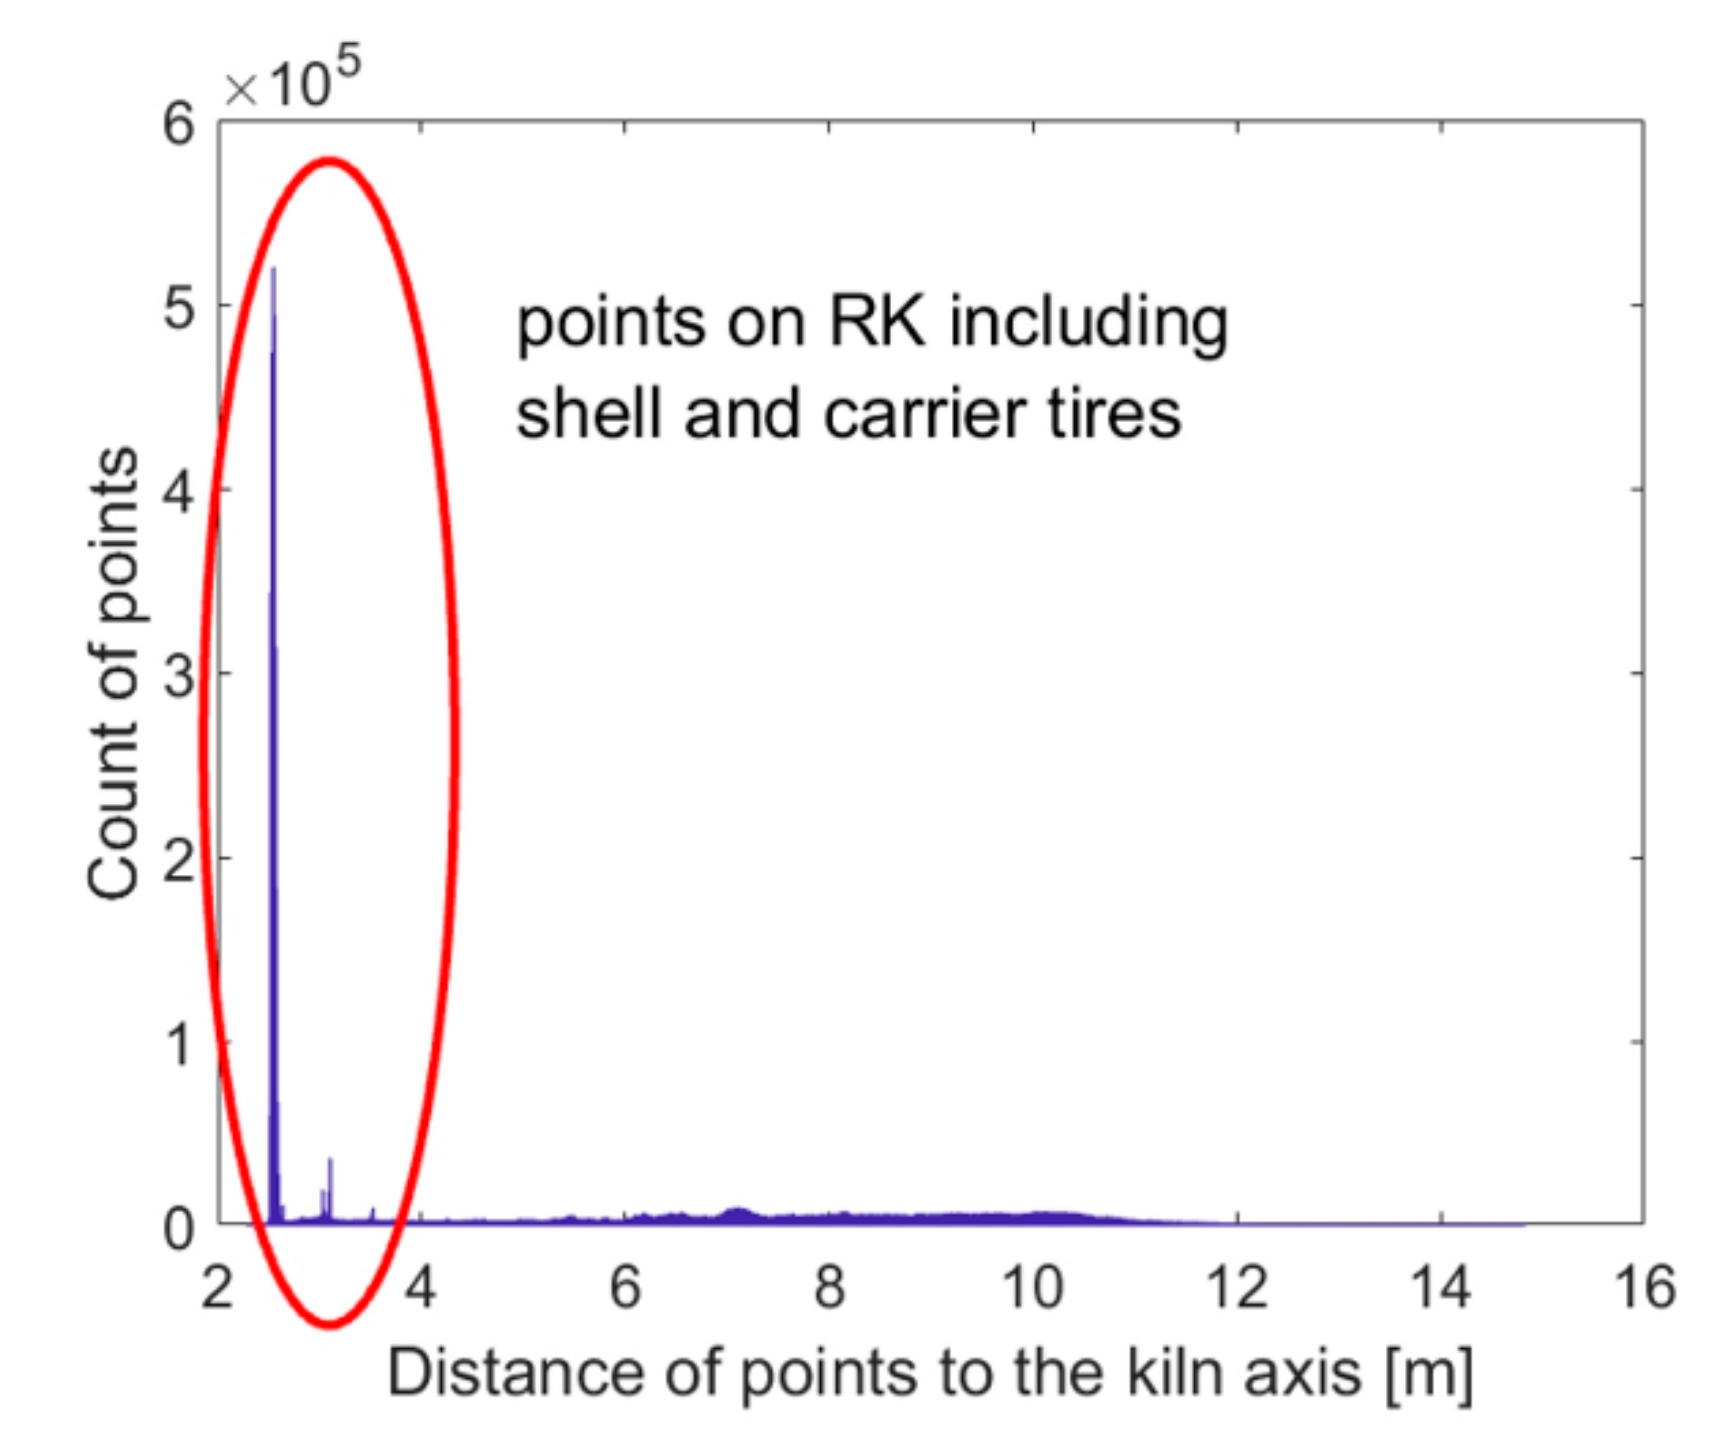
Using the calculated distances of points to the RK axis in the whole point cloud, the preliminary histogram was created. The range of the investigated distances is up to 16,000 mm, and the width of the intervals is 100 mm (Figure 12). Since the points on the shell and carrier tires are the closest to the kiln axis, in another part of the gradual selection of points, only the Point cloud with the distance from the kiln axis of up to 3200 mm was processed.
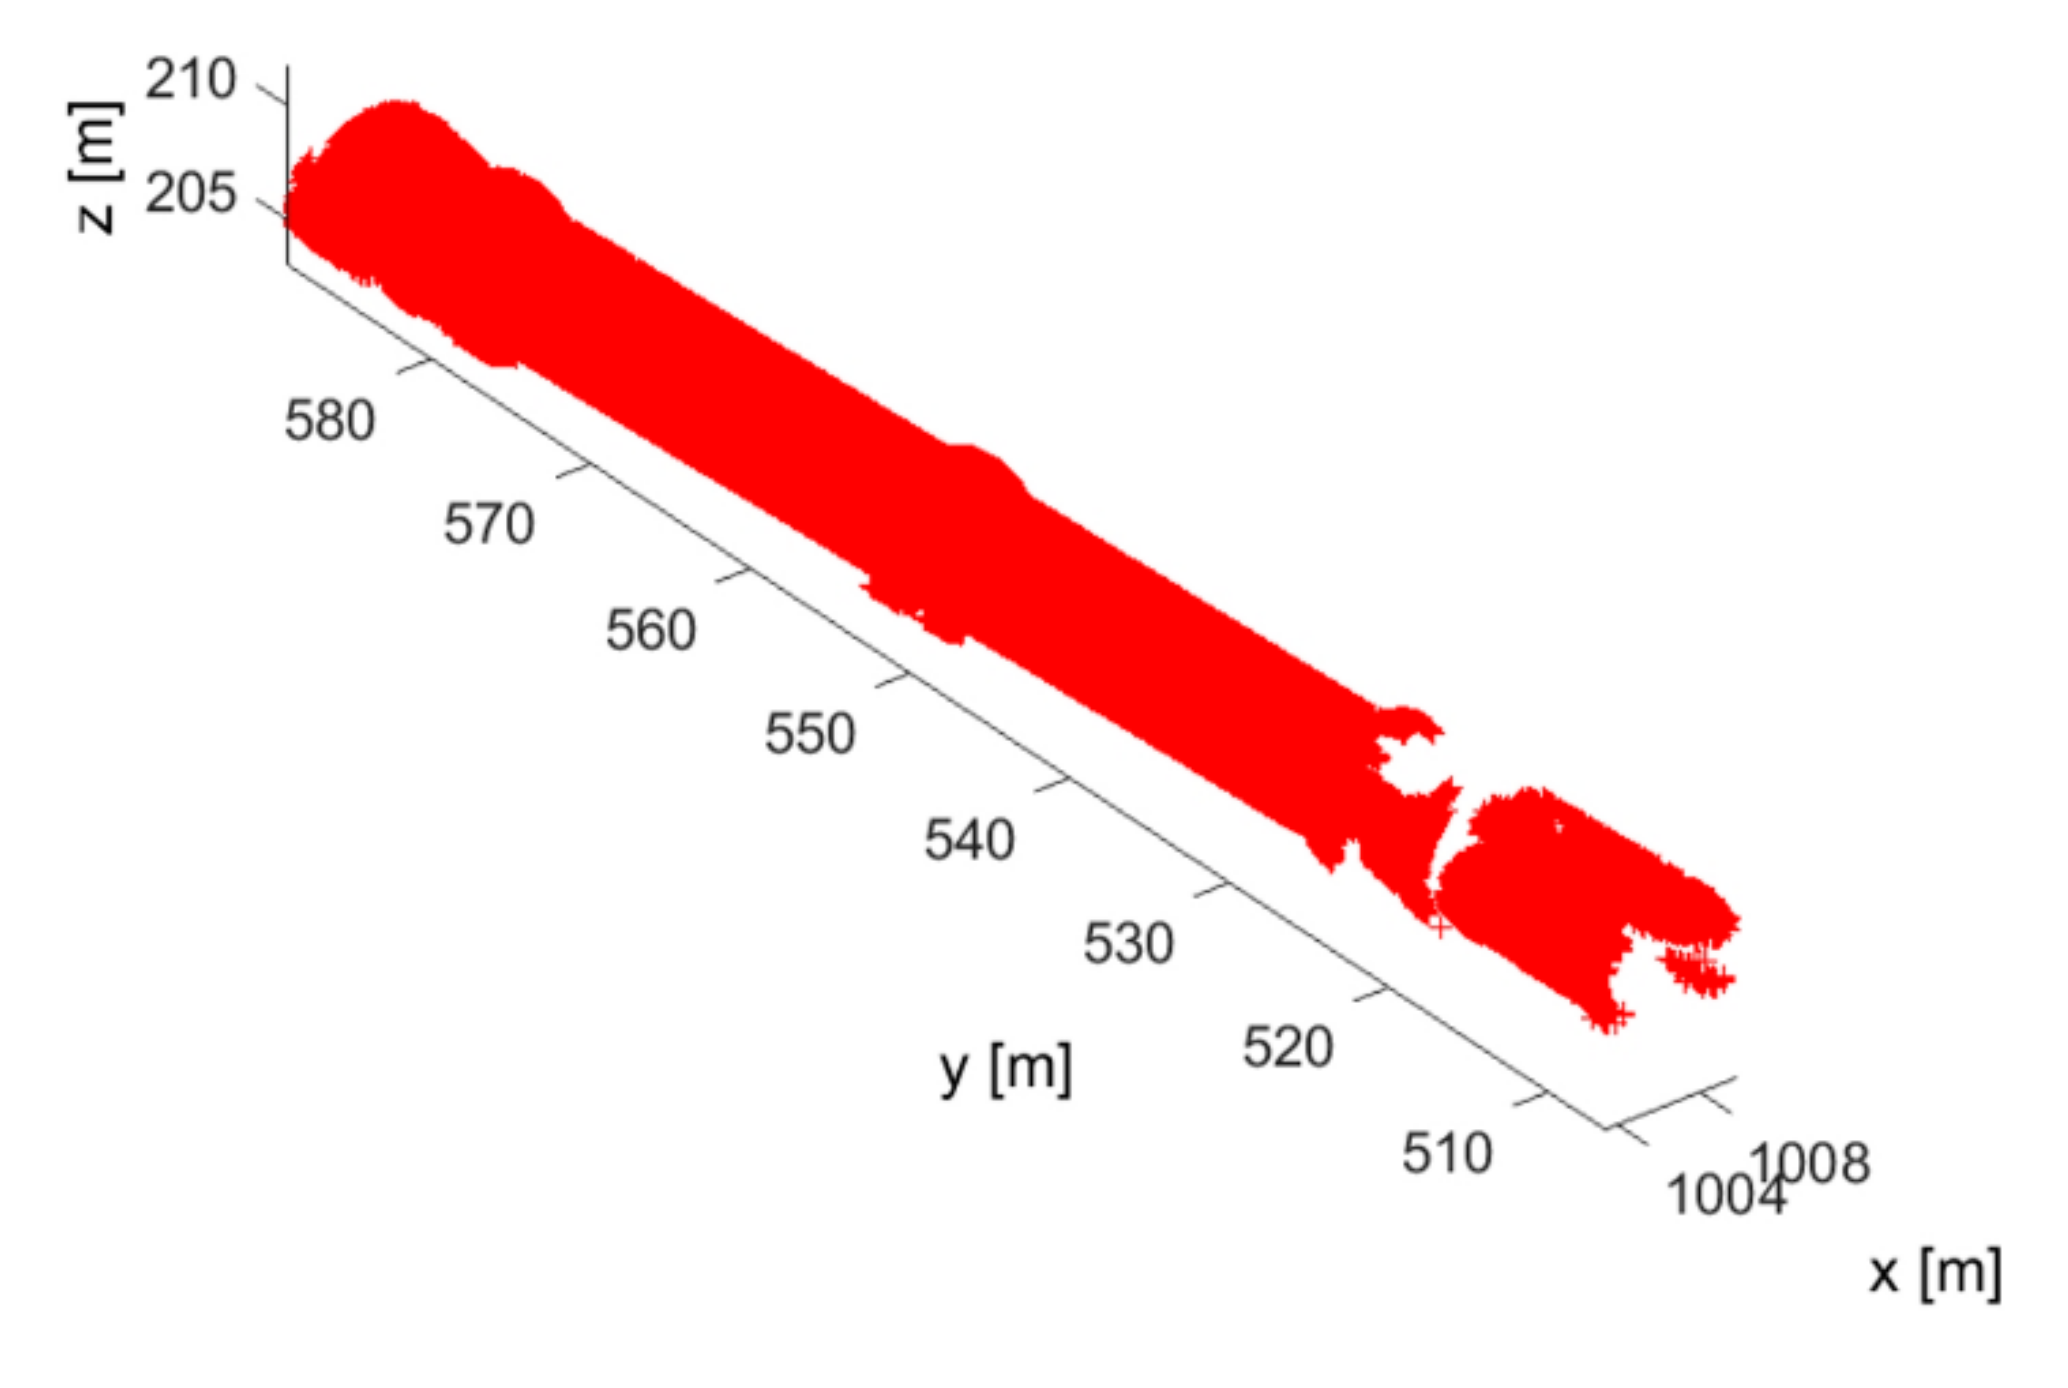
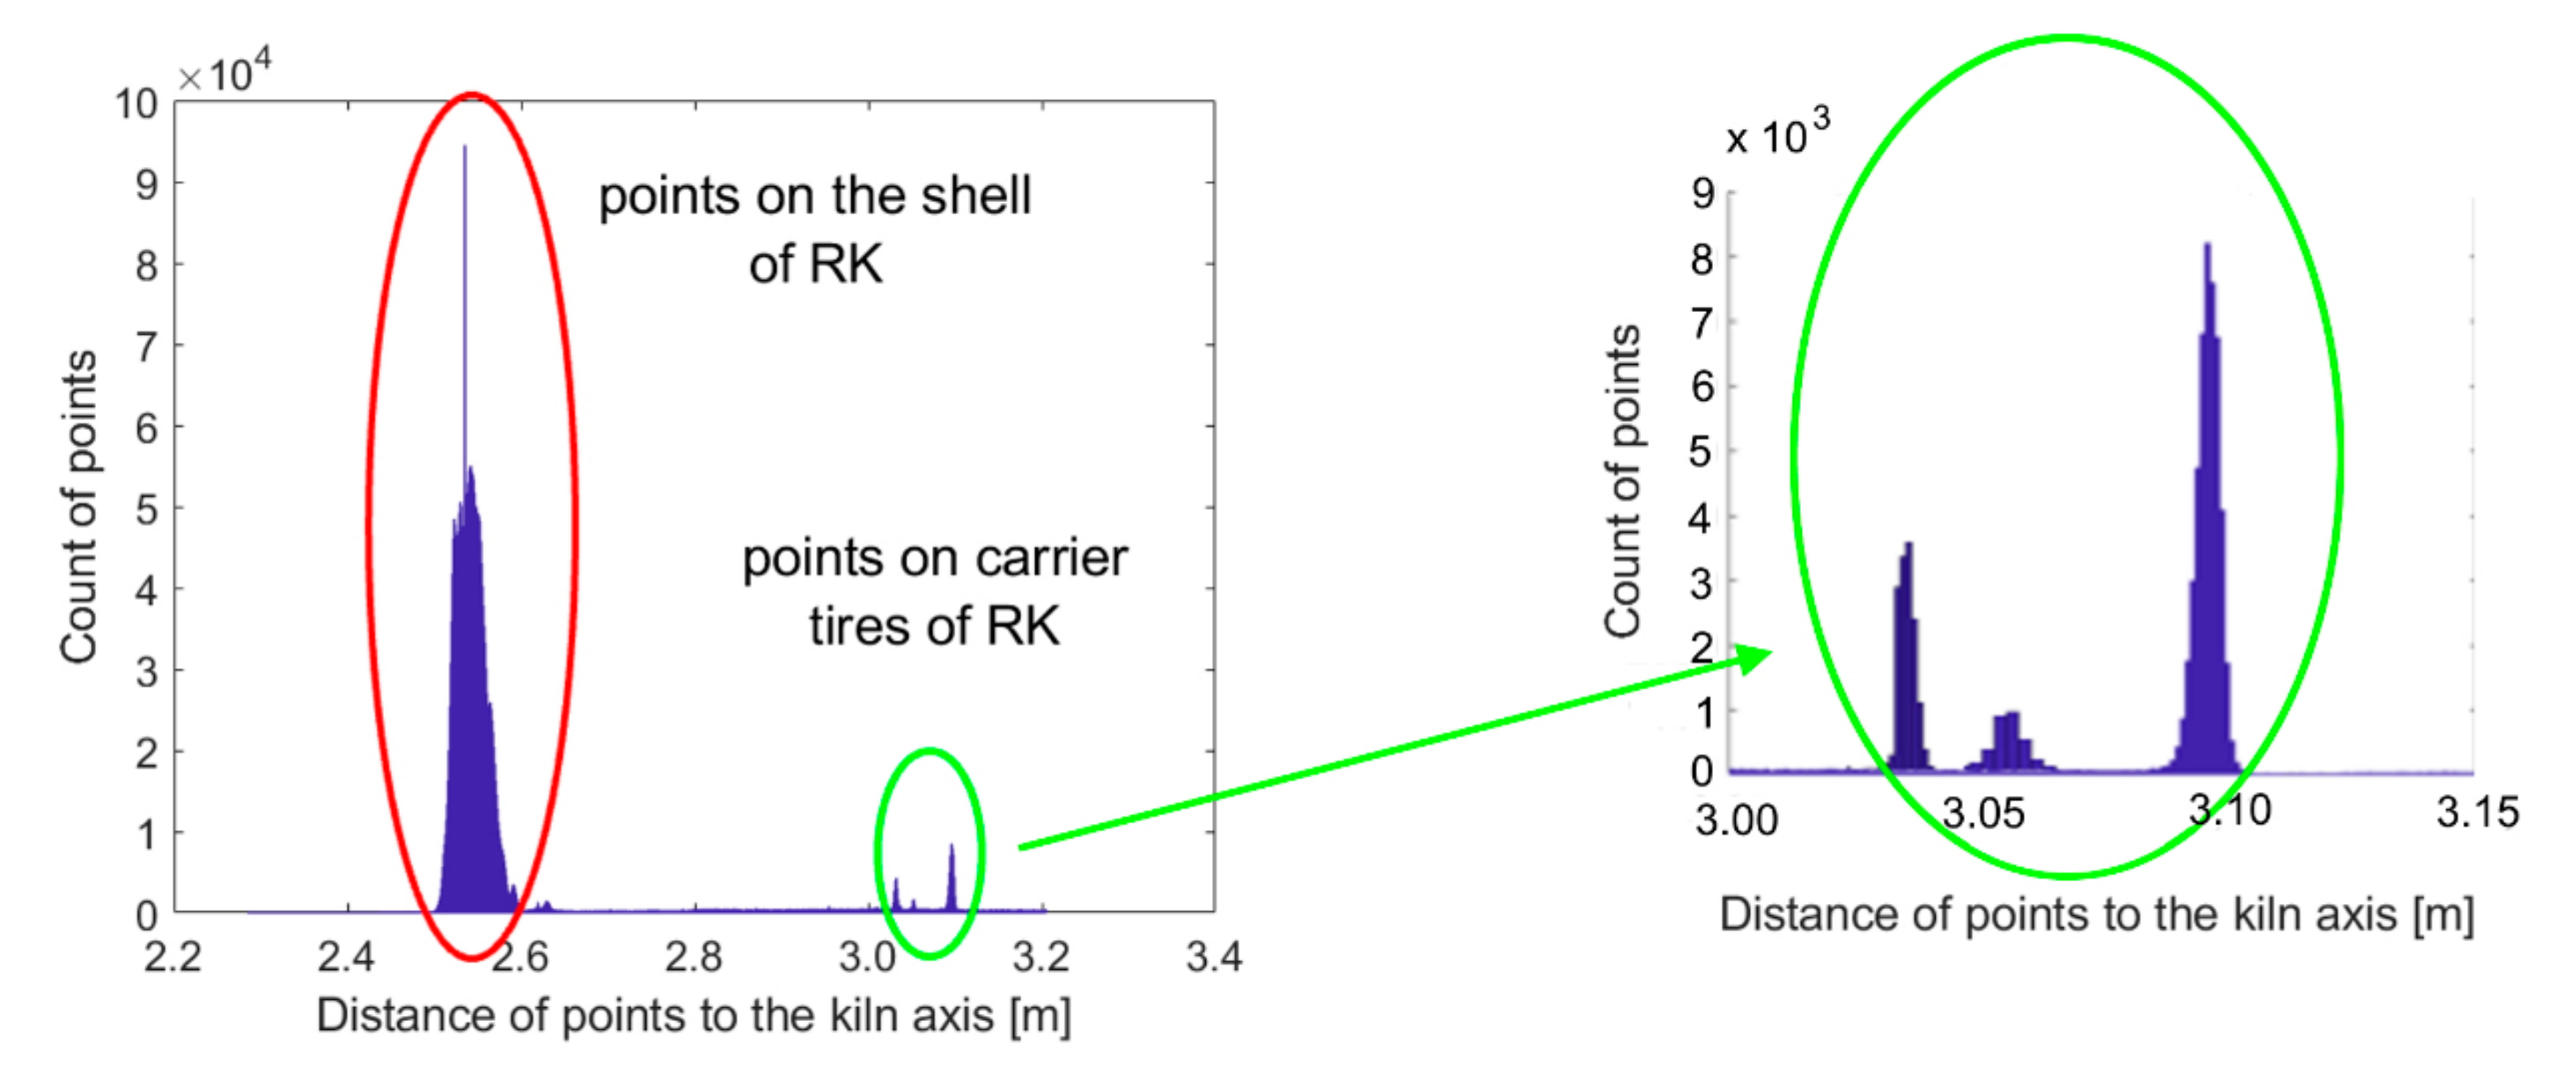
Figure 13 shows that the point cloud with approximately 3 million points where their distance from the rotary kiln axis is up to 3200 mm contains indeed points forming the shell of the rotary kiln and the tires. For this point cloud, the following histogram of the calculated radiuses with a width of the interval of 1 mm was created (Figure 14). The peaks of this graph show two significant areas. The first contains points on the shell; the second contains points on the three tires of the RK.

4. Results

4.1. Segmentation of the Point Cloud on Carrier Tires

From the point cloud shown in Figure 13, based on the histogram of radius values in Figure 14, the separated files of the points representing the tire A, tire B, tire C, and the rotary kiln shell were created. The single tires’ radiuses were determined as a weighted average of the three most frequently occurring calculated values in the interval ± 1 mm around the radius’s modus value in the partial point cloud. The aim of this procedure was the most precise selection of the points for the best fit of the embedded cylinder and the best longitudinal axis of the RK investigation. Figure 15, Figure 16 and Figure 17 shows the selection of the points in the point clouds on the carrier tires.
Afterward, the partial point cloud was created by MatLab® software, and it was further processed by Trimble Realworks® software. Cylinders were fitted through the partial point clouds. Their main geometric parameters were derived and compared in Table 1 with parameters obtained by the manual segmentation method described in Chapter 3.1, and the percentage of remaining points after the segmentation from the initial point cloud.
The centers of the fitted tire cylinders define the longitudinal axis of the RK. The conformity of the fitted cylinder center’s derivation coordinates between the results of manual point cloud selection and an analytical solution is shown in Table 2.
The differences between the Y coordinate of each selection method indicate the tire’s position along the RK’s longitudinal axis. Considering the shape of the measurement object, the transverse (X-axis) values, and vertical deviations (Z-axis) from the nominal longitudinal axis are essential. Table 2 shows the conformity of the centers of carrier tires in these directions, and therefore, the positional conformity of the RK’s longitudinal axis derived from the partial point clouds. The value of the longitudinal slope of the kiln is 3.526%.

4.2. Effect of Cloud Point Density on Center Coordinates and Diameter of the Tires

Additionally, to this study’s main goals, an analysis of the influence of gradually decreasing density (number) of points on the carrier tires on their centers’ derivation was performed. This is important for the correct statement about the geometry of the longitudinal axis. Trimble Realworks® software was used for spatial sampling of the point clouds obtained by the procedure described in Chapter 4.1. Separate objects (point‑groups) were created for every reduced point cloud. For each object, a cylindrical shape was fitted. No additional cylinder parameters, for example, position or radius, were specified. The distances between points and the number of points selected are given in Table 3.
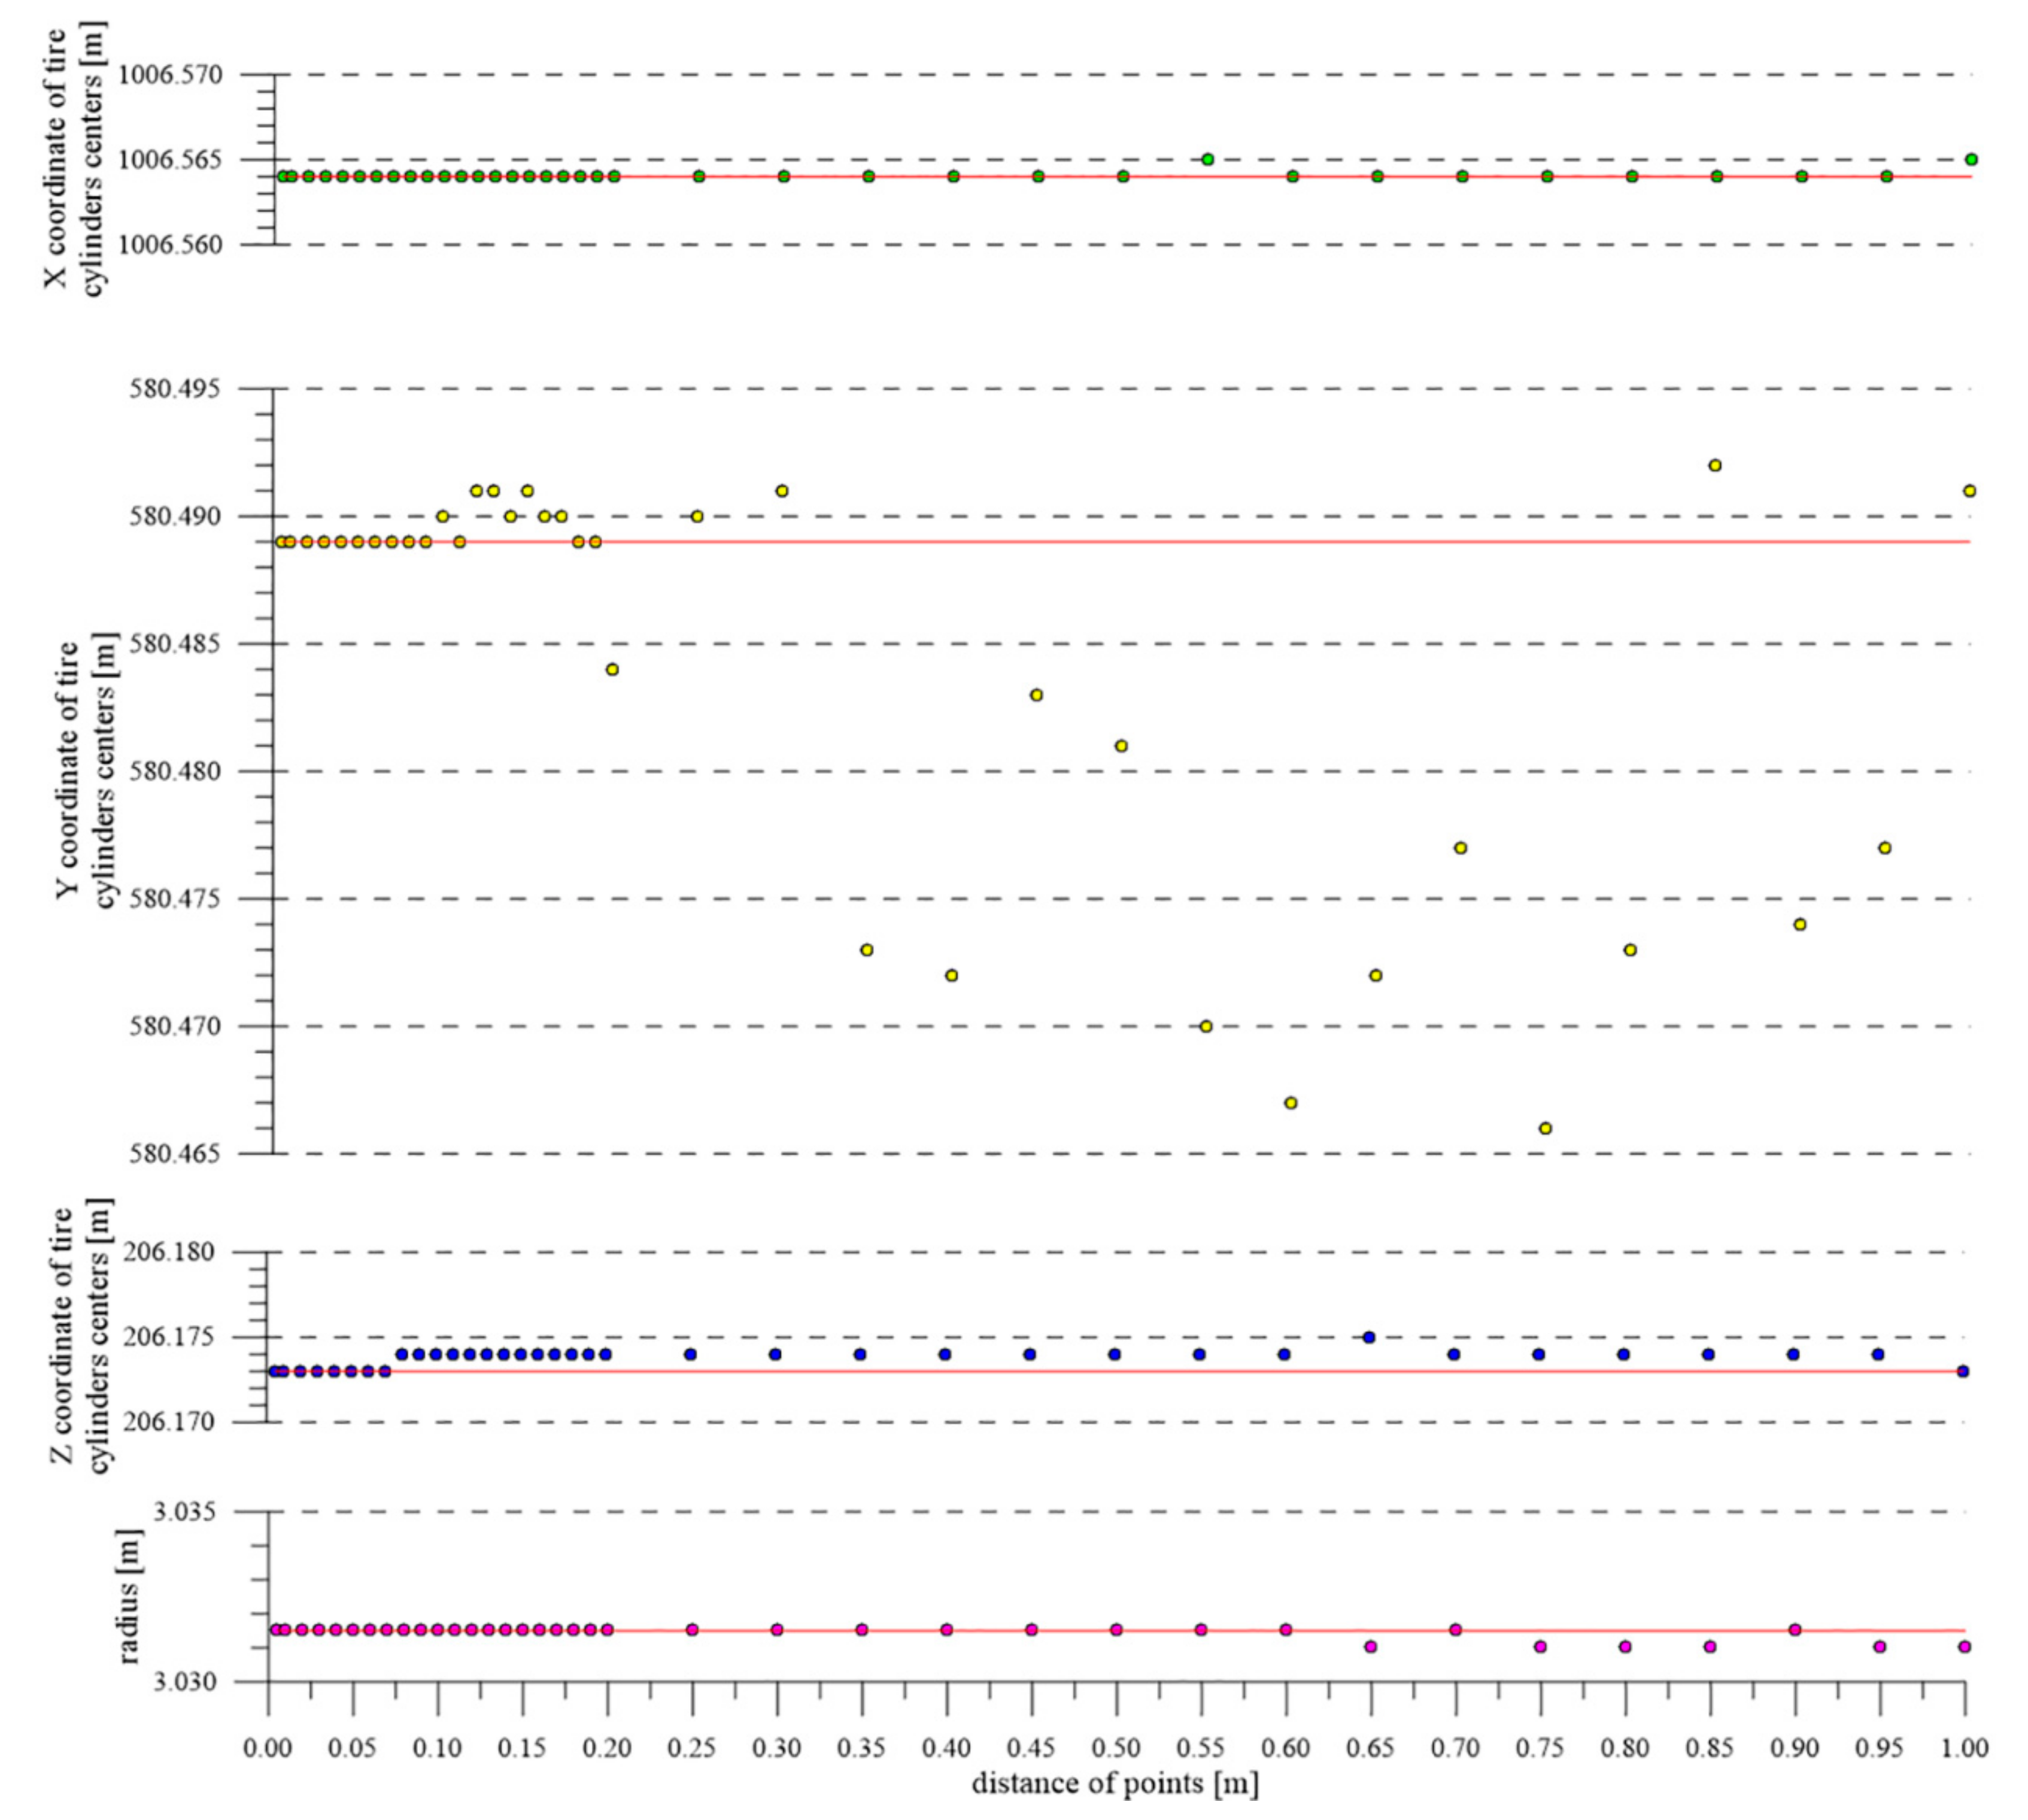
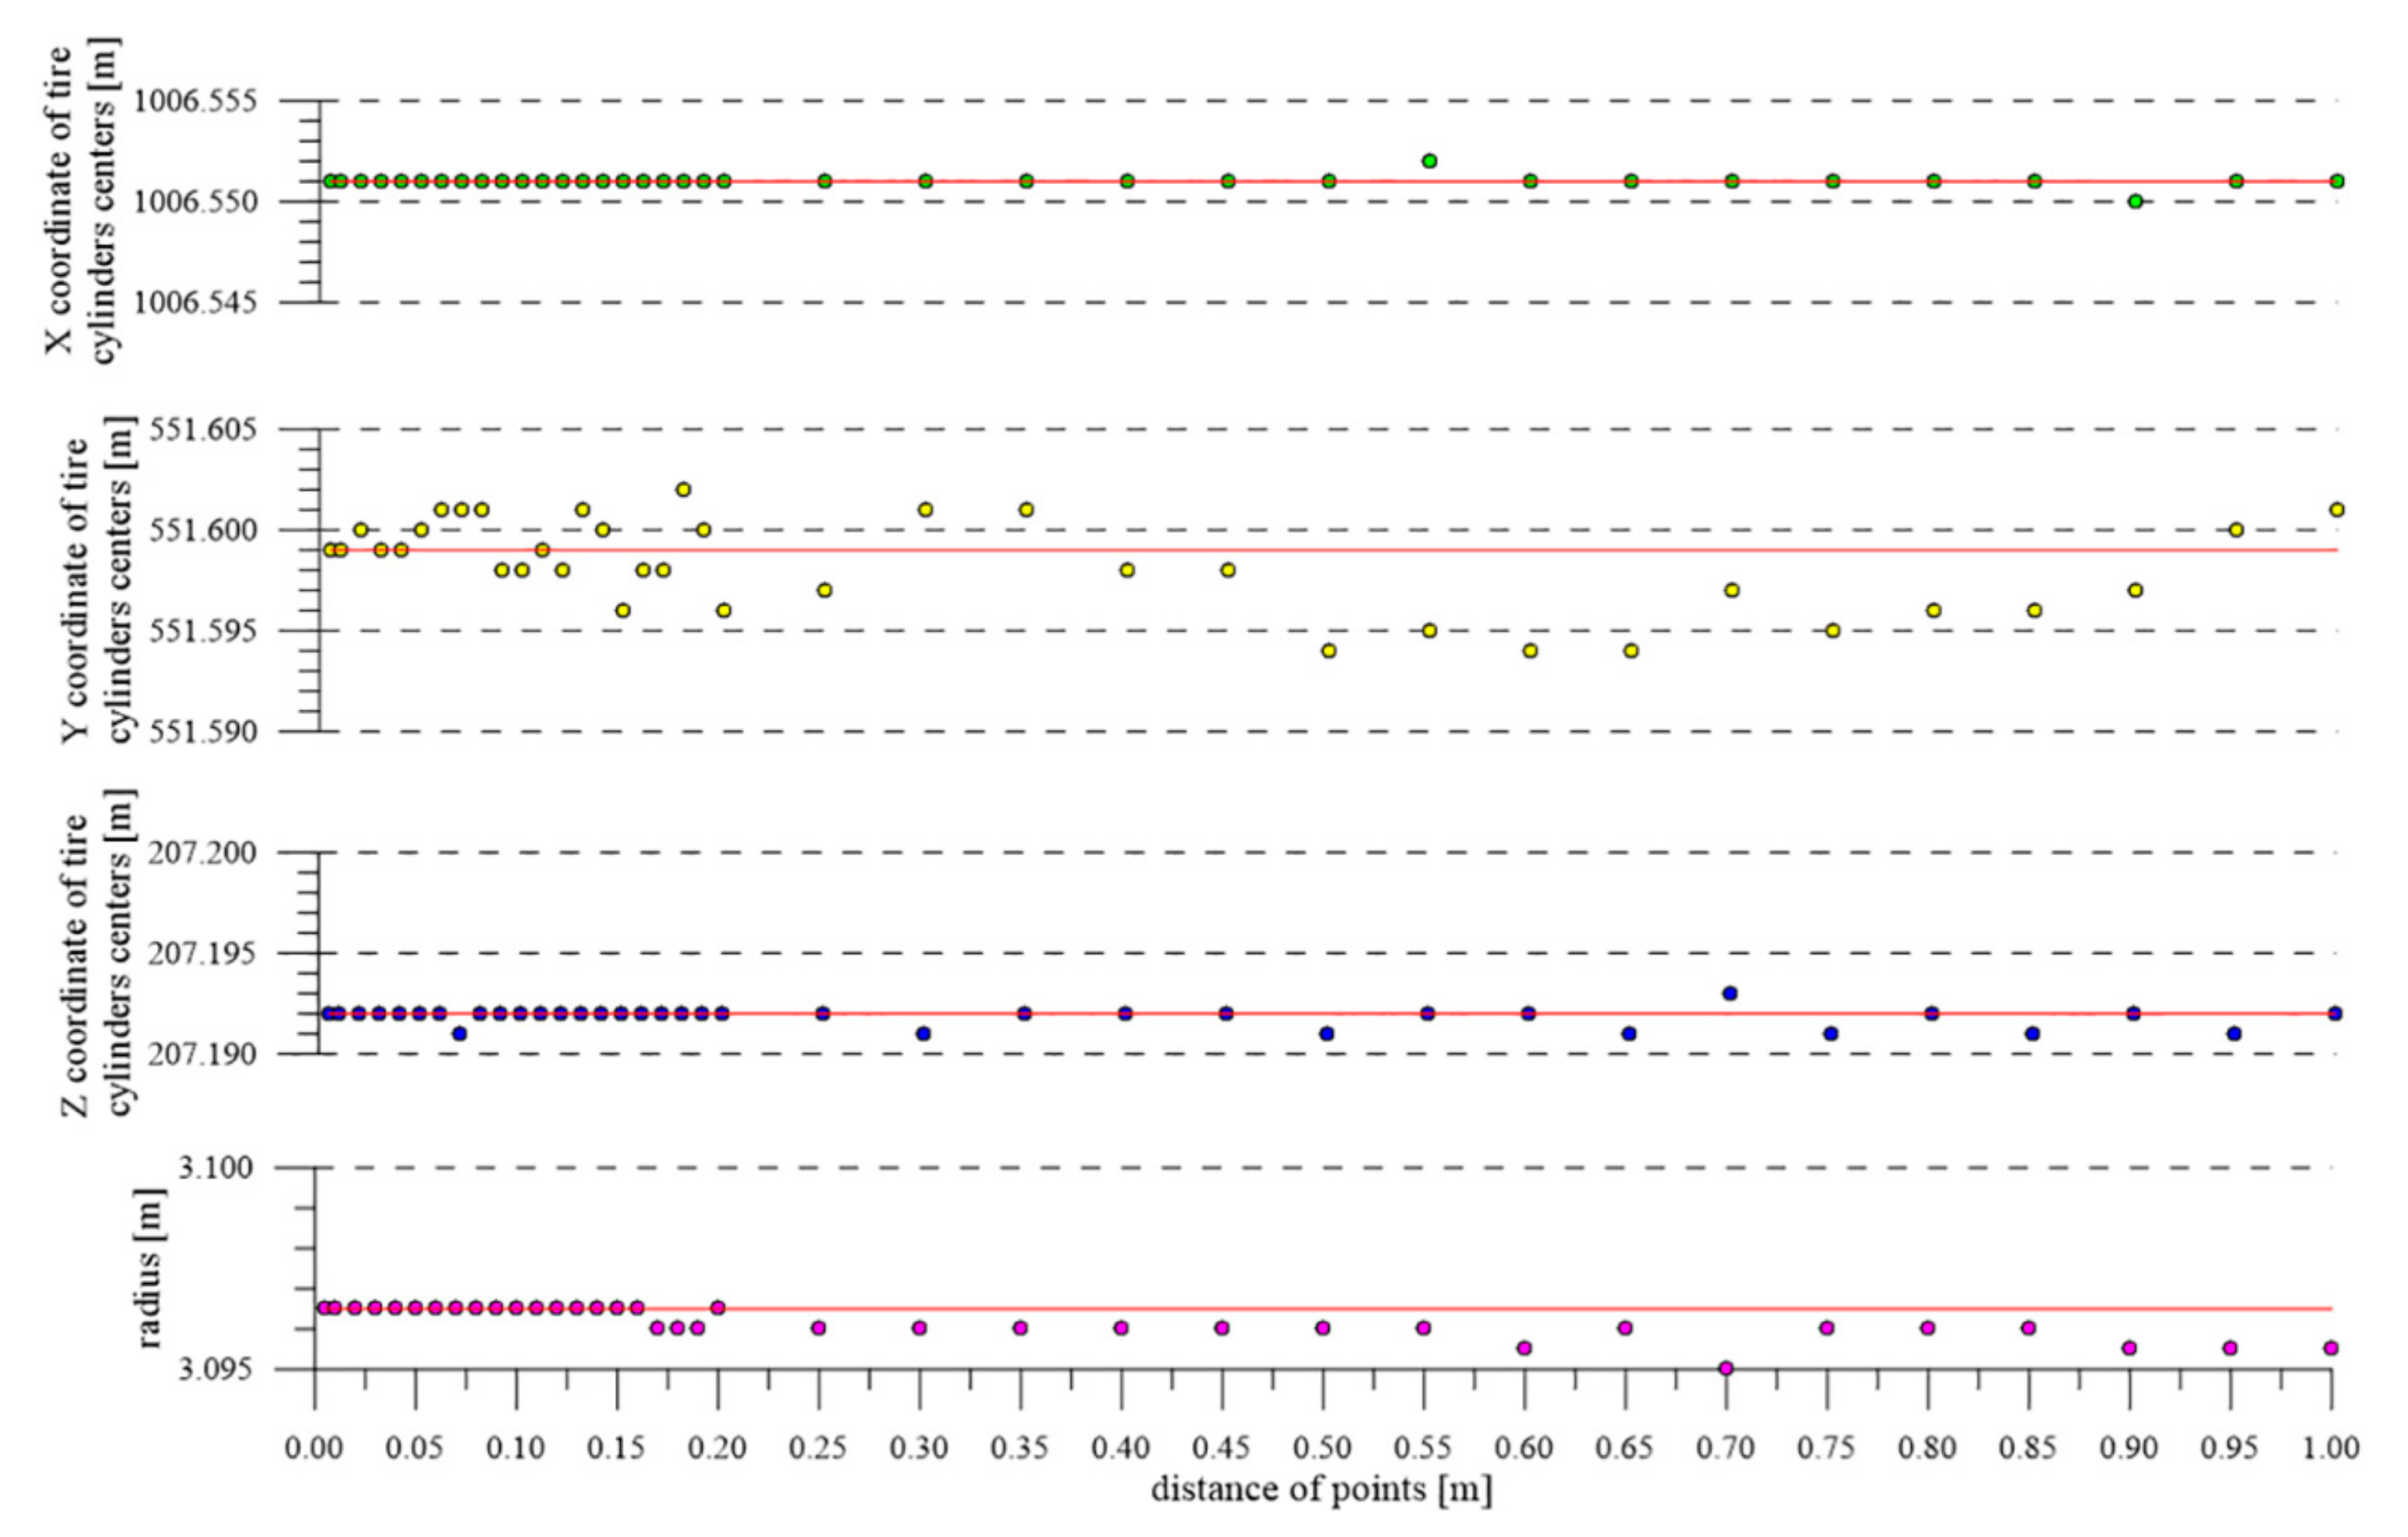
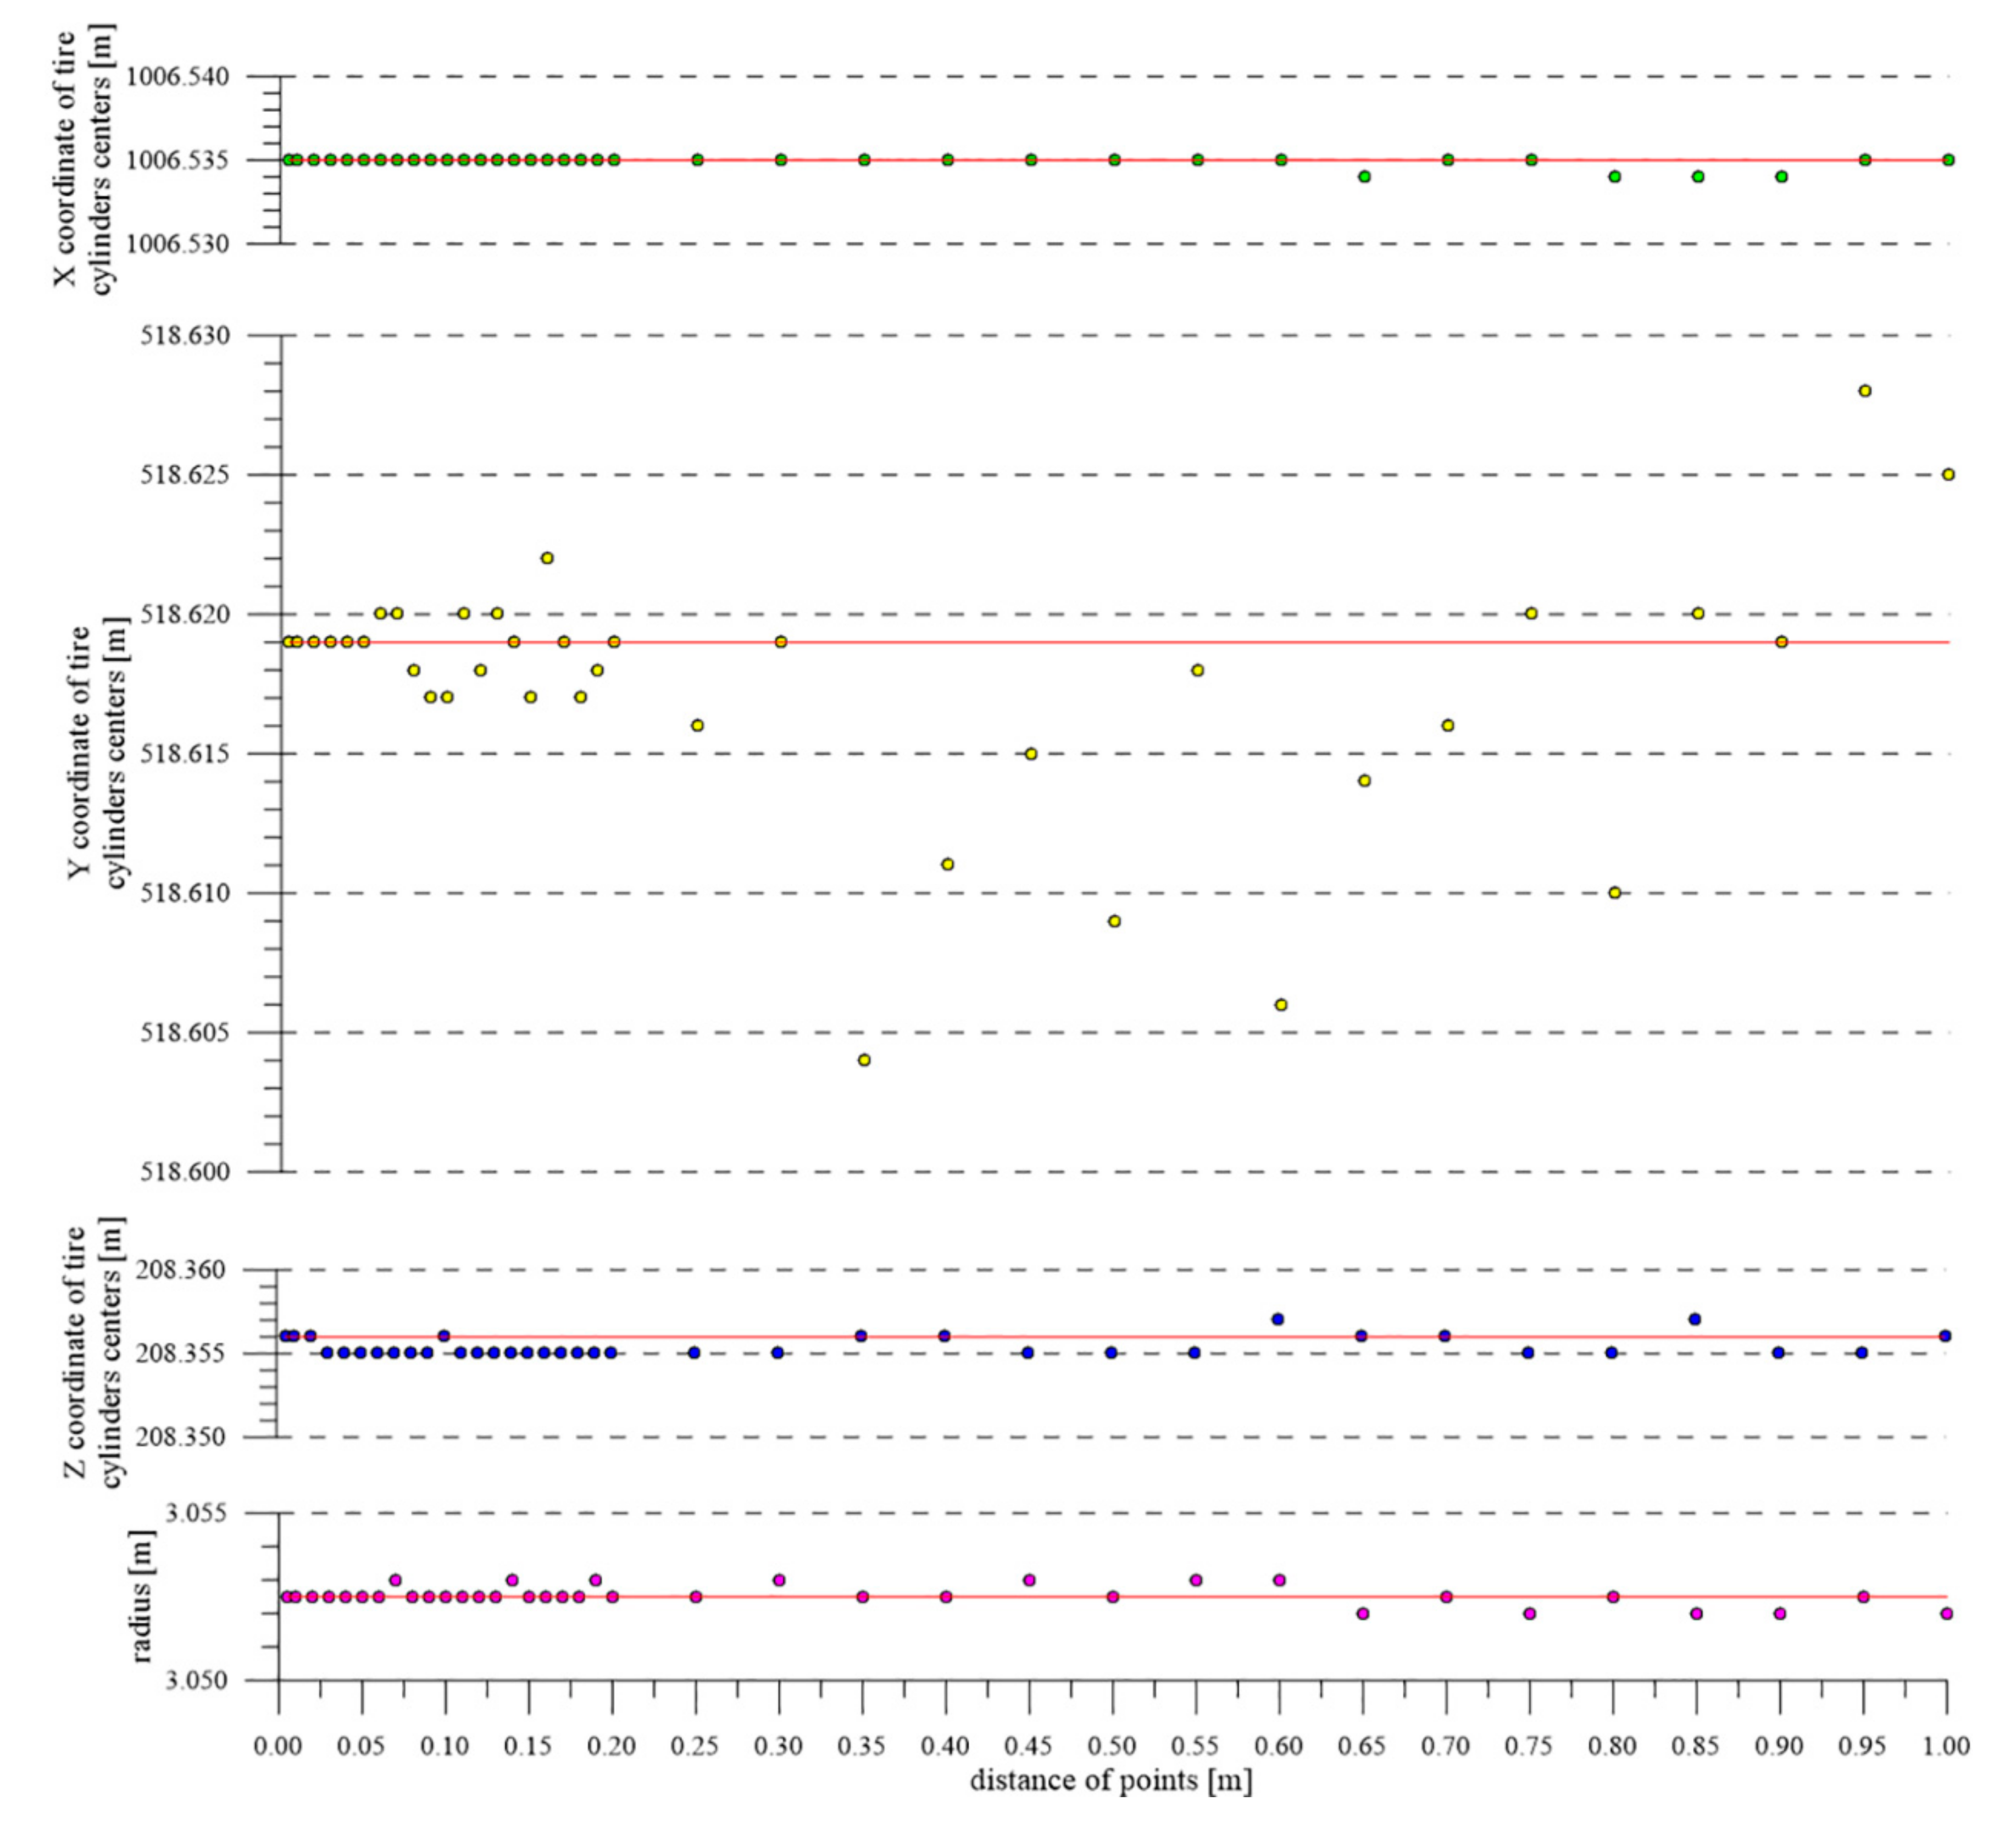
On the graphs (Figure 18, Figure 19 and Figure 20), the center’s coordinates and the diameter of the tires A, B, and C, which are determined by the gradual fitting of the selected point cloud in the Trimble Realworks® software environment, are separately plotted.
The horizontal axis of the graph represents the selected distances between points in the cloud. The vertical axis shows the coordinates of the center and the diameter of each tire. In the direction of the X-axis (transversal direction), there are differences up to +/− 1 mm on all rings in the whole range of investigated values. This corresponds to an ideal circular shape of the ring, which we expected. The same applies to the values of Z-axis and the values of the radius. The values of X and Z-axes are essential for the determination of deformations, rectification values, and, therefore, correct operation of the kiln.
The filtration of points for the previous analysis was done in Trimble RealWorks software using the function Spatial Sampling—Random method. The points are then selected without taking into account their stationing. Therefore, the Y-axis coordinates of the ring centers have a scatter of up to 20 mm from the value of about 100 mm of the mutual distance of the points. The Y coordinate is only informative—it changes during the kiln operation; also, the differences in coordinates may arise due to the random selection of point throughout the ring width.
The graph shows that the decreasing density of the points has a negligible effect on the center’s resulting coordinates in the transverse direction or diameter of the tire. The red line shows the value of the center or radius of the tire, determined as a weighted average of the respective values.

4.3. Segmentation of the Point Cloud on the Shell of Rotary Kiln

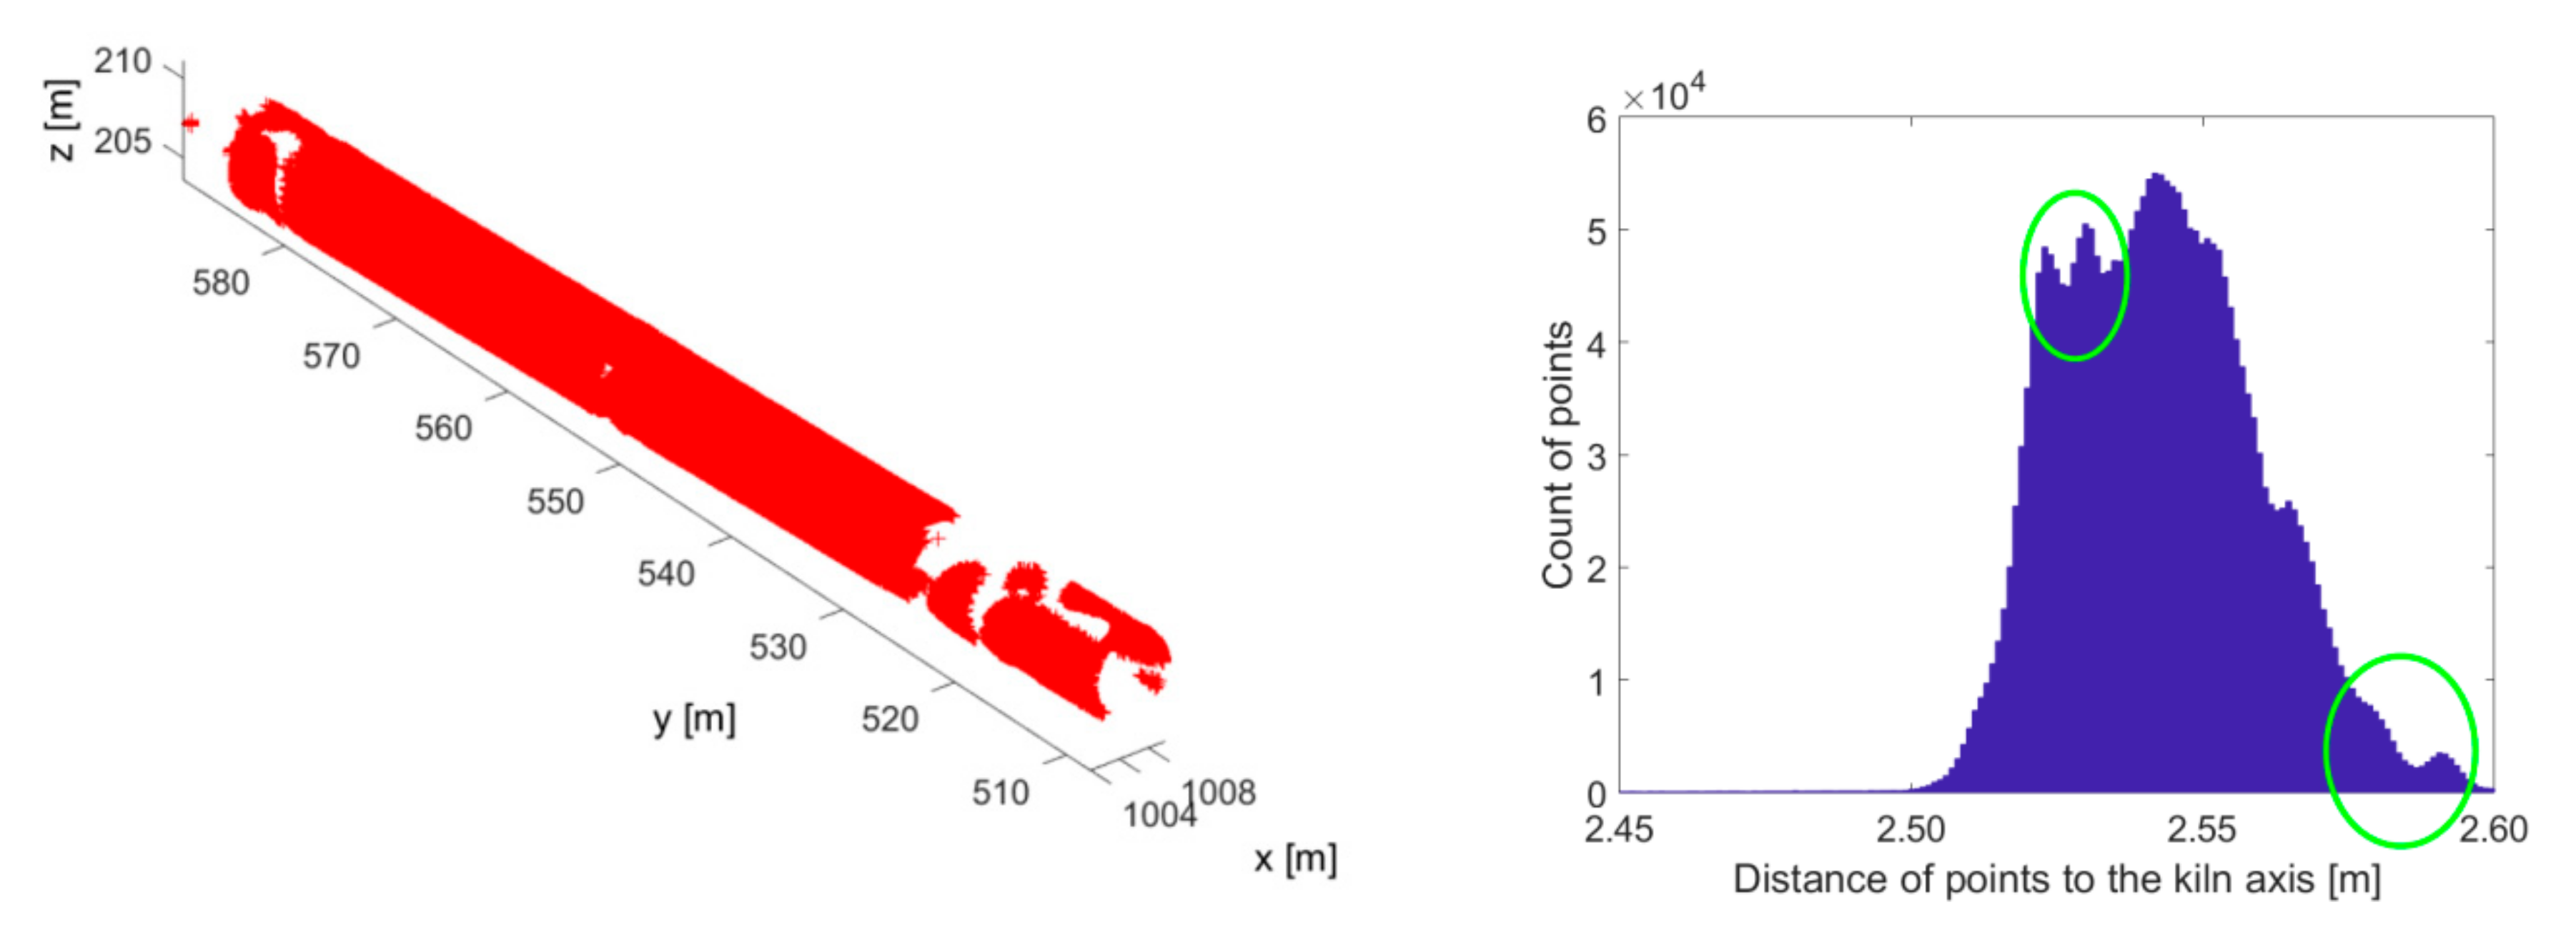
From the point cloud in Figure 13, points from the rotary kiln shell were selected based on the calculation of the distance of points from the axis of the rotary kiln. When evaluating the histogram in Figure 14, a range from 2500 mm to 2600 mm for the point’s distance from the kiln’s real longitudinal axis was selected. These points were stored in a separate point cloud file. A graphical representation of this point cloud and the frequency of points in intervals is in Figure 21.
The histogram of radiuses in Figure 21 with a 1 mm width of the interval shows significant areas corresponding to the graph’s peaks. Investigation of the area circled in Figure 21 was performed by a selection of the points in the range of the radius of 2575 mm to 2600 mm in a separate file. The assessment of this selection was executed by Trimble Realworks® software.
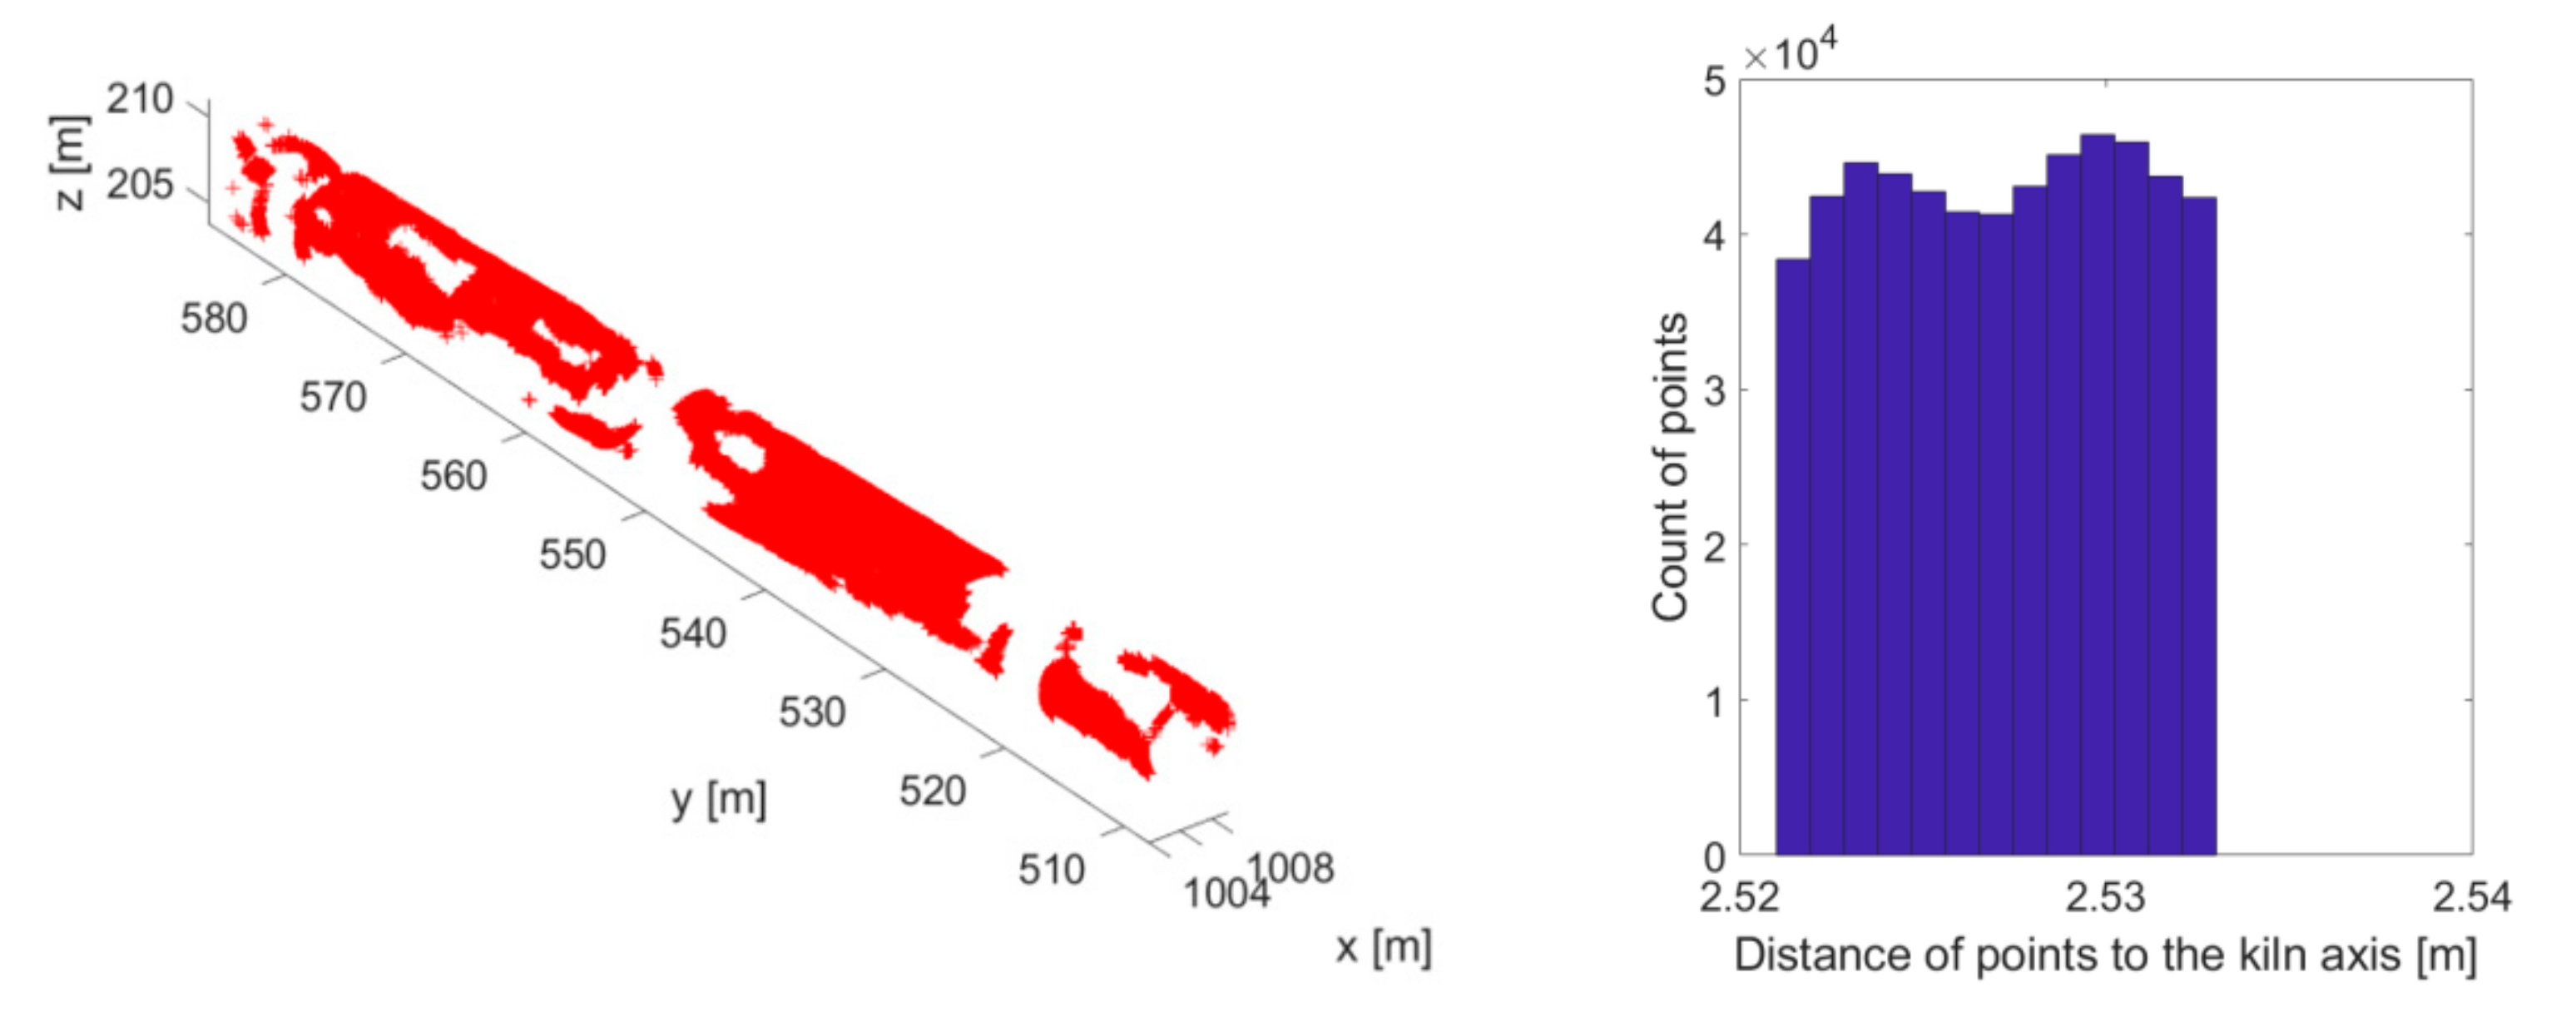
First selection—as a result, it was confirmed that these points are part of the shell of the RK (Figure 22), and they remain in the previous selection.
Second selection—as a result, it was identified that these are the carrier tires’ flanges, a cover of the gear tire, and the welded plates with stationing numbers of RK, which were removed as outliers (Figure 23).
The final point cloud shown in Figure 24 represents the actual shape of the shell of RK. Moreover, the histogram is shown in Figure 21 and Figure 24 highlights at least one more significant area circled in Figure 24. The assessment of this selection was carried out as in the previous case. As a result, it was confirmed that these points are part of the RK shell, and they remain in the previous selection. The circled points in Figure 24 also suggest the deformation of the shell of RK.

4.4. Rotary Kiln Shell Deformation Analysis

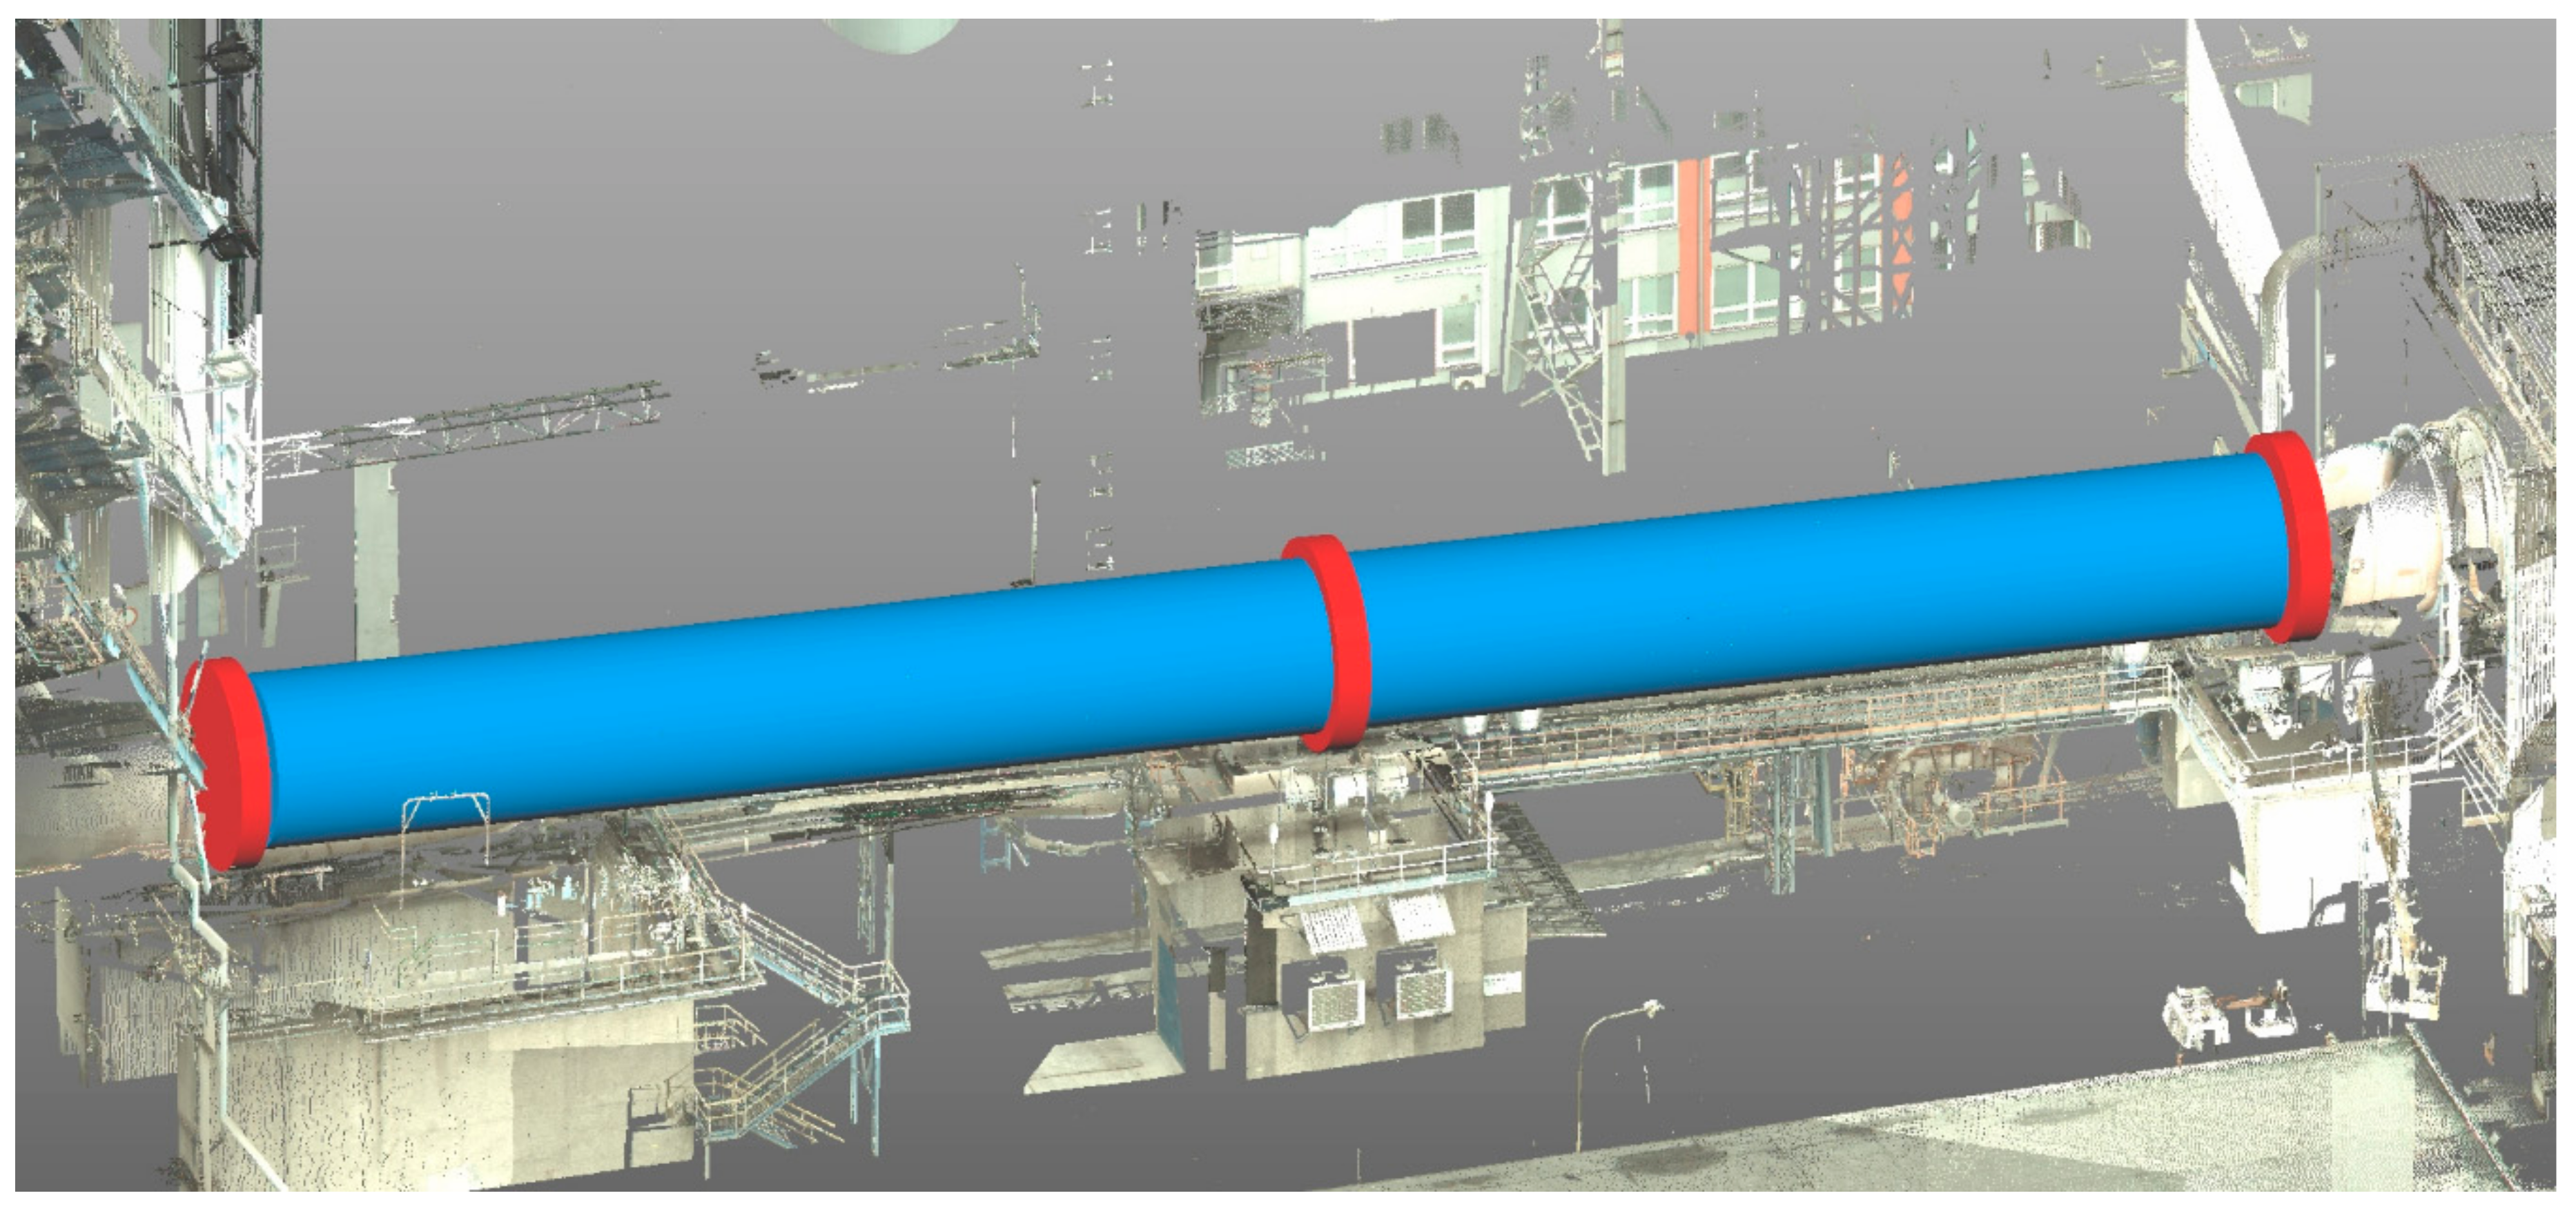
The characteristics of point clouds and nominal cylinder parameters (from manual segmentation [53]), and the proposed analytical solution, which were used for further processing, are given in Table 4. Nominal cylinder is displayed on Figure 25.
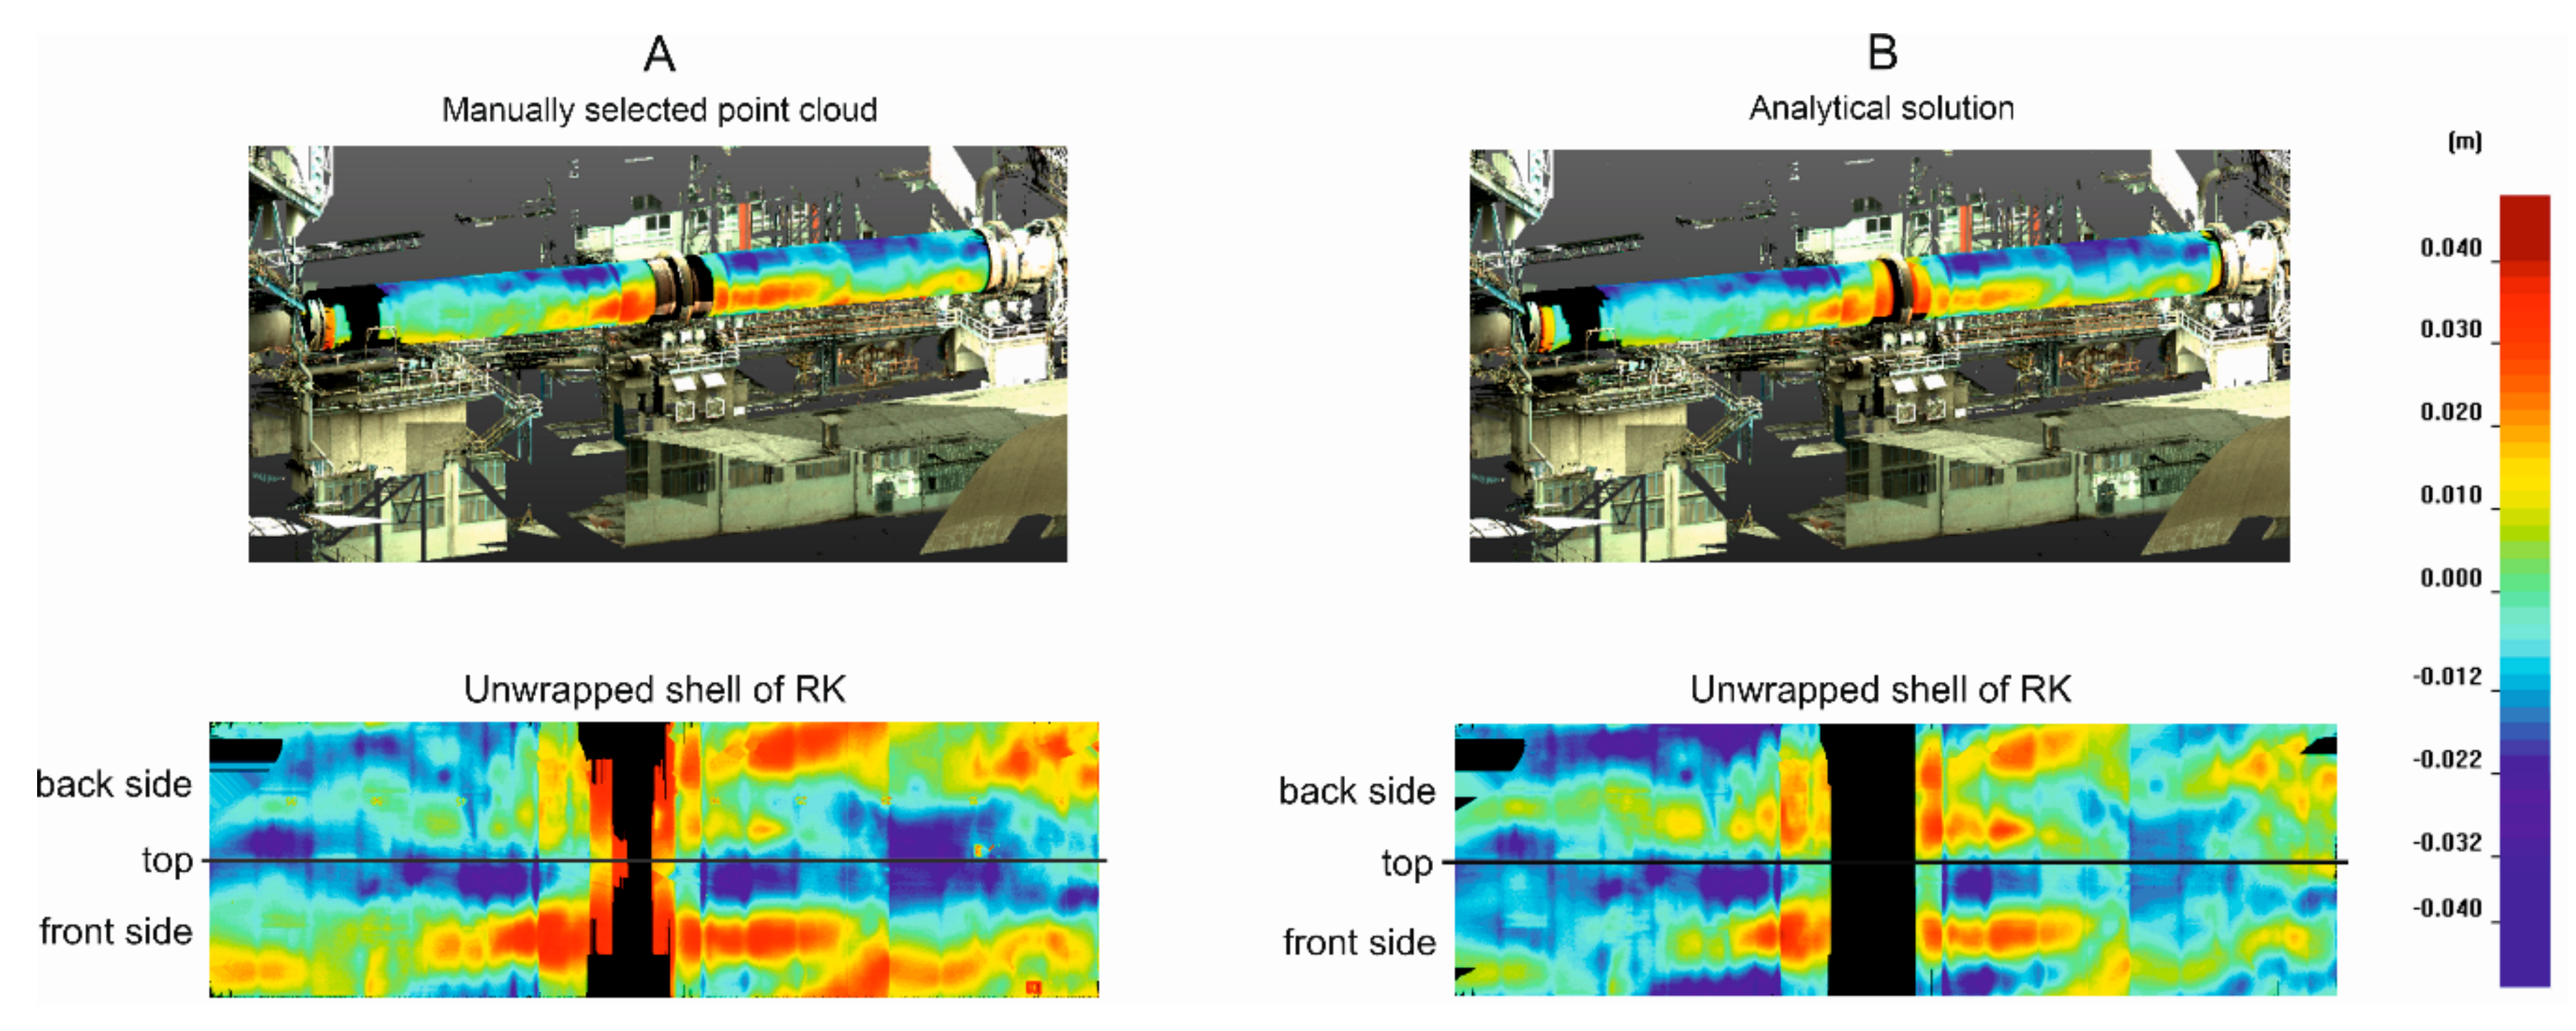
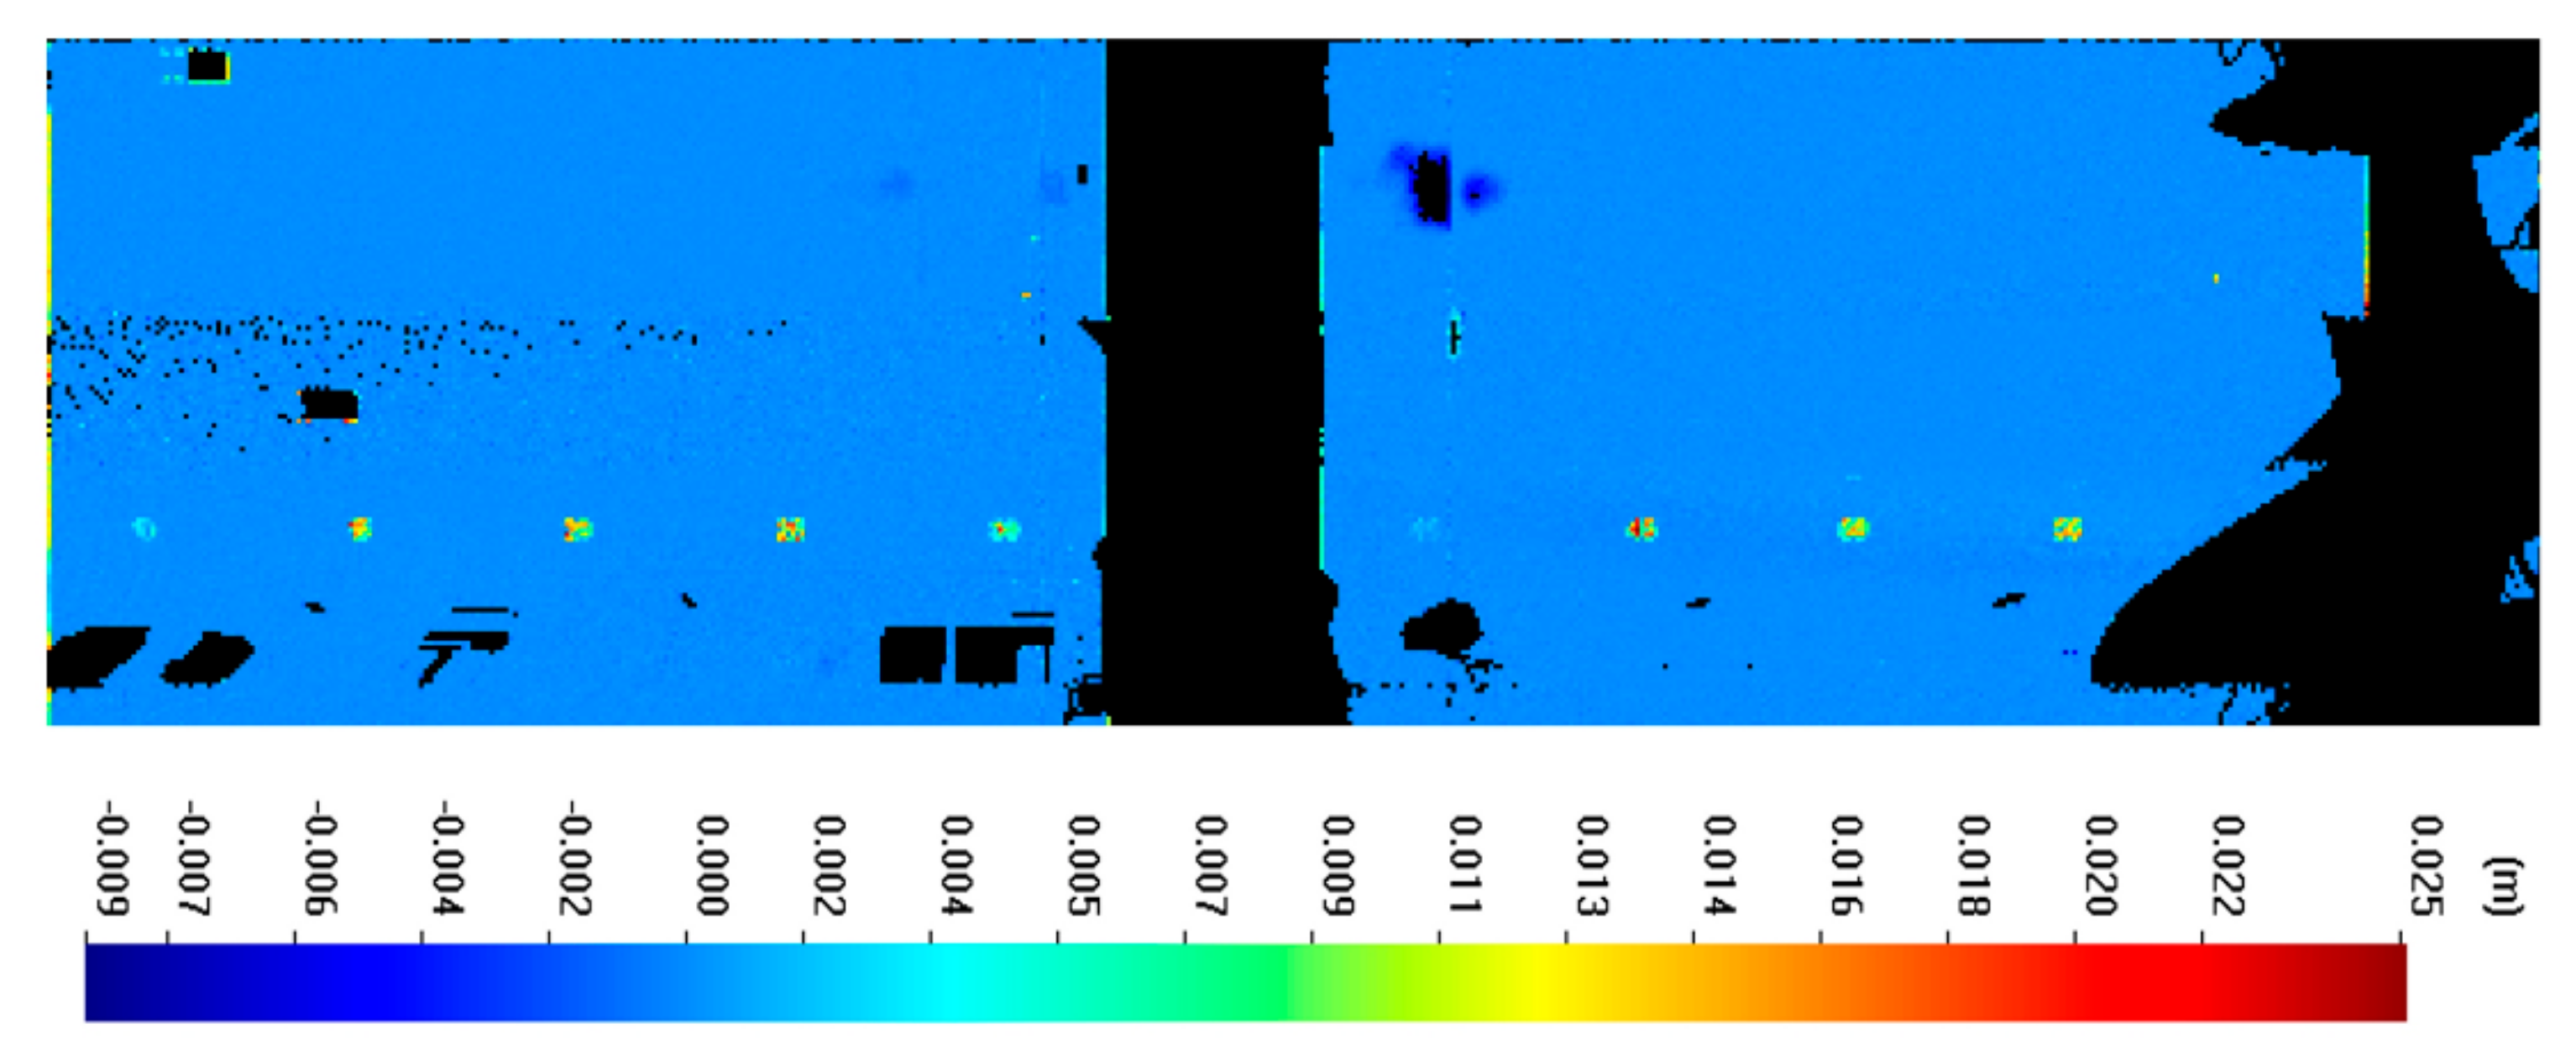
The separate manually selected and analytically created point clouds were compared to the next procedure’s nominal cylinder. The Realworks® software was used for this purpose. The obtained graphical results of the deformation of the RK shell with a color scale bar are shown in Figure 26 above. The projections onto a plane are shown in Figure 26 below.
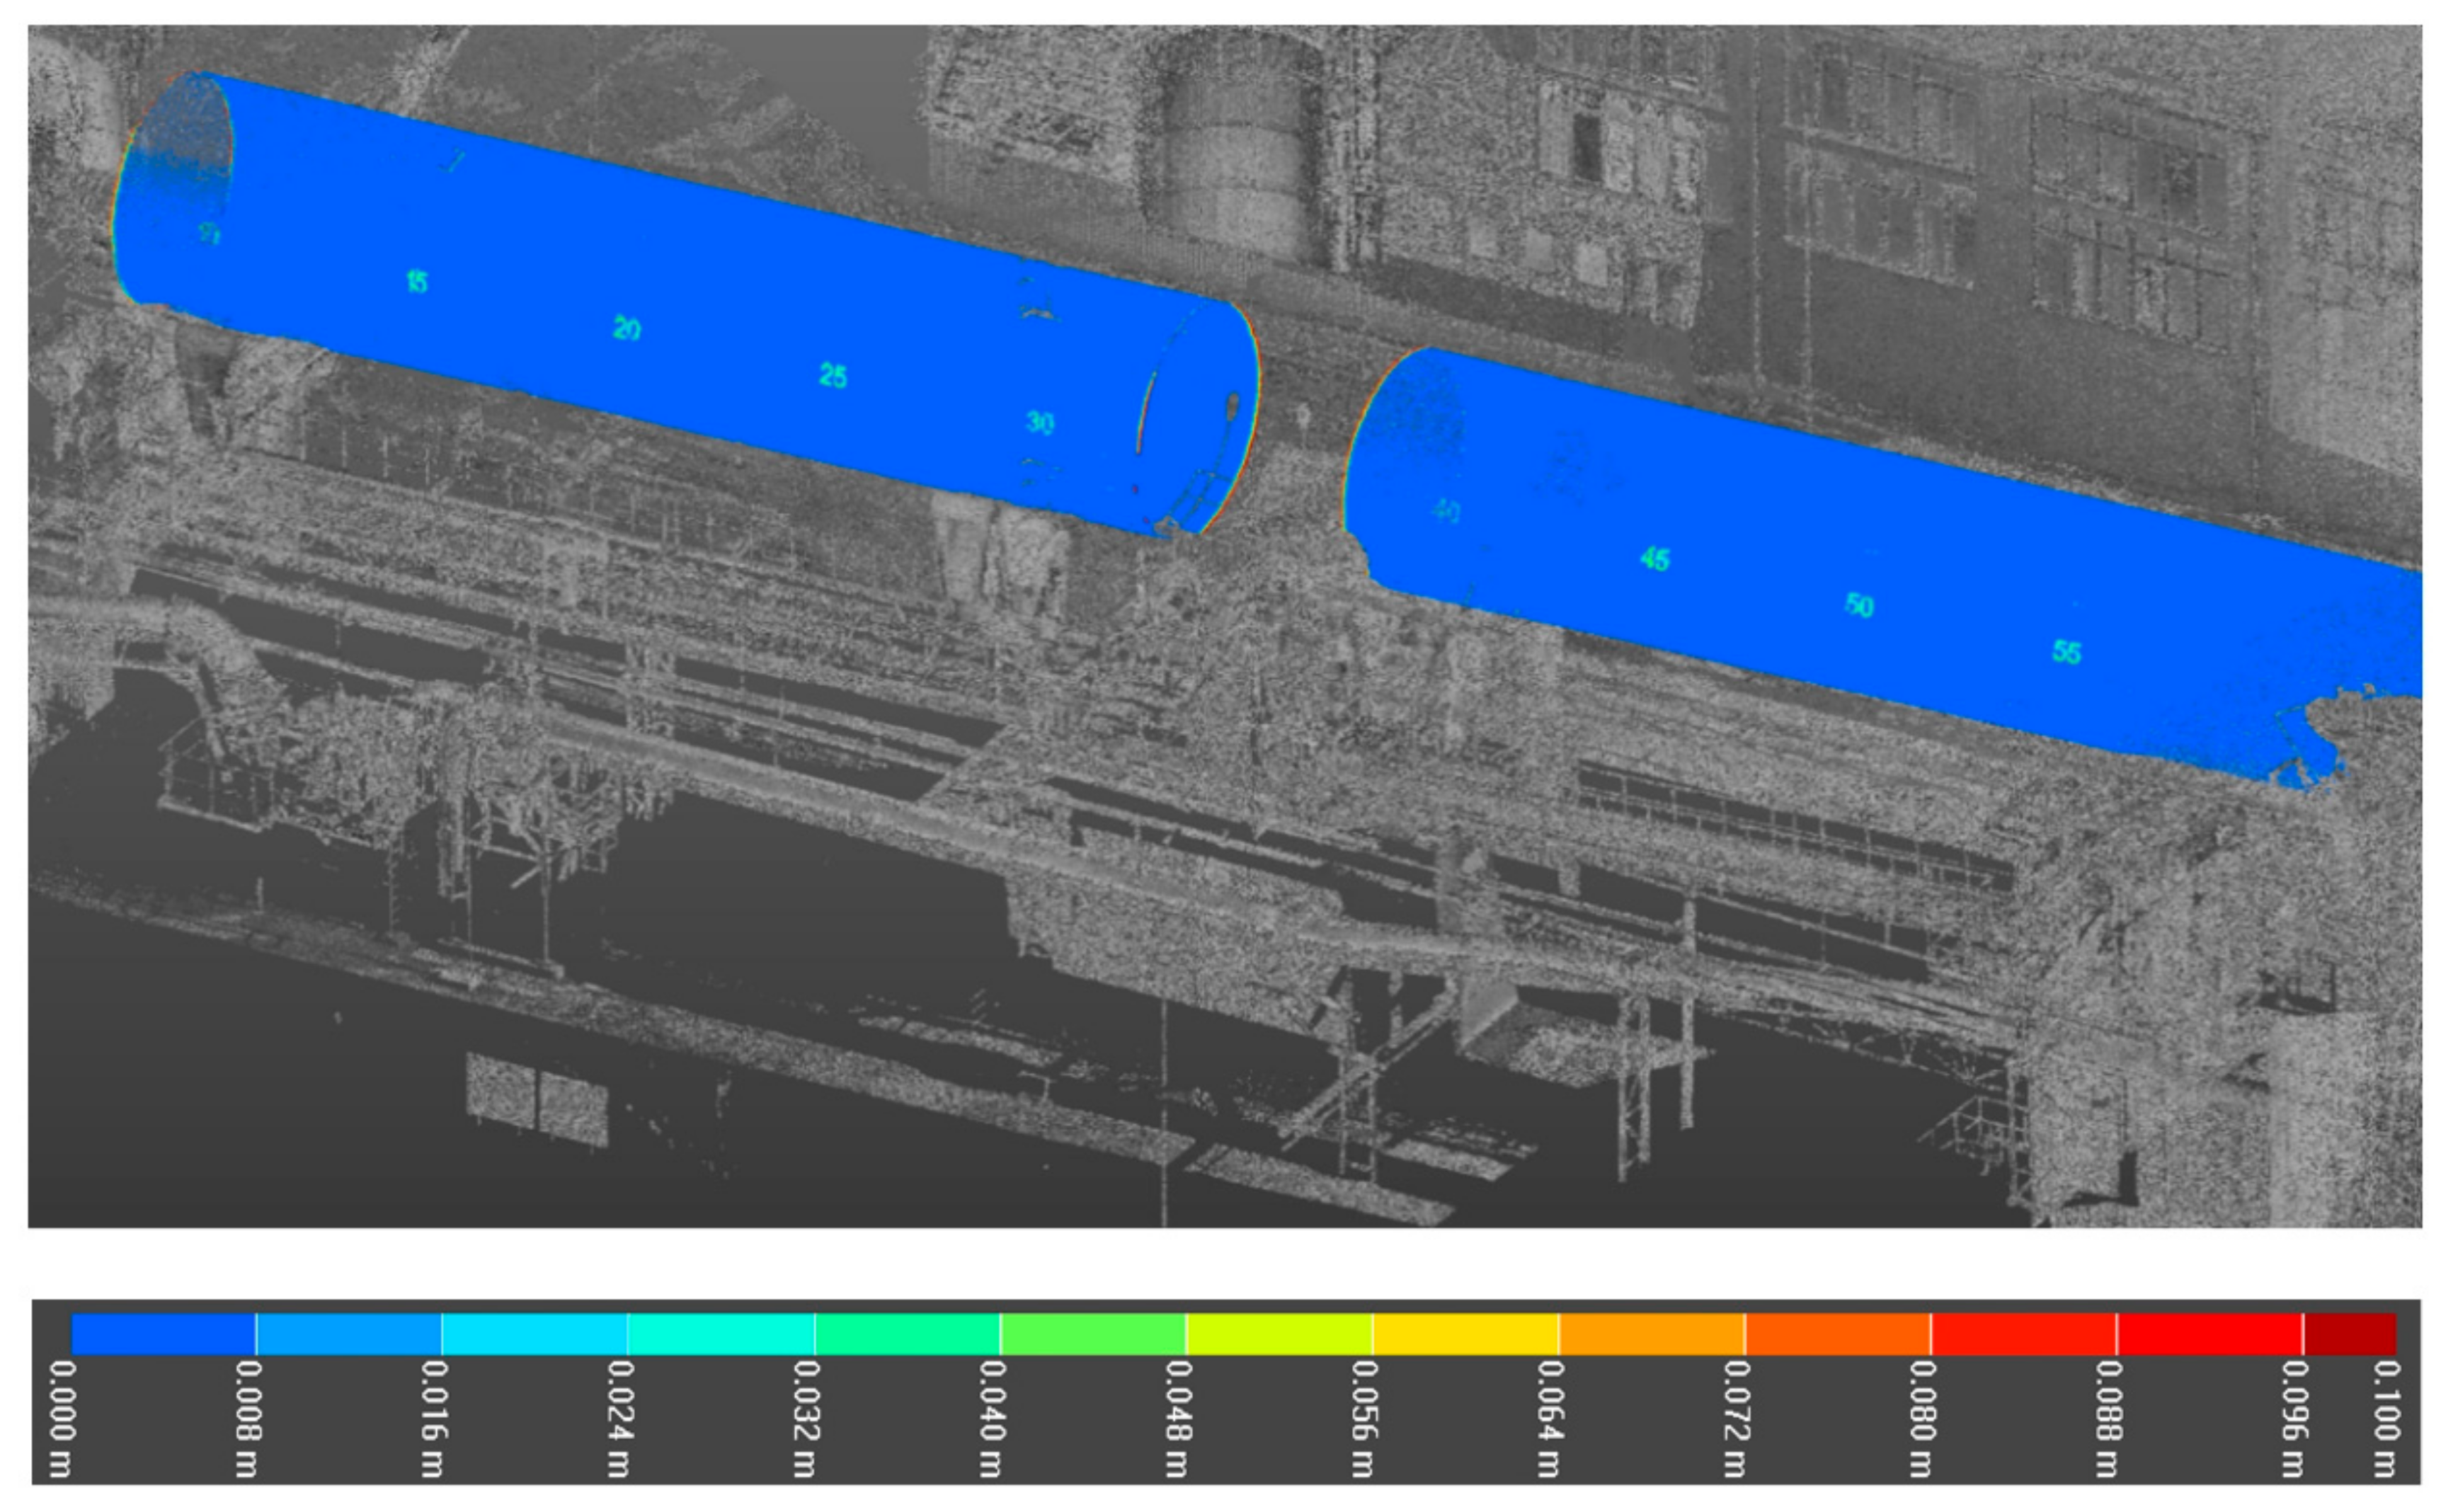
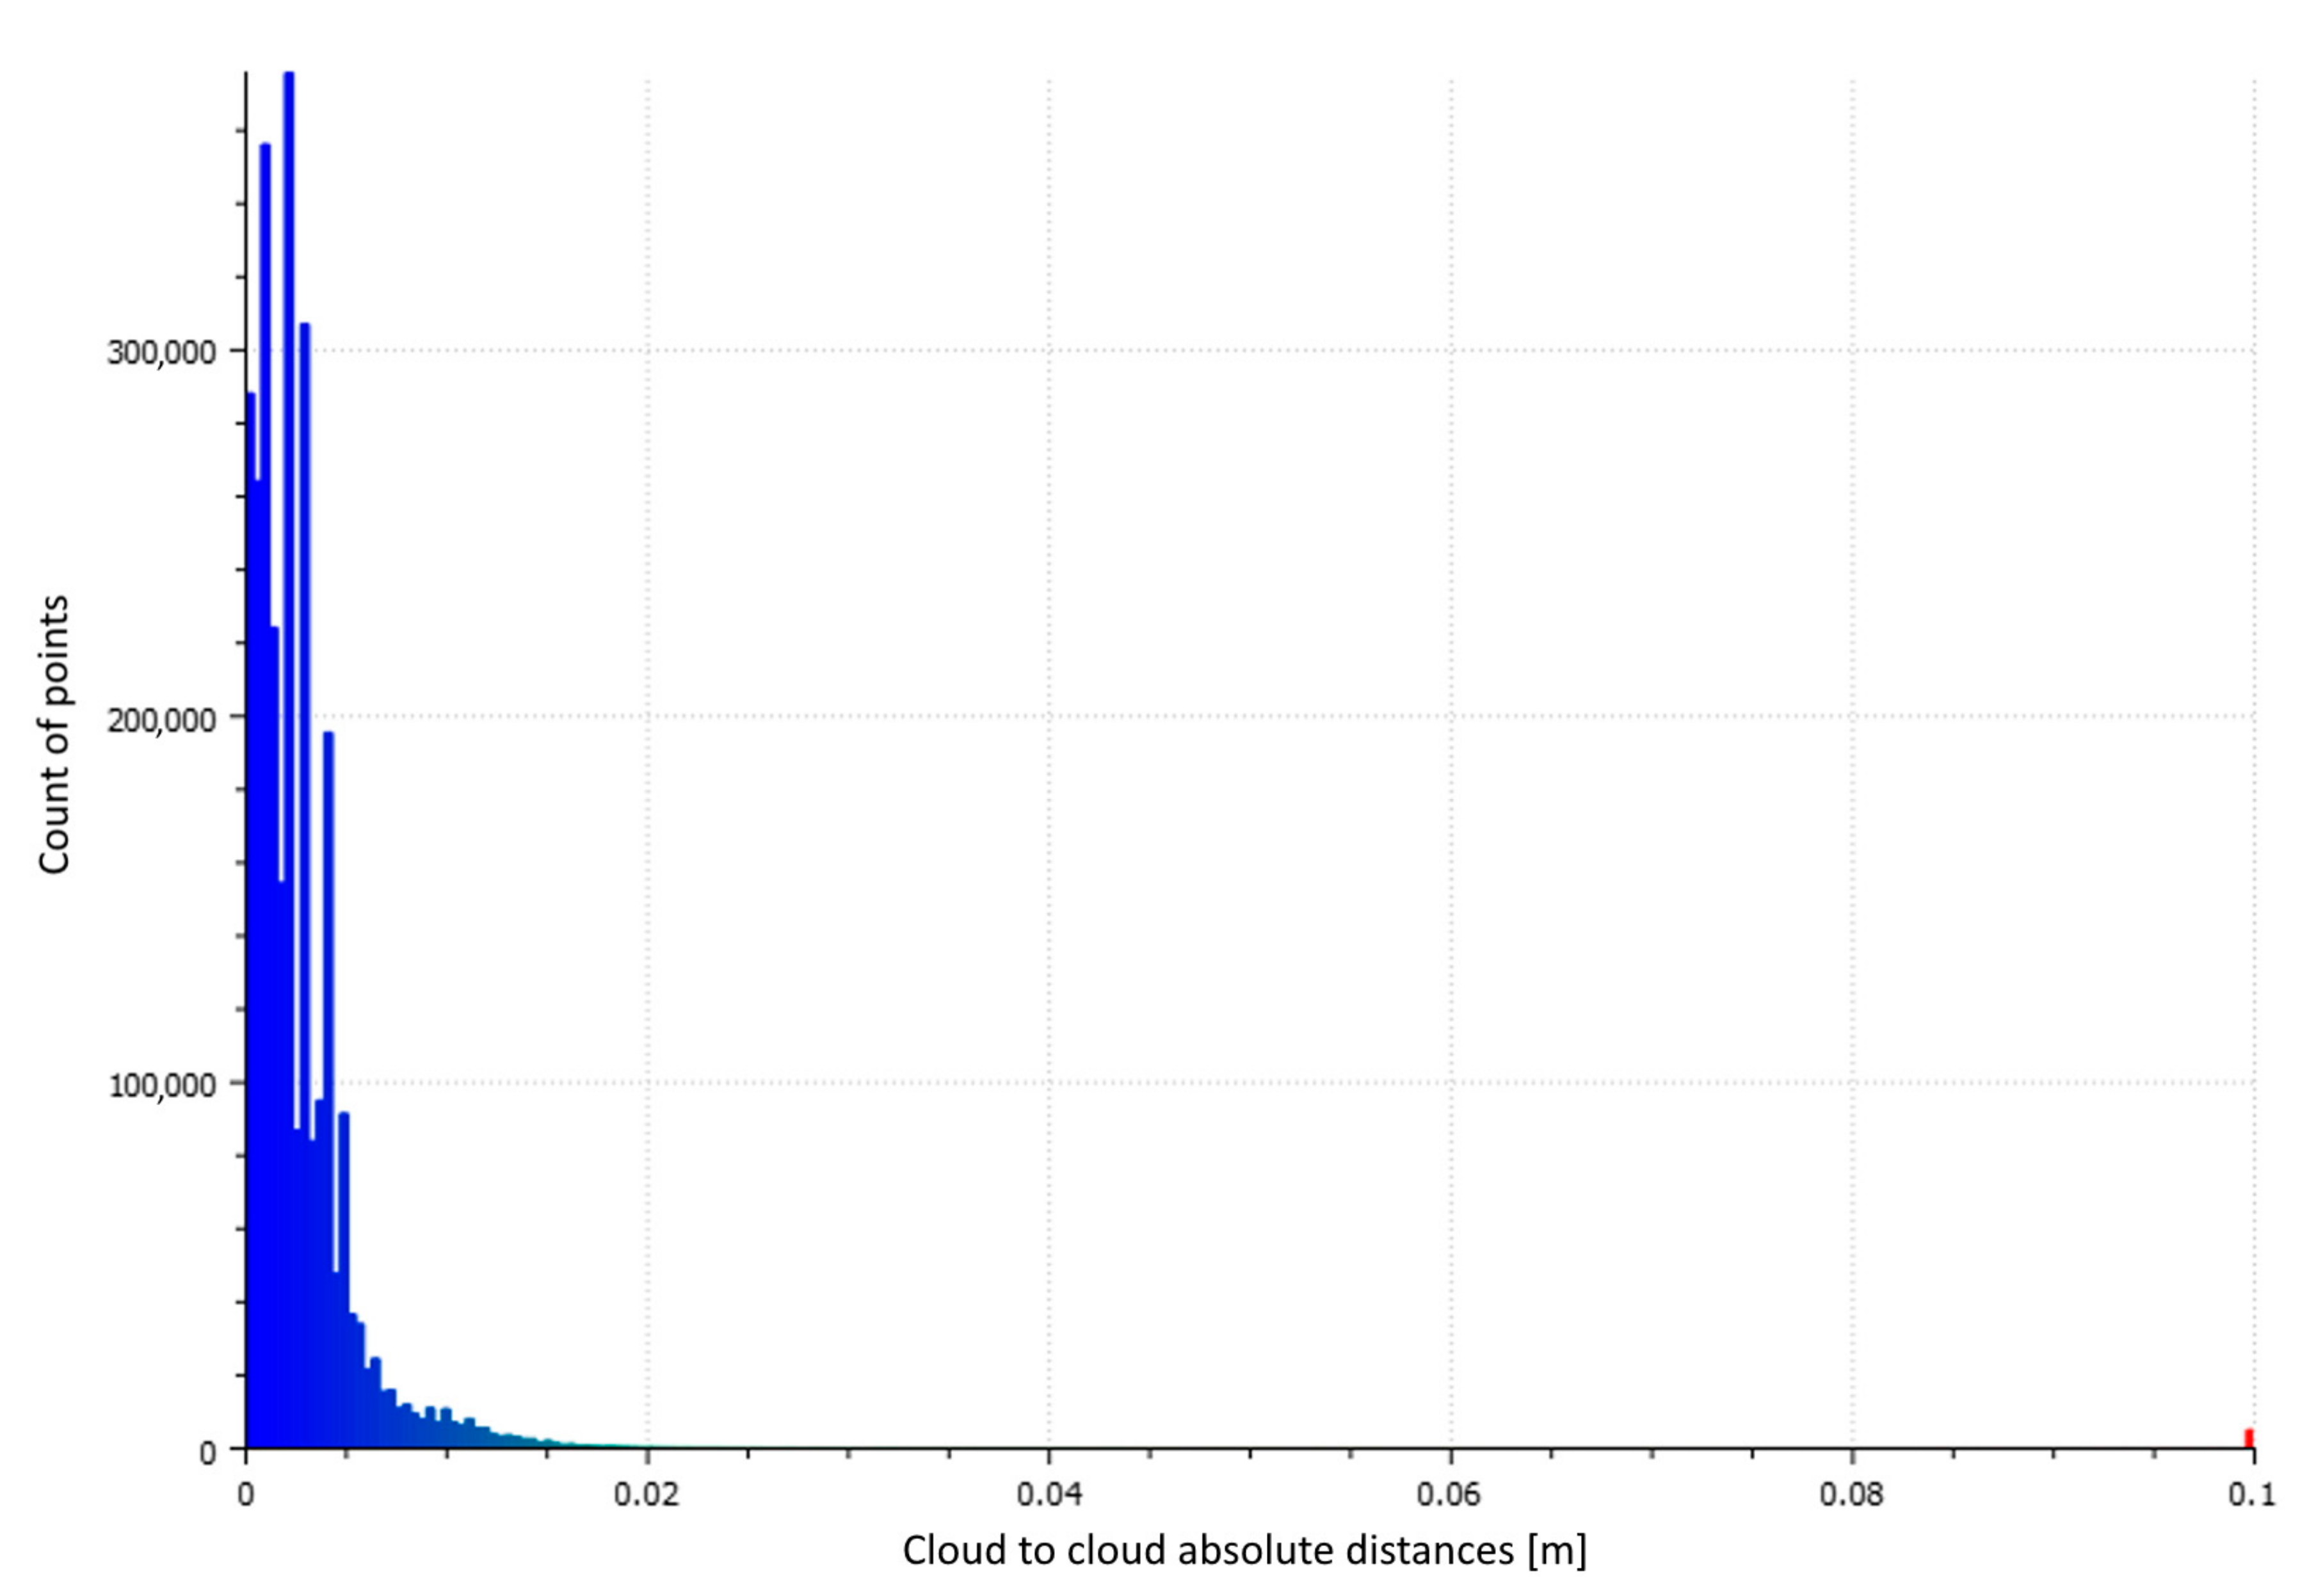
The extreme values of the calculated radius did not exceed the ± 40 mm values for both methods of solution—manual segmentation and analytical solution. Mutual differences between separate files (manually and analytically obtained) expressed as RMSD were less than 2 mm. A good agreement of these values and their confirmation can be seen in Figure 26. Maximal differences between both methods of processing were found around tire B in the middle of the RK. A comparison of the manual and analytical point clouds is shown in Figure 27 in an unwrapped form; and Figure 28 as a differential model. In manual segmentation, it is most difficult to filter out unnecessary details that do not belong to the shell surface and do not belong to further processing. There are welded flanges near every carrier tire, welded plates with stationing numbers of RK, etc. These elements are shown in Figure 27 in the shell’s unwrapped view and Figure 28, where the stationing plates are obvious. The maximum and minimum cloud-to-cloud differences determined by the procedure, as described in chapter 3, have values ranging from −9 mm to +25 mm. RMSD is 8 mm. Distribution of the deviations in the interval up to 100 mm is shown in Figure 29. 100 mm values correspond to welded marks of the kiln stationing sticking out into space. Significant values of deviations in the interval up to 15 mm are shown in Figure 30.

4.5. Analysis of the Coaxiality in the Cross-Sections and Ovality Ratio of the Rotary Kiln Shell

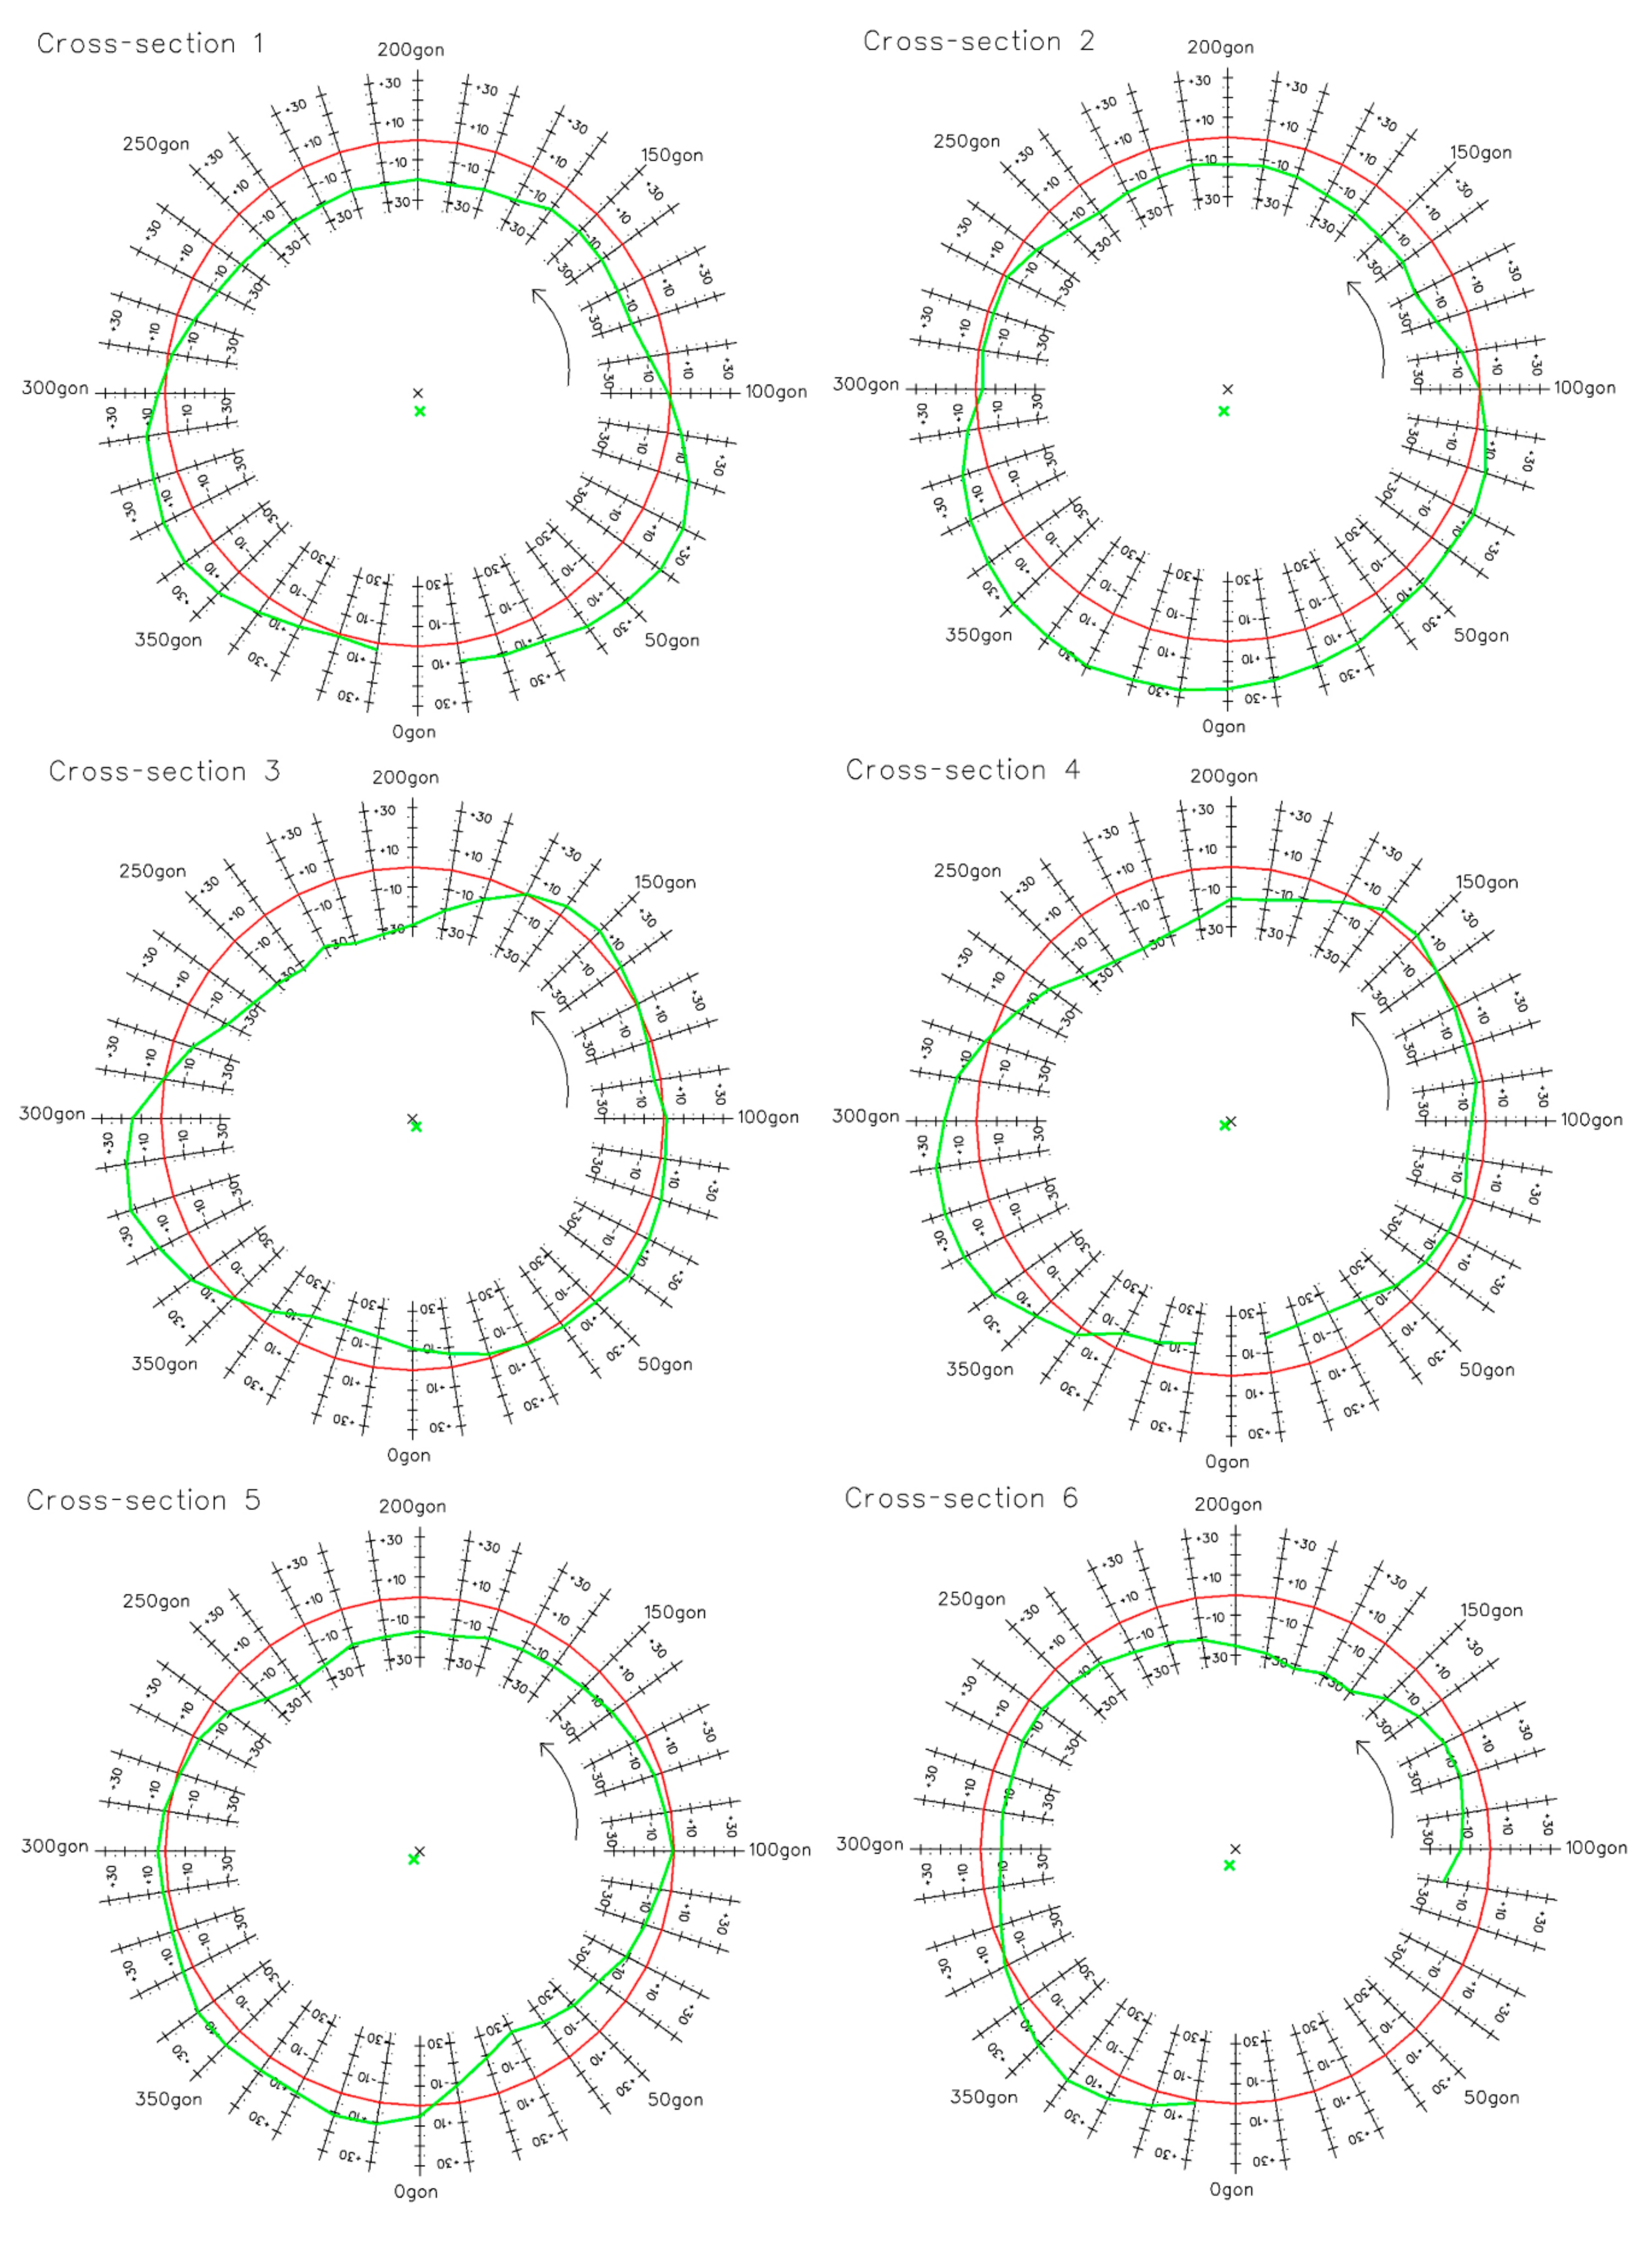
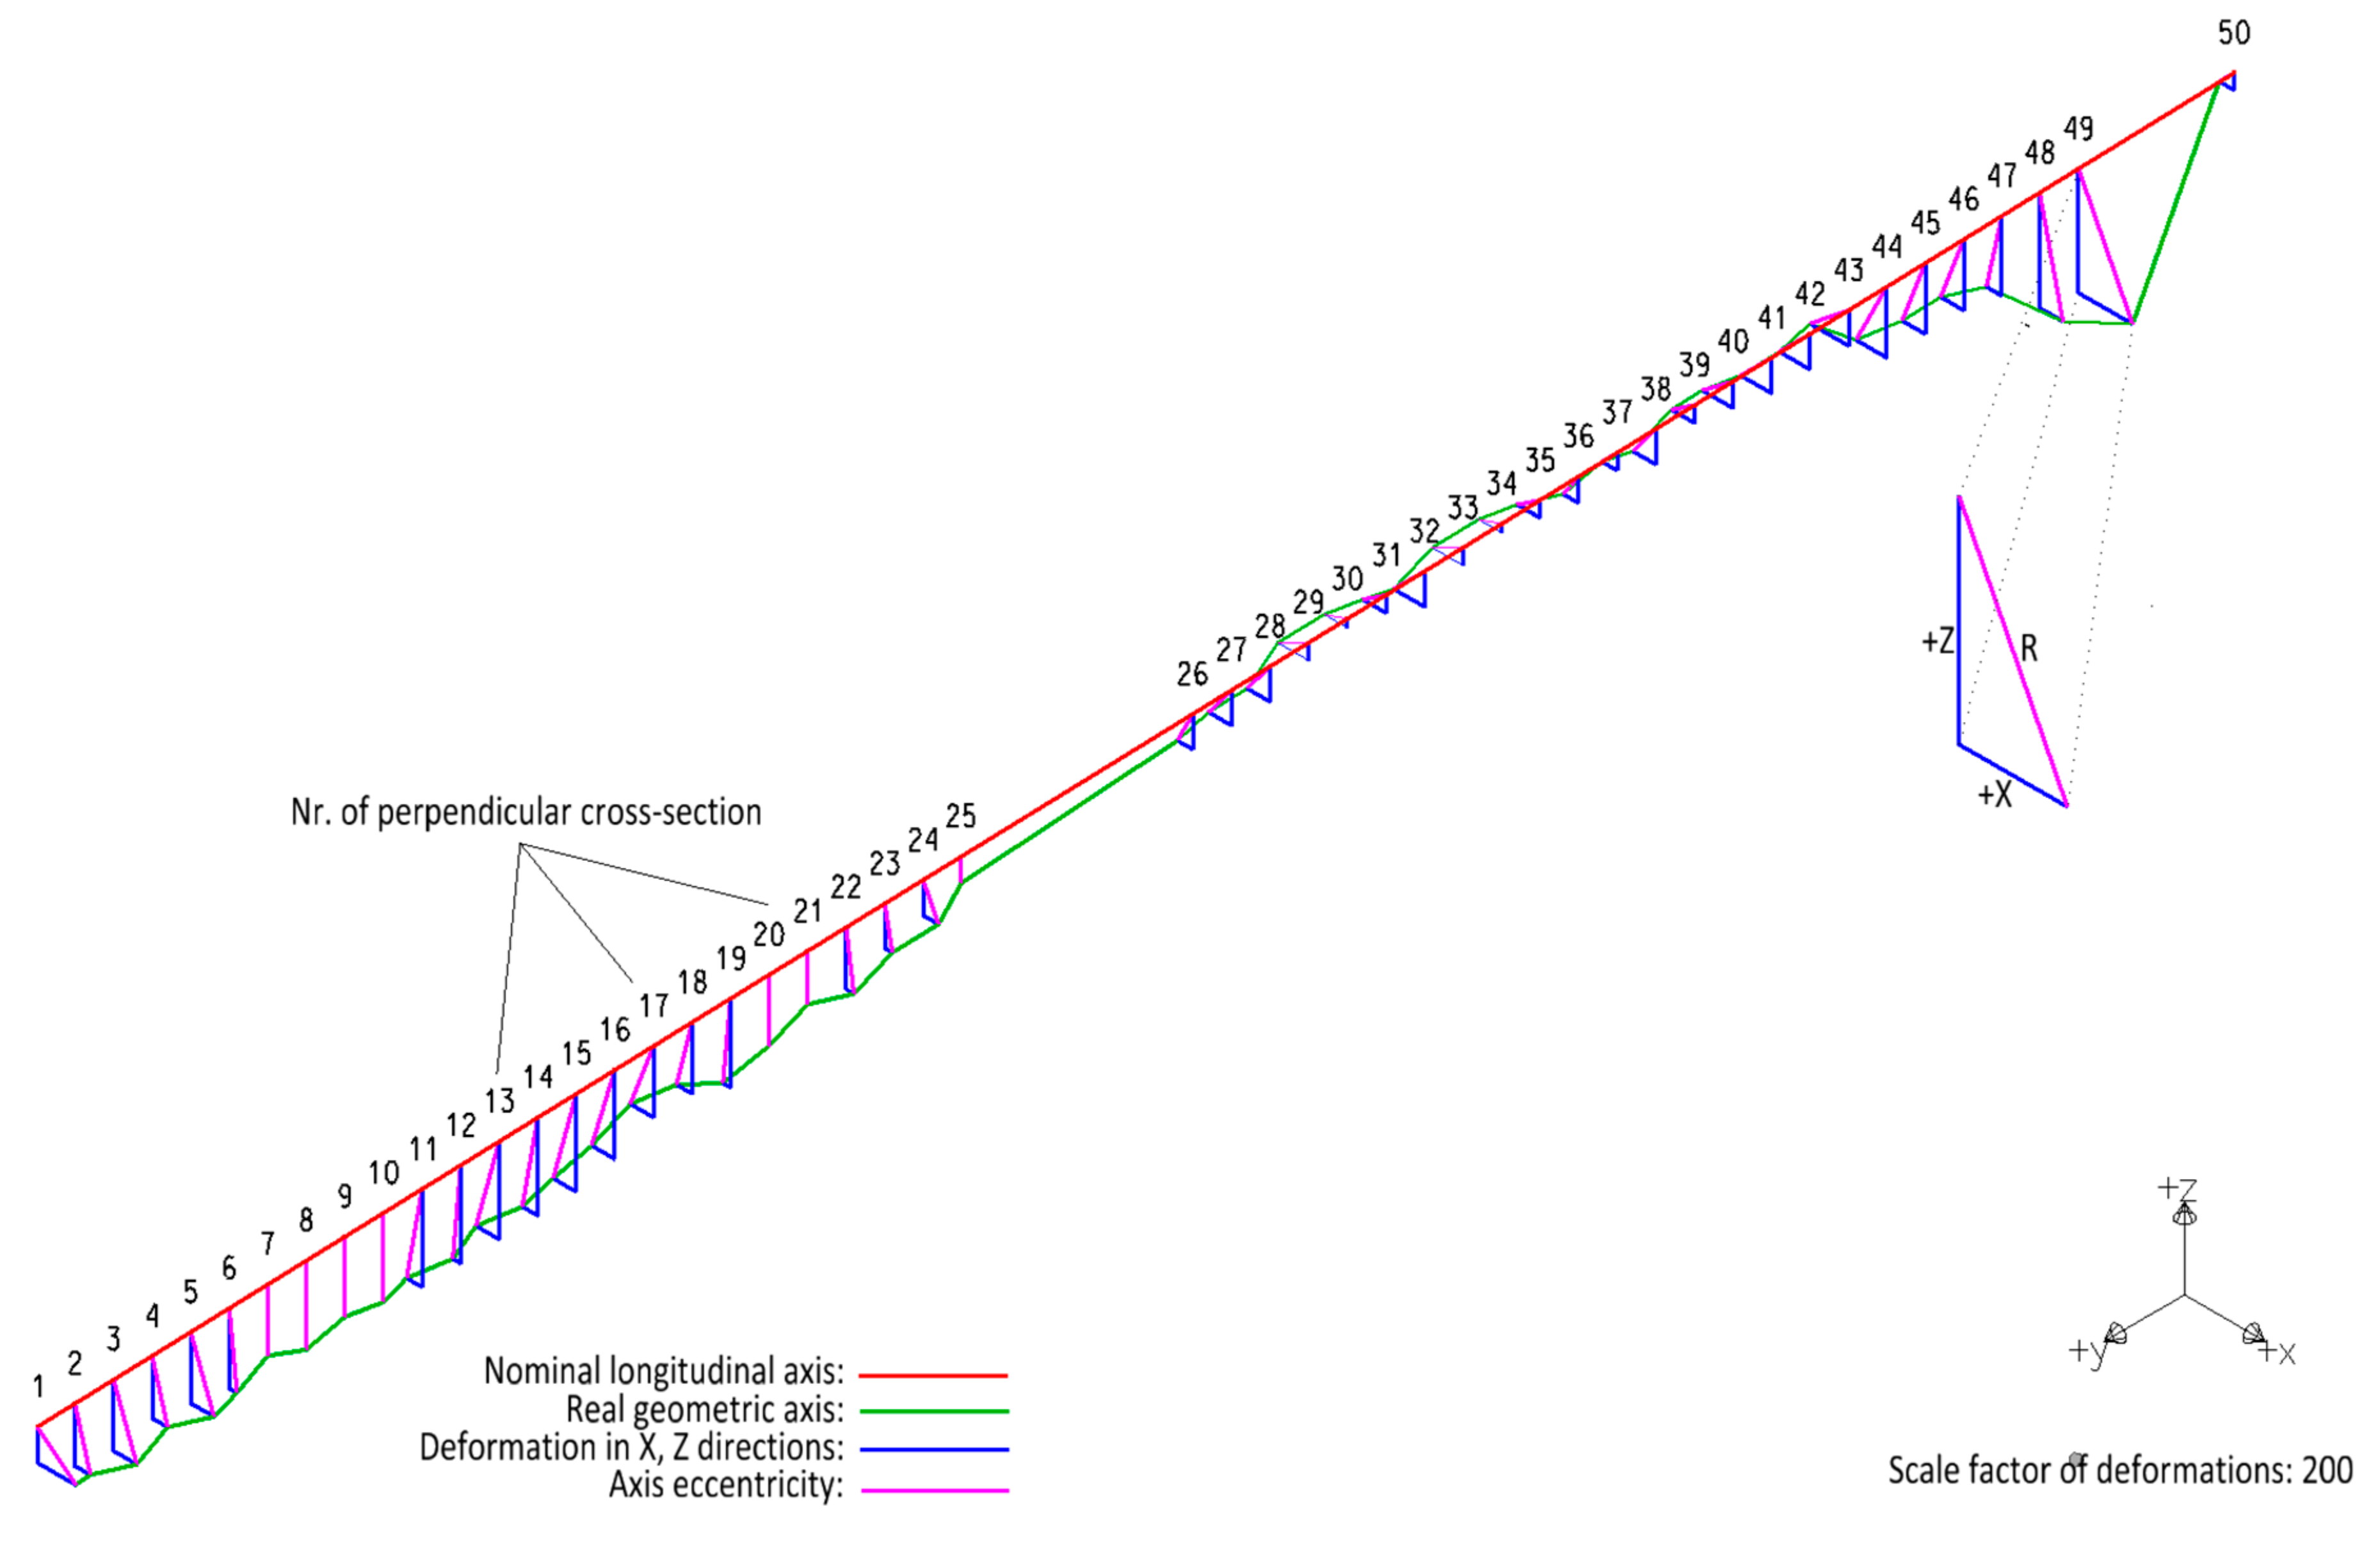
To determine the RK’s ovality, graphs corresponding to the cross-sections of the kiln shell were created. The interval between sections was set to 1 m. Fifty cross-sections in stationing were generated, where it was possible to make a complete cross-section from the point cloud. The selected graphs are shown in Figure 31. The red circle represents the nominal cylinder; the green curve represents the RK shell’s real surface in this cross-section. The results of the analytical segmentation are shown. Differences are triply amplified. The nominal and real centers of the RK shell are also specified and showed. By combining multiple cuts, the whole RK’s real longitudinal axis can be investigated in longitudinal section form (Figure 32). The results of determining the minimum and maximum radius of the shell and the calculated values of ovality ω0 on the selected six cross-sections are given in Table 5. It also shows the deviations of the kiln shell’s actual center from the theoretical axis in the transverse direction and in height.
The eccentricity of the shell from the theoretical axis of the kiln determined from the cross-sections takes values from −36 mm to +40 mm in the whole range of the kiln and with regard to the eccentricity of the actual center of the section from −36 mm to +38 mm. The ovality parameter ω0 calculated from all 50 cross-sections, reached the value of 1.396%. Its maximum value in one cross-section is 2.28%. The maximal misalignment of the real center of the whole RK shell in cross-sections is 11 mm. The average eccentricity of the centers in cross-sections is 9 mm. Considering the length of the RK, approximately 80 m, these values are acceptable for the real operation.

5. Discussion

This paper deals with the possibility and reliability of the TLS method for surveying of the RK. We expect the following benefits for our practice from our approach. TLS method is a fast, accurate, and reliable method to acquire a large amount of spatial data about the surveyed object’s large range. All in-situ TLS measurements of the selected RK were made within 5 h. About 22 million points from 4 stations were surveyed. For the proposed TLS method, it is also preferred that the measurement can be performed safely from the station on the ground, and also, several mutually registered stations of scanners can be applied. The whole measurement was taken during a service shutdown of the RK in cold status. In comparison with the traditional method of measurement, the advantage of this method is that the sequential rotation of the RK is not necessary. As a most significant disadvantage of the TLS method, we consider especially the fact that in most cases, it is impossible to survey the entire body of RK (for example, the axes of radial rollers or the whole shell of the kiln) because of the complex shape of the RK and permanent obstacles.
The accuracy of TS measurements results from the accuracy analysis according to Equations (2) and (3). Therefore, it can be considered as a reference and control methods of measurement for our new approach. The accuracy of the reference methods meets technical standards requirements—for example [56,57], local methodological guidelines, and the practical approach according to, for example, [31,32,33,34,35,36]. The TLS data’s direct control consisted of measuring 203 points on the kiln shell, approximately in its middle part. Then, the distances of the measured TS points to the point cloud obtained by TLS were compared. RMSD determined in CloudCompare software has a value of 2 mm, which we consider a successful control of measurement’s selected technology.
In TLS measurements, the results can also be affected by the scans’ mutual registration. Our direct field registration approach allows the first quality control of measurements directly in the field by determining the RMSD of the position and height of each temporary survey station. In our case, these values were up to 2 mm, which corresponds to the expectations according to the parameters of the used instruments [54,55]. Similar scan registration results were achieved also by, for example, [11,18,38].
The proposed analytical solution results for point cloud segmentation using frequency histograms in selected intervals of the body radius were verified against the basic approach—i.e., manual segmentation.
TLS measurement is fast, but the data processing is significantly slower. The most time-consuming part of the data processing phase is removing the maximum number of unnecessary points and keeping the maximum of the next processing’s important ones. Just an effort to save time and automate the process of segmentation in the point cloud was our motivation for the analytical solutions for point cloud processing. Based on our results, we can recommend our proposed point cloud segmentation process, especially for similar cylindrical bodies.

6. Conclusions

Our approach to the point cloud segmentation brings a new solution to spatial data processing using a mathematical, analytical method based on the histogram filtration. This approach can be applied to mathematically definable bodies.
A significant advantage of TLS measurements of a rotary kiln over traditional geodetic methods is the speed of data collection in the field and, subsequently, the possibility of obtaining various geometric parameters of the rotary kiln from one data set.
This study was conducted to investigate two main goals: First—Demonstrate the suitability of the TLS method to determine the geometric parameters of the RK and second—Design of an analytical solution for segmentation of the acquired point cloud so that the point cloud can be used for further processing. The results of the study show the suitability of both proposed solutions in such a specific environment. After comparing the manual point selection method with the analytical solution, we obtained almost identical results in the determination of selected geometric parameters of the RK. We were focused mainly on investigating carrier tires and their centers, the spatial position of the longitudinal axis of the RK, shell shape, and its deformation difference values against the nominal status. The results obtained by the proposed work can be used for practical tasks related to the RK’s maintenance and reconstruction, considering small differences between the two independent methods of data processing (manual and analytical). A significant advantage is a possibility of creating sections perpendicular to the kiln’s longitudinal axis at any stationing. From these cross-sections, the kiln shell ovality can be derived, which is documented in the form of circular diagrams and eccentricity of the furnace’s longitudinal axis in the form of the longitudinal profile along the length of the RK.

Author Contributions

Conceptualization, Ľ.K.; methodology, Ľ.K., R.U., M.Š. and P.B.; software, Ľ.K.; validation, M.Š., R.U., K.P., K.B. and J.P.; formal analysis, K.B.; investigation, Ľ.K. and P.B.; resources, Ľ.K.; data curation, Ľ.K., J.P., R.U. and M.Š.; writing—original draft preparation, Ľ.K.; writing—review and editing, Ľ.K., K.B. and P.B.; visualization, Ľ.K.; supervision, P.B. and K.P.; project administration, K.P. and P.B.; funding acquisition, K.P. and P.B. All authors have read and agreed to the published version of the manuscript.

Funding

This work was supported by the grants No 1/0844/18 funded by the Scientific Grant Agency of The Ministry of Education, Science, Research and Sport of the Slovak Republic (VEGA); and the grant No. 004TUKE-4/2019 funded by the Cultural and Educational Agency of The Ministry of Education, Science, Research and Sport of the Slovak Republic (KEGA); and the grant SGS20/052/OHK1/1T/11 funded by CTU Prague, Czech Republic.

Acknowledgments

Many thanks to the reviewers and the editor for their useful comments and suggestions.

Conflicts of Interest

The authors declare no conflict of interest. The funders had no role in the design of the study; in the collection, analyses, or interpretation of data; in the writing of the manuscript, or in the decision to publish the results.

References

  1. Świtalski, M. The measurement of shell’s elastic ovality as essential element of diagnostic of rotary drum’s technical state. Diagnostyka 2010, 53, 37–47. [Google Scholar]
  2. Krystowczyk, Z. Geometry measurements of kiln shell in dynamic conditions. Cem. Build. Mater. Rev. 2004, 16, 34–37. [Google Scholar]
  3. Xiao, Y.; Li, X.; Chen, X. General solution to kiln support reactions and multi-objective fuzzy optimization of kiln axis alignment. Struct. Multidiscip. Optim. 2008, 319–327. [Google Scholar] [CrossRef]
  4. Shi, Y.; Xiao, Y.; Li, X. Monitoring and optimum alignment of kiln axis. Innov. Comput. Inf. Control. 2007, 511. [Google Scholar] [CrossRef]
  5. Ethrog, U.; Shmutther, B. Determining deformations of a rotary kiln. The international archives of the photogrammetry, remote sensing and spatial information sciences (ISPRS Archives), Vol. XXVI, Part 5, Commission V. In Proceedings of the Symposium Real-Time Photogrammetry—A New Challenge, Ottawa, ON, Canada, 16–19 June 1986. [Google Scholar]
  6. Shelltester. Available online: https://www.zmp.com.pl/shelltester (accessed on 6 October 2020).
  7. Li, X.; Jiang, L.; Liu, D. Research on supporting load distribution of large-scale rotary kiln with multi-support and variable-stiffness. Chin. J. Comput. Mech. 2005, 22, 207–213. [Google Scholar]
  8. Mukupa, W.; Roberts, G.W.; Hancock, C.M.; Al-Manasir, K. A review of the use of terrestrial laser scanning application for change detection and deformation monitoring of structures. Surv. Rev. 2016, 1–18. [Google Scholar] [CrossRef]
  9. Teskey, W.F.; Radovanovic, R.S. Dynamic parallel roll alignment. J. Surv. Eng. 2002, 128, 136–143. [Google Scholar] [CrossRef]
  10. Teskey, W.F.; Bayly, D.A.; Martell, H.E. Use of laser targeting in precise machinery surveys. J. Surv. Eng. 1993, 119, 59–70. [Google Scholar] [CrossRef]
  11. Malowany, K.; Magda, K.; Rutkiewicz, J.; Malesa, M.; Kantor, J.; Michoński, J.; Kujawińska, M. Measurements of geometry of a boiler drum by time-of-flight laser scanning. Measurement 2015, 72, 88–95. [Google Scholar] [CrossRef]
  12. Mogilny, S.; Sholomitskii, A. Precision analysis of geometric parameters for rotating machines during cold alignment. Procedia Eng. 2017, 206, 1709–1715. [Google Scholar] [CrossRef]
  13. Bartoš, K.; Pukanská, K.; Repáň, P.; Kseňak, Ľ.; Sabová, J. Modelling the surface of racing vessel’s hull by laser scanning and digital photogrammetry. Remote. Sens. 2019, 11, 1526. [Google Scholar] [CrossRef] [Green Version]
  14. Stroner, M.; Kremen, T.; Braun, J.; Urban, R.; Blistan, P.; Kovanič, Ľ. Comparison of 2.5D volume calculation methods and software solutions using point clouds scanned before and after mining. Acta Montan. Slovaca 2020, 24, 296–306. [Google Scholar]
  15. Blišťan, P.; Jacko, S.; Kovanič, Ľ.; Kondela, J.; Pukanská, K.; Bartoš, K. TLS and SfM approach for bulk density determination of excavated heterogeneous raw materials. Minerals 2020, 10, 174. [Google Scholar] [CrossRef] [Green Version]
  16. Nuttens, T.; De Wulf, A.; Deruyter, G.; Stal, C. Deformation monitoring with terrestrial laser scanning: Measurement and processing optimization through experience. Int. Multidiscip. Sci. GeoConf.-SGEM 2012, 707–714. [Google Scholar] [CrossRef]
  17. Nuttens, T.; Stal, C.; De Backer, H.; DeRuyter, G.; Schotte, K.; Van Bogaert, P.; De Wulf, A.A.; De Wulf, A. Laser scanning for precise ovalization measurements: Standard deviations and smoothing levels. J. Surv. Eng. 2016, 142, 05016001. [Google Scholar] [CrossRef]
  18. Nuttens, T.; Stal, C.; De Backer, H.; Schotte, K.; Van Bogaert, P.; De Wulf, A. Methodology for the ovalization monitoring of newly built circular train tunnels based on laser scanning: Liefkenshoek Rail Link (Belgium). Autom. Constr. 2014, 43, 1–9. [Google Scholar] [CrossRef]
  19. Wang, W.; Zhao, W.; Huang, L.; Vimarlund, V.; Wang, Z. Applications of terrestrial laser scanning for tunnels: A review. J. Traffic Transp. Eng. (English Ed.) 2014, 1, 325–337. [Google Scholar] [CrossRef] [Green Version]
  20. Xue, B.; Yang, X.; Zhu, J. Architectural stability analysis of the rotary-laser scanning technique. Opt. Lasers Eng. 2016, 78, 26–34. [Google Scholar] [CrossRef]
  21. Turkan, Y.; Laflamme, S.; Tan, L. Terrestrial laser scanning-based bridge structural condition assessment. Tech Transf. Summ. 2016, 109. [Google Scholar]
  22. Riveiro, B.; González-Jorge, H.; Varela, M.; Jauregui, D. Validation of terrestrial laser scanning and photogrammetry techniques for the measurement of vertical underclearance and beam geometry in structural inspection of bridges. Measurement 2013, 46, 784–794. [Google Scholar] [CrossRef]
  23. Kim, M.-K.; Sohn, H.; Chang, C.-C. Localization and quantification of concrete spalling defects using terrestrial laser scanning. J. Comput. Civ. Eng. 2015, 29, 04014086. [Google Scholar] [CrossRef] [Green Version]
  24. Cao, Z.; Chen, D.; Shi, Y.; Zhang, W.; Jin, F.; Yun, T.; Xu, S.; Kang, Z.; Zhang, L. A flexible architecture for extracting metro tunnel cross sections from terrestrial laser scanning point clouds. Remote. Sens. 2019, 11, 297. [Google Scholar] [CrossRef] [Green Version]
  25. Pukanská, K.; Bartoš, K.; Bella, P.; Gašinec, J.; Blistan, P.; Kovanič, Ľ. Surveying and high-resolution topography of the ochtiná aragonite cave based on tls and digital photogrammetry. Appl. Sci. 2020, 10, 4633. [Google Scholar] [CrossRef]
  26. Zhang, Z.; Yin, T.; Huang, X.; Zhang, F.; Zhu, Y.; Liu, W. Identification and visualization of the full-ring deformation characteristics of a large stormwater sewage and storage tunnel using terrestrial laser scanning technology. Energies 2019, 12, 1304. [Google Scholar] [CrossRef] [Green Version]
  27. Jo, Y.H.; Hong, S. Three-Dimensional digital documentation of cultural heritage site based on the convergence of terrestrial laser scanning and unmanned aerial vehicle photogrammetry. ISPRS Int. J. Geo-Inf. 2019, 8, 53. [Google Scholar] [CrossRef] [Green Version]
  28. Slob, S.; Hack, R. 3D Terrestrial Laser Scanning as a New Field Measurement and Monitoring Technique. In Engineering Geology for Infrastructure Planning in Europe; Springer: Berlin/Heidelberg, Germany, 2004; Volume 104, pp. 179–189. ISBN 3-540-21075-X. [Google Scholar] [CrossRef]
  29. Pu, S.; Vosselman, G. Knowledge based reconstruction of building models from terrestrial laser scanning data. ISPRS J. Photogramm. Remote Sens. 2009, 64, 575–584. [Google Scholar] [CrossRef]
  30. Petrov, V.V.; Tyurin, S.V. Technique for control of rotary kilns geometric characteristics. Cellul. Pap. Cardboard 2005, 7, 66–70. [Google Scholar]
  31. Geoservex. Available online: http://www.geoservex.com.pl/ (accessed on 6 October 2020).
  32. TomTom-ToolsGmbH. Available online: http://tomtomtools.com/wp-content/uploads/2015/08/Measurement-Tools-For-The-Cement-Industry-03.pdf (accessed on 6 October 2020).
  33. Industrial Kiln & Dryer Group. Available online: http://www.industrialkiln.com (accessed on 6 October 2020).
  34. Ozek Makina. Available online: http://www.rotarykiln.net (accessed on 6 October 2020).
  35. NAK Kiln Services. Available online: https://nak-kiln.com (accessed on 6 October 2020).
  36. Site of Open Corporation Industrial Geodesy. Available online: http://promgeo.com/services/kiln (accessed on 6 October 2020).
  37. Rachakonda, P.; Muralikrishnan, B.; Sawyer, D. Metrological evaluation of contrast target center algorithm for terrestrial laser scanners. Measurement 2019, 134, 15–24. [Google Scholar] [CrossRef]
  38. Fan, L.; Smethurst, J.A.; Atkinson, P.; Powrie, W. Error in target-based georeferencing and registration in terrestrial laser scanning. Comput. Geosci. 2015, 83, 54–64. [Google Scholar] [CrossRef] [Green Version]
  39. Janßen, J.; Medić, T.; Kuhlmann, H.; Holst, C. Decreasing the uncertainty of the target center estimation at terrestrial laser scanning by choosing the best algorithm and by improving the target design. Remote. Sens. 2019, 11, 845. [Google Scholar] [CrossRef] [Green Version]
  40. Schmitz, B.; Holst, C.; Medic, T.; Lichti, D.D.; Kuhlmann, H. How to efficiently determine the range precision of 3d terrestrial laser scanners. Sensors 2019, 19, 1466. [Google Scholar] [CrossRef] [Green Version]
  41. Tan, K.; Zhang, W.; Shen, F.; Cheng, X. Investigation of TLS intensity data and distance measurement errors from target specular reflections. Remote. Sens. 2018, 10, 1077. [Google Scholar] [CrossRef] [Green Version]
  42. Yang, R.; Meng, X.; Yao, Y.; Chen, B.Y.; You, Y.; Xiang, Z. An analytical approach to evaluate point cloud registration error utilizing targets. ISPRS J. Photogramm. Remote. Sens. 2018, 143, 48–56. [Google Scholar] [CrossRef]
  43. Maalek, R.; Lichti, D.D.; Ruwanpura, J.Y. Robust Segmentation of Planar and Linear Features of Terrestrial Laser Scanner Point Clouds Acquired from Construction Sites. Sensors 2018, 18, 819. [Google Scholar] [CrossRef]
  44. Li, Q.; Cheng, X. Comparison of different feature sets for tls point cloud classification. Sensors 2018, 18, 4206. [Google Scholar] [CrossRef] [Green Version]
  45. Zivec, T.; Anzur, A.; Verbovsek, T. Determination of rock type and moisture content in flysch using TLS intensity in the Elerji quarry (south-west Slovenia). Bull. Eng. Geol. Environ. 2019, 78, 1631–1643. [Google Scholar] [CrossRef]
  46. Elkhrachy, I. Feature extraction of laser scan data based on geometric properties. J. Indian Soc. Remote. Sens. 2016, 45, 1–10. [Google Scholar] [CrossRef]
  47. Malambo, L.; Popescu, S.; Horne, D.; Pugh, N.; Rooney, W. Automated detection and measurement of individual sorghum panicles using density-based clustering of terrestrial lidar data. ISPRS J. Photogramm. Remote. Sens. 2019, 149, 1–13. [Google Scholar] [CrossRef]
  48. Yi, X.; Zhang, R.; Li, H.; Chen, Y. An MFF-SLIC hybrid superpixel segmentation method with multi-source rs data for rock surface extraction. Appl. Sci. 2019, 9, 906. [Google Scholar] [CrossRef] [Green Version]
  49. Valero, E.; Bosche, F.; Forster, A. Automatic segmentation of 3D point-clouds of rubble masonry walls, and its application to building surveying, repair and maintenance. Autom. Constr. 2018, 96, 29–39. [Google Scholar] [CrossRef]
  50. Koma, Z.; Rutzinger, M.; Bremer, M. Automated segmentation of leaves from deciduous trees in terrestrial laser scanning point clouds. IEEE Geosci. Remote. Sens. Lett. 2018, 15, 1456–1460. [Google Scholar] [CrossRef]
  51. Che, E.; Olsen, M.J. Multi-scan segmentation of terrestrial laser scanning data based on normal variation analysis. ISPRS J. Photogramm. Remote. Sens. 2018, 143, 233–248. [Google Scholar] [CrossRef]
  52. Xi, Z.; Hopkinson, C.; Chasmer, L. Filtering stems and branches from terrestrial laser scanning point clouds using deep 3-d fully convolutional networks. Remote. Sens. 2018, 10, 1215. [Google Scholar] [CrossRef] [Green Version]
  53. Kovanič, L.; Blišťan, P.; Zelizňaková, V.; Palková, J.; Baulovič, J. Deformation investigation of the shell of rotary kiln using terrestrial laser scanning (TLS) measurement. Metalurgija 2019, 58, 311–314. [Google Scholar]
  54. Totálne Stanice Leica TPS1200+. Technické Parametre a Porovnanie. Available online: https://www.geotech.sk/downloads/Totalne-stanice/TPS1200+-technicke-parametre.pdf (accessed on 6 October 2020).
  55. Leica ScanStation C10. The All-in-One Laser Scanner for Any Application. Available online: https://w3.leica-geosystems.com/downloads123/hds/hds/ScanStation%20C10/brochures-datasheet/Leica_ScanStation_C10_DS_en.pdf (accessed on 6 October 2020).
  56. Standard, B. Execution of steel structures and aluminium structures. Tech. Require. Alum. Struct. 2008, 1090. [Google Scholar]
  57. STN EN. Eurocode 3: Design of Steel Structures. 1993. Available online: https://www.phd.eng.br/wp-content/uploads/2015/12/en.1993.1.1.2005.pdf (accessed on 23 October 2020).
Figure 1. Scheme of geometric features of a rotary kiln, side, and top view.
Applsci 10 07652 g001
Figure 2. Degradation of the refractory brick lining [6] (a) cross-section of RK, (b) perfect state, (c) loosened lining of RK, (d) moved lining brick, (e) break of moved lining.
Applsci 10 07652 g002
Figure 3. Workflow—scheme.
Applsci 10 07652 g003
Figure 4. The rotary kiln—the object of research.
Applsci 10 07652 g004
Figure 5. An overview of the location of all survey points distinguished by color: 1—connecting points of the survey net; 2—ground control points (GCP); 3—scanning stations; 4—total stations (TS) survey station.
Applsci 10 07652 g005
Figure 6. Surveying equipment (a) Leica TCRA 1201+, (b) 6.5 inch HDS target, (c) Leica Scanstation C10.
Applsci 10 07652 g006
Figure 7. Permanent obstacles for laser scanning.
Applsci 10 07652 g007
Figure 8. Point clouds (ac) and cylinders (df) fitted on tires of the rotary kiln (RK) (tires A, B, C).
Applsci 10 07652 g008
Figure 9. Carrier tires of the rotary kiln fitted on point cloud.
Applsci 10 07652 g009
Figure 10. Distance from a point to a line in three-dimensional Euclidean space ε3.
Applsci 10 07652 g010
Figure 11. Point cloud containing points on RK and its surroundings with radius up to 16,000 mm.
Applsci 10 07652 g011
Figure 12. Frequency histogram of the radiuses.
Applsci 10 07652 g012
Figure 13. Point cloud containing points on RK with radius up to 3200 mm.
Applsci 10 07652 g013
Figure 14. Frequency histogram of the radiuses: Left—range of the radius 2.2–3.4 m; right—range 3.00–3.15 m.
Applsci 10 07652 g014
Figure 15. Tire A: Left—preselection, center—histogram, right—fine selection.
Applsci 10 07652 g015
Figure 16. Tire B: Left—preselection, center—histogram, right—fine selection.
Applsci 10 07652 g016
Figure 17. Tire C: Left—preselection, center—histogram, right—fine selection.
Applsci 10 07652 g017
Figure 18. Tire A—comparison of X, Y, and Z coordinates of the tire centers and their radiuses depending on the density of point cloud.
Applsci 10 07652 g018
Figure 19. Tire B—comparison of X, Y, and Z coordinates of the tire centers and their radiuses depending on the density of point cloud.
Applsci 10 07652 g019
Figure 20. Tire C—comparison of X, Y, and Z coordinates of the tire centers and their radiuses depending on the density of point cloud.
Applsci 10 07652 g020
Figure 21. Segmentation of the RK shell: Left—point cloud; right–histogram.
Applsci 10 07652 g021
Figure 22. Partial point cloud of the shell of the RK: Left—point cloud; right—histogram.
Applsci 10 07652 g022
Figure 23. Outliers—tire flanges and other removed points: Left—point cloud; right—histogram.
Applsci 10 07652 g023
Figure 24. Final point cloud including only points on the shell of the RK: Left—point cloud; right—histogram.
Applsci 10 07652 g024
Figure 25. The nominal cylinder, parameters are indicated in Table 3.
Applsci 10 07652 g025
Figure 26. The graphical representation of the deformation of the RK shell based on (A)—manually selected point cloud and (B)—analytical solution; displayed in a 3D view and as an unwrapped shell of the RK.
Applsci 10 07652 g026
Figure 27. Comparison of manually and analytically segmented point clouds in unwrapped view.
Applsci 10 07652 g027
Figure 28. Comparison of manually and analytically segmented point clouds in 3D view.
Applsci 10 07652 g028
Figure 29. Distribution of the deviations between point clouds in interval up to 100 mm.
Applsci 10 07652 g029
Figure 30. Distribution of the deviations between point clouds in interval up to 15 mm.
Applsci 10 07652 g030
Figure 31. The selected cross-sections of the RK shell. Linear units of the ovality [mm].
Applsci 10 07652 g031
Figure 32. Longitudinal cross-section of the axis of the RK.
Applsci 10 07652 g032
Table 1. Comparison of the geometric parameters of carrier tires.
TireParameterManual Point Cloud SegmentationAnalytical Solution—PreselectionAnalytical Solution—Fine Segmentation
ANumber of points16,08416,5447485
Radius of RK3.0315 m3.0320 m3.0315 m
Cylinder fit RMSD2 mm10 mm1 mm
Direction of axis−0.999; −0.001; 0.035−1.000; −0.003; 0.026−0.999; −0.001; 0.035
Percentage of remaining points0.54%0.54%0.25%
BNumber of points76,54253,44715,781
Radius of RK3.0965 m3.0910 m3.0965 m
Cylinder fit RMSD2 mm19 mm1 mm
Direction of axis−0.999; −0.001; 0.036−0.999; −0.006; 0.042−0.999; −0.001; 0.035
Percentage of remaining points0.55%1.78%0.53%
CNumber of points357345002152
Radius of RK3.05253.0475 m3.0525 m
Cylinder fit RMSD1 mm12 mm1 mm
Direction of axis−0.999; −0.000; 0.036−0.998; −0.005; 0.059−0.999; −0.000; 0.035
Percentage of remaining points0.12%0.15%0.07%
Table 2. Fitted carrier tires cylinder centers—comparison of coordinates.
TireCoordinates of Tire Cylinders CentersManual Point Cloud Segmentation
[m]
Analytical Solution—Preselection
[m]
Analytical Solution—Fine Segmentation
[m]
Difference Manual vs. Analytical Segmentation
[mm]
AY580.489580.526580.485 +4
X1006.5641006.5651006.564 0
Z206.173206.164206.173 0
BY551.599552.089551.601−2
X1006.5511006.5531006.5510
Z207.192207.164207.190+2
CY518.619518.617518.621−3
X1006.5351006.5341006.5350
Z208.356208.354208.3560
Table 3. Reduction of points on carrier tires—distance and number of points.
Point Cloud Resolution [m]Tire A [Points]Tire B [Points]Tire C [Points]
0.00515,89575,8213573
0.01015,07347,7253573
0.020924517,5233573
0.030528891342350
0.040356056891835
0.050264239031198
0.06019812853907
0.07015792163725
0.08012821713600
0.09010691400500
0.1009101151426
0.110777958361
0.120676820314
0.130589715275
0.140522630242
0.150468549216
0.160420498196
0.170383442173
0.180351403157
0.190307371149
0.200286334132
0.25019721692
0.30014716365
0.35011211954
0.400939642
0.450768334
0.500616730
0.550535425
0.600474523
0.650434122
0.700403521
0.750383519
0.800363417
0.850313014
0.900282813
0.950272511
1.000232411
Table 4. Parameters of the point clouds and theoretical cylinders—manual segmentation and analytical solution.
ParameterManual Point Cloud SegmentationAnalytical Solution—Fine Segmentation
Number of points2,963,0722,192,723
The radius of the fitted cylinder2.5395 m2.5390 m
Cylinder fit RMSD12 mm13 mm
Direction of axis−0.999; −0.001; 0.035−0.999; −0.001; 0.035
Table 5. Radiuses and ovality calculation in selected cross-sections.
Cross-Sectionrmin
[mm]
rmax
[mm]
ω0
[%]
ΔX
[mm]
ΔZ
[mm]
R
[mm]
1252725581.221−99
2252625591.302−1111
3251525702.172−44
4251025601.97−3−24
5251225471.38−3−45
6251525471.23−3−89
Publisher’s Note: MDPI stays neutral with regard to jurisdictional claims in published maps and institutional affiliations.