Article

Each-Phase Metering with Gas-Liquid Stratified Flow Based on the Multi-Frequency Coriolis Principle

1
College of Control Science and Engineering, China University of Petroleum (East China), Qingdao 266580, China
2
Research & Development Flow, Endress+Hauser Flowtec AG, 4153 Reinach BL, Switzerland
*
Author to whom correspondence should be addressed.
Appl. Sci. 2020, 10(21), 7747; https://doi.org/10.3390/app10217747
Submission received: 17 September 2020 / Revised: 19 October 2020 / Accepted: 27 October 2020 / Published: 2 November 2020
(This article belongs to the Section Mechanical Engineering)

Abstract

:
Gas-liquid two-phase flows generally have the characteristics of complex and variable flow patterns and flow rate uncertainty of each phase. The entrainment of gas increases errors of the existing non-separated multiphase metering. A novel metering method based on the multi-frequency Coriolis principle is proposed to solve the above problems. Compared to the conventional Coriolis mass flowmeter, the third-order mode of the measuring tube is used to improve the accuracy of the measurement. The influences of bubble effect and resonance effect on vibration responses in different vibrational modes were studied to determine the deviations of the apparent values of total density and mass flowrate by simulation. Simulation results with a single-frequency Coriolis flowmeter show that the maximum relative deviations of total density and total mass flowrate are −37.3% and −9.3%, respectively. Driven by different frequencies, the same two phase fluid in the measuring tube can have different responses of the primary mode and the higher vibrational modes. The vibrational responses characteristics corresponding to the first-order and third-order modes of measuring tube were selected and analyzed. Combined with advantages of high precision and multi-parameter measurement of traditional single-frequency Coriolis flowmeters, a multi-frequency correction model suitable for stratified flow was proposed. The results show that the corrected total density and mass flow deviations of gas-containing fluid are within ±4% and ±3%, respectively, which are significantly reduced. Corrected flowrate deviations of the gas-phase and liquid-phase are ±9.1% and ±7.2%, correspondingly, which also meet the metering requirements of the wellhead.

1. Introduction

The crude oil collection technology at the wellhead has developed rapidly. However, wellhead output metering is faced with problems of low measurement accuracy, short maintenance period, and human interference. In the oil field, wellhead output metering methods are usually divided into separation and non-separation, of which separation includes separation completely and partially. Three-phase separated metering adopts a horizontal three-phase separator, whose shortcomings are poor real-time performance, significant single-well measurement errors, and high maintenance costs. The dynamometer card method [1] for the rod pumped well as a non-separation metering method can achieve continuous measurement and real-time monitoring and simplify measurement process, however it is only applicable to low gas-containing pumping wells and only measures liquid phase flow. In recent years, multiphase flow meters (MPFMs) as non-separation metering methods are highly required in either pipelines or well output metering, and remain a viable solution compared to test separators as they are less bulky, cheaper, more accurate, and allow real-time measurement [2].
However, the complex and variable flow patterns will reduce the reliability and accuracy of MPFMs [3]. The production fluid flows through the oil pipeline, which is usually a three-phase flow of oil, gas, and water with low gas content and high water cut. Given the densities of oil, gas, and water, it is necessary to treat oil and water as single-phase liquid to calculate the phase-separation flow of gas and liquid. The measured fluid has three unknown independent variables: liquid flow, gas flow, and volume void fraction (or cross-section void fraction), which need to be solved by at least three simultaneous equations. This subject is to use three equations to address the situation of three independent variables, thereby improving the accuracy of each-phase metering in gas-liquid two-phase flow.
Many MPFMs commonly employ a combination of two or more measurement technologies, for example, differential pressure using Venturi, orifice [4] or V-cone [5], ultrasonic meter, gamma ray densitometry, microwave technology, capacitance, etc. [2]. Coriolis flowmeters can simultaneously measure parameters such as fluid density and mass flow compared with other flowmeters, which have the advantage of multi-parameter output. Gas is mixed into the liquid phase as interference. It has been found from research and field application that the bubble effect and resonance effect (increased fluid compressibility) caused by the presence of gas, which will seriously affect the accuracy of the Coriolis flowmeter measurement results, and even vibration stops [6]. Therefore, it is a feasible metering method to add at least one additional independent parameter (or an equation) to the existing two independent variables of a single-frequency Coriolis flowmeter to make the measurement equation have a unique solution. To this end, many scholars have explored the application of Coriolis flowmeters in gas-containing fluids through theoretical analysis, experimental research, and model building to improve the measurement accuracy of Coriolis flowmeters further.
Hemp and Kutin [7] thoroughly discussed the theoretical work on the compressibility effect and derived the relevant formulas of density and mass flow measurement errors. Gysling [8] proposed a lumped parameter aeroelastic model to improve the measurement accuracy by measuring the sound velocity, but this method is only suitable for ideal uniform bubble flow. Liu et al. [9] elaborated in detail that the neural network trained by the multi-layer perceptron (MLP) technology can obtain the internal parameters of the sensor (such as the apparent values of density, damping, mass flow) and correct the errors. Hemp and Yeung [10] described the technique of applying a viscosity correction factor to correct measurement errors caused by bubble effects. Henry et al. [11] combined Coriolis flowmeter with a water cut meter to realize the measurement of three-phase flow (water content from 0 to 100%, gas volume fraction (GVF) from 0 to 50%). Wang et al. [12] proposed a new method of CO2 flow measurement under carbon capture and storage (CCS) condition based on the Coriolis flowmeter and LSSVM model, using a classifier to identify mixed fluid flow patterns, and using a single Least Square Support Vector Machine (LSSVM) model to measure and predict CO2 mass flow and volume fraction.
It can be seen from the above analysis that for the application of Coriolis flowmeters to measure the gas-containing fluids, many researchers and research institutions have made theoretical progress and some practical application results. Some companies have also launched relevant Coriolis flowmeters applicable to the gas-containing conditions, among which the multi-frequency Coriolis flowmeters by E+H company can compensate for the bubble effect and resonance effect caused by the presence of the gas [13]. However, the measurement correction method of uniform bubble flow based on the multi-frequency Coriolis principle applied by this flowmeter has higher accuracy only under the ideal flow pattern with more evenly distributed bubbles [14]. However, for the low gas-containing fluids with complex and variable flow patterns, it is challenging to meet the current requirements for phase-separation metering only by using the existing research results and the measurement accuracy of products. Therefore, how to improve the applicability and metering accuracy with a multi-frequency Coriolis flowmeter is the critical content of this paper.
The single-frequency Coriolis flowmeters that are widely used in the oilfields can directly measure the oil-water two-phase separated from the gas-liquid two-phase separators. However, it has a higher requirement for the effect of gas-liquid separation. The entrainment of gas will significantly increase the measurement errors of Coriolis flowmeters.
Therefore, this paper uses the Finite Element Analysis method to simulate the measurement characteristics of Coriolis flowmeter for gas-liquid two-phase flow under different working conditions (gas content, flow pattern). A multiphase metering technology based on the multi-frequency Coriolis principle is proposed. Using the multi-frequency response characteristics of Coriolis flowmeters and advantages of traditional single-frequency Coriolis flowmeters with high accuracy and multi-parameter output, a stratified flow deviation compensation model based on the multi-frequency Coriolis principle can be established to reduce the measurement deviations caused by bubble effect and resonance effect. Only one multi-frequency Coriolis flowmeter can realize the online non-separation metering of each phase flow.

2. Theoretical Background

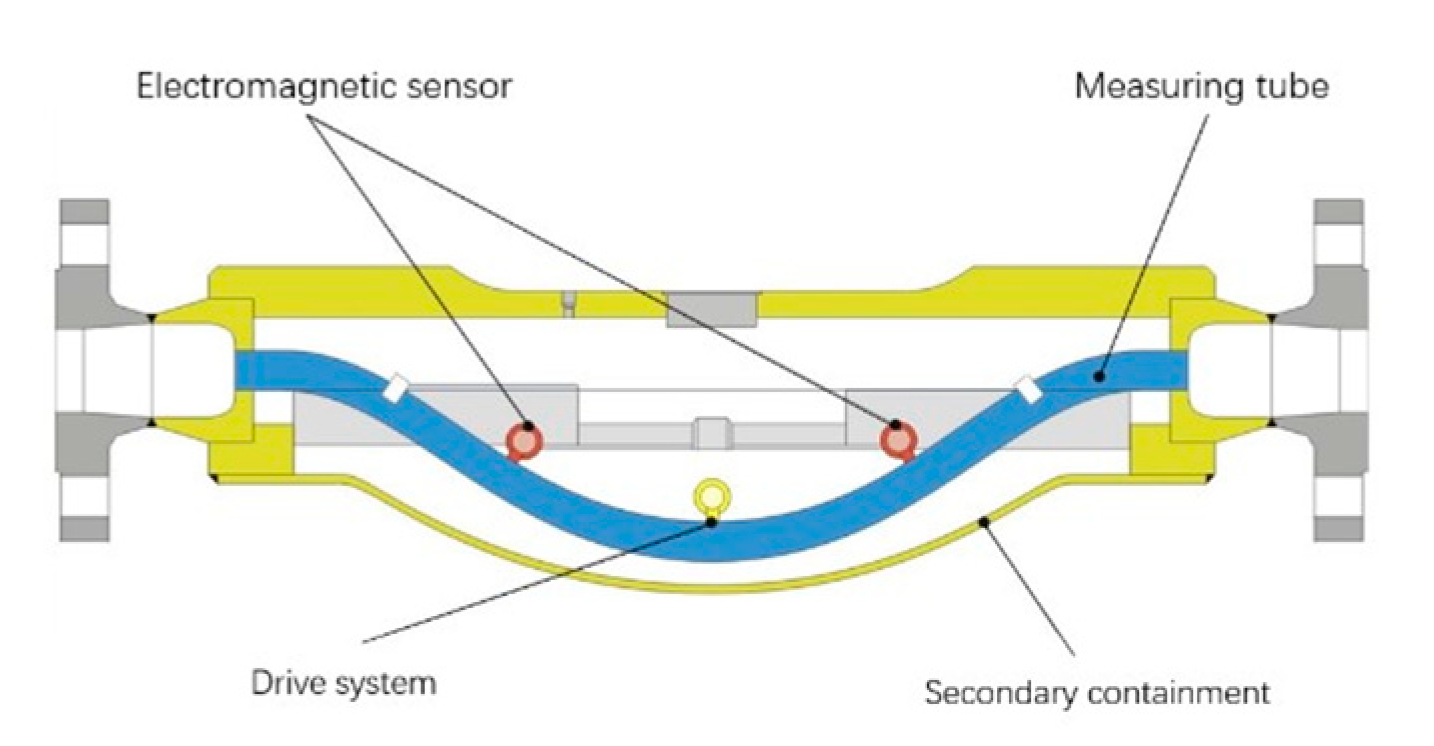
2.1. Measuring Principle of Single-Frequency Coriolis Flowmeters

A single-frequency Coriolis flowmeter is considered to be one of the high-precision flowmeters for measuring single-phase medium, as shown in Figure 1 [13]. Its main components include: measuring tube, drive system, electromagnetic sensors, and secondary containment.
A single-frequency Coriolis flowmeter relies on the vibration of the measuring tube to measure the measured medium. For the gas or liquid single-phase, single-frequency Coriolis flowmeters can directly measure the density and mass flow of the measured fluid by using the output values of vibration frequency and time difference of the measuring tube [14]. The measurement principle between them is independent.
ρ = c 0 + c 1 1 f 2
m ˙ = K f · Δ t
where f is the vibration frequency of the measuring tube; c 0 and c 1 are the density coefficients, which are related to the inherent properties of the measuring tube; K f is mass flow coefficient; Δ t is the vibration time difference between two monitoring points when the measuring pipe vibrates.
For liquid-liquid two-phase flow (oil-water two-phase flow), the decoupling between the two phases is relatively small [15]. Under conditions of known single-phase densities of oil and water, there are only two independent unknown variables. It is considered that two-phase fluid flows synchronously. The phase holdup and phase-separation flow in the two-phase fluid can be calculated by using two measurement values of total density and total mass flow provided by a single-frequency Coriolis flowmeter.
For gas-liquid two-phase flow, it can be seen from Equations (3) and (4) that the measured density of fluid provided by a single-frequency Coriolis flowmeter is affected by the gas [16]. Measuring results cannot be determined, which may reduce the measurement accuracy. There are three unknown independent variables in the measurement of gas-containing fluid: liquid flow, gas flow, and volume void fraction (or cross-section void fraction) [17]. The accurate measurement of gas-containing fluid needs to be realized by adding at least one additional measured independent parameter (or a principle formula) based on two independent variables of single-frequency Coriolis flowmeters [18].
ρ m i x t u r e = α ρ g + β ρ l
α + β = 1
where α is the gas volume fraction (GVF); ρ is the density. The subscripts g and l are gas and liquid, respectively.
Measurement principle of single-frequency Coriolis flowmeters shows that influences of gas entrainment on the application performance of Coriolis flowmeters are still a challenging work. Therefore, for multiphase fluid, it is an ideal method to solve the measured variables by referring to the number of unknown quantities, combining with other variables, or using equations of different measurement principles.

2.2. Error Sources of Measuring Gas-Containing Fluid by Single-Frequency Coriolis Flowmeters

For gas-containing fluids, the bubble effect and resonance effect are considered to be main factors for measurement errors of Coriolis flowmeters [19]. The bubble effect is due to the relative motion between the gas and liquid phase, which leads to the secondary flow around the bubbles, resulting in underestimation of the actual density and mass flow [20]. Under the action of free bubble, theoretical deviations of density and mass flow is shown in Equation (5). The bubble effect has the same negative deviations on density and mass flow measurement.
E b = 2 α 1 α
where α is the gas volume fraction.
The reason for the resonance effect is that the existence of a small amount of gas in the liquid leads to a sharp decrease in sound velocity, increases compressibility of two-phase fluid, reduces the resonance frequency of the mixture in the tube, and leads to overestimations of density and mass flow [3]. The acoustic resonance frequency in measuring tube can be calculated from the lowest resonance mode of tube, as follows:
f 0 = c · λ 1 2 π R
where λ 1 is a constant equal to 1.842; R is the radius of the measuring tube; f 0 is the lowest acoustic resonance frequency of fluid.
Different from the bubble effect, the mass flow deviation caused by the resonance effect is twice the density [13]:
E ρ = ( r 0 + r 1 · 1 1 f 2 f 0 2 ) 1
where the values of r 0 and r 1 are constant and equal to 0.16 and 0.84, respectively, which describe the active and inactive portion of the fluid mass in the measuring tube for the resonance effect. f 0 is the natural frequency of the first modes of measuring tube free vibration [14].
E m ˙ = 2 · E ρ
The existence of gas leads to bubble effect and resonance effect (an increase in fluid compressibility), which increases the total errors of Coriolis flowmeters. The expression of total instrument error is shown in Equation (9).
E c = ε + E d
where ε is the basic error of the meter; E d is the measurement deviation caused by the presence of gas in fluid, and therefore the purpose of this study is to reduce E d by establishing a correction model suitable for stratified flow.

3. Methodology

In this section, the Finite Element Analysis (FEA) method is used to simulate measurement characteristics of single-frequency Coriolis flowmeters for the gas-containing fluids. In the stratified flow and bubbly flow with low gas content (GVF less than 10%), the influence of gas content and flow patterns on the vibration frequencies of each mode of the measuring tube is analyzed. Then the effect of different working conditions on the density and mass flow is fully understood.
In order to simulate actual conditions and observe flow patterns in gas-containing fluids, the DN25 micro-bend measuring tube is connected with a long straight tube with a length of 10D in the front and a short tube with a length of 2D to the back. The test device is shown in Figure 2, wherein the micro-bend pipe refers to the size of Promass F single-frequency Coriolis flowmeter by E+H company [3].
According to the wellhead production data of Shengli Oilfield China, shown in Table 1, temperature and pressure are 20–60 °C and 4–25 bar respectively, liquid flowrate is smaller than 100 t/d.
According to the Mandhane flow pattern map [21], the superficial cross-section velocities of gas and liquid phases are taken as inlet conditions in simulation. The stratified and bubble flow are set under terms of temperature and pressure (i.e., 20 °C and 6 bar). The setting conditions of numerical simulation are shown in Table 2. The gas and liquid phases enter from the long straight pipe with different cross-section superficial velocities and flow through the straight pipe to the micro-bend measuring pipe.
In stratified flow and bubble flow, the influences of different working conditions on the frequencies and phase difference output deviations of the vibration response of the measuring tube are analyzed to obtain the deviations of the actual density and mass flow with a single-frequency Coriolis flowmeter. Therefore, the measured fluid density and mass flow (Equations (10) and (11)) measured by a single-frequency Coriolis flowmeter are obtained by numerical simulation. The density coefficients can be determined by fitting densities and the corresponding frequencies; the mass flow apparent values of the measured fluid can be obtained by using the output value of the time difference generated by deformation of measuring tube, and Kf can be determined by fitting the time differences and the corresponding mass flow values for water.
ρ app 1 = 885.90 + 2.204 × 10 8 1 f 1 2
m ˙ a p p = K f · Δ t = 1212.77 Δ t
where f 1 is the first-order vibration frequency of measuring tube obtained by modal analysis considering Fluid-Structure Interactions.

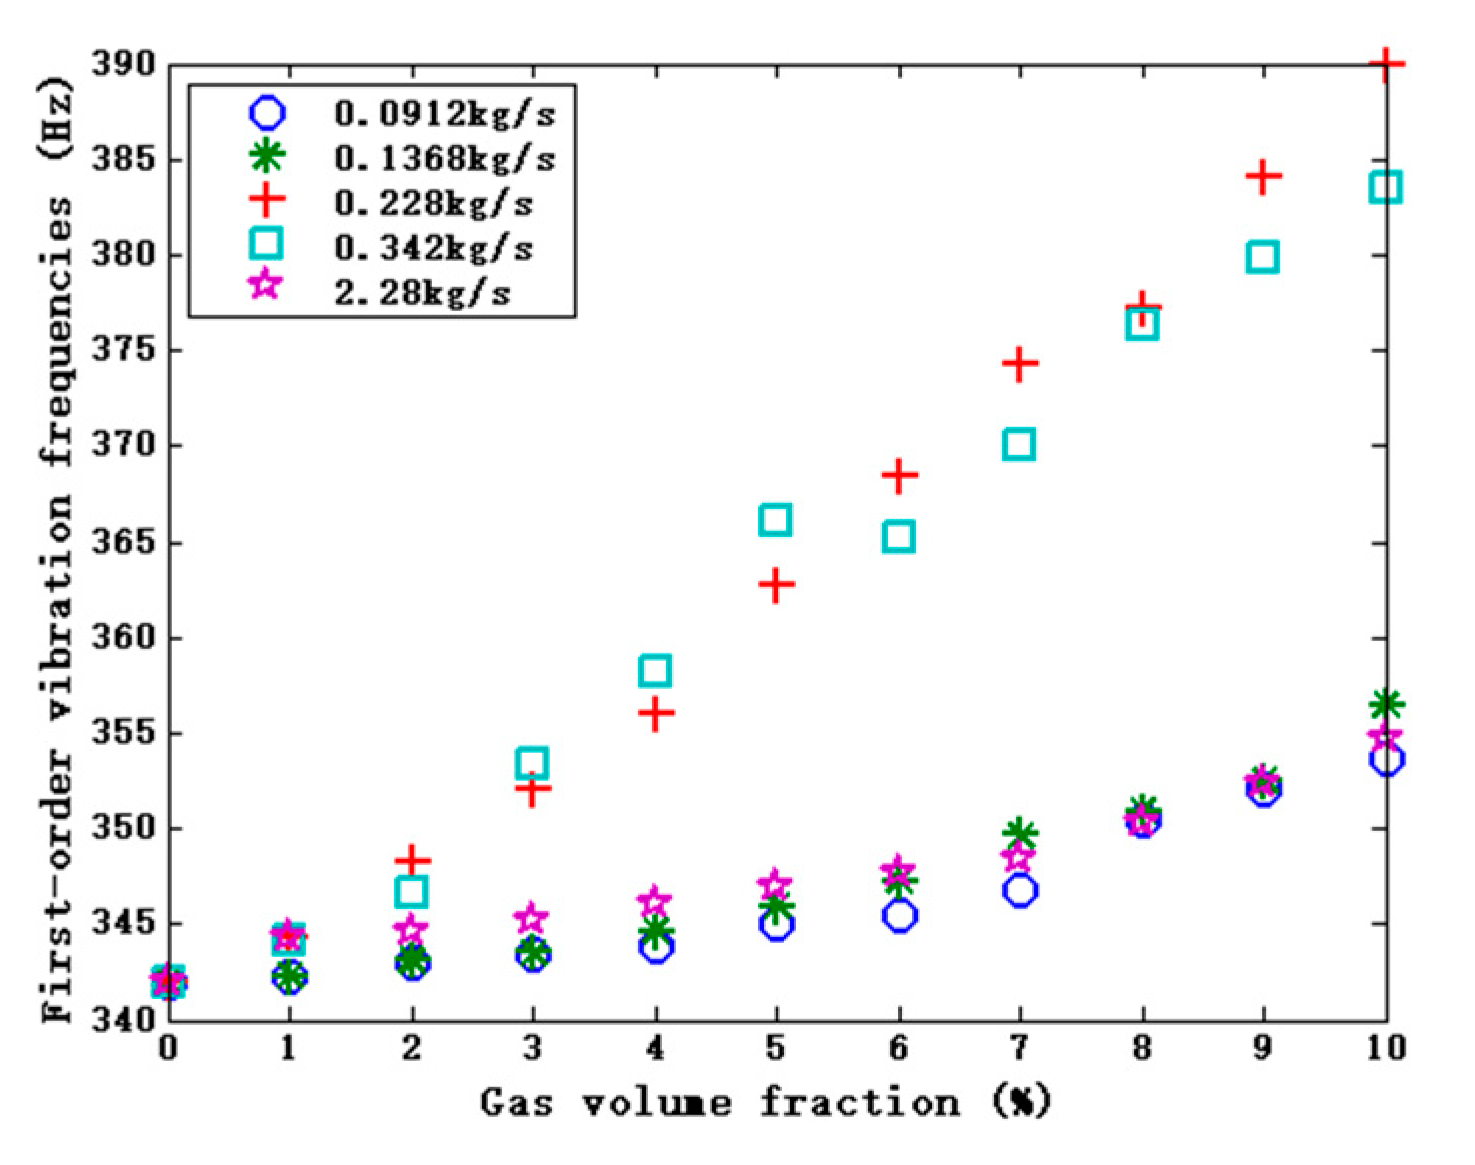
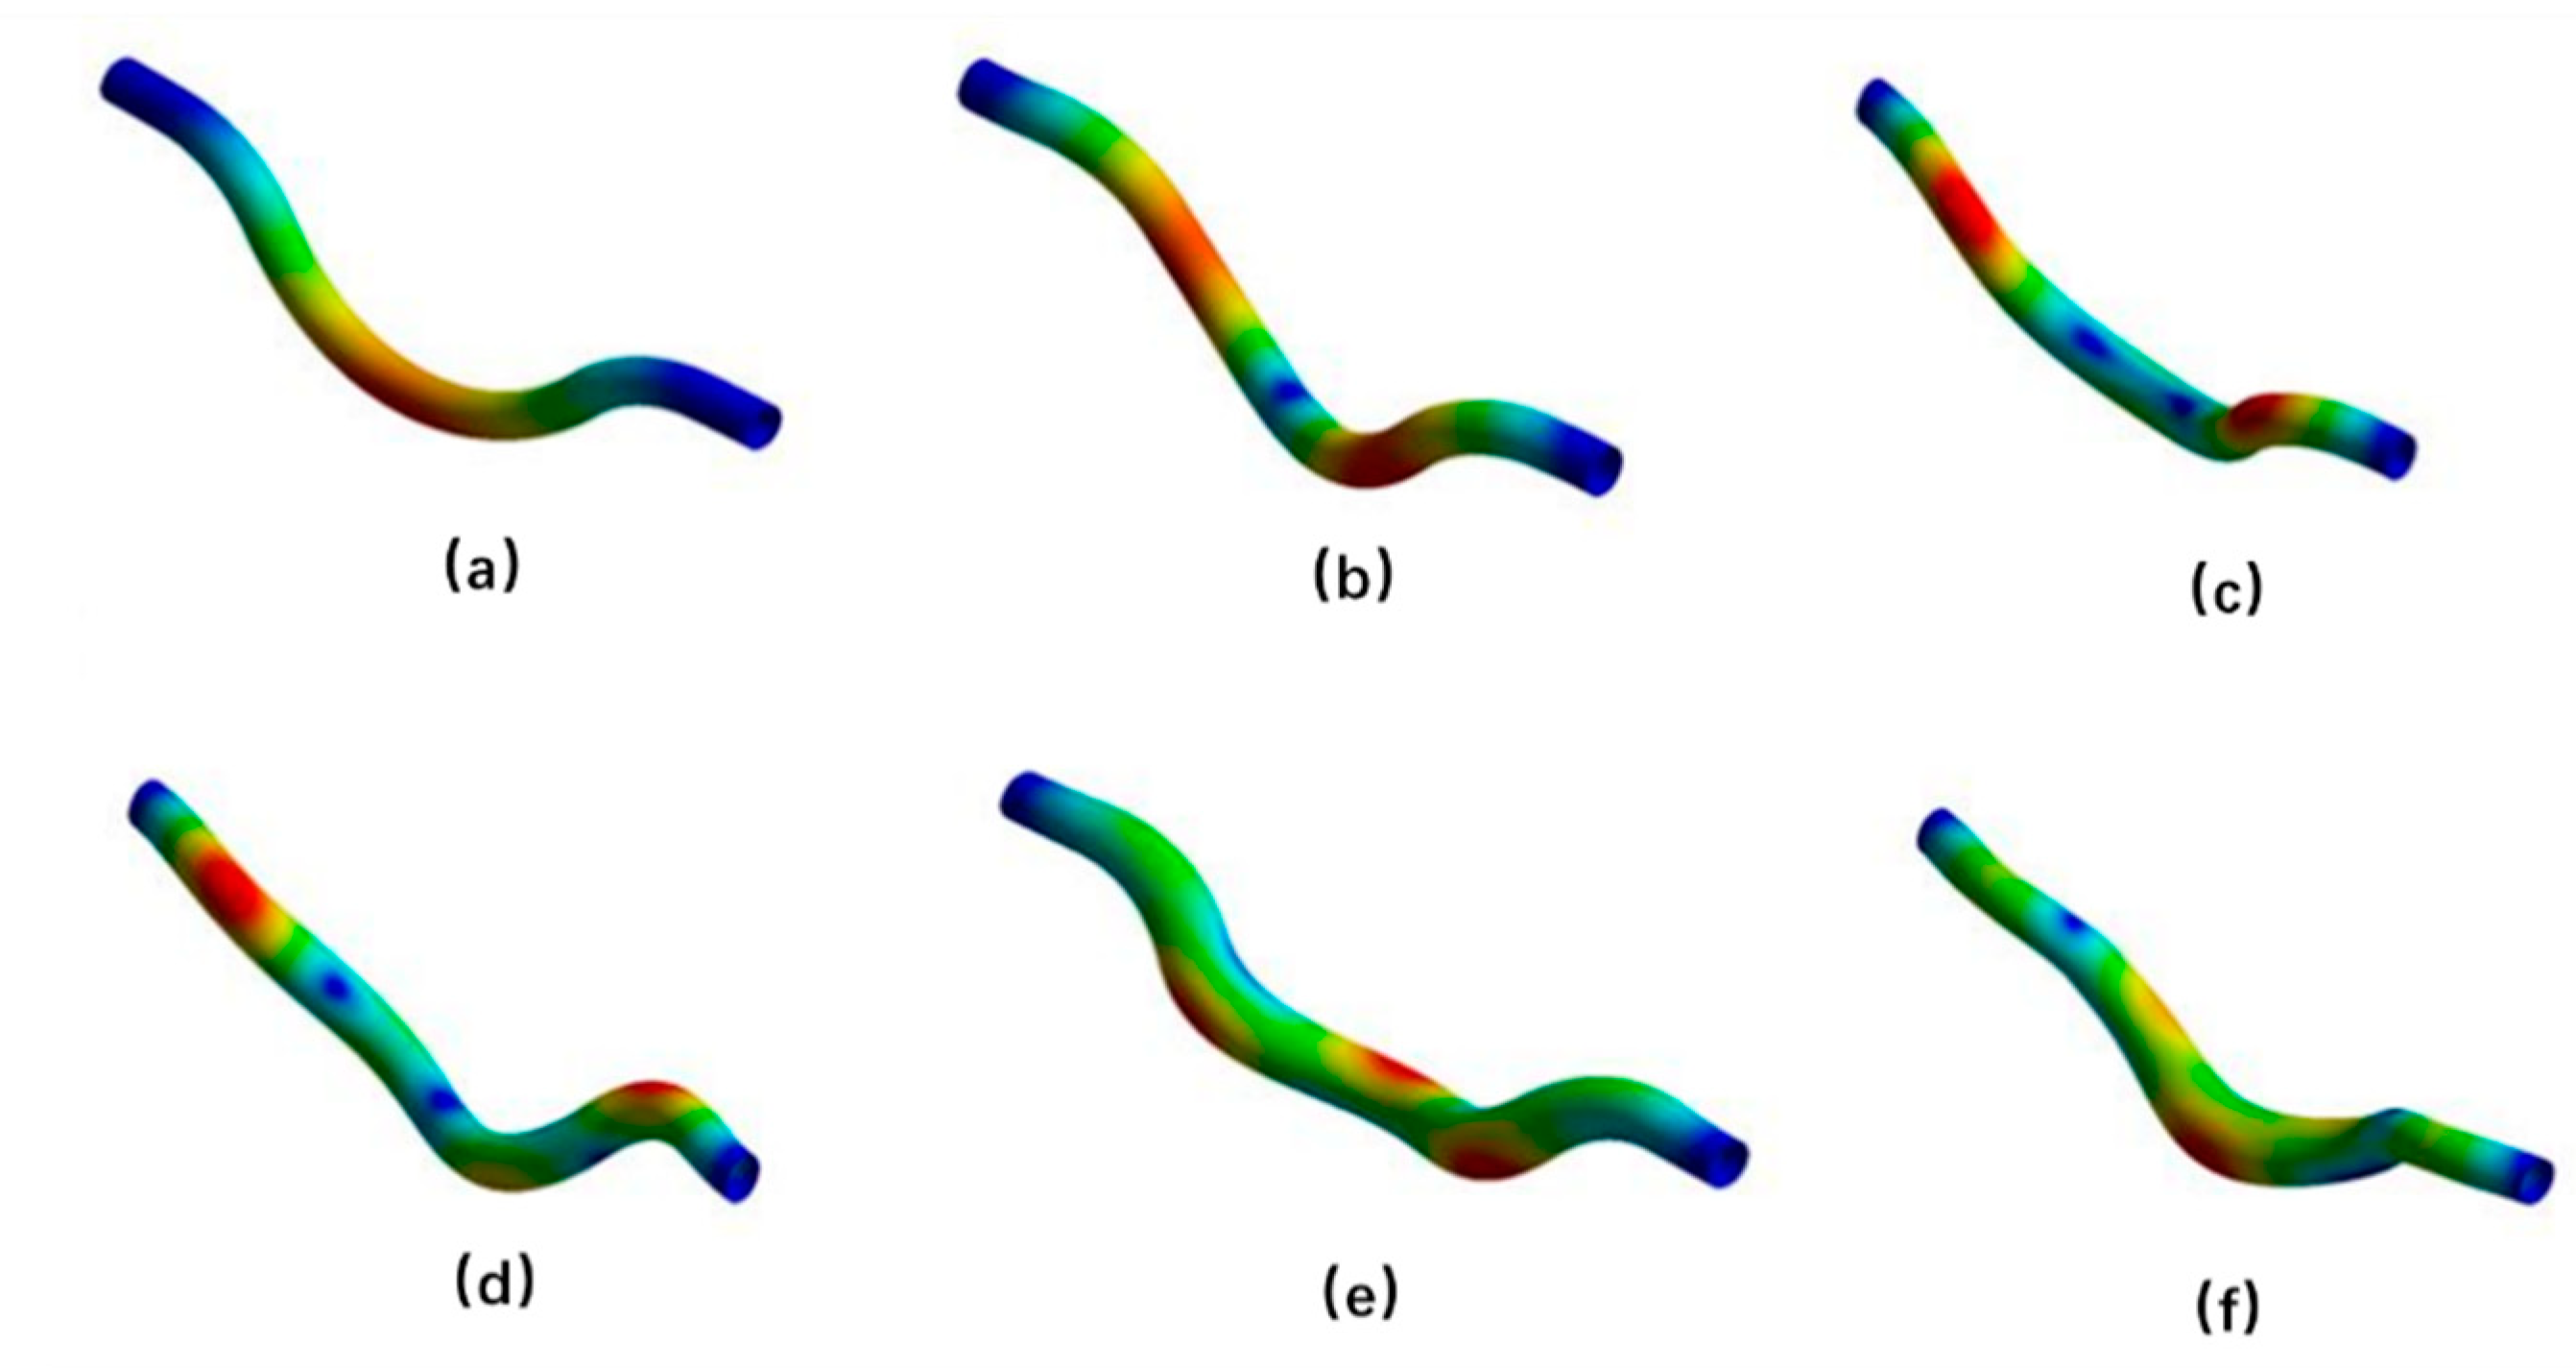
3.1. The Influence of GVF on Vibration Frequency Response of the Measuring Tube

Without considering the influences of flow patterns and other factors, it is only necessary to change GVF to analyze its impact on the vibration frequency responses of a Coriolis flowmeter under different modes. The results of extracting the first six modes are shown in Table 3.
The simulation results of the modal analysis show that with the increase in the GVF entrained in the measured fluid, the mixing density of two-phase fluid flowing through flowmeter decreases, which leads to the weakening of fluid-structure coupling between fluid and pipeline, so the vibration frequency of the tube increases in the natural state. This shows that the vibration frequencies of the measuring tube with flowing fluid depend on the mixing density of the measured fluid and fluid-pipeline interaction. It also shows that the GVF has a certain impact on the vibration response output of measuring tube. The vibration frequency of each order of measuring tube increases with decrease in mixing density of fluid [22]. With an increase in mode, the vibration frequencies also increase by multiples.
The flow patterns in gas-liquid two-phase flow are complex and variable. The uncertainty of flow conditions is also one of critical factors that affect the accuracy in gas-liquid phase-separation metering. Therefore, the influence of flow patterns on the vibration frequencies of a single-frequency Coriolis flowmeter is analyzed in the next section.

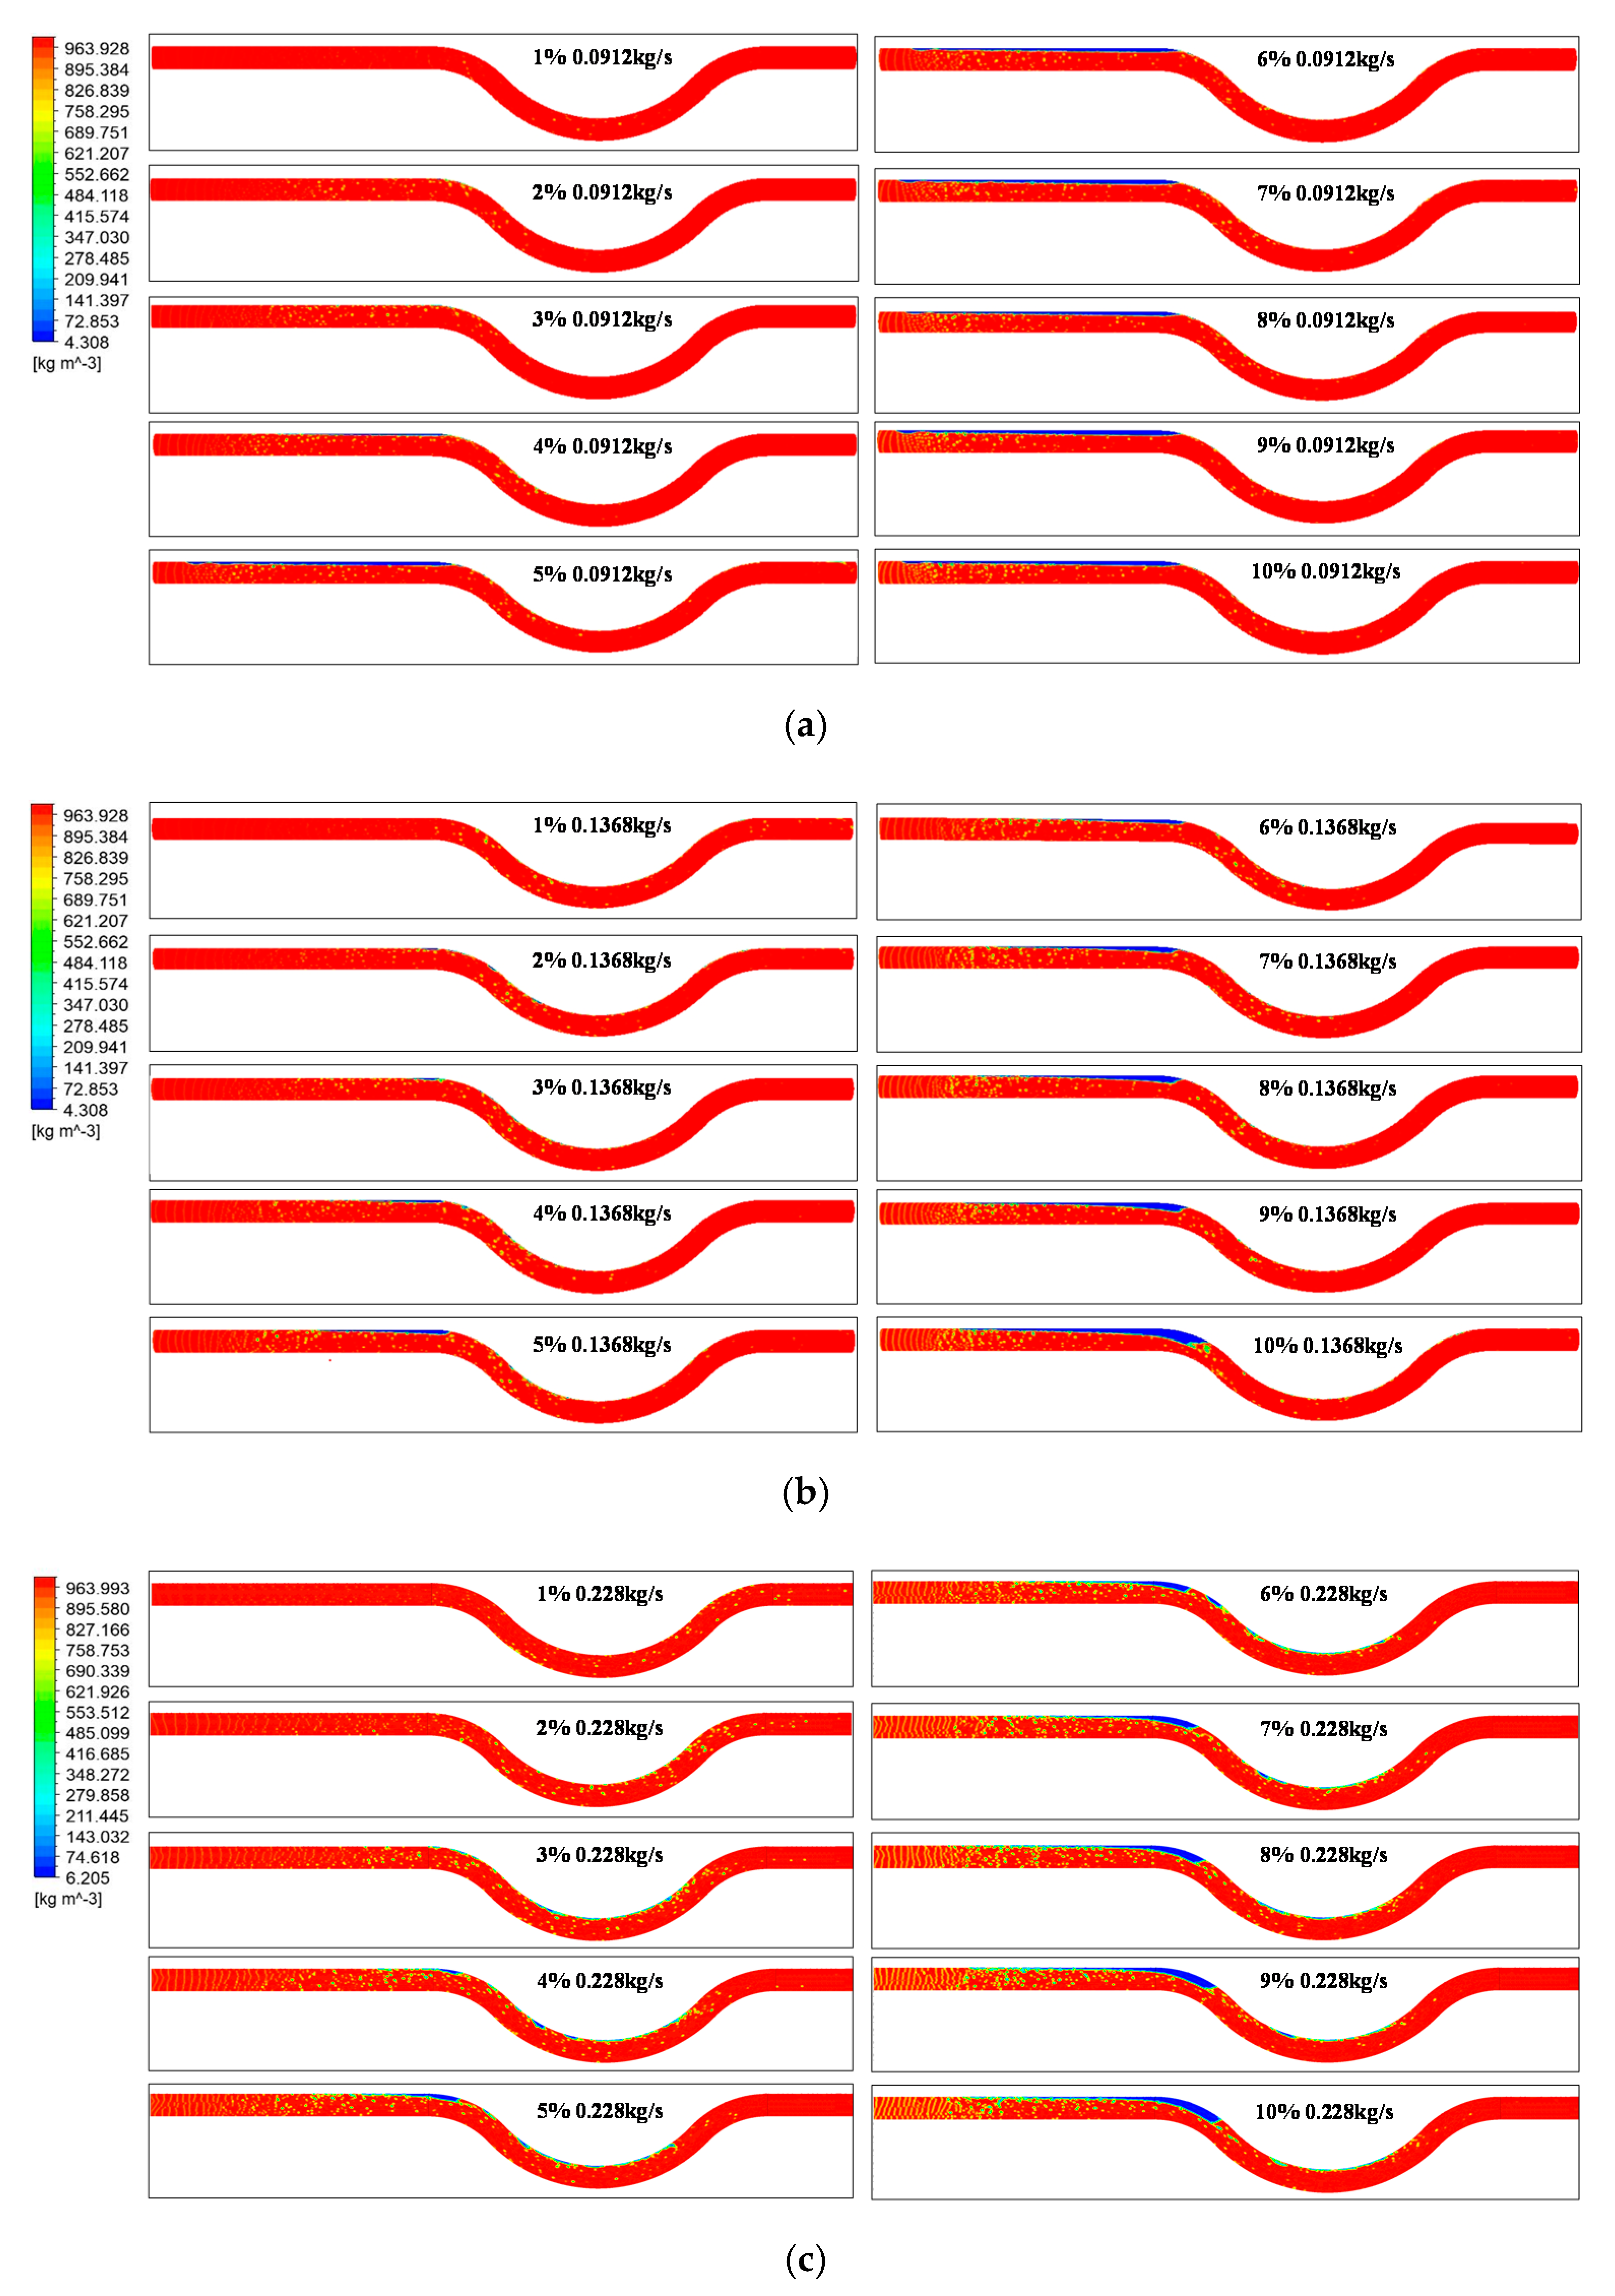
3.2. The Influence of Flow Patterns on Vibration Frequency Response of the Measuring Tube

The total mass flow inlet parameters of two-phase fluid (the real values of total mass flow) are respectively set to five conditions: 0.09120, 0.1368, 0.228, 0.3420, and 2.280 kg/s. The flow patterns are shown in Figure 3.
Figure 3 shows the simulation results of stratified flow and bubble flow. When GVF ≤ 4%, the flow pattern is bubble flow with small dispersed bubbles. However, in the process of gas-containing fluid flowing through the measuring tube, due to the influence of pressure drop in the pipeline, the bubbles uniformly distributed at the back of the tube are slightly larger than those at the front. When GVF > 4%, The flow patterns change with the initial total flow at the inlet. When the total mass flow is low (0.09120~0.3420 kg/s), due to a density difference between gas and liquid, the liquid flows at the bottom of the pipe. The gas flows through the liquid and distributes it in the upper part of the pipeline. The two phases are completely separated by gas-liquid cross-section, showing stratified flow [23]. With the increase in the total mass flow of gas-containing fluid to 2.280 kg/s, bubbles are easy to break under the action of the high-speed flow of fluid, forming a bubble flow with uniform distribution.
The deviations of vibration frequencies and phase differences of Coriolis flowmeter measuring tube are not only related to the gas content entrained by the measured fluid, but the flow patterns may also have a more significant impact on it. The vibration frequencies of high-order mode increase with the order as a multiple of the basic working vibration frequency. Therefore, the first-order frequency is extracted, as shown in Figure 4.
It can be seen from Figure 4 that the vibration frequencies of the tube increase with the entrained gas content when the two-phase fluid with the same mass flow flows through measuring tube. Its frequencies are closely related to the mixing density and fluid-solid coupling of the measured fluid. Besides, when the total mass flow of two-phase fluid with the same density changes, the vibration frequencies of the measuring tube also change. This also means that the flow patterns affect fluid-pipeline coupling, thus influencing the vibration frequencies of the tube. The generation of stratified flow weakens the coupling between the fluid and the pipe, which may be due to the relative motion of the gas and liquid phases to form a wholly separated flow state. In bubble flow, the more uniform the bubble distribution, the stronger the coupling effect. This is because the existence of uniform bubbles only affects the change in mixing density and increase in compressibility but does not show the occupation of liquid space.

4. Deviation Correction Model Based on Multi-Frequency Coriolis Principle

Through the analysis of the qualitative relationship between gas-liquid two-phase flow (GVF, flow patterns) and the vibration responses of the measuring tube in the previous section, the measurement deviations of the total density and mass flow of gas-containing fluid with a single-frequency Coriolis flowmeter is closely related to the influences of physical parameters of fluid on the vibration characteristics in the different modes. Therefore, based on the multi-frequency response characteristics of a Coriolis flowmeter, a deviation correction model of stratified flow is proposed.

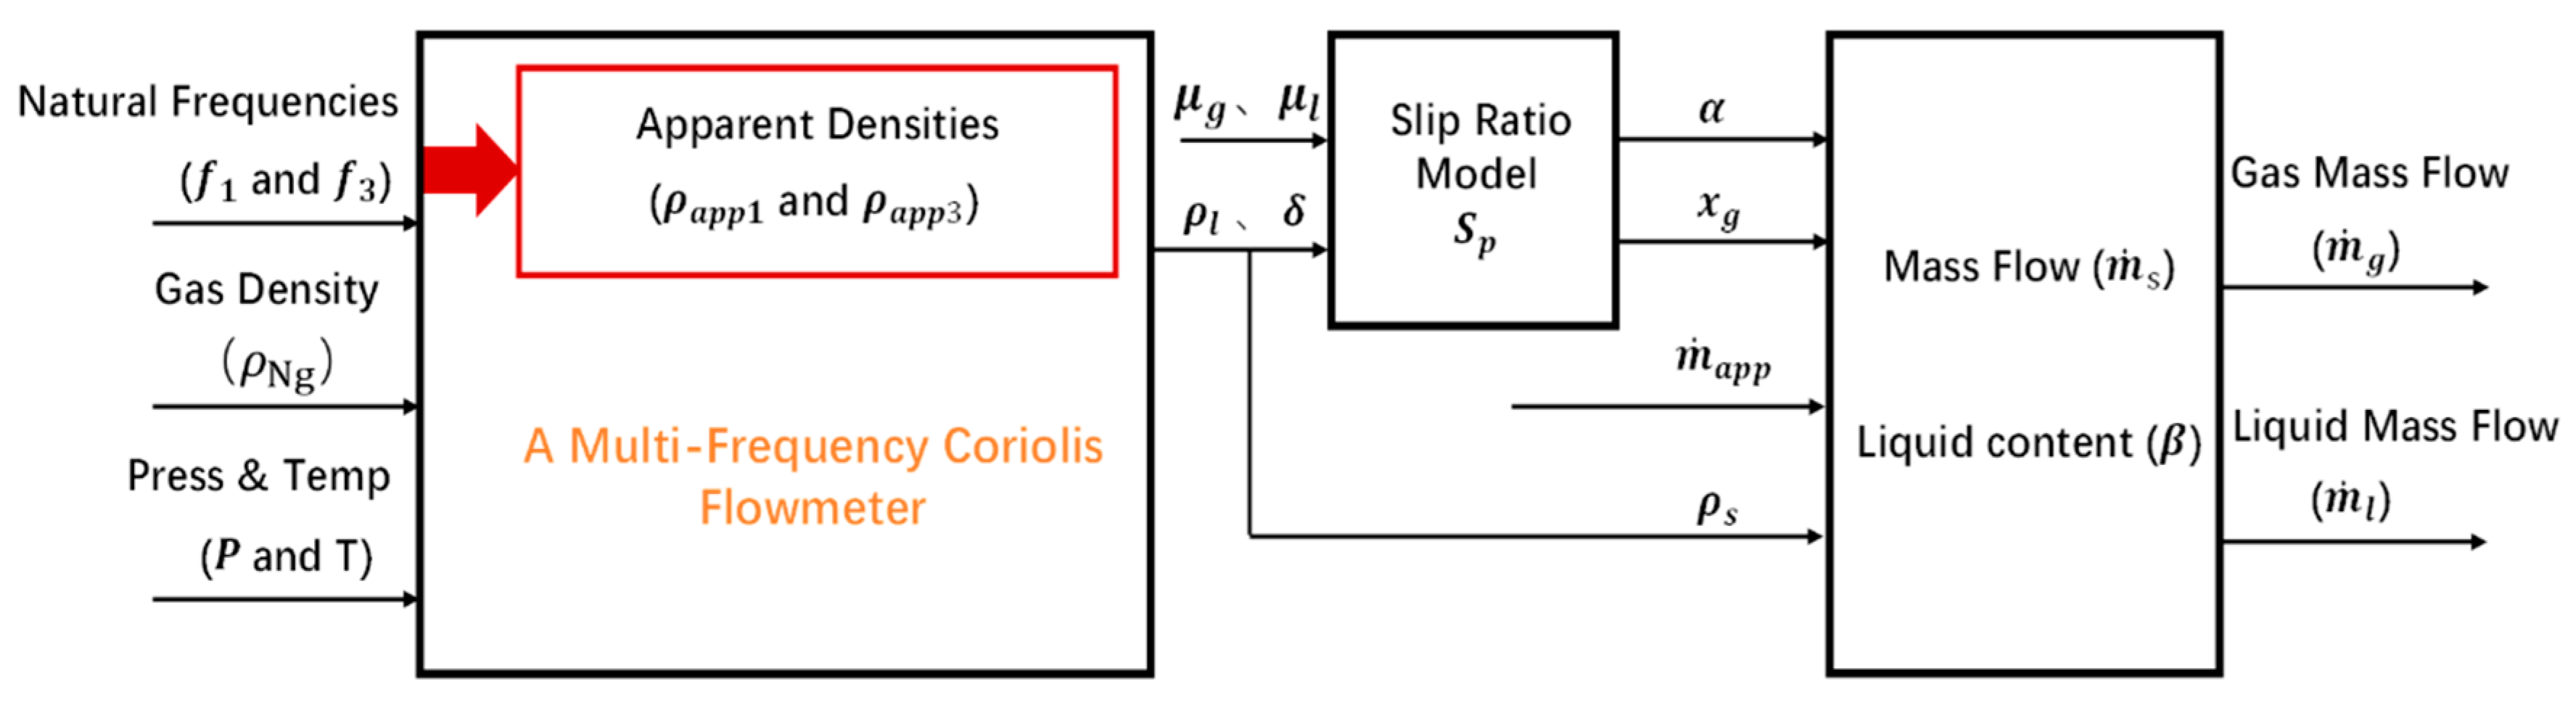
4.1. Multi-Frequency Coriolis Principle

The multi-frequency Coriolis principle refers to the multi-frequency response characteristics of Coriolis flowmeters and the different apparent characteristics of the same measured fluid based on the basic working principle of single-frequency Coriolis flowmeters to adequately compensate the deviations of bubble effect and resonance effect caused by the entrained gas.
The selection of an additional vibration mode in the metering method based on the multi-frequency Coriolis principle is based on the vibration parameters and dynamic characteristics generated by the fluid flow in tube. It can be seen from the first six modes of the micro-bend measuring tube (Figure 5) that the basic working mode is characterized by reciprocating vibration in the horizontal direction. As the vertical direction of driving coil is taken as the central axis, the vibration mode is symmetrical, the second-order vibration mode is in an antisymmetric shape, the third-order mode is similar to that of the first-order, but its vibration frequencies increase obviously; other higher-order ones are more complicated.
In addition to the basic working mode, the third-order vibration mode of Coriolis flowmeters can also measure the fluid density (Equation (12)), which provides additional information for the phase-separation metering of gas-containing fluids. The third-order mode shape is similar to the first-order, but its corresponding vibration frequency is about five times higher than that of the first order. Such two modes can be driven by the same driver installed at the bottom of the measuring tube.
ρ app 3 = 1064.57 + 5.69 × 10 9 1 f 3 2
where f 3 is the third-order vibration frequency obtained by modal analysis of the Coriolis flowmeter measuring tube.
The same two-phase fluid has different effects on the vibration response of the Coriolis flowmeter measuring tube. The qualitative relationship between the gas-containing fluid (GVF, flow patterns) and the vibration response (first and third-order vibration frequencies) of the instrument measuring tube is obtained:
( ρ , α , m ˙ ) = f ( f 1 , f 3 , m ˙ a p p ) = f ( ρ a p p 1 ( f 1 ) , ρ a p p 3 ( f 3 ) , m ˙ a p p )
where ρ and m ˙ represent the corrected values of the total density and mass flow in the gas-liquid two-phase flow, respectively.
Therefore, for the phase-separation metering of the gas-liquid two-phase flows, an additional independent measurement parameter ( ρ a p p 3 ( f 3 )) can be added to on the premise of the multi-parameter measurement ( ρ a p p 1 ( f 1 ), m ˙ a p p ) of the traditional single-frequency Coriolis flowmeters to calculate the total density of liquid-phase, volume void fraction (or cross-section void fraction) and total mass flow. Then the gas-phase and liquid-phase mass flows are obtained. In order to improve the metering accuracy of Coriolis flowmeters for gas-containing fluids and intricate flow patterns, it is a more feasible phase-separation metering method to establish a deviation compensation model for different flow conditions in actual working conditions. The stratified flow is used as a research object to develop a compensation model for phase-separation metering in this paper.

4.2. The Correction Model with Stratified Flow Based on the Multi-Frequency Coriolis Principle

For gas-liquid two-phase stratified flow, there is relative motion between the gas and liquid phases. Each phase medium has a different average flow velocity and independent physical property parameters [24]. The expression of the total density of fluid with slippage loss is different from bubble flow [25]:
ρ s = ρ g δ + ρ l ( 1 δ )
where the cross-section void fraction δ is expressed as follows:
δ = A g A = A g A g + A l
where A g and A l represent the gas-phase and the liquid-phase cross-sectional area, respectively.
In the stratified flow, the ratio of gas volume flow through the same section to the total volume flow of fluid is not equal to the gas volume fraction, which is caused by the velocity difference between gas and liquid phases. The ratio between these two velocities is called slip ratio:
S p = u g u l
where u g and u l refer to the real velocities of the gas and liquid phases, respectively.
The slip ratio is expressed in Equation (17), which is also a function of the gas mass fraction:
δ = 1 1 + ( 1 x g x g ) ( ρ g ρ l ) S p
Based on the research results of Lockhart and Martinelli [26], the slip ratio can also be calculated by the following expression:
S p = 0.28 ( 1 x g x g ) 0.36 ( ρ g ρ l ) 0.64 ( μ l μ g ) 0.07
where μ is the dynamic viscosity under the standard condition.
The combination of Equations (15) and (16) can be obtained:
δ = 1 1 + 0.28 ( 1 x g x g ) 0.64 ( ρ g ρ l ) 0.36 ( μ l μ g ) 0.07
The expression of gas mass fraction is as follows:
x g = m ˙ g m ˙ s = m ˙ g m ˙ g + m ˙ l
where m ˙ s is the total mass flow of stratified flow.
Considering the influence of bubble effect and resonance effect, the transfer function of the vibration system when the two-phase fluid flows through the measuring tube is [13]:
H ( j ω ) = ω 2 [ m 2 + m 1 1 1 k f 2 j m 1 k f 3 Q 0 ( 1 k f 2 ) 2 ]
where k f = ω / ω 0 = f / f 0 , ω and ω 0 are angular frequencies corresponding to f and f 0 respectively; Q 0 is the mass factor of resonator; m 1 is the active mass of asynchronous oscillation with the measuring tube in the tube; m 2 is the inactive part of synchronous oscillation with the measuring tube. The transfer function (19) is divided into the real part and imaginary part: the real part defines the mass flow measurement effect of gas-containing fluid; the imaginary part expresses the damping effect of two-phase fluid. This expression shows the relationship between the excitation and the reaction force when the two-phase fluid is still in the measuring tube.
The gas and liquid phases flow asynchronously in stratified flow. The unit mass of gas and liquid phases contained in the total mass of the fluid in the pipeline is expressed by the cross-section void fraction as follows:
m s g = ρ g A F δ
m s l = ρ l A F ( 1 δ )
Of course, this also corresponds to the active mass part and the inactive mass part of the measured fluid in the pipeline. Therefore, substituting Equations (22) and (23) into the real part of Equation (24), it can be obtained:
Re ( j ω ) = ω 2 [ m s l + m s g 1 1 k f 2 ]   = ω 2 [ ρ l A F ( 1 δ ) + ρ g A F δ 1 1 k f 2 ]
Without considering the bubble effect and resonance effect, the transfer function is expressed as:
H ( j ω ) = ω 2 ρ l A F ( 1 α )
Therefore, by comparing the Equations (24) and (25), the measurement deviation expression in the stratified flow is obtained as follows:
E ρ = ρ g δ ( 1 + k f 2 ) ρ l ( 1 δ ) = ρ g δ ρ l ( 1 δ ) ( 1 1 f 2 f 0 2 )
The relative deviation of density in the gas-containing fluid measured by a Coriolis flowmeter is expressed as follows:
E ρ = ρ a p p ρ ρ
Combining Equations (24) and (25) can be obtained:
ρ a p p = ρ g · δ ( 1 1 f 2 f 0 2 ) + ρ l · ( 1 δ )
where the resonance frequency f 0 is a variable parameter of gas content and liquid density [27].
Two vibration frequencies corresponding to the first and third modes with similar mode shapes are selected, and different apparent characteristics of fluid are used to establish two expressions in the same form as Equation (28):
ρ a p p i = ρ g δ ( 1 1 1 1.179 π 2 R 0 2 δ ( 1 δ ) ρ l f i 2 c g 2 ρ g ) + ρ l ( 1 δ )
where the radius of the measuring tube R 0 is equal to 25.4 mm.
Given the gas density, two expressions the same as Equation (29) are combined to solve two unknown parameters: δ and ρ l . Then the corrected density ρ s in the measured liquid is determined. Finally, the gas mass fraction x g can be obtained from Equation (19) by using the obtained cross-section void fraction and liquid density.
In addition, the GVF in the stratified flow can be calculated from Equation (30):
α = 1 1 + 1 δ δ 1 S p
Stratified flow is the flow of gas and liquid-phase in the pipeline, in which the two phases are in a stable flow state. Therefore, the mass flow deviation of stratified flow is compensated by the gas mass fraction x g .
So the expression of the corrected mass flow in the stratified flow can be obtained as follows:
m ˙ s = 1 x g m ˙ g
However, the gas entrained by the measured fluid accounts for a certain amount of total fluid mass. Similarly, the apparent value of total mass flow in gas-containing fluid is expressed as follows:
m ˙ app = 1 x ag m ˙ g
where x a g is the apparent value of the gas mass fraction, which is calculated as follows:
x a g = 1 1 α a ρ l ρ g + ( 1 ρ l ρ g )
where a a is the original measurement value of the GVF entrained by the measured fluid, which is obtained by using the density apparent value obtained by a single-frequency Coriolis flowmeter in the numerical simulation on the premise of the mass conservation law in three-phase flow.
Therefore, it is known that a single-frequency Coriolis flowmeter can directly calculate the apparent value of the total mass flow m ˙ a p p in the gas-containing fluid by using the simulation results of the phase difference of the measuring tube. After the compensation of the stratified flow correction model based on the multi-frequency Coriolis principle, the total mass flow correction value in the gas-containing fluid can be calculated:
m ˙ s = m ˙ a p p 1 + E m ˙ s
Substituting Equations (30) and (31) into the above equation, the corrected relative deviation of total mass flow in the stratified flow is obtained:
E m ˙ s = x g x a g 1
So the gas and liquid mass flow in the gas-liquid two-phase stratified flow are as follows:
m ˙ g = x g m ˙ s
m ˙ l = β m ˙ s ρ s ρ l
As described above, the calculation block diagram of the multi-frequency compensation model for the stratified flow is shown in Figure 6. Where ρ Ng is the gas density under standard conditions (20 °C, 101.325 kPa).

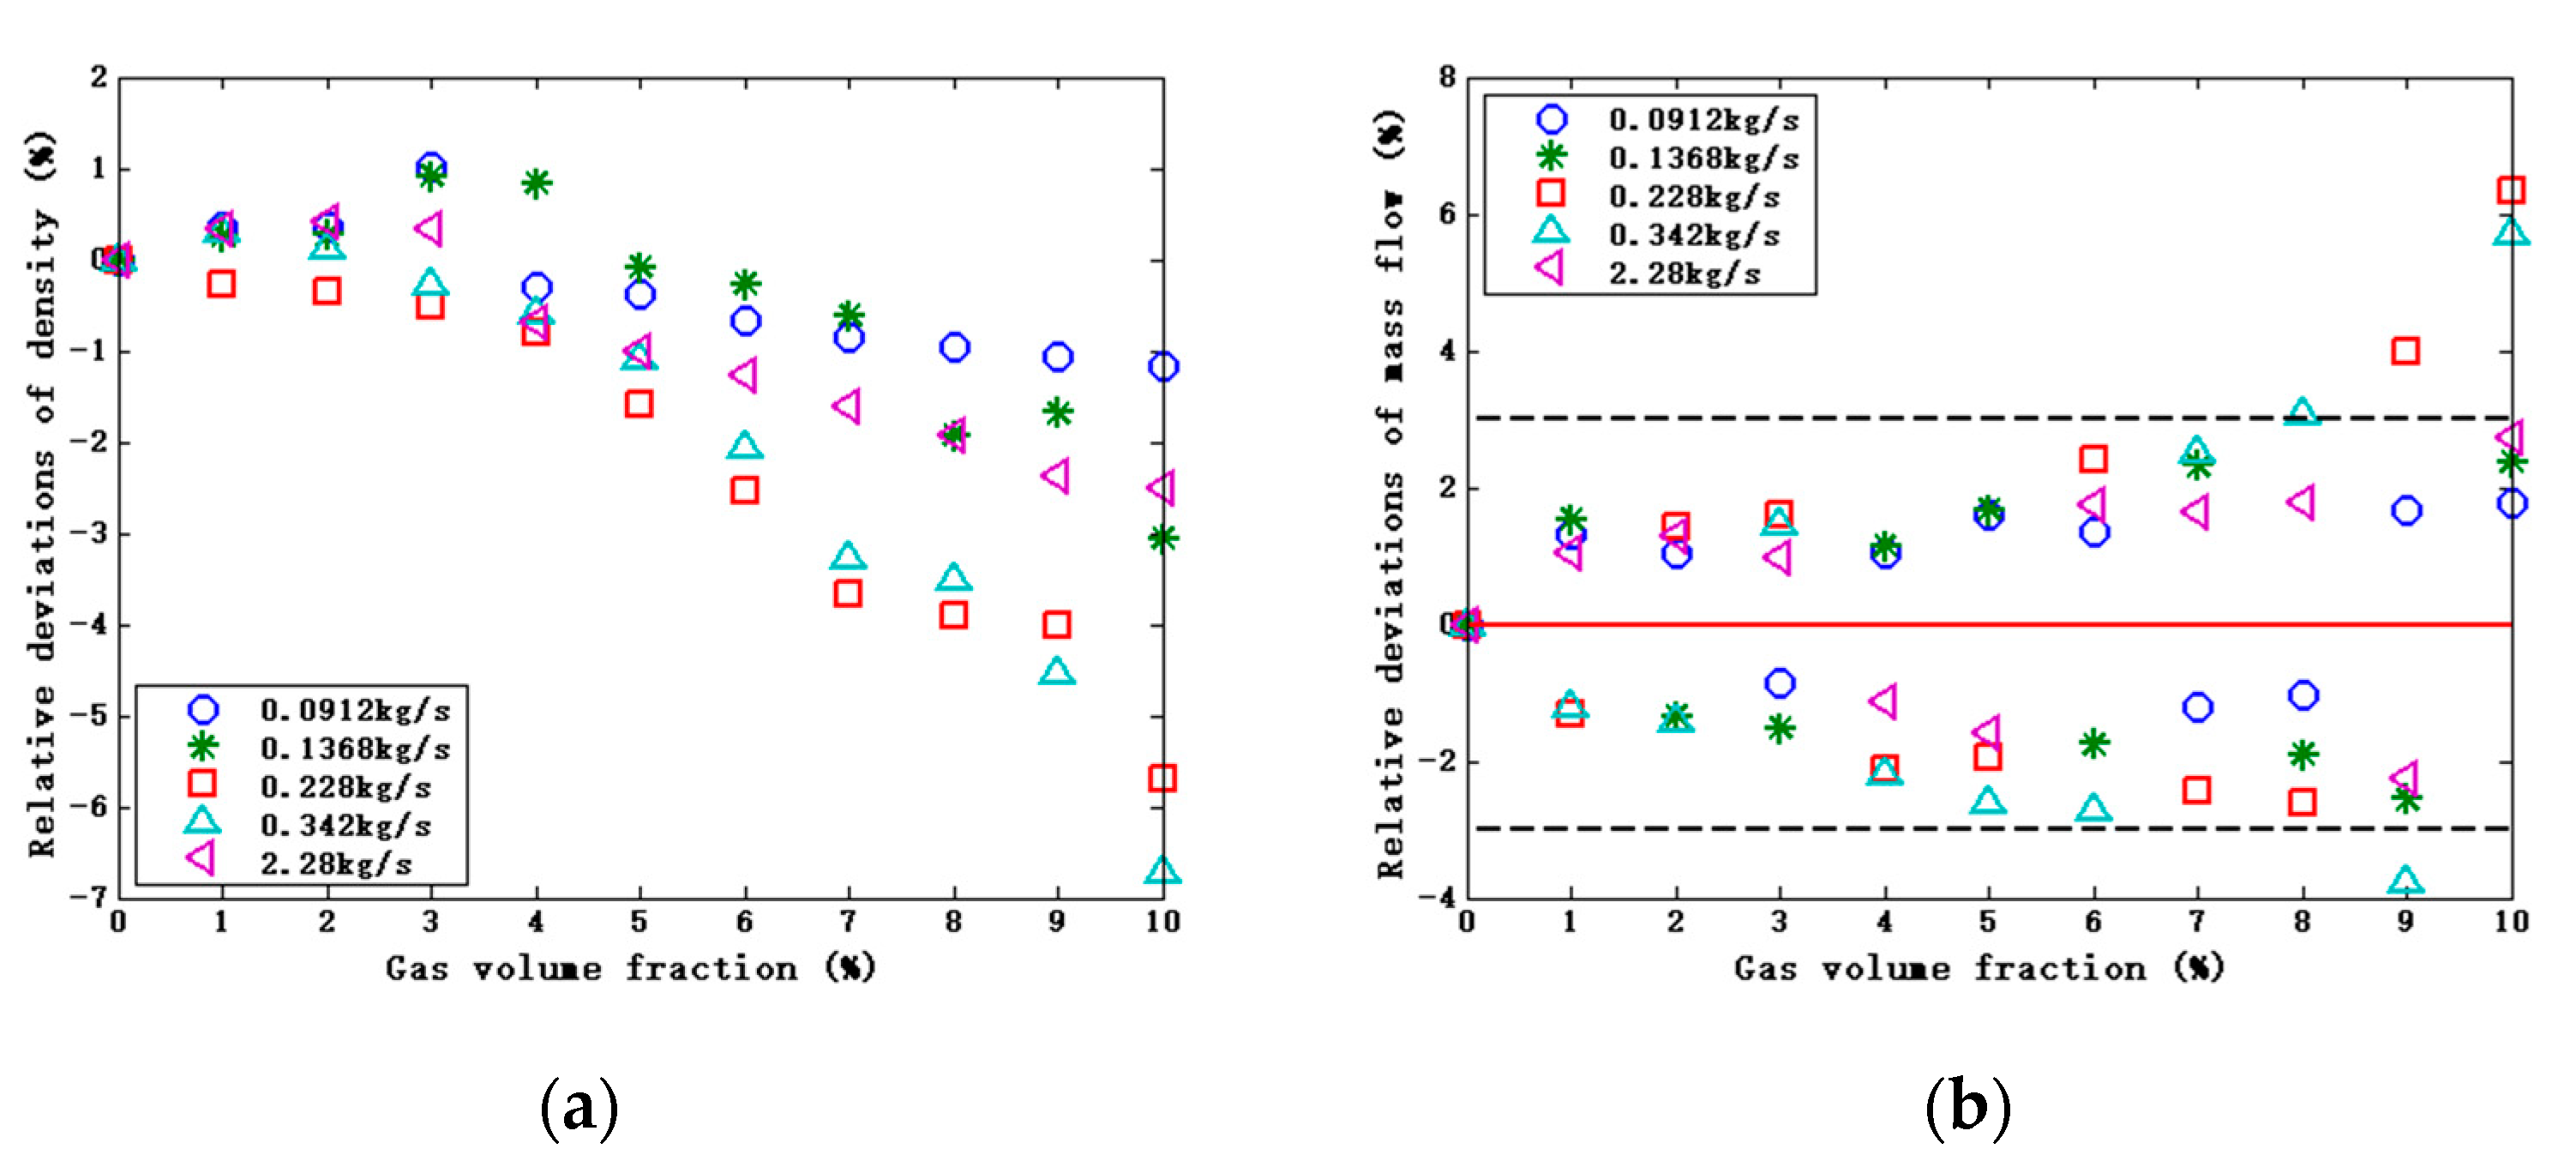
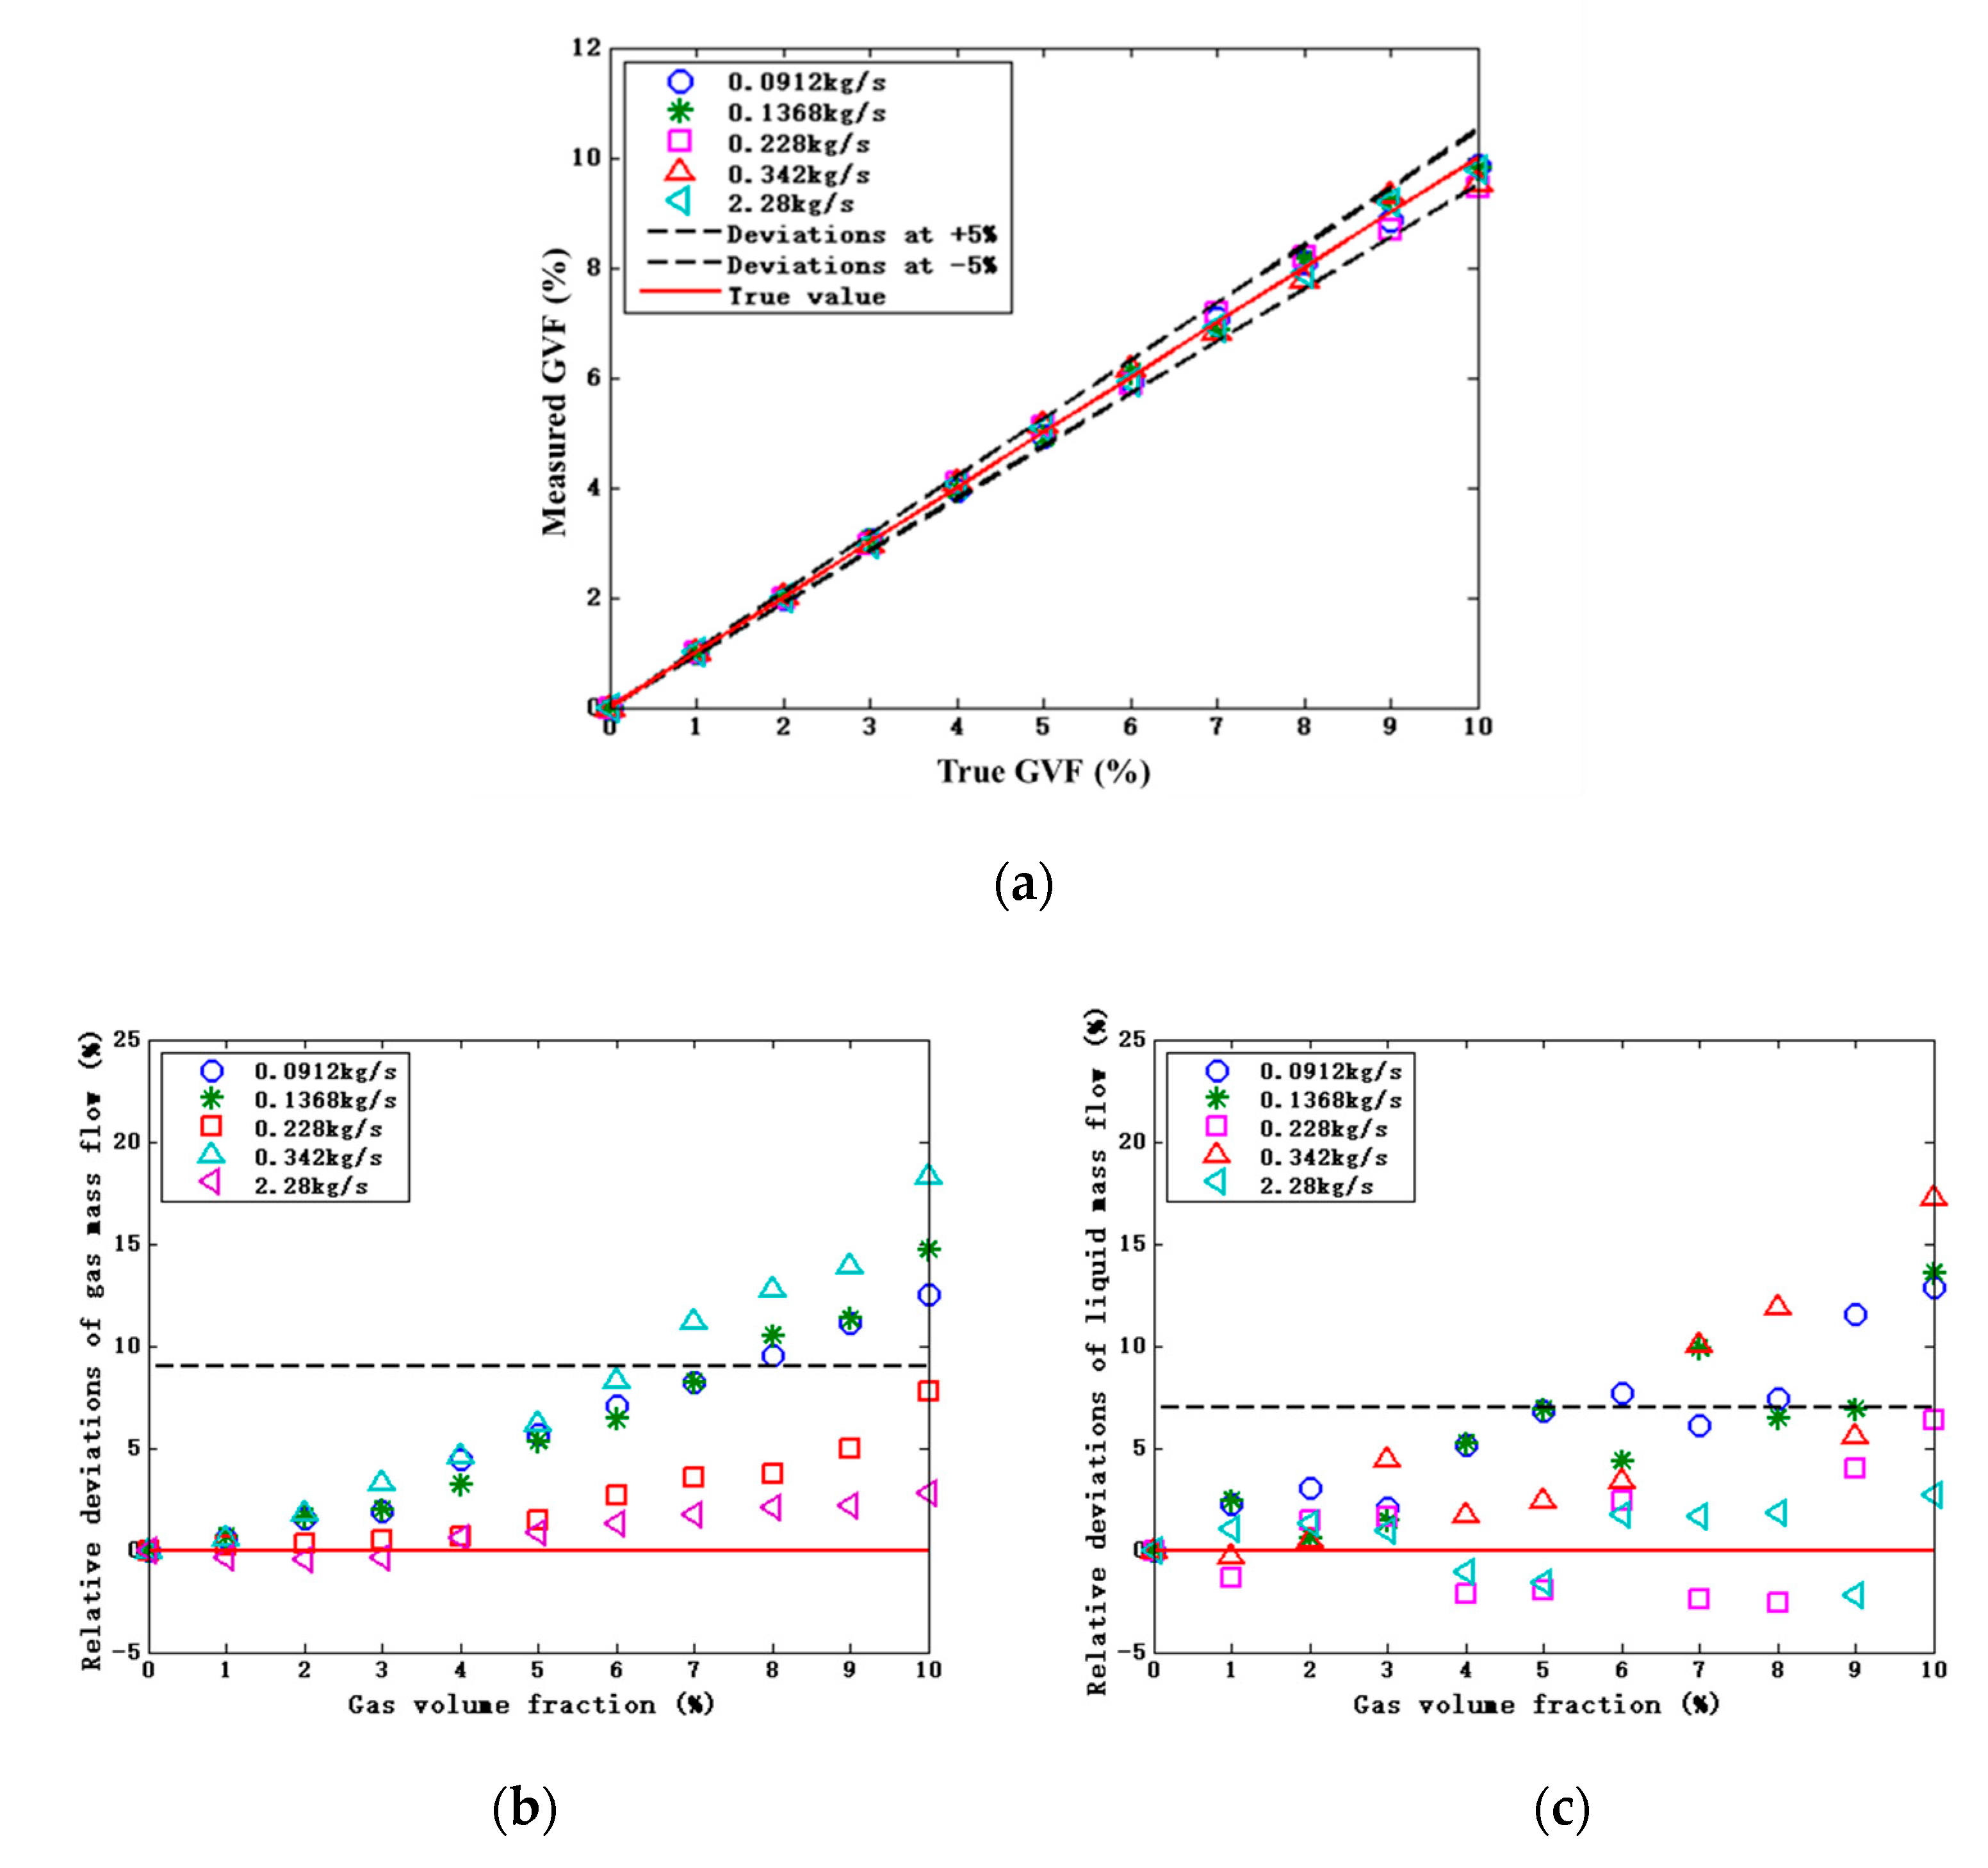
4.3. Analysis of Correction Results

The frequencies of the basic working mode (first-order mode) and the phase differences of the measuring tube under their vibration frequencies obtained by the numerical simulation method are used to determine the original measurement values of the total density and mass flow in gas-containing fluid by a single-frequency Coriolis flowmeter through Equations (8) and (9), respectively. Then, the deviations of the apparent density and mass flow are obtained from Equations (36) and (37). Furthermore, the influence of flow patterns on the total density and mass flow deviations in gas-containing fluid with a single-frequency Coriolis flowmeter is analyzed. The results are shown in Figure 7.
E ρ 1 = ρ a p p 1 ρ 0 ρ 0
E m ˙ 1 = m ˙ a p p m ˙ 0 m ˙ 0
where ρ 0 and m ˙ 0 represent the actual values of density and mass flow of two-phase fluid, respectively.
The corrected relative deviations of total density and mass flow in the measured fluid are calculated from Equations (40) and (41), which can analyze the correction effect of the stratified flow measurement model based on the multi-frequency Coriolis principle. The correction results are shown in Figure 8.
E ρ 2 = ρ s ρ 0 ρ 0
E m ˙ 2 = m ˙ s m ˙ 0 m ˙ 0
The comparison of the results in Figure 7 and Figure 8 shows that the correction effect of the stratified flow metering compensation model based on the multi-frequency Coriolis principle is significant. Before the correction, the maximum relative deviation of the total density with a single-frequency Coriolis flowmeter is −37.3%, and the total mass flow is not more than −9.3%. The results of the stratified flow correction model based on the multi-frequency Coriolis principle show that the relative deviations of total density are less than ±4% from 92% measured fluid, the relative deviations of mass flow are less than ±3% from 90% measured fluid. In the stratified flow ( m ˙ 0 = 0.2280 ~ 0.3420 kg/s), there are different coupling forces between the gas and liquid phases and the pipeline, which leads to more significant deviations in the vibration frequencies of the pipe. Of course, in the uniform bubble flow, the distribution of bubble size also plays an essential role in the measurement accuracy of the fluid. The low flow ( m ˙ 0 = 0.09120~0.1368 kg/s) and light mass of stratified flow in the straight pipe section make the existence of small suspended bubbles have little influence on the vibration response of the pipe, so the correction result of small suspended bubble flow is better than that of uniform bubble flow.
Taking the two vibration frequencies of the measuring tube, and apparent densities of the measured fluid as the input parameters, the calculated gas and liquid contents can be converted to the gas-phase and liquid-phase mass flows in the stratified flow. The corrected relative deviations in the gas-liquid two-phase flow are obtained from Equations (42) and (43), respectively. The calculation results are shown in Figure 9.
E m ˙ g = m ˙ g m ˙ s g m ˙ s g
E m ˙ l = m ˙ l m ˙ s l m ˙ s l
where m ˙ s g and m ˙ s l represent the actual values of gas and liquid mass flow in the two-phase fluid (inlet setting values of gas and liquid phases in numerical simulation).
It can be seen from Figure 9 that the correction effect of this metering model is noticeable: the deviations of predicted gas content are less than ±5% from 98.1% measured fluid; the gas and liquid mass flow are not more than ±9% and ±7% from 84.3% measured fluid, respectively. However, the compensation effect gradually weakens as the GVF increases. The reason may be that the higher GVF leads to a weaker fluid-solid coupling between the fluid and the pipe, which causes a more significant deviation in the output of the pipeline vibration frequency and also reduces the metering accuracy of phase-separation content in the measured fluid.

5. Comparison of Correction Results

The stratified flow correction model based on the multi-frequency Coriolis principle established in this paper quantitatively analyzes the correction deviations of total density and mass flow in the gas-containing fluid. The measurement results are compared and analyzed with the correction model of uniform bubble flow based on the multi-frequency Coriolis principle (Equation (44)) proposed by Zhu to determine a flow pattern with the best correction effect [13].
ρ ( r 0 + r 1 1 1 f i 2 f 0 2 ) = c 0 i + c 1 i 1 f i 2   ( i = 1 , 3 ) m ˙ u b = m ˙ a p p 1 + 2 E ρ u b
The comparison between the uniform bubble flow correction model based on the multi-frequency Coriolis principle and the stratified flow correction method proposed in this paper is shown in Figure 10. In the uniform bubble flow ( α 0 ≤ 4% or m ˙ 0 = 2.280 kg/s), the correction results of the uniform bubble flow method based on the multi-frequency Coriolis principle are less than ±2.5% and ±5.0% respectively for the compensation of the total density and mass flow in the fluid. However, the correction effect of this metering model on stratified flow is not ideal, in which the density and mass flow deviations are more than −20% from 70% measured fluid. After the modification of the stratified flow model based on the multi-frequency Coriolis principle, the total density is less than ±4.0% from 92.3% measured fluid, and the total mass flow is less than ±3.0% from 90% measured fluid. The maximum deviation of density and mass flow in the bubble flow is −2.5% and 2.7%, respectively. The maximum deviation in the stratified flow is −6.7% and 6.3%, respectively. The application effect of the modified model in stratified flow is better than that of the method proposed by Zhu. Of course, from the comparison of the correction results under different flow patterns, the correction effect of small suspension bubble flow and uniform bubble flow is relatively good.
Figure 11 shows the comparison of the phase-separation mass flows measured by the correction method of uniform bubble flow and with stratified flow based on the multi-frequency Coriolis principle. The correction effect of the multi-frequency metering method is closely related to the flow conditions in the gas-containing fluid. The correction method of uniform bubble flow based on the multi-frequency Coriolis principle is not ideal to compensate for the stratified flow ( m ˙ 0 = 0.2280 kg/s and 0.3420 kg/s).

6. Conclusions

The entrainment of gas will increase the errors of the existing non-separated multiphase metering. This paper proposes a method for each-phase metering based on the multi-frequency Coriolis principle to solve these problems. The simulation results with a single-frequency Coriolis flowmeter show that the maximum relative deviations of total density and total mass flowrate are −37.3% and −9.3%, respectively. The vibrational responses characteristics corresponding to the first-order and third-order modes of the measuring tube were selected and analyzed. Based on the qualitative relationship between the change of the physical parameters of the fluid and the corresponding vibration response of different modes of the measuring tube, a correction model suitable for stratified flow based on the multi-frequency Coriolis principle was established. The compensation results show that the total density and mass flow deviations of the gas-containing fluid are within ±4.1% and ±3.2%, respectively, and the flow deviations of gas-phase and liquid-phase are reduced to ±9.1% and ±7.2%, respectively. The accuracy of the stratified flow metering method based on the multi-frequency Coriolis principle can meet the requirements of wellhead measurement.
However, this paper only uses the simulation results to verify the application effect of the wellhead measurement method based on the multi-frequency Coriolis principle, and further field experiments will be caught out to optimize further the modified model combined with the field test results.

Author Contributions

All authors analyzed the data and were involved in writing the manuscript. C.H. conceived the idea of the study, analyzed the data and revised the manuscript. Y.Y. designed the experiments, analyzed the data and wrote the initial draft of the manuscript. S.S. performed the experiments and wrote the initial draft of the manuscript. H.Z. and L.X. analyzed the data and revised the manuscript. All authors have read and agree to the published version of the manuscript.

Funding

This research was funded by the Science Foundation of Shandong Province (CN) [grant number ZR2016EEM46].

Conflicts of Interest

All authors declare no conflict of interest.

References

  1. Han, G.; Tan, C. Determination of oil well production rate by analysis of the real-time dynamometer card. In Proceedings of the SPE Annual Technical Conference and Exhibition, Society of Petroleum Engineers, Dubai, UAE, 26–28 September 2016. [Google Scholar]
  2. Mahmoud, M.; Azzi, A.; Ghendour, N.; Kharoua, N.; Khezzar, L.; AlHosani, E. Multiphase flow meters targeting oil & gas industries. Measurement 2020, 165, 108111. [Google Scholar]
  3. Zhu, H.; Rieder, A.; Lin, Y. An Innovative Technology for Coriolis Metering under Entrained Gas Conditions; Endress+Hauser Flowtec AG: KägenStr, Reinach, 2016. [Google Scholar]
  4. Tan, C.; Wu, H.; Dong, F. Mass flow rate measurement of oil-water two-phase flow by a long-waist cone meter. IEEE Trans. Instrum. Meas. 2013, 62, 2795–2804. [Google Scholar] [CrossRef]
  5. Zhang, F.; Dong, F.; Tan, C. High GVF and low pressure gas–liquid two-phase flow measurement based on dual-cone flowmeter. Flow Meas. Instrum. 2010, 21, 410–417. [Google Scholar] [CrossRef]
  6. Basse, N.T. A review of the theory of Coriolis flowmeter measurement errors due to entrained particles. Flow Meas. Instrum. 2014, 37, 107–118. [Google Scholar] [CrossRef]
  7. Hemp, J.; Kutin, J. Theory of errors in Coriolis flowmeter readings due to compressibility of the fluid being metered. Flow Meas. Instrum. 2006, 17, 359–369. [Google Scholar] [CrossRef]
  8. Gysling, D.L. An aeroelastic model of Coriolis mass and density meters operating on aerated mixtures. Flow Meas. Instrum. 2007, 18, 69–77. [Google Scholar] [CrossRef]
  9. Liu, R.P.; Fuent, M.J.; Henry, M.; Duta, M.D. A neuronal network to correct mass flow errors caused by two-phase flow in a digital Coriolis mass flowmeter. Flow Meas. Instrum. 2001, 12, 53–63. [Google Scholar] [CrossRef]
  10. Hemp, J.; Yeung, H. Viscosity-Corrected Flowmeter. U.S. Patent 7072775, 4 July 2006. [Google Scholar]
  11. Henry, M.; Tombs, M.; Zamora, M.; Zhou, F. Coriolis mass flow metering for three-phase flow: A case study. Flow Meas. Instrum. 2013, 30, 112–122. [Google Scholar] [CrossRef]
  12. Wang, L.; Yan, Y. Mass flow measurement of gas-liquid two-phase CO2 in CCS transportation pipelines using Coriolis flowmeters. Int. J. Greenh. Gas Control 2018, 68, 269–275. [Google Scholar] [CrossRef]
  13. Zhu, H. Application of Coriolis Mass Flowmeters in Bubbly or Particulate Two Phase Flows; University of Erlangen Nuremberg: Erlangen/Nuremberg, Germany, 2008. [Google Scholar]
  14. Zhu, H.; Rieder, A. A moving resonator model of Coriolis flowmeters for measuring two-phase flow. In Proceedings of the 5th International Symposium on Multiphase Flow, Heat Mass Transfer and Energy Conversion, Xi’an, China, 3–6 July 2005. [Google Scholar]
  15. Luo, R.; Wu, J. Fluid-Structure Coupling Analysis and Simulation of Viscosity Effect on Coriolis Mass Flowmeter; APCOM & ISCM: Singapore, 2013. [Google Scholar]
  16. Luo, R.; Dalson, G.A.; Cheong, K.B. Experimental Measurement and CFD Simulation for Characterization of Coriolis Flowmeter Performance. J. Phys. 2018, 1065, 092005. [Google Scholar]
  17. Hua, C.; Sun, S.; Yao, H.; Zhu, H.; Xing, L. A Wellhead Metering Based on Bubble and Resonance Coriolis Effect with Known Gas-Liquid Ratio. Measurement 2020, 155, 107563. [Google Scholar] [CrossRef]
  18. Schollenberger, F.; Weinstein, J.; Shepherd, D. Fluid Characteristic Determination of a Multi-Component Fluid with Compressible and Incompressible Components. U.S. Patent 9383242, 5 July 2016. [Google Scholar]
  19. Wang, T.; Baker, R. Coriolis flowmeters: A review of developments over the past 20 years, and an assessment of the state of the art and likely future directions. Flow Meas. Instrum. 2014, 40, 99–123. [Google Scholar] [CrossRef] [Green Version]
  20. Liu, J.; Wang, T.; Yan, Y. Investigations into the behaviours of Coriolis flowmeters under air-water two-phase flow conditions on an optimized experimental platform. In Proceedings of the IEEE International Instrumentation and Measurement Technology Conference (I2MTC), Houston, TX, USA, 14–17 May 2018. [Google Scholar]
  21. Mandhane, J.M.; Gregory, G.A.; Aziz, K. A flow pattern map for gas-liquid flow in horizontal pipes. Int. J. Multiph. Flow 1974, 1, 537–553. [Google Scholar] [CrossRef]
  22. Yaushev, A.A.; Taranenko, P.A.; Loginovskiy, V.A. Study of the Oscillation Modes of a Coriolis Flowmeter Using a Parametric Finite Element Model, Verified by the Results of Modal Testing. Procedia Eng. 2016, 150, 336–340. [Google Scholar] [CrossRef] [Green Version]
  23. Lips, S.; Meyer, J.P. Stratified flow model for convective condensation in an inclined tube. Int. J. Heat Fluid Flow 2012, 36, 83–91. [Google Scholar] [CrossRef] [Green Version]
  24. Lips, S.; Meyer, J.P. Void fraction measurement of stratified gas-liquid flow based on multi-wire capacitance probe. Exp. Therm. Fluid Sci. 2019, 102, 61–73. [Google Scholar]
  25. Xue, Y.; Li, H.; Hao, C.; Yao, C. Investigation on the void fraction of gas-liquid two-phase flows in vertically-downward pipes. Int. Commun. Heat Mass Transf. 2016, 77, 1–8. [Google Scholar] [CrossRef]
  26. Montoya-Hernández, D.J.; Vázquez-Hernández, A.O.; Cuamatzi, R.; Hernandez, M.A. Natural frequency analysis of a marine riser considering multiphase internal flow behavior. Ocean Eng. 2014, 92, 103–113. [Google Scholar] [CrossRef]
  27. Niknam, P.H.; Fiaschi, D.; Mortaheb, H.R.; Mokhtarani, B. An improved formulation for speed of sound in two-phase systems and development of 1D model for supersonic nozzle. Fluid Phase Equilibria 2017, 446, 18–27. [Google Scholar] [CrossRef]
Figure 1. The structure diagram of a micro-bend Coriolis flowmeter.
Applsci 10 07747 g001
Figure 2. The geometric model of numerical simulation.
Applsci 10 07747 g002
Figure 3. The flow patterns in different total mass flows and Gas Volume Fractions (GVFs); (a) The flow patterns in different Gas Volume Fractions (GVFs) with total mass flow 0.0912 kg/s; (b) The flow patterns in different Gas Volume Fractions (GVFs) with total mass flow 0.1368 kg/s; (c) The flow patterns in different Gas Volume Fractions (GVFs) with total mass flow 0.2280 kg/s.; (d) The flow patterns in different Gas Volume Fractions (GVFs) with total mass flow 0.3420 kg/s; (e) The flow patterns in different Gas Volume Fractions (GVFs) with total mass flow 2.280 kg/s.
Applsci 10 07747 g003aApplsci 10 07747 g003b
Figure 4. The simulation results of flow patterns relative to basic working mode vibration frequencies of the measuring tube.
Applsci 10 07747 g004
Figure 5. The first six order mode shapes of the micro-bend measuring tube. (a) First-order vibration mode; (b) Second-order vibration mode; (c) Third-order vibration mode; (d) Fourth-order vibration mode; (e) fifth-order vibration mode; (f) Sixth-order vibration mode.
Applsci 10 07747 g005
Figure 6. The block diagram of the compensation method with stratified flow based on the multi-frequency Coriolis principle.
Applsci 10 07747 g006
Figure 7. The original deviations of stratified flow relative to GVF before correction. (a) Relative deviations of density. (b) Relative deviations of mass flow.
Applsci 10 07747 g007
Figure 8. The deviations relative to GVF after correction by the proposed compensation model. (a) Relative deviations of density. (b) Relative deviations of mass flow.
Applsci 10 07747 g008
Figure 9. The deviations relative to GVF after correction by the proposed compensation model. (a) Gas-phase content. (b) Relative deviations of Gas-phase mass flow. (c) Relative deviations of Liquid-phase mass flow.
Applsci 10 07747 g009
Figure 10. Comparison of density and mass flow deviation correction results of stratified flow between the uniform bubble flow correction model and the proposed correction model. (a) Comparison of relative deviations of density. (b) Comparison of relative deviations of mass flow.
Applsci 10 07747 g010
Figure 11. Comparison of each-phase measurement deviation correction results of stratified flow between the uniform bubble flow correction model and the proposed correction model. (a) Gas-phase content. (b) Comparison of relative deviations of gas-phase mass flow. (c) Comparison of relative deviations of liquid-phase mass flow.
Applsci 10 07747 g011aApplsci 10 07747 g011b
Table 1. Physical parameters of pure water and gas.
Material ρ (kg/m3) f 1 (Hz) Viscosity (P)t (°C)P (bar)Liquid
Flowrate (t/d)
Water998.2342.00.00100320–604–25<100
Methane4.3084497.61.087 × 10−520–604–25/
Table 2. Inlet setting ranges of gas-liquid two-phase flow simulation.
No. m ˙ 0 (kg/s) m ˙ s l (kg/s) m ˙ s g (10−5 kg/s) Flow Patterns
10.09100.0904–0.08220.3940–3.941Stratified
20.13700.1356–0.12320.5910–5.911Stratified
30.22830.2279–0.22780.9950–10.939Stratified
40.34200.3389–0.30811.478–14.78Stratified
52.2812.280–2.2789.949–109.4Bubble
Table 3. The simulation results of gas-phase content relative to the first six order mode vibration frequencies of the measuring tube.
Gas Volume Fraction (%) f 1 f 2 f 3 f 4 f 5 f 6
1344.310451672238830293148
2346.210511681240130453162
3348.810581693241830673183
4352.010681708244030933209
5354.710761721245831163231
6358.510881739248431483263
7362.310991758251031813294
8367.211141781254332223335
9373.111321809258332723386
10379.911531842263033313445
Where f i is the vibration frequencies of the measuring tube, Hz.
Publisher’s Note: MDPI stays neutral with regard to jurisdictional claims in published maps and institutional affiliations.

