Article

Laser Induced Aggregation of Light Absorbing Particles by Marangoni Convection

School of Instrument Science and Opto-Electronics Engineering, Hefei University of Technology, Hefei 230009, China
*
Author to whom correspondence should be addressed.
Appl. Sci. 2020, 10(21), 7795; https://doi.org/10.3390/app10217795
Submission received: 22 September 2020 / Revised: 26 October 2020 / Accepted: 30 October 2020 / Published: 3 November 2020
(This article belongs to the Special Issue Optical Trapping)

Abstract

:
Laser induced Marangoni convection can be used to accumulate micro-particles. In this paper, a method is developed to control and accumulate the light absorbing particles dispersed in a thin solution layer. The particles are irradiated by a focused laser beam. Due to the photothermal effect of the particles, the laser heating generates a thermal gradient and induces a convective flow around the laser’s heating center. The convective flow drives the particles to accumulate and form a particle aggregate close to the laser’s heating center. The motion of particles is dominated by the Marangoni convection. When the laser power is high, the vapor bubbles generated by laser heating on particles strengthen the convection, which accelerates the particles’ aggregation.

1. Introduction

Light absorbing particles (APs) are usually immersed in the fluid in vivo for applications of diagnosis, in vivo imaging, etc. [1,2,3]. They normally move without control, which reduces their functionality and efficiency. Optical trapping [4,5,6] is a useful technique for the non-contact and non-invasive manipulation of small particles, such as cells [7,8,9], organelles [10,11,12], nanoparticles [13,14,15], colloidal particles [16,17,18], and oil drops [19,20,21]. There is also an intensive study on the use of optical tweezers to drive and control the micro-particles into aggregation [22,23,24,25,26]. Optical tweezers can control transparent particles due to the balance between the gradient force and scattering force [27]. However, optical tweezers always push the APs away from the focus of laser beam [28,29,30]. The optical scattering force on APs is always much larger than the optical gradient force. Furthermore, the motion of the APs is affected severely by particle absorption and the thermal process. Therefore, it is difficult to trap and collect the APs into aggregation via the optical gradient force.
There may be a promising alternative method to control the APs in a solution with a fluidic flow generated by a thermal gradient. The thermal gradient may cause thermal convection [31], thermophoresis [32], and Marangoni convection [23] to drive the particles to migrate. These methods are quite attractive because particles can be trapped over long ranges by the convective flow—consider concentrating DNA [33] and directly assembling micro- and nanoparticles [34,35,36,37,38]. In most of above studies, the particles were dispersed in a thin chamber, which had a light absorbing surface to generate the local thermal gradient. However, the metal coated surface is complicated to fabricate and rarely used for microscopic observation. In this paper, we exploit laser-induced convection to collect the APs in a thin chamber with common coverslip substrate. The thermal gradient is generated by continuous laser heating of the AP aggregate itself.

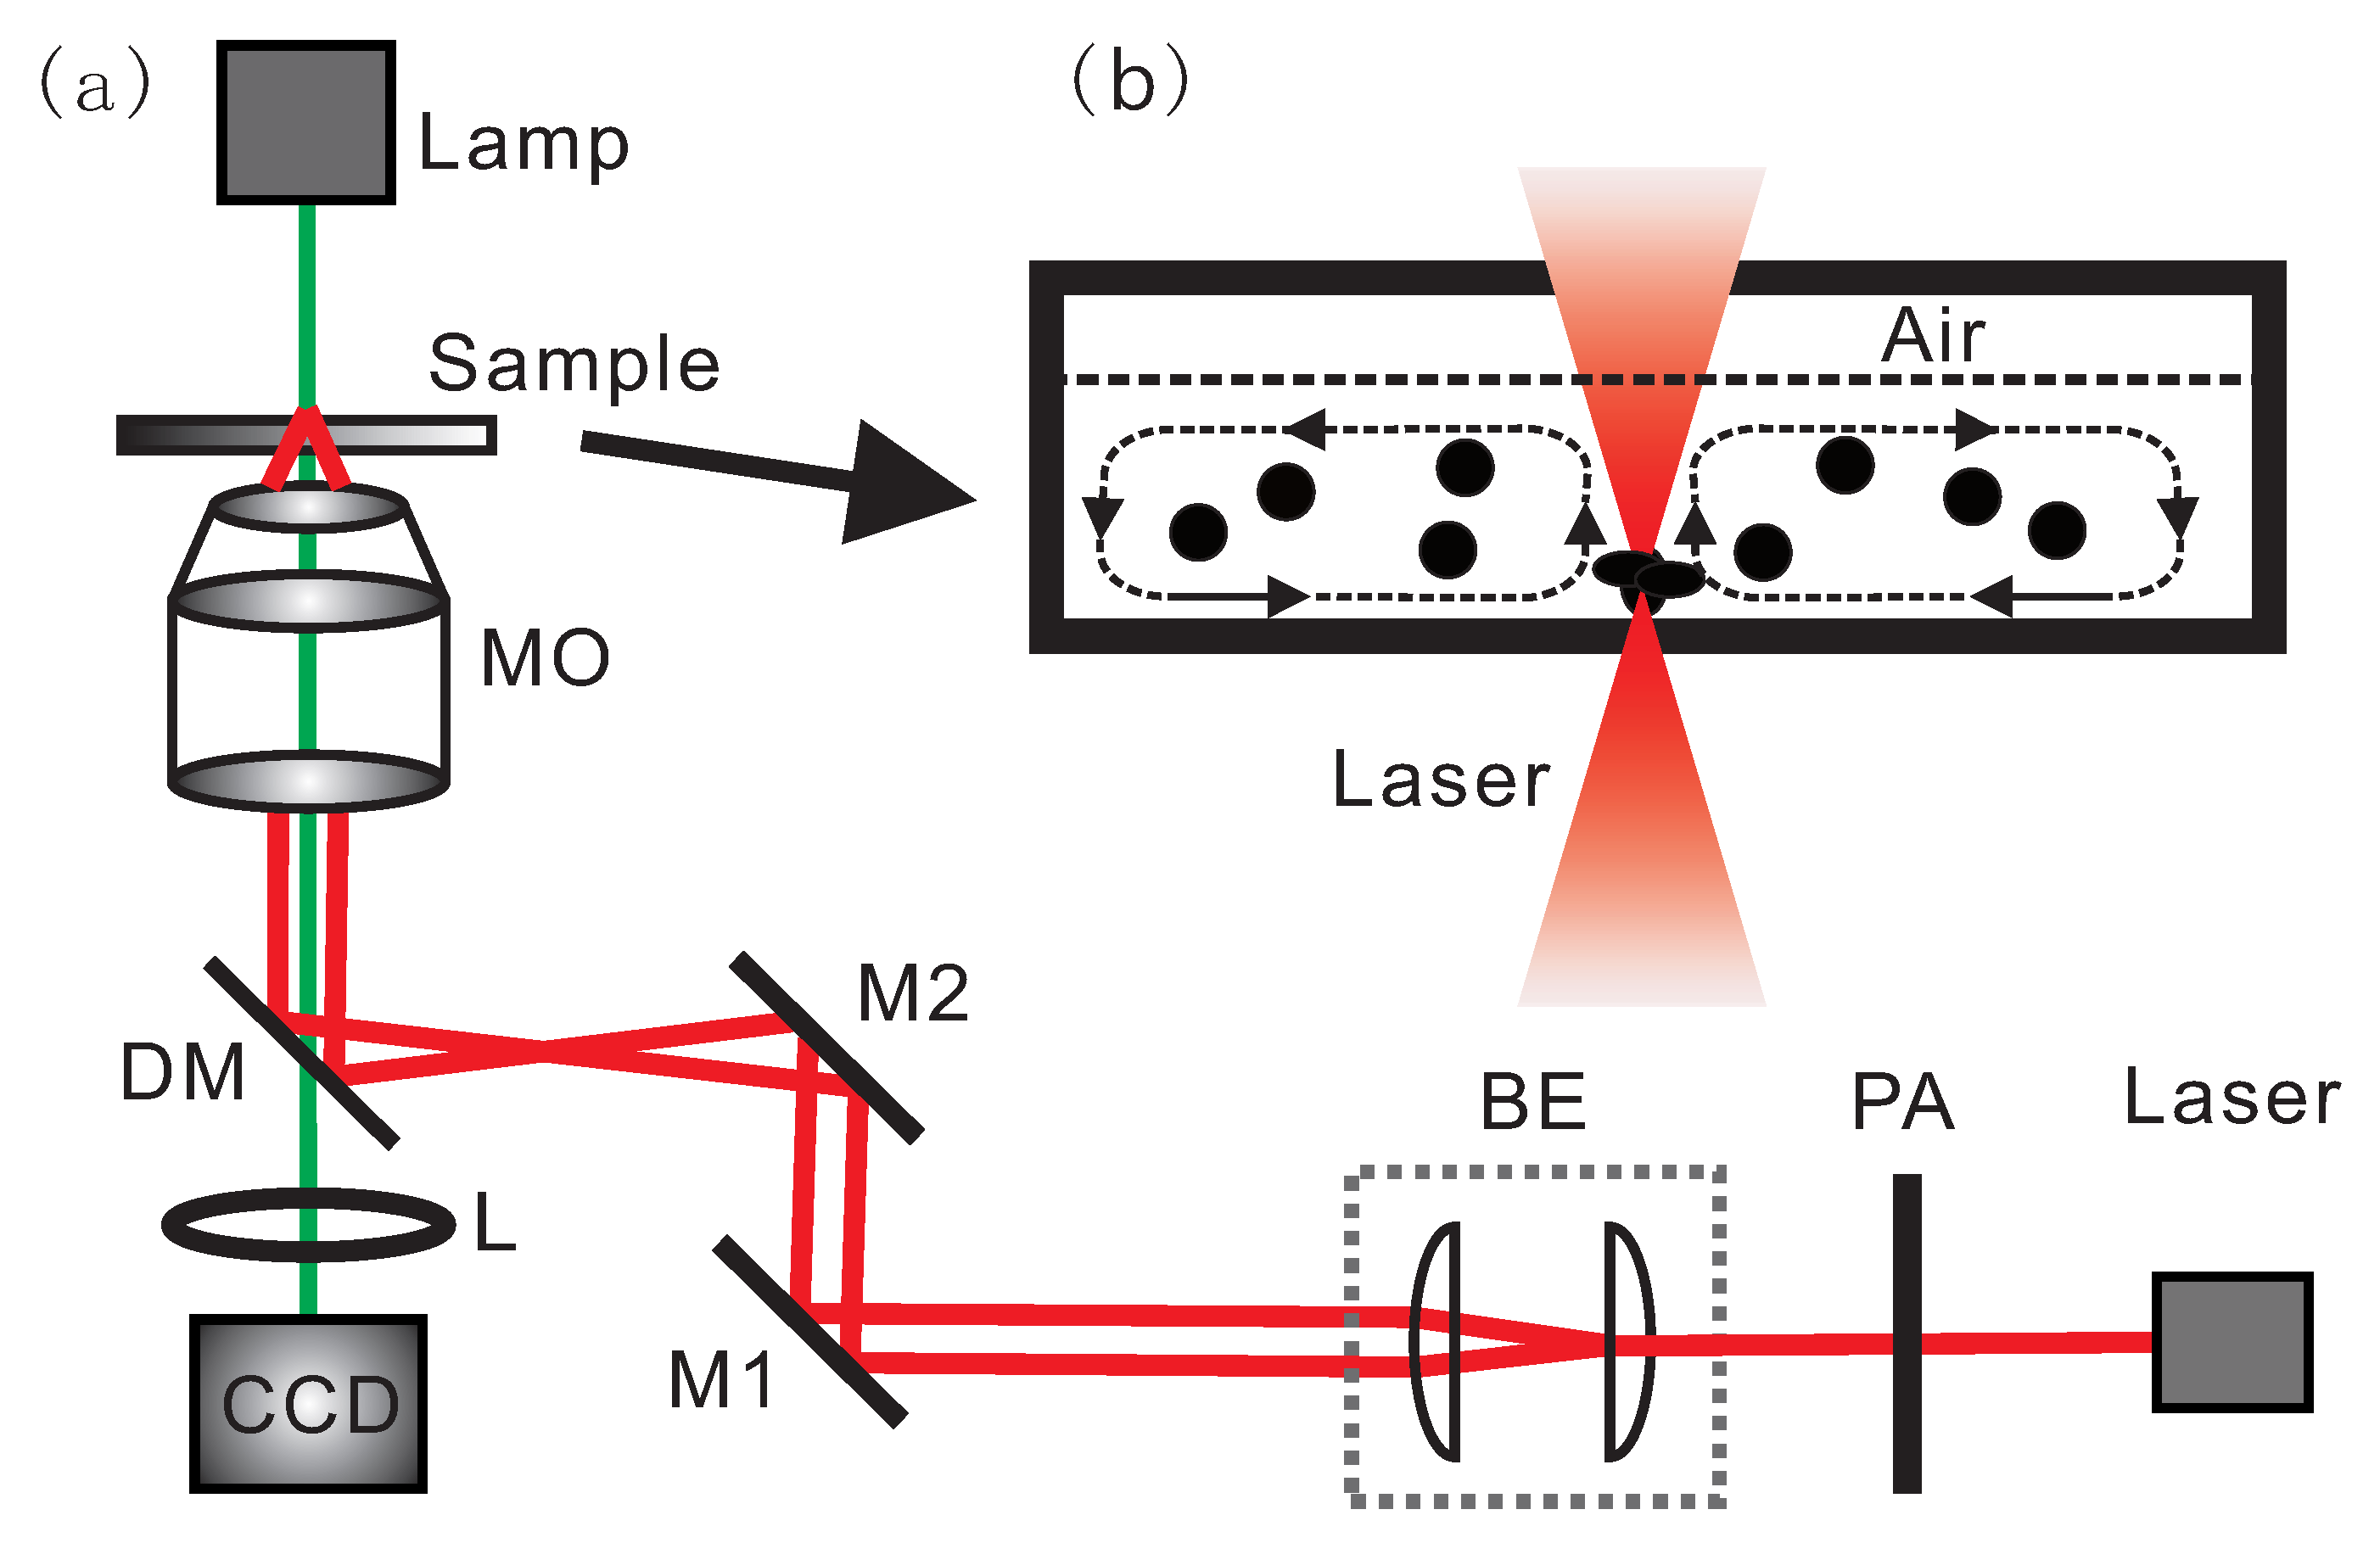
2. Experimental Methods

Figure 1a illustrates the experiment setup. The setup is based on a homemade microscope. A 1064-nm laser (CNI, Changchun, China, MIL-N-1064, TEM 00 , cw) with the beam waist 3 mm was used as the laser heating source. The beam is expanded to fulfill the pupil of the objective (8 mm) with the beam expander, constructed with two lenses (L1 and L2, f L 1 = 30 mm, f L 2 = 100 mm). The beam is reflected by mirrors M1 and M2 into the homemade microscope, and reflects upward by a dichroic mirror to a microscope objective (40×, N.A. = 0.7) and focuses into a sample cell. The sample cell is mounted at a three-axial stage. The images were recorded by a CMOS camera, and acquired with movie capture software. The laser power (P) can be changed with an adjustable attenuation and measured at the pupil of the objective.
The samples were diluted APs in a thin suspension layer. In the suspension layer, a thermal gradient was created while keeping the local temperature rising by focusing the laser on the APs. The APs used in the experiments were core-shell magnetic microspheres (polystyrene@Fe 3 O 4 , 4.0–5.0 μ m in diameter, density with 1.463 g/cm 3 , BaseLine Company, Tianjin, China). The initial concentration was 4.1 × 10 18 cm 3 in the solution. The particles were diluted to 2.1 × 10 17 cm 3 for the experiments.
The sample cell was prepared using a homemade circular trough with an inner diameter of 10 mm. The sample cell is composed of two glass slides and a rubber ring, and its diameter is 10 mm. The sample cells with two different thicknesses were used in the experiments. The thickness of the first sample cell was 1 mm, and the thickness of the second sample cell was 70 μ m. Both the sample cells were sealed with coverglass to decrease evaporation during the experiments. A diluted suspension drop with volume of 6 μ L of was injected into the sample cell for observation. When the suspension was injected into the sample cell with a thickness of 1 mm, a liquid-air interface was formed in the sample cell; the thickness of the suspension layer was about 70 μ m. When the suspension was injected into the sample cell with a thickness of 70 μ m, the thickness of the liquid phase was equal to the thickness of the sample cell; there was not a gas phase in this sample cell. The experiments were performed at room temperature.

3. Results and Discussion
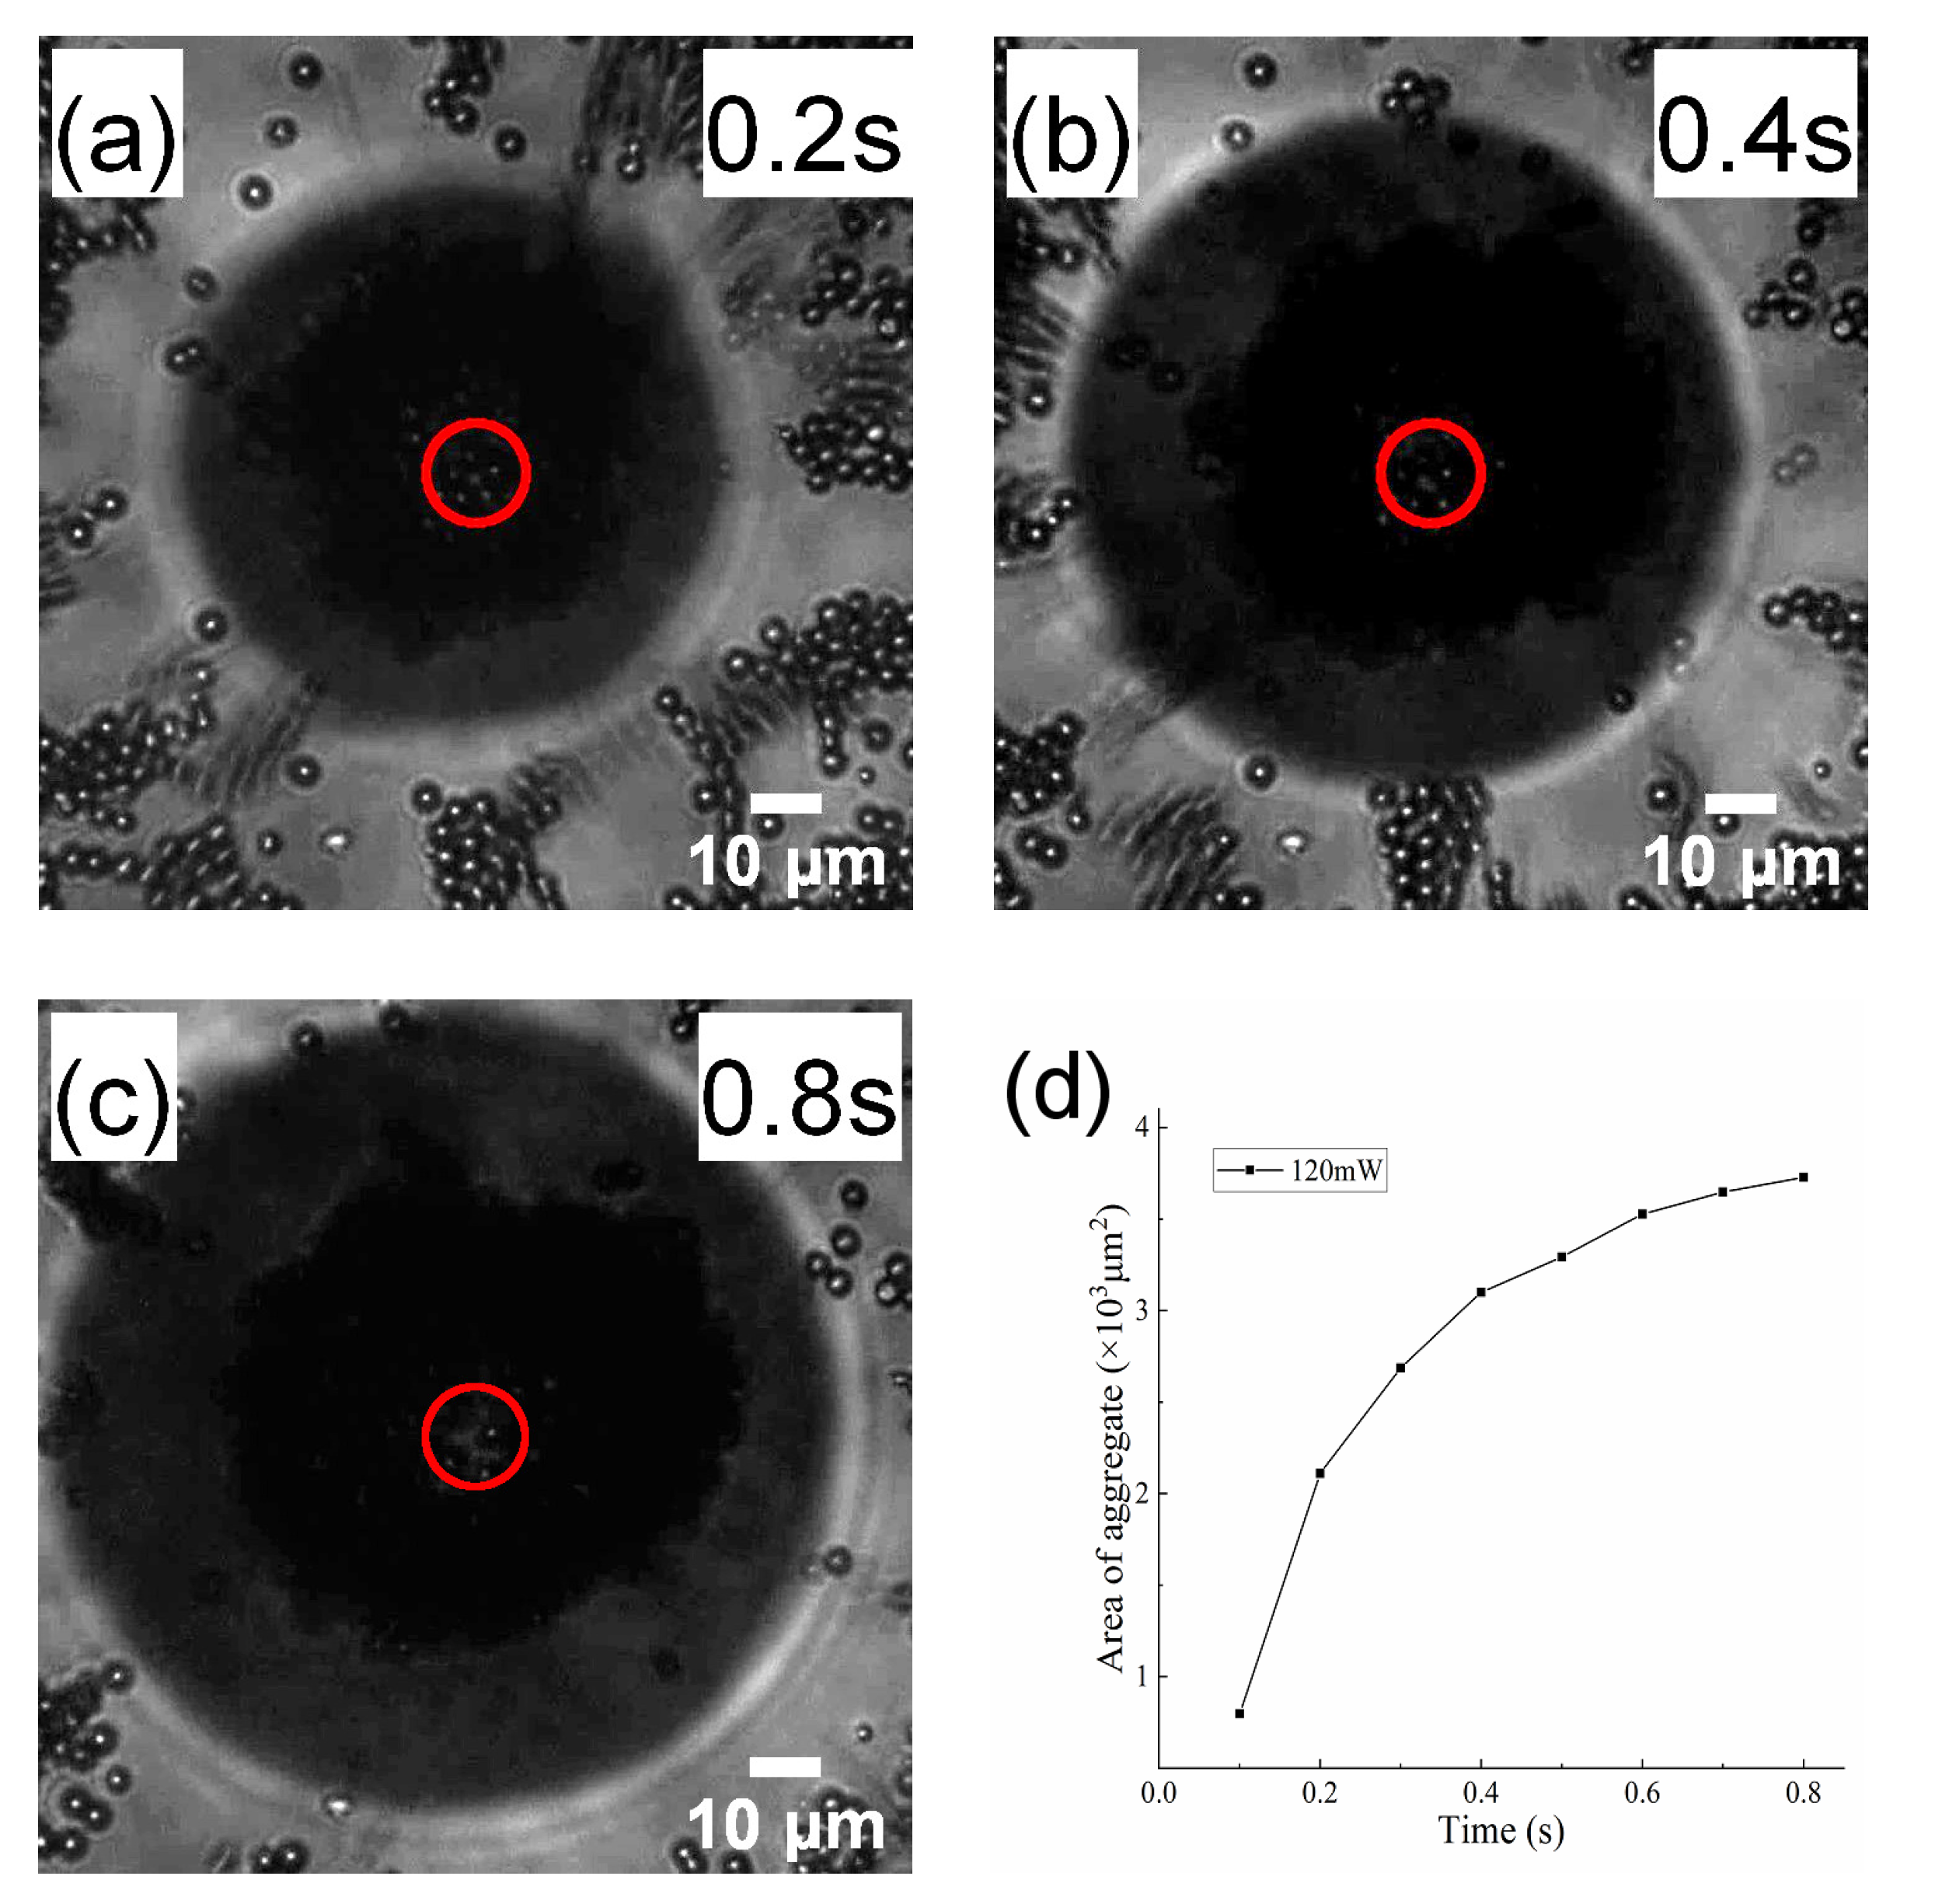
When the numerical aperture of the objective lens is 1.1, the experiment setup can trap the absorbing particles, as shown in the previous research [39]. Furthermore, it was found that the APs aggregated when the suspension layer became thin. Due to a limited view of the objective (N.A. = 1.1), the particle aggregation was demonstrated with an objective lens with a numerical aperture of 0.7, and the experimental setup could not trap the absorbing particles in this paper.
When a focused laser beam irradiates an absorbing particle, the particle will be pushed away by the optical scattering and thermal gradient forces. In our experiments, small AP aggregates deposited on the substrate were used as heating centers initially, whose gravity was enough to overcome the optical scattering and thermal gradient forces. Continuous laser illumination generates heat through light absorption of the AP aggregate at the focal point. The heat generation at the heating center occurs with simultaneous heat dissipation through heat transferred toward the outside regions, which generates a thermal gradient between the initial AP aggregate and its surroundings. For the APs suspended in the sample cell with a thickness of 1 mm, there are three phenomena in sequence when the laser power increases: AP aggregation (P = 13–50 mW); APs are pushed away (P = 50–104 mW); and bubbles are generated (P > 104 mW) that strengthen the accumulation of APs.

3.1. AP Aggregation

When the AP suspension was injected into the sample cell with a thickness of 1 mm, there was a water-air interface in the sealed cell. The thickness of liquid phase was about 70 μ m. The laser induced thermal gradient resulted in the generation of a flow that drove the APs to migrate and accumulate, forming an aggregate.
The process of laser induced AP aggregation is shown in Figure 2. The laser power was 18 mW. When there was no laser illuminating the APs, the particles do not move, as shown in Figure 2a. When the laser began to work (t = 0.6 s) and focused on a select, small aggregate in the substrate, as in Figure 2b, the thermal gradient generated induced a thermal convective flow. The flow transported the APs to the heat center, and the APs formed a large AP aggregate finally. The number of APs accumulated at the center of focus increases with the increasing illumination time, as shown in Figure 2c–f. When the laser illumination was terminated, most of the APs were still adhering to the aggregate. The threshold power that could induce APs aggregation was 13 mW for the suspension layer with 70 μ m thickness. The accumulation was not seen when the laser beam was focused on top of the layer except when the thickness of suspension layer was decreased to about 20 μ m.
The movement of absorbing particles in the experiments could be controlled by three mechanisms, including Marangoni convection, thermophoresis, and photophoresis [40]. Among them, photophoresis originated from the uneven heat distribution on the surfaces of the tiny objects irradiated by the light beam. According to the degree of absorption of incident light by the particle material, it can form positive photophoresis (strong absorption) and negative photophoresis (weak absorption). Photophoresis can produce a pulling force or a pushing force on the particles, which drives the particles to accumulate along the direction of beam propagation. Photophoresis can trap a large number of particles, but the trapped particles arrange along the beam propagation direction mainly. Furthermore, the photophoretic effect in a liquid environment is much weaker compared with that in air [40]. In our experiments, the particle aggregates arranged in the view plane of the microscope, which was perpendicular to beam propagation. Therefore, the APs’ aggregation is not dominated by photophoresis.
Thermophoresis describes the directed migration of different components in the solution along a temperature gradient. The drift velocity of colloidal particles can be given by u = D T T , where D T is the thermophoretic mobility and T is the temperature gradient [40]. When the laser power was 50 to 104 mW in our experiments, the absorbing particles were pushed away from the laser focus when there was a liquid-air interface. Moreover, experiments were repeated for examination with the sample cell with a thickness of 70 μ m. The thickness of the suspension layer was also 70 μ m. There was no water-air interface in the sample cell. The particles were also pushed away when the laser power was 50 to 104 mW. Therefore, the sign of D T of the absorbing particles is positive and the drag force of thermal flow is dominant when the laser power is 50–104 mW. However, the particles aggregated at the liquid-air interface when the laser power was 13 to 50 mW. Therefore, the APs’ aggregation can not be dominated by lateral thermophoresis. In addition, AP aggregation was not seen in the experiments when the laser power was 13 to 104 mW. The examination results confirm that the APs’ aggregation in the suspension layer is not induced by thermal convective flow from the bottom to the top and circulating inside the layer.
The previous research [41] has shown that laser pulses can create a temperature gradient, which induces Marangoni flow that can drag particles towards aggregation. The particles are released from a location close to a bubble and aggregate at its boundary. At the liquid-air interface, the surface tension gradient, γ , drives liquid migration from hot to cold regions. This convective flow provides a driving force to deliver colloidal particles in the liquid through Stokes’ drag force, given by F = 6 π η R v , where η is the viscosity of the liquid, R is the mean radius of the particles, and v is the convective flow velocity [40]. Moreover, Marangoni convection can increase particle aggregation speed by 1–2 orders of magnitude, which enhances self-assembly and deposition of particles [42]. In our experiments, the particles accumulated quickly at the location near the laser focus when there was a gas phase in the sample cell. Therefore, we think that the Marangoni convection dominantly causes the particle aggregation at the liquid-air interface.
The aggregation speed of particles under the Marangoni convection was measured. As the AP aggregates were almost monolayers, we used areas of the AP aggregates to describe the amount and accumulation speed of APs. The areas of the AP aggregates were measured at different laser powers. For each laser power, the initial AP aggregate was carefully selected with almost same size of beam. The experiment results are shown in Figure 3. The green pentagon represents the data at the laser power of 15 mW; the blue triangle represents the data at laser power of 22 mW; the red circle represents the data at laser power of 29 mW, and the black square represents the data at laser power of 41 mW. The results show that the areas of AP aggregates gradually increase when the laser irradiation time increases. The accumulation speed of APs mainly depends on the laser power for a suspension layer.

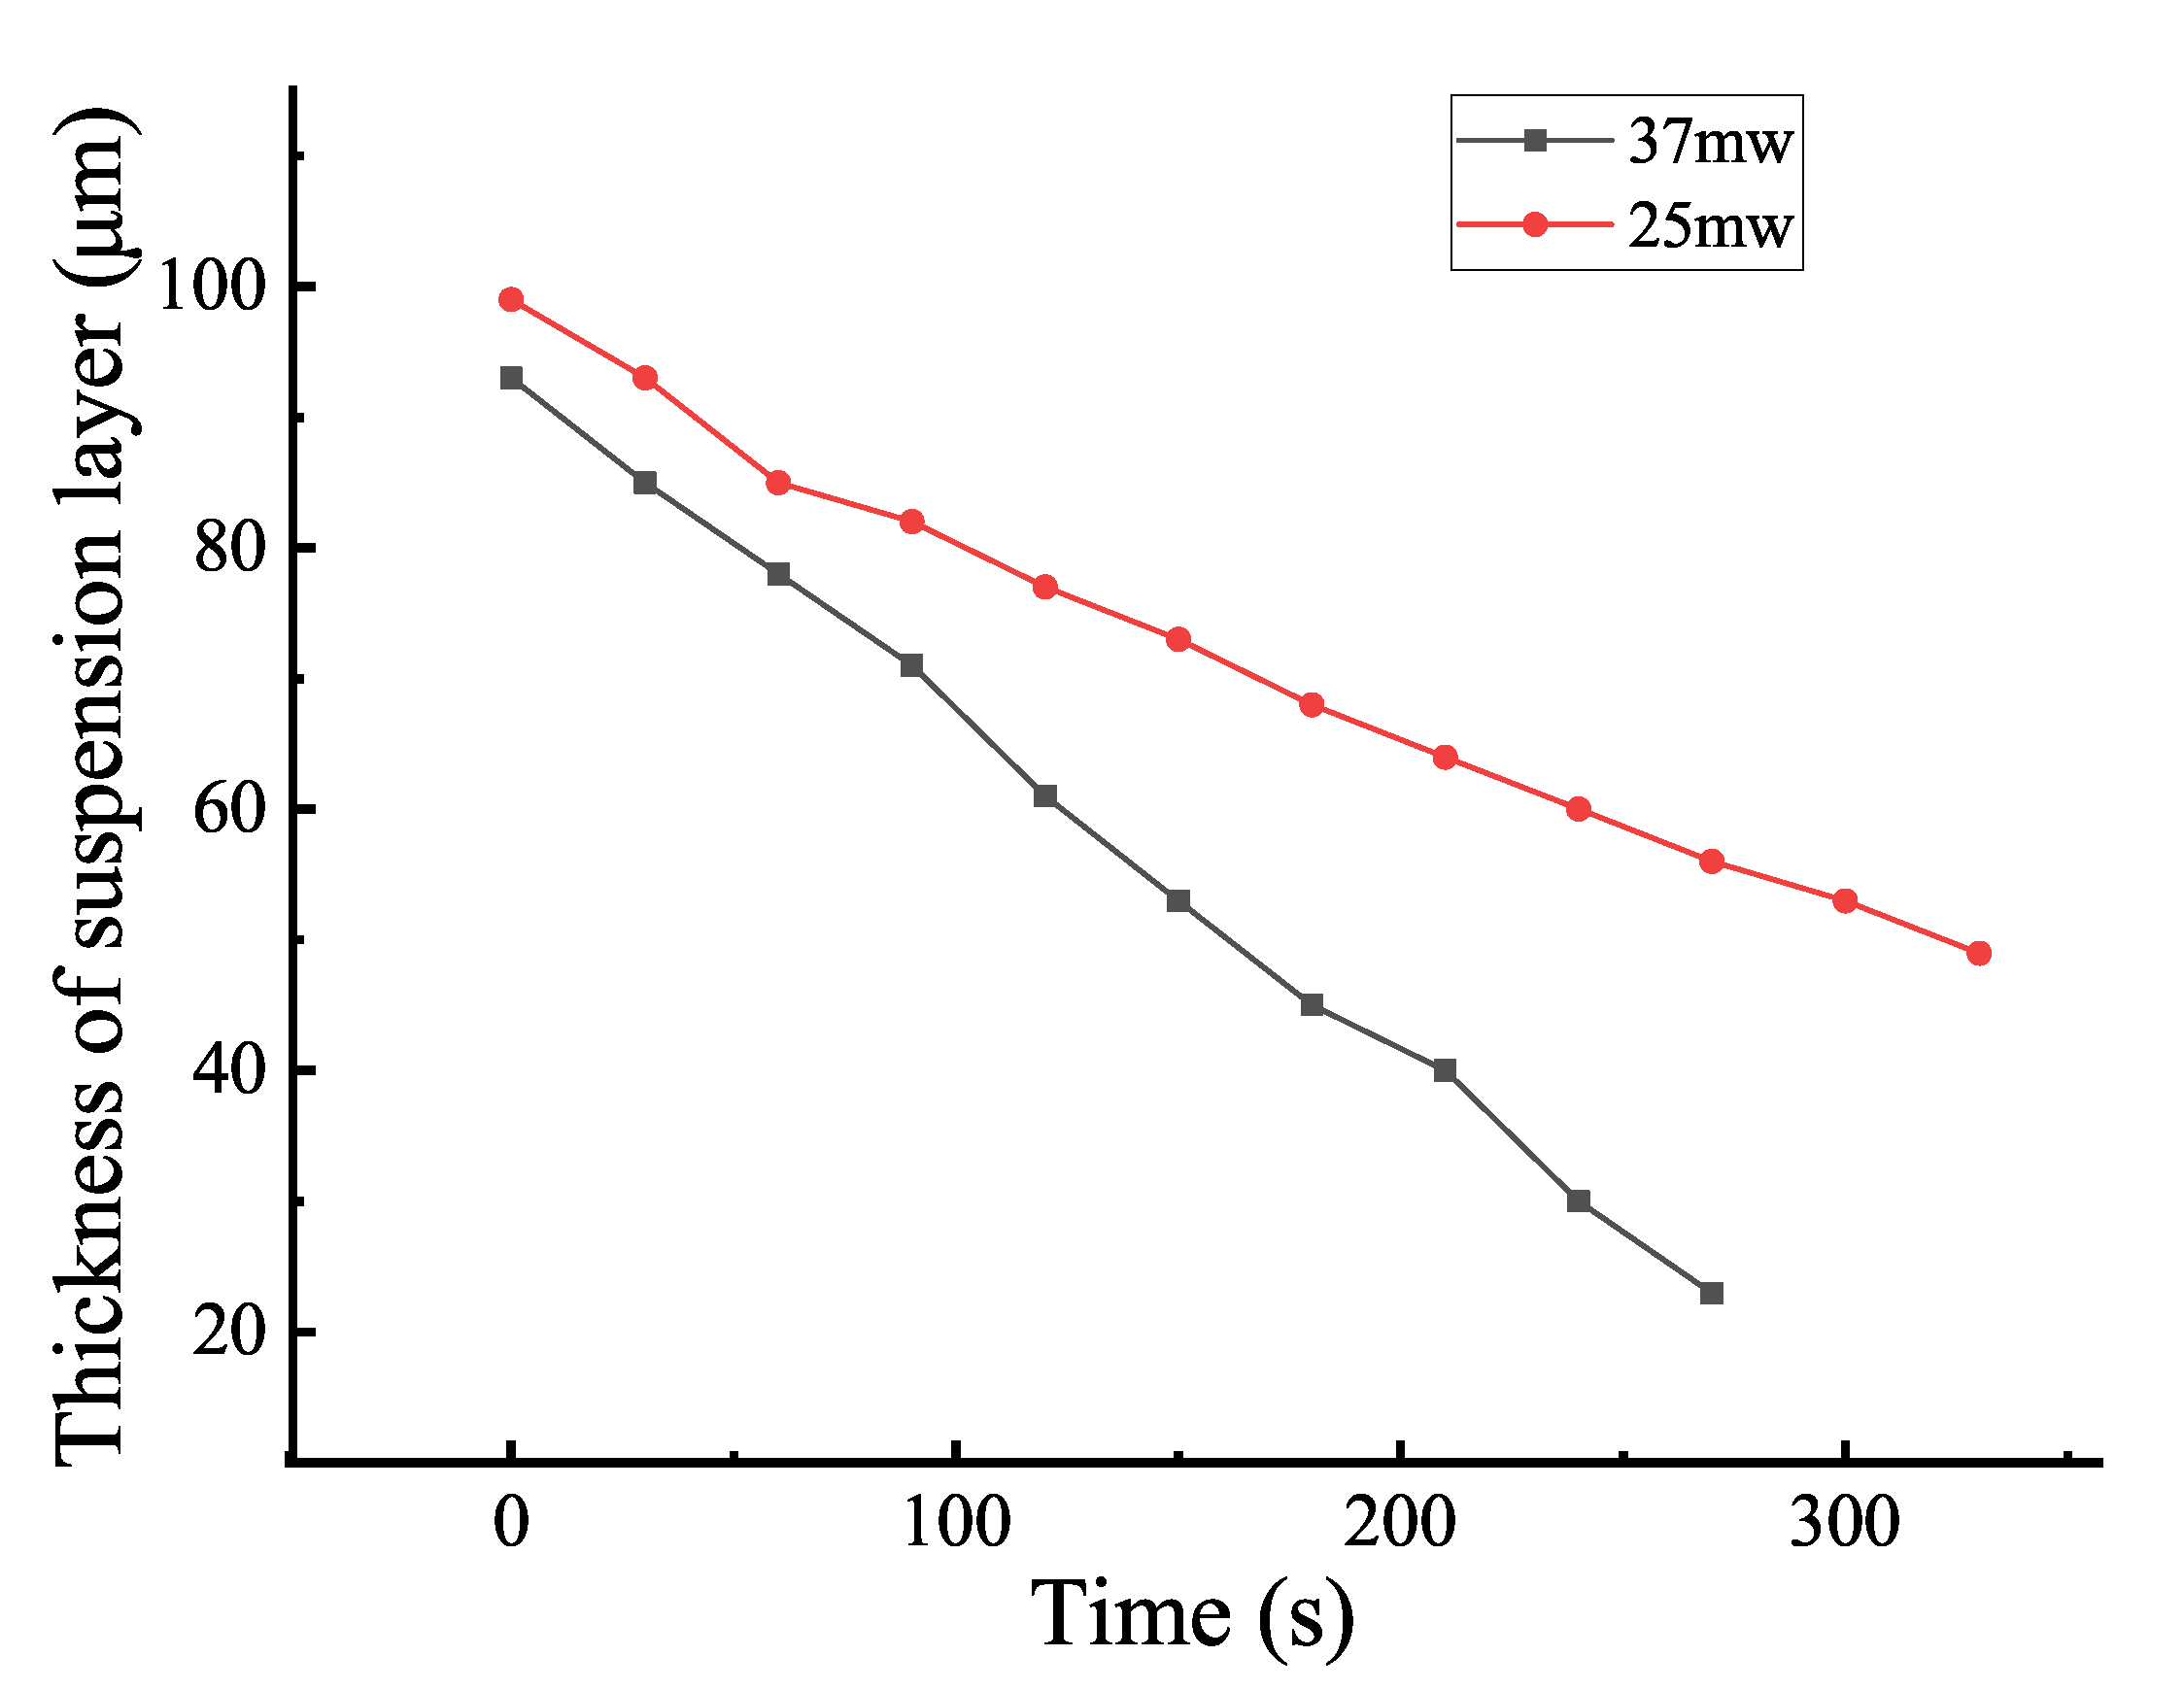
3.2. Effect of Thickness on AP Aggregation

When the laser power was larger than 50 mW, the APs were pushed away and could not aggregate. When the laser power was smaller than 50 mW, the thickness of the suspension layer affected whether APs could accumulate or not. The experiments were performed with different thicknesses of suspension layer at the same laser power (P = 30 mW). The thicknesses of the layer were 35, 75, and 110 μ m respectively. The APs could not be accumulated when the thickness was 110 μ m. The changes in area for AP aggregates under the two thicknesses are shown in Figure 4. It can be seen that the area of AP aggregate of the suspension layer with a thickness 75 μ m exceeded that of the suspension layer with a thickness 35 μ m after 6.5 s. The closer the particle is to the liquid-air interface, the greater the laser induced surface tension gradient and the faster the particle’s movement speed. The aggregation speed was larger in the suspension layer with 35 μ m thickness than that of the suspension layer with 75 μ m thickness at first. The particles in the suspension were quickly aggregated together in a short time (6 s) in the suspension layer with 35 μ m thickness. However, the number of particles in the suspension layer with 35 μ m thickness was smaller than number of particles in the suspension layer with thickness 75 μ m. The aggregation speed decreased after 6 seconds for the suspension layer with 35 μ m thickness. The experiments with different thicknesses show that the thickness ofthe suspension layer plays a crucial role in the APs’ accumulation.
When the thickness of the suspension layer was larger than 110 μ m, AP aggregates were not observed in the experiments. When the thickness of the suspension layer was large, the thermal gradient between the center and the edge of the water-air interface was weak, and the Marangoni convection at this thickness was insufficient to drive the particles to aggregate.
As the irradiation time increases, the thickness of suspension layer gradually decreases. The decrease can be attributed to water evaporation, which is induced by the heat transfer from the light irradiation on the absorbing particles. We measured the variation of thickness of the suspension layer with irradiation time. The results are shown in Figure 5. As the laser begins to irradiate, the AP particles absorb the light and transfer the energy into heat quickly, resulting in the suspension heating up and water evaporation, and the thickness of suspension layer decreases. As shown in Figure 5, the thickness of the liquid phase is reduced from 93 μ m to 22 μ m in 300 s for P = 37 mW. However, in the particle aggregation experiments, the particle aggregation was completed within 10 s. During this short time, the decrease in thickness of the liquid phase can be negligible; the process of AP aggregation was not affected by the change in thickness of the liquid phase.
If someone wants to aggregate the nanometer absorbing particles, the particles can be aggregated with the laser induced Marangoni convection first, and then form the deposition with water evaporation, as exhibited in the previous research [42]. The water evaporation can lead to cluster aggregation and deposition on the substrate’s surface.

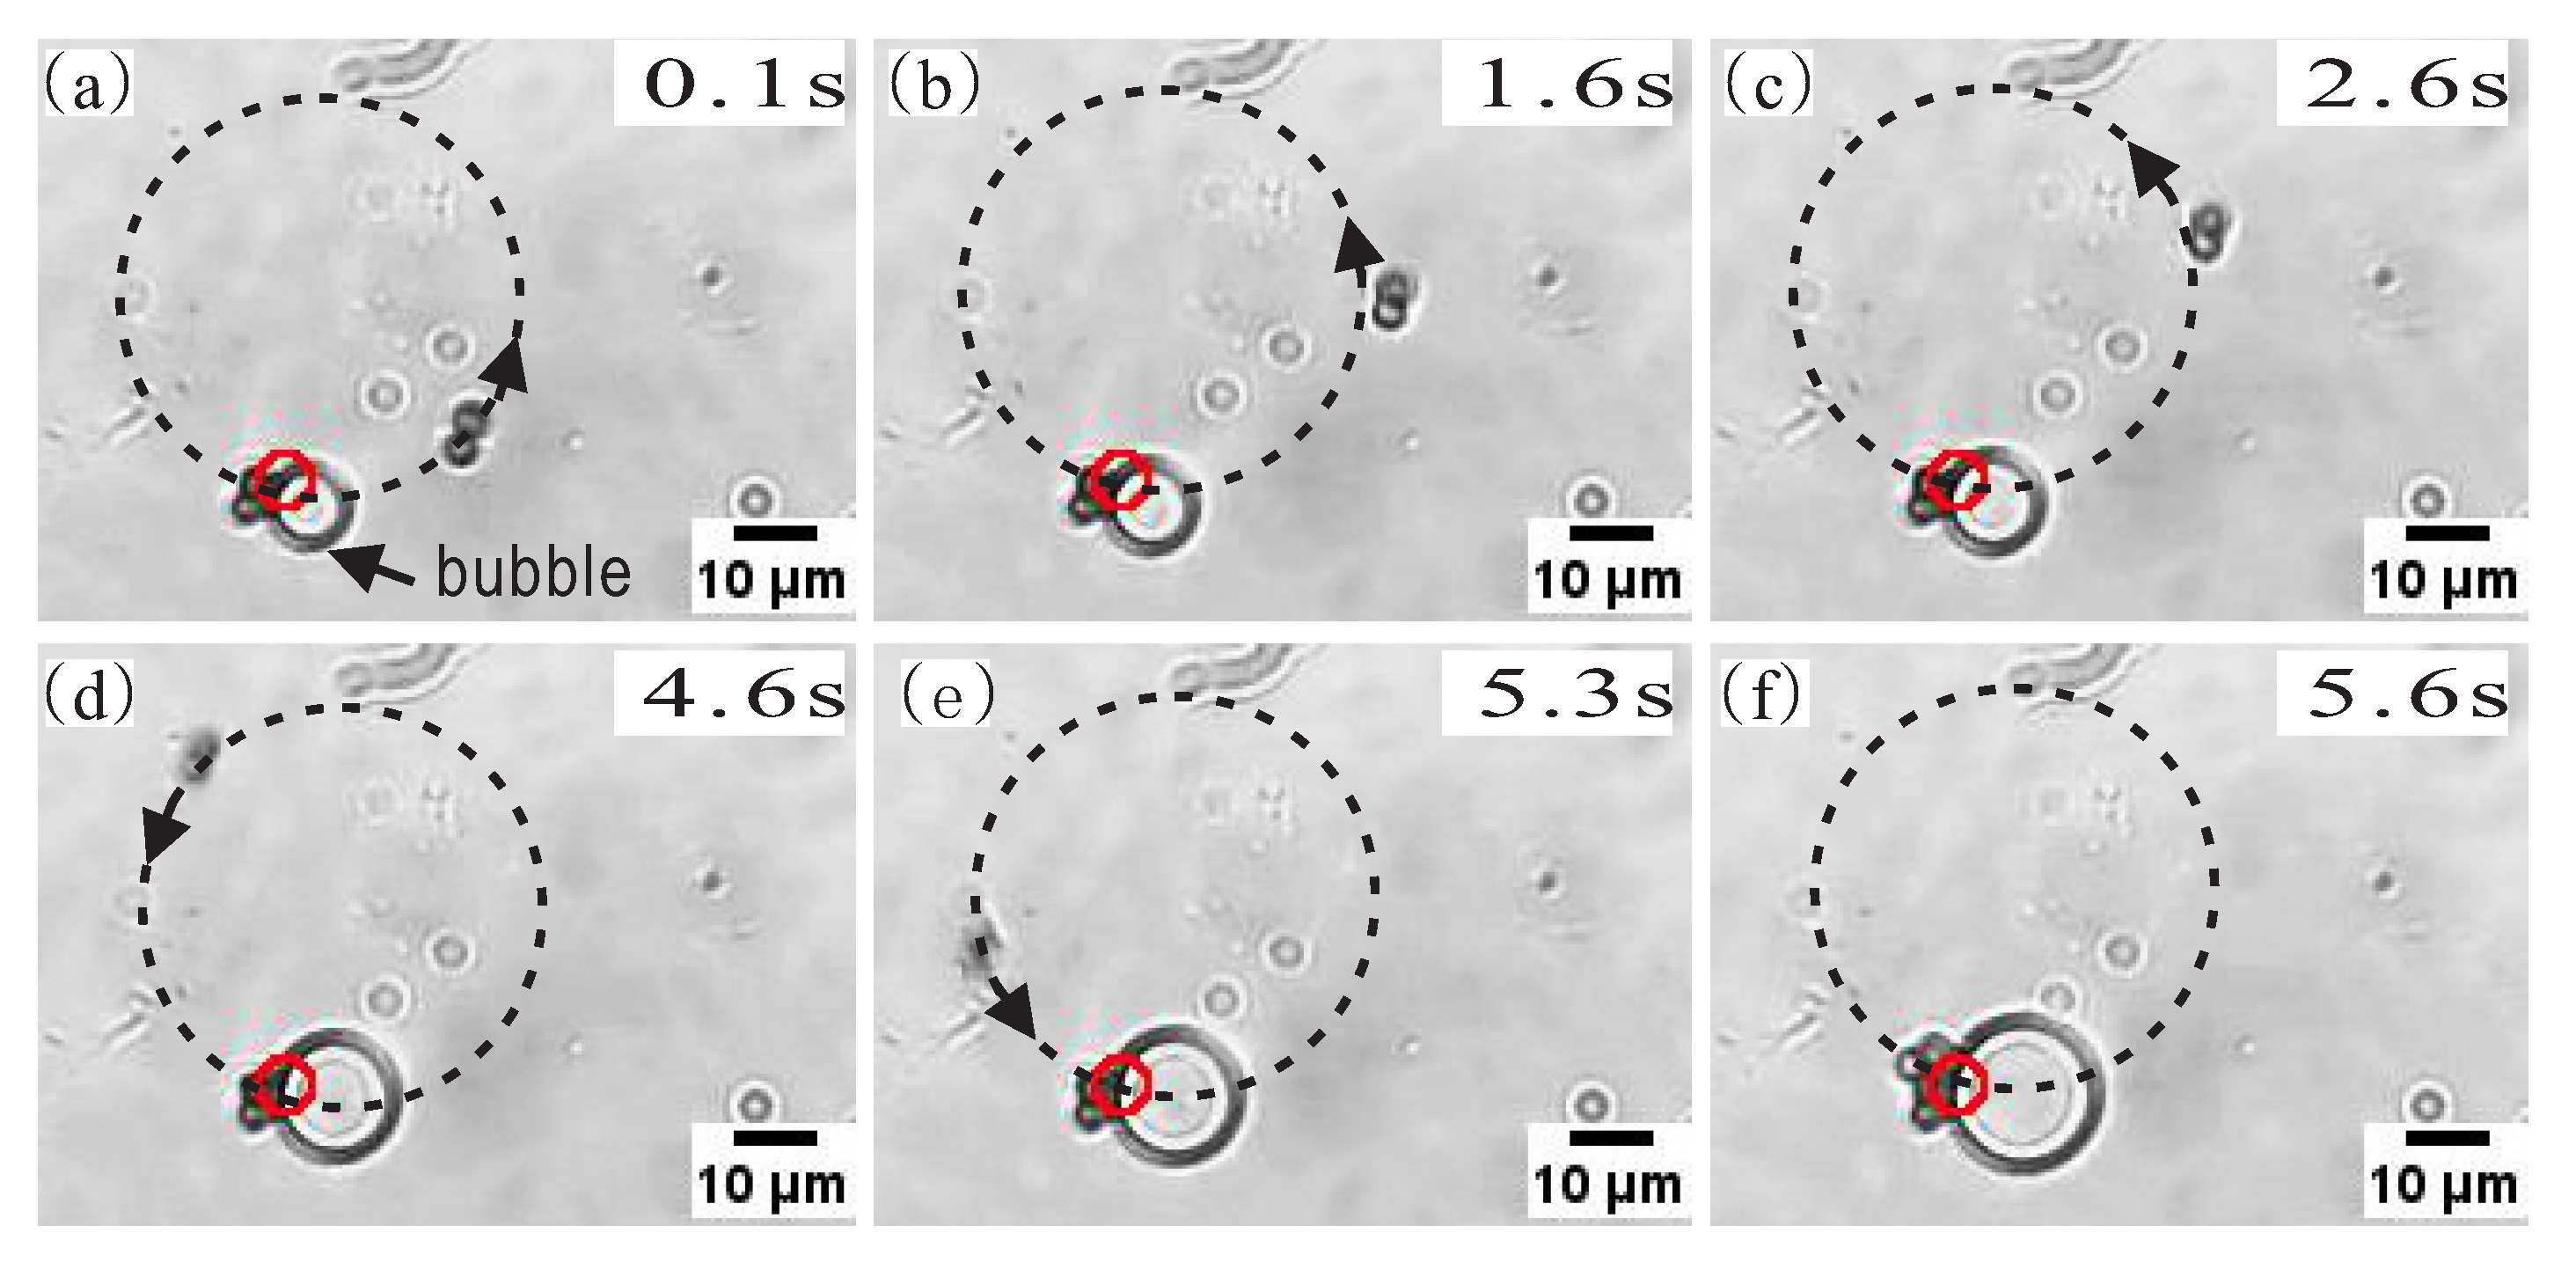
3.3. AP Accumulation Assisted by Bubbles

When the laser power reaches 104 mW, bubbles will be generated in the sample. The generation of bubbles was not affected by the thickness of suspension layer. Previous studies have shown that this photothermal bubble can be used to trap micron sized particles [41,43,44]. In our experiments, the bubbles were used to accumulate absorbing particles. The bubbles were generated by laser heating, and the bubbles acted as the liquid phase to form the liquid-air interface. The laser heating on APs caused a convective flow to migrate the particles, which achieved the AP accumulation. Figure 6 shows a bubble-assisted accumulation process of the APs. The laser power was 120 mW. When a bubble is generated, the APs quickly adhere to the bubble-water interface, forming an AP aggregate.
The mechanism of bubble-assisted AP aggregation can be attributed to the Marangoni convection. When the vapor bubble is generated, heat from strong absorption of laser irradiation on the APs induces a thermal gradient simultaneously. This thermal gradient then generates a local convective flow around the bubble. As the laser irradiation time increases, the area of the AP aggregate increases, as shown in Figure 6d. In comparison with Figure 2f, it can be seen that the accumulation speed of APs assisted by the bubble is much higher than that without the bubble. The acceleration of AP accumulation can be attributed to the heating position being close to the bubble, which caused a large thermal gradient at the gas-liquid interface on the bubble’s surface. The large thermal gradient induced a stronger Marangoni flow. The strong Marangoni flow accumulated the APs quickly.
The location at which the particles accumulate is related to the bubble’s growth direction. The bubbles in Figure 6a–c floated up in the suspension layer, and the heating location was just at the bottom of the bubble. Then the APs accumulated at the bottom of bubble and were arranged around the laser heated point. If the bubble is grown in x–y view plane along the coverslip, and the heating location is on one side of the bubble, the particles will be accumulated preferentially on the side of bubble close to the heating location, as shown in Figure 7f.
The direction of the convective flow can be observed in real time by tracking the positional motion of APs close to the laser spot, as shown in Figure 7. For tracking the motion of APs, the suspension was diluted to 4.1 × 10 16 /cm 3 and the particles were few in the observation view. The motion of particles will not be interfered with by the other particles. The laser power was decreased to 80 mW to reduce the particle velocity for observation. When a bubble is generated, as shown in Figure 7a, an AP near the bubble begins to move circularly, as shown in Figure 7b–e. Finally, the AP adheres at the bubble’s surface in Figure 7f. The APs are accumulated on the side of the bubble close to the laser focus, not distributed along the bubble uniformly.
Laser heating can accumulate the APs, no matter whether there is any bubble generation. The bubble-assisted method accumulates the APs faster than that without the bubbles. However, the bubbles are very unstable, and easily broken under laser heating. The rupture of a bubble is violent. The bubble rupture releases lots of energy and destroys the AP aggregates, forcing the particles to move intensely. By analyzing the trajectory of particles after a bubble explosion, one may analyze the dynamics of bubble explosion.
In the liquid-air interface, the optical trapping force does not dominate in the motion of APs because the drag force induced by opto-thermal convection is strong and exceeds the optical force. When the laser power is less than 104 mW, we assume that the thermal gradient force increases faster than the surface gradient tension. When the laser power is 13 to 50 mW, the particles aggregate because the surface gradient tension is larger than the drag force of thermophoresis. When the laser power is 50 to 104 mW, the particles are pushed away from the laser focus because the drag force of lateral thermophoresis is larger than the surface gradient tension. When the power is greater than 104 mW, the bubbles are generated. The positions of particles are very close to the gas phase, and γ becomes larger. The particles aggregate again and the aggregation speed becomes larger, because the strong Marangoni convection dominates the particles’ movement.
In this paper, a precise mathematical model was not established for the APs’ aggregation. The precise model is complicated, because the parameters of the thermal gradient, the laser-induced surface deformation, and the effect of bubble growth should be precisely obtained. However, based on the above analysis, we believe that the particle aggregation reported in the paper was dominated by laser induced Marangoni convection.

4. Conclusions

In conclusion, we have developed a simple and efficient way to control and accumulate light absorbing particles dispersed in a thin suspension layer. A focused laser beam is used to irradiate the particles. Due to the photothermal effect of APs, the laser heating generates a thermal gradient and induces a Marangoni flow around the heating center. The thermal gradient is initially generated by the laser illuminating a small AP aggregate deposited on the substrate of a sample cell. The convective flow drives the surrounding APs to accumulate around the laser focus. When the laser power is high, the laser heating generates vapor bubbles. The bubbles induce a stronger Marangoni flow, which accelerates the accumulation of APs. The APs are quickly accumulated at the bubble-water interface. This method provides further prospective applications in thermal treatment, microfluidics, drug delivery, etc.

Author Contributions

M.-C.Z. conceived and designed the research. B.-W.L. and M.-C.Z. performed the experiments and processed the images. B.-W.L., M.-C.Z., and F.J. analyzed the experimental data. B.-W.L. and M.-C.Z. wrote and revised the manuscript. All authors have read and agreed to the published version of the manuscript.

Funding

This work is supported by grants from the National Natural Science Foundation of China (No. 11874138).

Acknowledgments

The manuscript has been greatly improved by addressing the constructive comments and suggestions made by two anonymous reviewers, whom we would like to thank for their time and effort.

Conflicts of Interest

The authors declare no conflict of interest.

References

  1. Chen, P.; Ma, Y.; Zheng, Z.; Wu, C.; Wang, Y.; Liang, G. Facile syntheses of conjugated polymers for photothermal tumour therapy. Nat. Commun. 2019, 10, 1192. [Google Scholar] [CrossRef] [PubMed] [Green Version]
  2. Lee, H.; Sun, E.; Ham, D.; Weissleder, R. Chip-NMR biosensor for detection and molecular analysis of cells. Nat. Med. 2008, 14, 869–874. [Google Scholar] [CrossRef] [PubMed] [Green Version]
  3. Esmaeili, E.; Khalili, M.; Alireza, N.S.; Hosseinzadeh, S.; Taheri, B.; Soleimani, M. Dendrimer functionalized magnetic nanoparticles as a promising platform for localized hyperthermia and magnetic resonance imaging diagnosis. J. Cell. Physiol. 2019, 234, 12615–12624. [Google Scholar] [CrossRef] [PubMed]
  4. Ashkin, A.; Dziedzic, J.M.; Bjorkholm, J.E.; Chu, S. Observation of a single-beam gradient force optical trap for dielectric particles. Opt. Lett. 1986, 11, 288–290. [Google Scholar] [CrossRef] [PubMed] [Green Version]
  5. Curtis, J.E.; Grier, D.G. Structure of Optical Vortices. Phys. Rev. Lett. 2003, 90, 133901. [Google Scholar] [CrossRef] [PubMed] [Green Version]
  6. Min, C.; Shen, Z.; Shen, J.; Zhang, Y.; Fang, H.; Yuan, G.; Du, L.; Zhu, S.; Lei, T.; Yuan, X. Focused plasmonic trapping of metallic particles. Nat. Commun. 2013, 4, 2891. [Google Scholar] [CrossRef]
  7. Zhong, M.C.; Wei, X.B.; Zhou, J.H.; Wang, Z.Q.; Li, Y.M. Trapping red blood cells in living animals using optical tweezers. Nat. Commun. 2013, 4, 1768. [Google Scholar] [CrossRef] [Green Version]
  8. Gautam, R.; Xiang, Y.; Lamstein, J.; Liang, Y.; Hansson, T.; Wetze, B.; Chen, Z. Optical force-induced nonlinearity and self-guiding of light in human red blood cell suspensions. Light. Sci. Appl. 2019, 8, 279–287. [Google Scholar] [CrossRef] [PubMed]
  9. Lee, K.; Kinnunen, M.; Khokhlova, M.D.; Lyubin, E.V.; Priezzhev, A.V.; Meglinski, I.; Fedyanin, A.A. Optical tweezers study of red blood cell aggregation and disaggregation in plasma and protein solutions. J. Biomed. Opt. 2016, 21, 035001. [Google Scholar] [CrossRef]
  10. Barak, P.; Rai, A.; Rai, P.; Mallik, R. Quantitative optical trapping on single organelles in cell extract. Nat. Methods 2013, 10, 68–70. [Google Scholar] [CrossRef] [Green Version]
  11. Ashkin, A.; Dziedzic, J.M. Internal Cell Manipulation Using Infrared Laser Traps. Proc. Natl. Acad. Sci. USA 1989, 86, 7914–7918. [Google Scholar] [CrossRef] [PubMed] [Green Version]
  12. Sparkes, I.A.; Ketelaar, T.; Ruijter, N.C.A.D.; Hawes, C. Grab a Golgi: Laser trapping of Golgi bodies reveals in vivo interactions with the endoplasmic reticulum. Traffic 2009, 10, 567–571. [Google Scholar] [CrossRef]
  13. Donato, M.G.; Brzobohaty, O.; Simpson, S.H.; Irrera, A.; Leonardi, A.A.; Faro, M.J.L.; Svak, V.; Marago, O.M.; Zemanek, P. Optical Trapping, Optical Binding, and Rotational Dynamics of Silicon Nanowires in Counter-Propagating Beams. Nano Lett. 2019, 19, 342–352. [Google Scholar] [CrossRef] [PubMed]
  14. Maragò, O.M.; Jones, P.H.; Gucciardi, P.G.; Volpe, G.; Ferrari, A.C. Optical trapping and manipulation of nanostructures. Nat. Nanotechnol. 2013, 8, 807–819. [Google Scholar] [CrossRef] [Green Version]
  15. Jauffred, L.; Richardson, A.C.; Oddershede, L.B. Three-dimensional optical control of individual quantum dots. Nano Lett. 2008, 8, 3376–3380. [Google Scholar] [CrossRef] [PubMed] [Green Version]
  16. Wen, C.; Ye, A. Measurement of the binding force between RAS protein and a pathologic BRAF mutant using optical tweezers. Chin. Opt. Lett. 2013, 11, 80–83. [Google Scholar]
  17. Crocker, J.C.; Grier, D.G. Microscopic measurement of the pair interaction potential of charge-stabilized colloid. Phys. Rev. Lett. 1994, 73, 352–355. [Google Scholar] [CrossRef] [Green Version]
  18. Gutsche, C.; Keyser, U.F.; Kegler, K.; Kremer, F.; Linse, P. Forces between single pairs of charged colloids in aqueous salt solutions. Phys. Rev. E 2007, 76, 031403. [Google Scholar] [CrossRef] [Green Version]
  19. Chen, A.; Li, S.W.; Jing, D.; Xu, J.H. Interactions between colliding oil drops coated with non-ionic surfactant determined using optical tweezers. Chem. Eng. Sci. 2019, 193, 276–281. [Google Scholar] [CrossRef]
  20. Chen, A.; Li, S.W.; Sang, F.; Zeng, H.B.; Xu, J.H. Interactions between Micro-Scale Oil Droplets in Aqueous Surfactant Solution Determined Using Optical Tweezers. J. Colloid Interface Sci. 2018, 532, 128–135. [Google Scholar] [CrossRef]
  21. Summers, M.D.; Burnham, D.R.; Mcgloin, D. Trapping solid aerosols with optical tweezers: A comparison between gas and liquid phase optical traps. Opt. Express 2008, 16, 7739–7747. [Google Scholar] [CrossRef]
  22. Tanaka, S.; Oki, Y.; Kimura, Y. Melting of a finite-sized two-dimensional colloidal crystal. Phys. Rev. E 2014, 89, 052305. [Google Scholar] [CrossRef]
  23. Zhong, M.C.; Wang, Z.Q.; Li, Y.M. Laser-accelerated self-assembly of colloidal particles at the water-air interface. Chin. Opt. Lett. 2017, 15, 051401. [Google Scholar] [CrossRef] [Green Version]
  24. Kudo, T.; Wang, S.F.; Yuyama, K.I.; Masuhara, H. Optical Trapping-Formed Colloidal Assembly with Horns Extended to the Outside of a Focus through Light Propagation. Nano Lett. 2016, 16, 3058–3062. [Google Scholar] [CrossRef] [PubMed]
  25. Liu, J.; Li, Z.Y. Light-driven crystallization of polystyrene micro-spheres. Photonics Res. 2017, 5, 201–206. [Google Scholar] [CrossRef]
  26. Zhong, M.C.; Liu, A.Y.; Zhu, R. Optical Assembling of Micro-Particles at a Glass-Water Interface with Diffraction Patterns Caused by the Limited Aperture of Objective. Appl. Sci. 2018, 8, 1522. [Google Scholar] [CrossRef] [Green Version]
  27. Liu, J.; Li, Z.Y. Controlled Mechanical Motions of Microparticles in Optical Tweezers. Micromachines 2018, 9, 232. [Google Scholar] [CrossRef] [Green Version]
  28. Gong, Z.; Pan, Y.L.; Videen, G.; Wang, C. Optical trapping and manipulation of single particles in air: Principles, technical details, and applications. J. Quant. Spectrosc. Radiat. Transf. 2018, 214, 94–119. [Google Scholar] [CrossRef]
  29. Liu, Z.; Wu, J.; Zhang, Y.; Zhang, Y.; Tang, X.; Yang, X.; Zhang, J.; Yang, J.; Yuan, L. Optical trapping and axial shifting for strongly absorbing particle with single focused TEM00 Gaussian beam. Appl. Phys. Lett. 2018, 113, 091101. [Google Scholar] [CrossRef]
  30. Zhang, Y.; Zhang, Y.; Liu, Z.; Tang, X.; Yang, X.; Zhang, J.; Yang, J.; Yuan, L. Laser-Induced Microsphere Hammer-Hit Vibration in Liquid. Phys. Rev. Lett. 2018, 121, 133901. [Google Scholar] [CrossRef]
  31. Chen, J.; Cong, H.; Loo, F.C.; Kang, Z.; Tang, M.; Zhang, H.; Wu, S.Y.; Kong, S.K.; Ho, H.P. Thermal gradient induced tweezers for the manipulation of particles and cells. Sci. Rep. 2016, 6, 35814. [Google Scholar] [CrossRef] [Green Version]
  32. Piazza, R. Thermophoresis: Moving particles with thermal gradients. Soft Matter 2008, 4, 1740–1744. [Google Scholar] [CrossRef]
  33. Braun, D.; Libchaber, A. Trapping of DNA by Thermophoretic Depletion and Convection. Phys. Rev. Lett. 2002, 89, 188103. [Google Scholar] [CrossRef] [PubMed] [Green Version]
  34. Tsuji, T.; Sasai, Y.; Kawano, S. Thermophoretic Manipulation of Micro- and Nanoparticle Flow through a Sudden Contraction in a Microchannel with Near-Infrared Laser Irradiation. Phys. Rev. Appl. 2018, 10, 044005. [Google Scholar] [CrossRef] [Green Version]
  35. Jiang, H.R.; Wada, H.; Yoshinaga, N.; Sano, M. Manipulation of Colloids by a Nonequilibrium Depletion Force in a Temperature Gradient. Phys. Rev. Lett. 2009, 102, 208301. [Google Scholar] [CrossRef] [PubMed] [Green Version]
  36. Kang, Z.; Chen, J.; Wu, S.Y.; Chen, K.; Kong, S.K.; Yong, K.T.; Ho, H.P. Trapping and assembling of particles and live cells on large-scale random gold nano-island substrates. Sci. Rep. 2015, 5, 9978. [Google Scholar] [CrossRef] [Green Version]
  37. Lin, L.; Wang, M.; Peng, X.; Lissek, E.N.; Mao, Z.; Scarabelli, L.; Adkins, E.; Coskun, S.; Unalan, H.E.; Korgel, B.A. Opto-thermoelectric nanotweezers. Nat. Photonics 2018, 12, 195–201. [Google Scholar] [CrossRef]
  38. Li, J.; Lin, L.; Inoue, Y.; Zheng, Y. Opto-Thermophoretic Tweezers and Assembly. J. Micro Nano-Manuf. 2018, 6, 040801. [Google Scholar] [CrossRef]
  39. Zhong, M.C.; Liu, A.Y.; Ji, F. Opto-thermal oscillation and trapping of light absorbing particles. Opt. Express 2019, 27, 29730. [Google Scholar] [CrossRef]
  40. Lin, L.; Hill, E.H.; Peng, X.; Zheng, Y. Optothermal Manipulations of Colloidal Particles and Living Cells. Acc. Chem. Res. 2018, 51, 1465–1474. [Google Scholar] [CrossRef]
  41. Ilday, S.; Makey, G.; Akguc, G.B.; Tokel, O.; Pavlov, I.; Gülseren, O. Rich complex behaviour of self-assembled nanoparticles far from equilibrium. Nat. Commun. 2017, 8, 14942. [Google Scholar] [CrossRef] [Green Version]
  42. Louchev, O.A.; Juodkazis, S.; Murazawa, N.; Wada, S.; Misawa, H. Coupled laser molecular trapping, cluster assembly, and deposition fed by laser-induced Marangoni convection. Opt. Express 2008, 16, 5673–5680. [Google Scholar] [CrossRef]
  43. Flores-Flores, E.; Torres-Hurtado, S.; Páez, R.; Ruiz, U.; Beltrán-Pérez, G.; Neale, S.; Ramirez-San-Juan, J.; Ramos-García, R. Trapping and manipulation of microparticles using laser-induced convection currents and photophoresis. Biomed. Opt. Express 2015, 6, 4079–4087. [Google Scholar] [CrossRef] [Green Version]
  44. Chikazawa, J.I.; Uwada, T.; Furube, A.; Hashimoto, S. Flow-Induced Transport via Optical Heating of a Single Gold Nanoparticle. J. Phys. Chem. C 2019, 123, 4512–4522. [Google Scholar] [CrossRef]
Figure 1. (a) Schematic of the experimental setup. PA, power attenuation; BE, beam expander; M1–M2, mirrors; DM, dichroic mirror; L, lens; MO, microscope objective; CCD, CCD camera. (b) Schematic illustration of Marangoni convection-induced particles accumulation inside the sample cell.
Applsci 10 07795 g001
Figure 2. Images of forming absorbing particle (AP) aggregates. (a) No laser illuminating, the APs do not move. (bf) The process of laser induced particles aggregation. The APs begin to accumulate when the laser begins to illuminate on a small aggregate at time = 0.6 s. The APs move to the heat center, and form a large AP aggregate. P = 18 mW at the pupil of the objective. The circle indicates the focal center of the laser beam. The thickness of the suspension layer was 70 μ m. Scale bar, 10 μ m.
Applsci 10 07795 g002
Figure 3. Areas of AP aggregates as a function of illumination time at different laser powers. The laser power was measured at the pupil of objective.
Applsci 10 07795 g003
Figure 4. Areas of AP aggregates as a function of illumination time. P = 30 mW.
Applsci 10 07795 g004
Figure 5. Thickness of the suspension layer as a function of illumination time.
Applsci 10 07795 g005
Figure 6. (ac) Images of bubble-assisted forming of AP aggregates. The red circle indicates the laser focus. Scale bar, 10 μ m. (d) Areas of AP aggregates as a function of laser irradiation time. The laser power was 120 mW at the pupil of the objective. The thickness of suspension layer was 70 μ m.
Applsci 10 07795 g006
Figure 7. Images of AP movement driven by Marangoni flow observed with a high magnification objective (N.A. = 1.1). The small red circle indicates the laser focus. The large dot circle indicates the trajectory of particle motion. The arrow in the dotted circle indicates the movement direction. P = 80 mW. Scale bar, 10 μ m.
Applsci 10 07795 g007
Publisher’s Note: MDPI stays neutral with regard to jurisdictional claims in published maps and institutional affiliations.

