Article

Capacity Design and Cost Analysis of Converged Renewable Energy Resources by Considering Base Load Conditions in Residential and Industrial Areas

1
Next Generation PV Module and Power System Research Center, Konkuk University, 1 Hwayang-Dong, Gwangjin-Gu, Seoul 143-701, Korea
2
Department of Electrical and Electronic Engineering, Konkuk University, Seoul 05029, Korea
*
Author to whom correspondence should be addressed.
Appl. Sci. 2020, 10(21), 7822; https://doi.org/10.3390/app10217822
Submission received: 14 September 2020 / Revised: 20 October 2020 / Accepted: 3 November 2020 / Published: 4 November 2020
(This article belongs to the Special Issue Spectral Effects in PV Technologies)

Abstract

:
In this paper, a design technique for constructing a renewable-energy-based power system based on a customer’s power load is proposed. The proposed design technique adopts a second renewable energy power source in charge of the base load and is an improved method of the referenced studies with one type of renewable energy power source. In this proposed method, fuel cells are adopted as the base power source, and PV (photovoltaic) power generation and an ESS (energy storage system) are adopted as the power generation sources that supply the middle-load and peak-load power. When the fuel cell is applied as a base power source through the method designed in this study, a cost reduction of approximately 30.03% is expected, compared to a system that does not use a base power source. In addition, the criteria for securing a system’s power supply stability and the economics when fuel cells are adopted are analyzed in terms of the system’s installation cost.

1. Introduction

Government strategies to encourage the use of various types of renewable energy to solve global warming and environmental problems are being developed around the world, and a microgrid system that supplies power to a small area has been introduced for the spread of renewable energy. Microgrids using renewable energy resources are increasingly in use, and various design techniques to optimize the facility capacity of the microgrid components (photovoltaic power generation and an energy storage system) have been proposed in many papers [1,2,3,4,5,6,7,8,9,10]. In most papers, PV (photovoltaic) power generation or wind power generation was adopted as the main energy source of the microgrid system, and an ESS (energy storage system) was added to increase the utilization rate of the renewable energy. Studies on independent microgrids for islands or isolated areas were initially conducted. Currently, much research is being conducted to apply microgrids to not only isolated areas but also non-isolated areas [11,12]. We had previously suggested an optimal design method for the facility capacity of microgrids using the loads and load patterns of non-isolated areas. This study aims to improve the feasibility and completeness of the proposed microgrid design by improving the technique [9]. In the referenced study, a self-contained microgrid supplied the customer’s power load using only PV power generation and an ESS without receiving energy from electrical power systems. In such a self-contained microgrid, a stable power supply is the top priority [9,13,14,15,16]. However, PV power generation is affected by the weather and the limited daytime hours, and the stability of the power supply is relatively poor.
In fact, in microgrids that use PV power as a major energy supply source, there are many cases in which a diesel generator is adopted as a spare power supply source to handle the customer load [17,18,19,20,21,22,23,24]. Recently, there are many microgrids that use a fuel cell as a spare power supply instead of a diesel generator due to environmental issues [25,26,27,28,29].
In this study, we adhere to the concept of the referenced study, which is a stand-alone, microgrid-oriented renewable energy. A renewable energy source (fuel cell) that can be operated for 24 h was added to increase the stability of the power supply. We analyzed and proposed the facility capacity design criteria for three types of renewable energy sources (PV, fuel cell, and ESS) based on the facility cost.
Fuel cells, a new renewable energy source, provide a stable power supply [30,31] but are very expensive compared to PV generation, so they are mainly used to support the minimum base load of customers. However, it is necessary to increase the proportion of the fuel cell capacity in the facility to increase the stability of the power supply system. Therefore, we presented a criterion to determine the adopted cost to ensure the competitiveness of fuel cells compared with other energy resources (PV and ESS) when increasing the facility capacity.

2. Design of a System without Base Generation (Referenced Study)

In the referenced study, the capacities of solar power generation and the ESS system were designed considering the load pattern and energy independence rate of the rural area [9]. The method of designing the capacity of PV power generation and ESS devices was as follows.

2.1. Capacity Design of PV Generation Systems

The basic PV power generation capacity ( P V 0 ) is calculated as shown in (1) by considering the annual average power consumption ( P y e a r ), average daily sunlight time ( T a s ), inverter efficiency ( I e f f ), and cable loss ( C L ). Equation (2) shows the process of converting (1) to the average daily power consumption ( P d a y ) by dividing the annual average power consumption ( P y e a r ) by 365 days [9].
P V 0 = P y e a r 365 × T a s × I e f f × ( 1 C L )   [ k W ]
P V 0 = P d a y T a s × I e f f × ( 1 C L )   [ k W ]
When trying to operate a PV power generation system with ESS devices, the appropriate capacity of the PV power generation facility ( P V E ) is calculated as shown in (3), considering the charge loss ( E C L ) and discharge loss ( E D L ) of the ESS device. Because we will adopt a PV power generation system with an ESS device, in this paper, the PV power generation system ( P V E ) will be defined as a system with an ESS device [9].
P V E = P V 0 ( 1 E C L ) × ( 1 E D L )   [ k W ]

2.2. Capacity Design of the ESS Systems

The capacity of the ESS was first calculated by considering the daily power generation of the PV system, inverter efficiency, depth of discharge ( E D O D ), and state of charge ( E S O C ) of the ESS. These were calculated by excluding the amount of set-off power ( P C T ). Therefore, the final equation for the ESS capacity calculation can be expressed as (4) [9].
E S S 0 = P V E × T a s I e f f × E D O D × E S O C P C T   [ k W h ]
C C T P = P C T P d a y
In (4), the set-off power ( P C T ) is calculated by subtracting the amount of power generated by photovoltaic power from the amount of power consumed during the same period of the day. The set-off power ( P C T ) refers to the amount of PV generated power that is directly supplied to customers (target area) as it is generated. It could be expressed as (5), which also refers to the self-sufficiency rate of the PV power generation system built in the target area. In addition, it is advantageous in terms of cost reduction because it is possible to reduce the capacity of the ESS as much as the amount of set-off power ( P C T ).
Figure 1 shows the daily load pattern and daily PV power generation in the targeted region of this study. P C T is illustrated as the yellow area where the two graphs overlap. The P C T is 1038 kWh, which is calculated as 47% of the total load amount of 2197 kWh. In this study, when the actual calculation is done with C C T P , it would be substituted as 0.47.
C C T P would be further applied to the equations as 0.47 in this study.
E S S 0 = P V E × T a s I e f f × E D O D × E S O C C C T P · P d a y   [ k W h ]   E S S 0 = P V E × T a s I e f f × E D O D × E S O C 0.47 P d a y   [ k W h ]
Equations (1)–(6) are the results of the referenced study, but we would like to summarize some equations once again for the economic analysis in this study. This is not a new calculation or analysis of the existing equation but a brief reorganization of the relationship between the capacity of the PV power generation system and the capacity of the ESS system. First, (3) is reorganized for the average daily power consumption ( P d a y ) using (2), as shown in (7) [9].
P d a y = P V E { T a s × I e f f × ( 1 C L ) × ( 1 E C L ) × ( 1 E D L ) }   [ k W h ]
Equation (6) is rearranged to (8) using (7). The relationship between the capacity of the ESS system and the capacity of the solar power generation system can be summarized as (9). The remaining, excluding E S S 0 and P V E in (9), are treated as an arbitrary constant ( C 0 ), which can be organized as (10) in which C 0 could be defined as (11).
Equations (9) and (10), which reorganize the capacity of the ESS system ( E S S 0 ) using the capacity of the PV power generation system ( P V E ), are used in the economic analysis in Section 4.
E S S 0 = P V E × T a s I e f f × E D O D × E S O C C C T P · P V E { T a s × I e f f × ( 1 C L ) × ( 1 E C L ) × ( 1 E D L ) }   [ k W h ]
E S S 0 = { T a s I e f f × E D O D × E S O C C C T P · T a s × I e f f × ( 1 C L ) } P V E   [ k W h ]
E S S 0 = C 0 · P V E   [ k W h ]
  C 0 = { T a s I e f f × E D O D × E S O C C C T P · T a s × I e f f × ( 1 C L ) }  

3. Design of the System with Base Generation (Proposed Study)

3.1. Improvements in Approach

Because the system design method proposed in the referenced study is highly dependent on PV power generation with a nonuniform amount of daily power generation, an improved system design method was proposed to stably supply power to a minimum customer load. Figure 2 is a flowchart of the system design method proposed in this study. The design method presented in the flow chart is as follows.
(1)
Select the target area where the power generation system will be installed.
(2)
Collect the basic data, such as the amount of sunlight and average daily load ( P d a y ) in the target area.
(3)
Calculate the annual minimum load ( P m i n ) as the base load using the collected load data.
(4)
Calculate the capacity of the base power source ( F 0 ) to supply power to the annual minimum load ( P m i n ) and the daily base power production ( P b a s e ). At this time, the capacity is determined larger than the annual minimum load ( P m i n ), and with the minimum capacity in the rated power product. Since the fuel cell, which is the base power source, can be operated with the same output all day, the daily base power production ( P b a s e ) can be obtained by multiplying the capacity of the base power source ( F 0 ) by 24 h.
(5)
Calculate the middle and peak loads ( P r e m a i n ) by excluding as much as possible the daily base power production ( P b a s e ) from the average daily load ( P d a y ). Middle and peak loads are powered by photovoltaic and energy storage devices.
(6)
Collect details of the system components (inverter, cable, electrical energy storage, etc.).
(7)
Calculate the daily photovoltaic power production ( P V 0 ) by using the median and peak loads ( P r e m a i n ) and the previously collected details of the system components.
(8)
Calculate the photovoltaic generation capacity ( P V E ) and the energy storage capacity ( E S S 0 ).
The design method is generally similar to that of the referenced study but differs in whether or not the base load ( P m i n ) is considered in the design process. Processes (3)–(5) in the red box of the flow chart is a newly proposed process in this study; the equation of Case (1) in Process (7) is used because the base power production exists. However, the design process in the referenced study jumps directly from Process (2) to Process (6) because the base load ( P m i n ) is not considered. The equation of Case (2) in Process (7) is used in the referenced study.

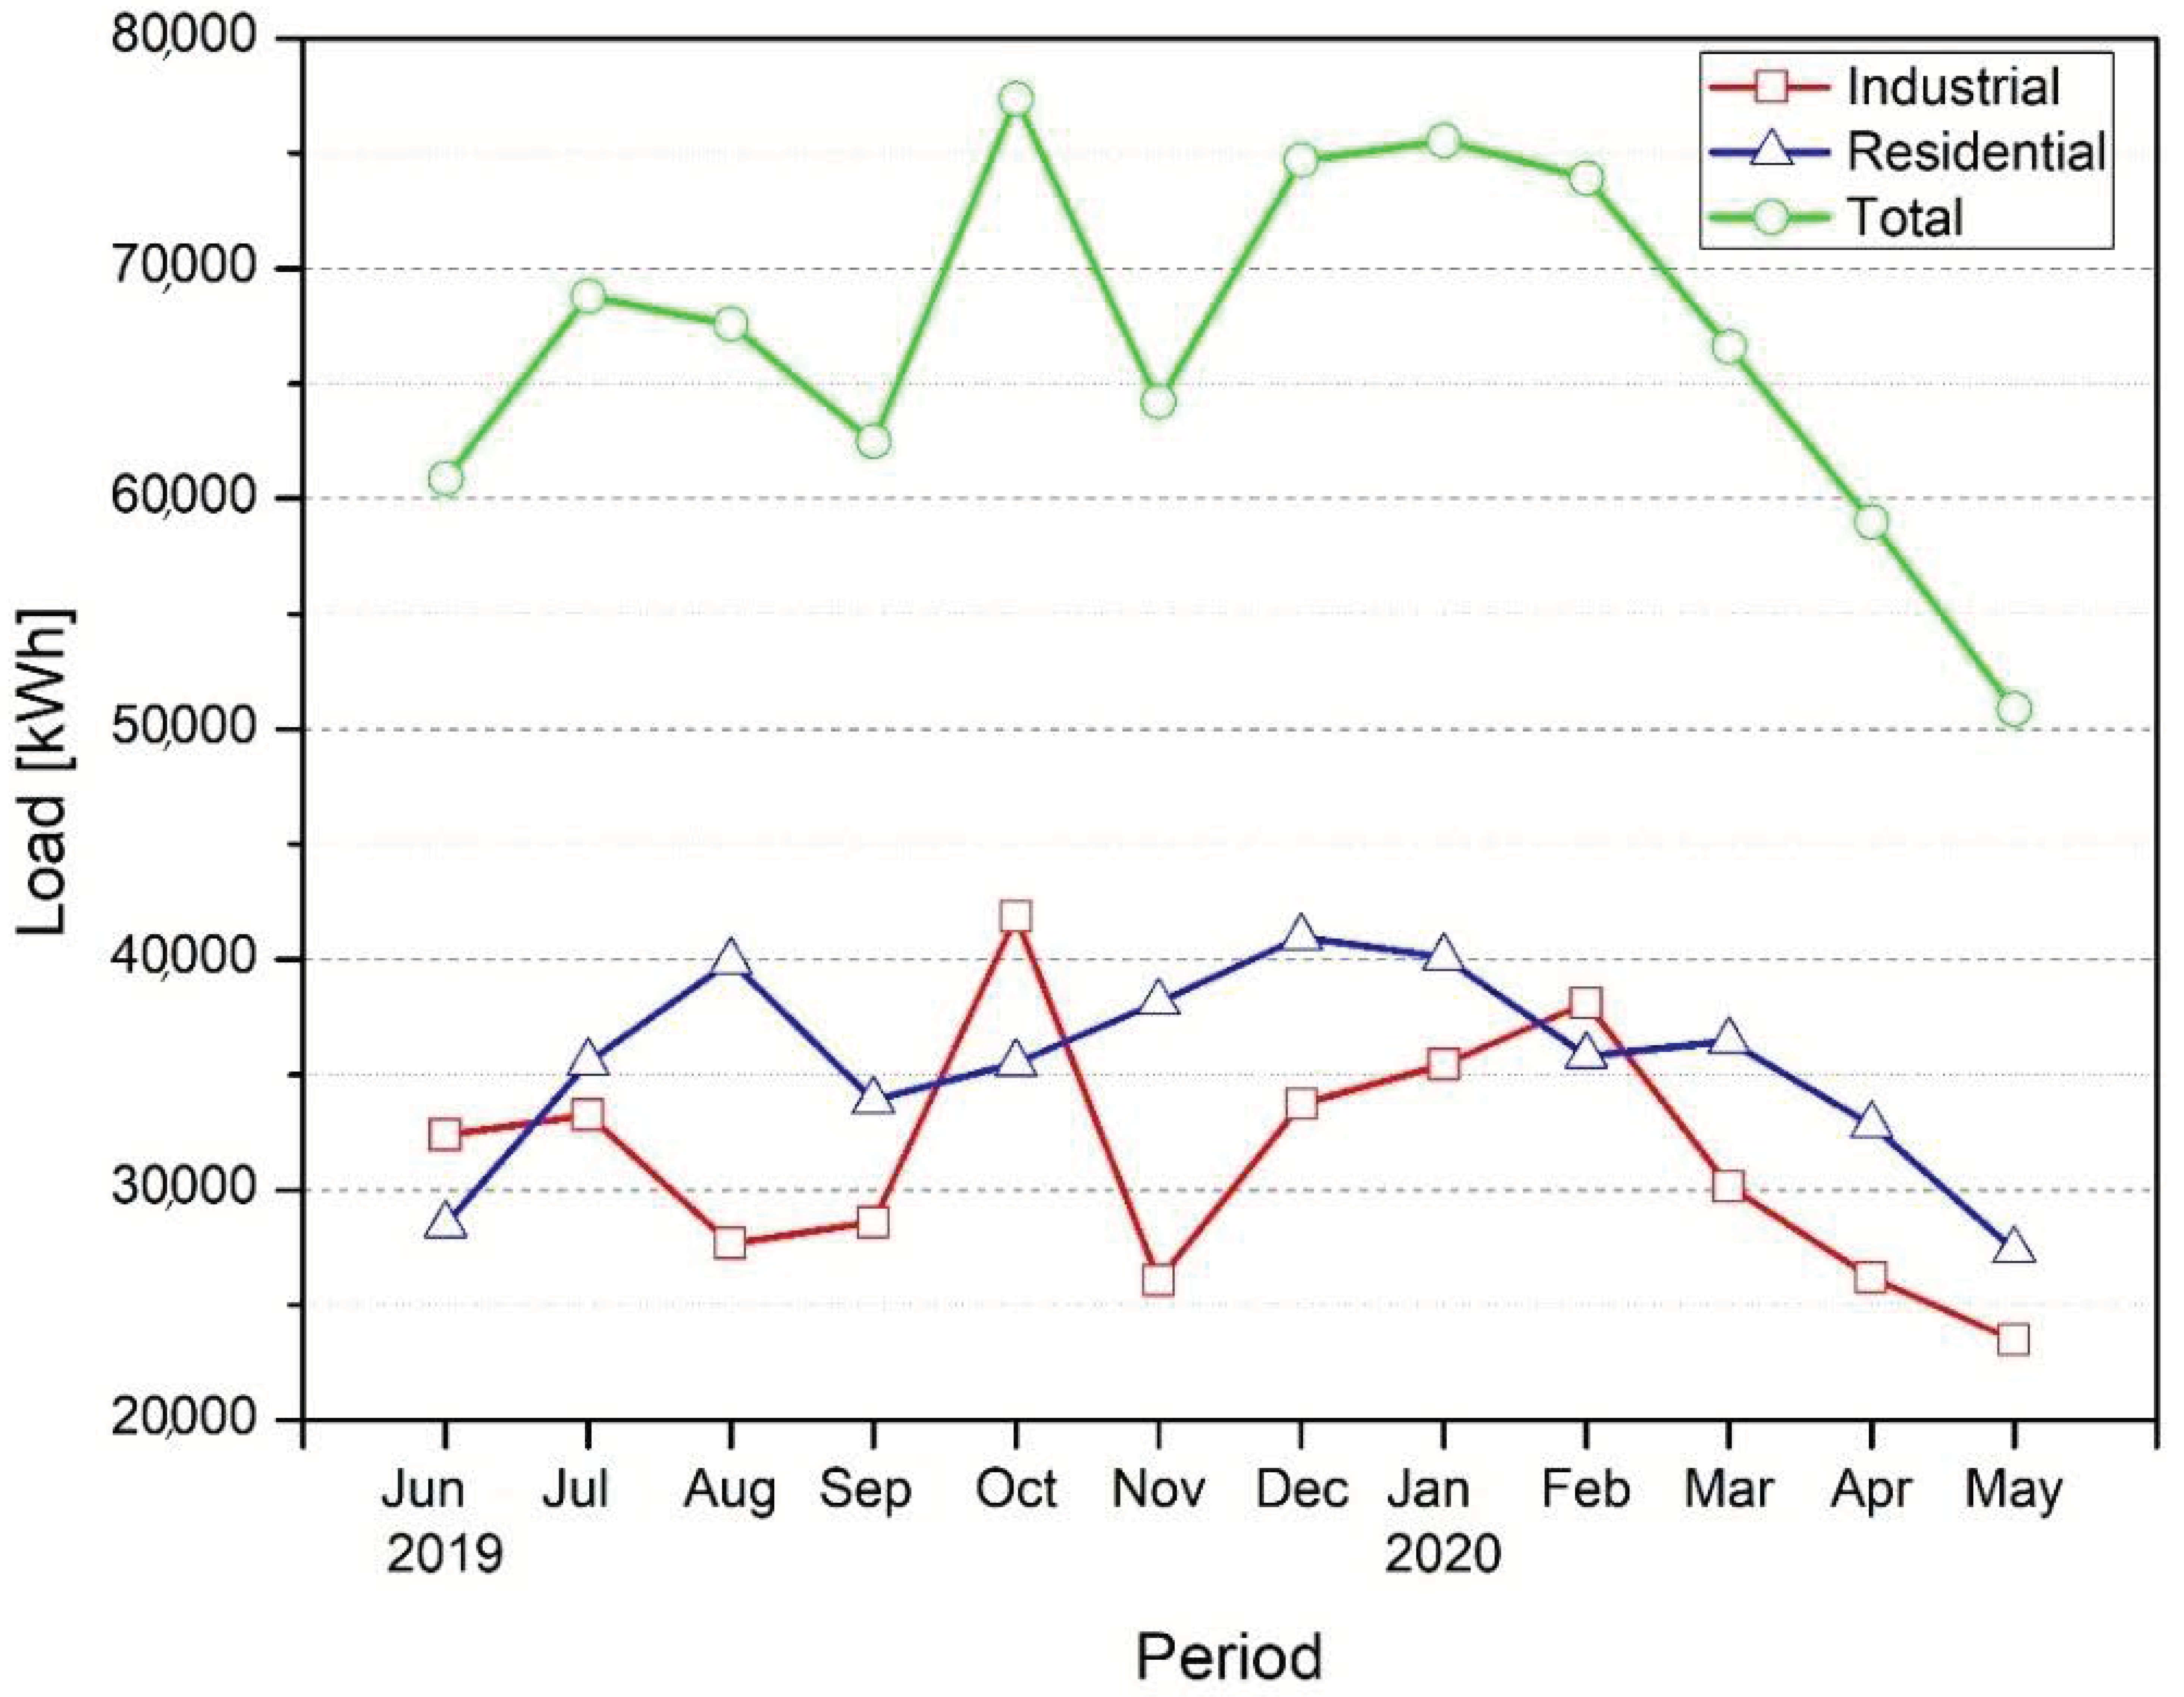
3.2. Power Load of the Target Area (Customer)

The target area (customer) in this study is an industrial complex consisting of two factories and a rural village (residential area). Rural villages are mostly households, and the two factories that make up the industrial complex are manufacturers of agricultural machinery and blowers, respectively. Rural villages and industrial complexes are located in the southern area in Korea; however, they are apart from each other, and the power systems of the two areas are not interconnected. The approximate location of the target area is near 34°59′07.5″ N and 126°40′55.0″ E. However, in this study, it is assumed that two areas (customers) are connected for the design analysis of the proposed system. Because the range of load fluctuations during the day in rural villages (blue line in Figure 3) is relatively small, when the base loads are excluded, there are practically few parts for an optimization design. Therefore, the optimization design was performed after increasing the fluctuations by adding the load (red line in Figure 3) of the industrial complex area.
The monthly power consumption for the two target areas is shown in Table 1 and plotted in Figure 4 to identify the customer’s power consumption. The power consumption data were collected for one year from June 2019 to May 2020. During this period, industrial complexes used 376,821 kWh and rural villages used 425,034 kWh. The total power consumption was 801,855 kWh and the average daily power consumption was 2197 kWh.

3.3. Design of the Base Generation Capacity

The base load of the target areas was calculated as the lowest load, 32.28 kW, by analyzing the power consumption of the industrial complexes and the residential area at the same time during the past year. The base load is powered using a fuel cell with a high power supply stability. For a fuel cell to supply as much power as the base load for 24 h, it must have a power generation capacity greater than or equal to the base load; therefore, the fuel cell system with a rated capacity of 35 kW, which is greater than the base load, was adopted as the base power source. This base power source will provide 840 kWh of electricity per day (24 h).
P m i n = 32.28   [ k W ] F 0 = 35   [ k W ] P b a s e = F 0 × 24 = 840   [ k W h ]

3.4. Capacity Design of the PV Power Generation System and ESS

The power of the middle and peak loads is supplied by the PV power generation and the ESS, excluding the base load supplied to the fuel cell. In this subsection, the capacity of the PV power generation and ESS responsible for the middle and peak loads are designed. The design method is the same as the referenced research method. The capacity of the PV power generation is calculated using (1) to (3), and the capacity of the ESS is calculated using (4).
Because the average daily power load is 2197 kWh, it is sufficient to construct a PV power generation facility for the remaining power load ( P r e m a i n ) of 1357 kWh, excluding the daily base power generation ( P b a s e ) of the fuel cell, which is 840 kWh. The PV power generation capacity ( P V 0 ) calculated using (2) was 398.99 kWh. From the referenced work, the average daily sunlight time ( T a s ) was 3.56 h, the inverter efficiency ( I e f f ) was 96.5%, and the cable loss ( C L ) was 1%.
The capacity of the PV power generation system was calculated by reflecting the loss of the ESS device to design the capacity of power systems with the PV module and ESS. The charge loss ( E C L ) and discharge loss ( E D L ) of the ESS device were applied as 6% and 4%, respectively, to add a margin to the power generation capacity. Equation (3) was used in the calculation process, and the scale of the PV facility was adjusted to 442.15 kW.
The daily generation amount of the PV power generation system, the inverter efficiency (Ieff), and the charge/discharge depth ( E S O C and E D O D ) of the ESS device were considered when calculating the capacity of the ESS with (4). The inverter efficiency ( I e f f ) was 96.5%, the charge depth ( E S O C ) was 90%, the discharge depth ( E D O D ) was 90%, and the set-off power factor ( C C T P ) was 0.47. The capacity of the ESS was designed as 1375.96 kWh.
All capacities of the PV, ESS, and fuel cell were derived using the system design method proposed in this study, and three energy sources were plotted in one graph. Figure 5 shows the portion of each power generation source (PV, ESS, and fuel cell) that were in charge of the day loads. The black line on the graph indicates the hourly average load, and the area under the black line is equal to the average daily load of 2197 kWh. The base power source (fuel cell) is installed with a rated capacity of 35 kW and produces an average of 840 kWh per day, which is 38.23% of the average daily load of 2197 kWh. PV and ESS are in charge of the remaining power to supply for the middle and peak loads at 1357 kWh.

3.5. Comparison of System Design of Referenced and Current Study

In this subsection, the design capacities of a system without a base power source (referenced study) and a system with a base power source (this study) were compared. The capacity of the system with a base power source had already been calculated (Section 3.3 and 3.4), and the result of the system design without a base power source is presented in Table 2 below. The power generation capacity of a system without a base power source was calculated by substituting the figures of the variables into the design method of the referenced study presented in Section 2, and the same figures presented in Section 3 were applied.
In Table 2, it can be seen that the capacity of the PV power generation system and the ESS was greatly reduced owing to the adoption of a base power source. The capacity of PV generation systems with an irregular power supply capability was reduced by adopting a base power source, and the reliability of the power supply to the system was improved compared to the referenced design method. However, fuel cells, which are applied as the base power sources, are very expensive. Therefore, in the next section, the two system design methods in terms of system component costs are analyzed, and a criterion for adopting the design method according to the system component costs is proposed.

4. Economic Analysis

In this section, an economic feasibility analysis was conducted according to the adoption of the base power source. Table 3 lists the unit cost of each facility element required for the economic analysis [32]. The unit cost presented in Table 3 is generally used for the cost estimation of systems according to the presence or absence of a base power source. For the MRO (management, repair, and operation), the cost scenario should include the operation cost in addition to the initial installation cost.

4.1. Cost Calculation of the System Designed with a Base Generation Power Source (Proposed Study)

For a system with a base power source, the capacity of the fuel cells was set as 35 kW. The capacities of the PV power generation system and the ESS were set as 442.15 kW and 1375.96 kWh, respectively. Therefore, the total system cost was estimated to be USD 1,243,874.70 when the unit cost for each system component shown in Table 4 was applied.

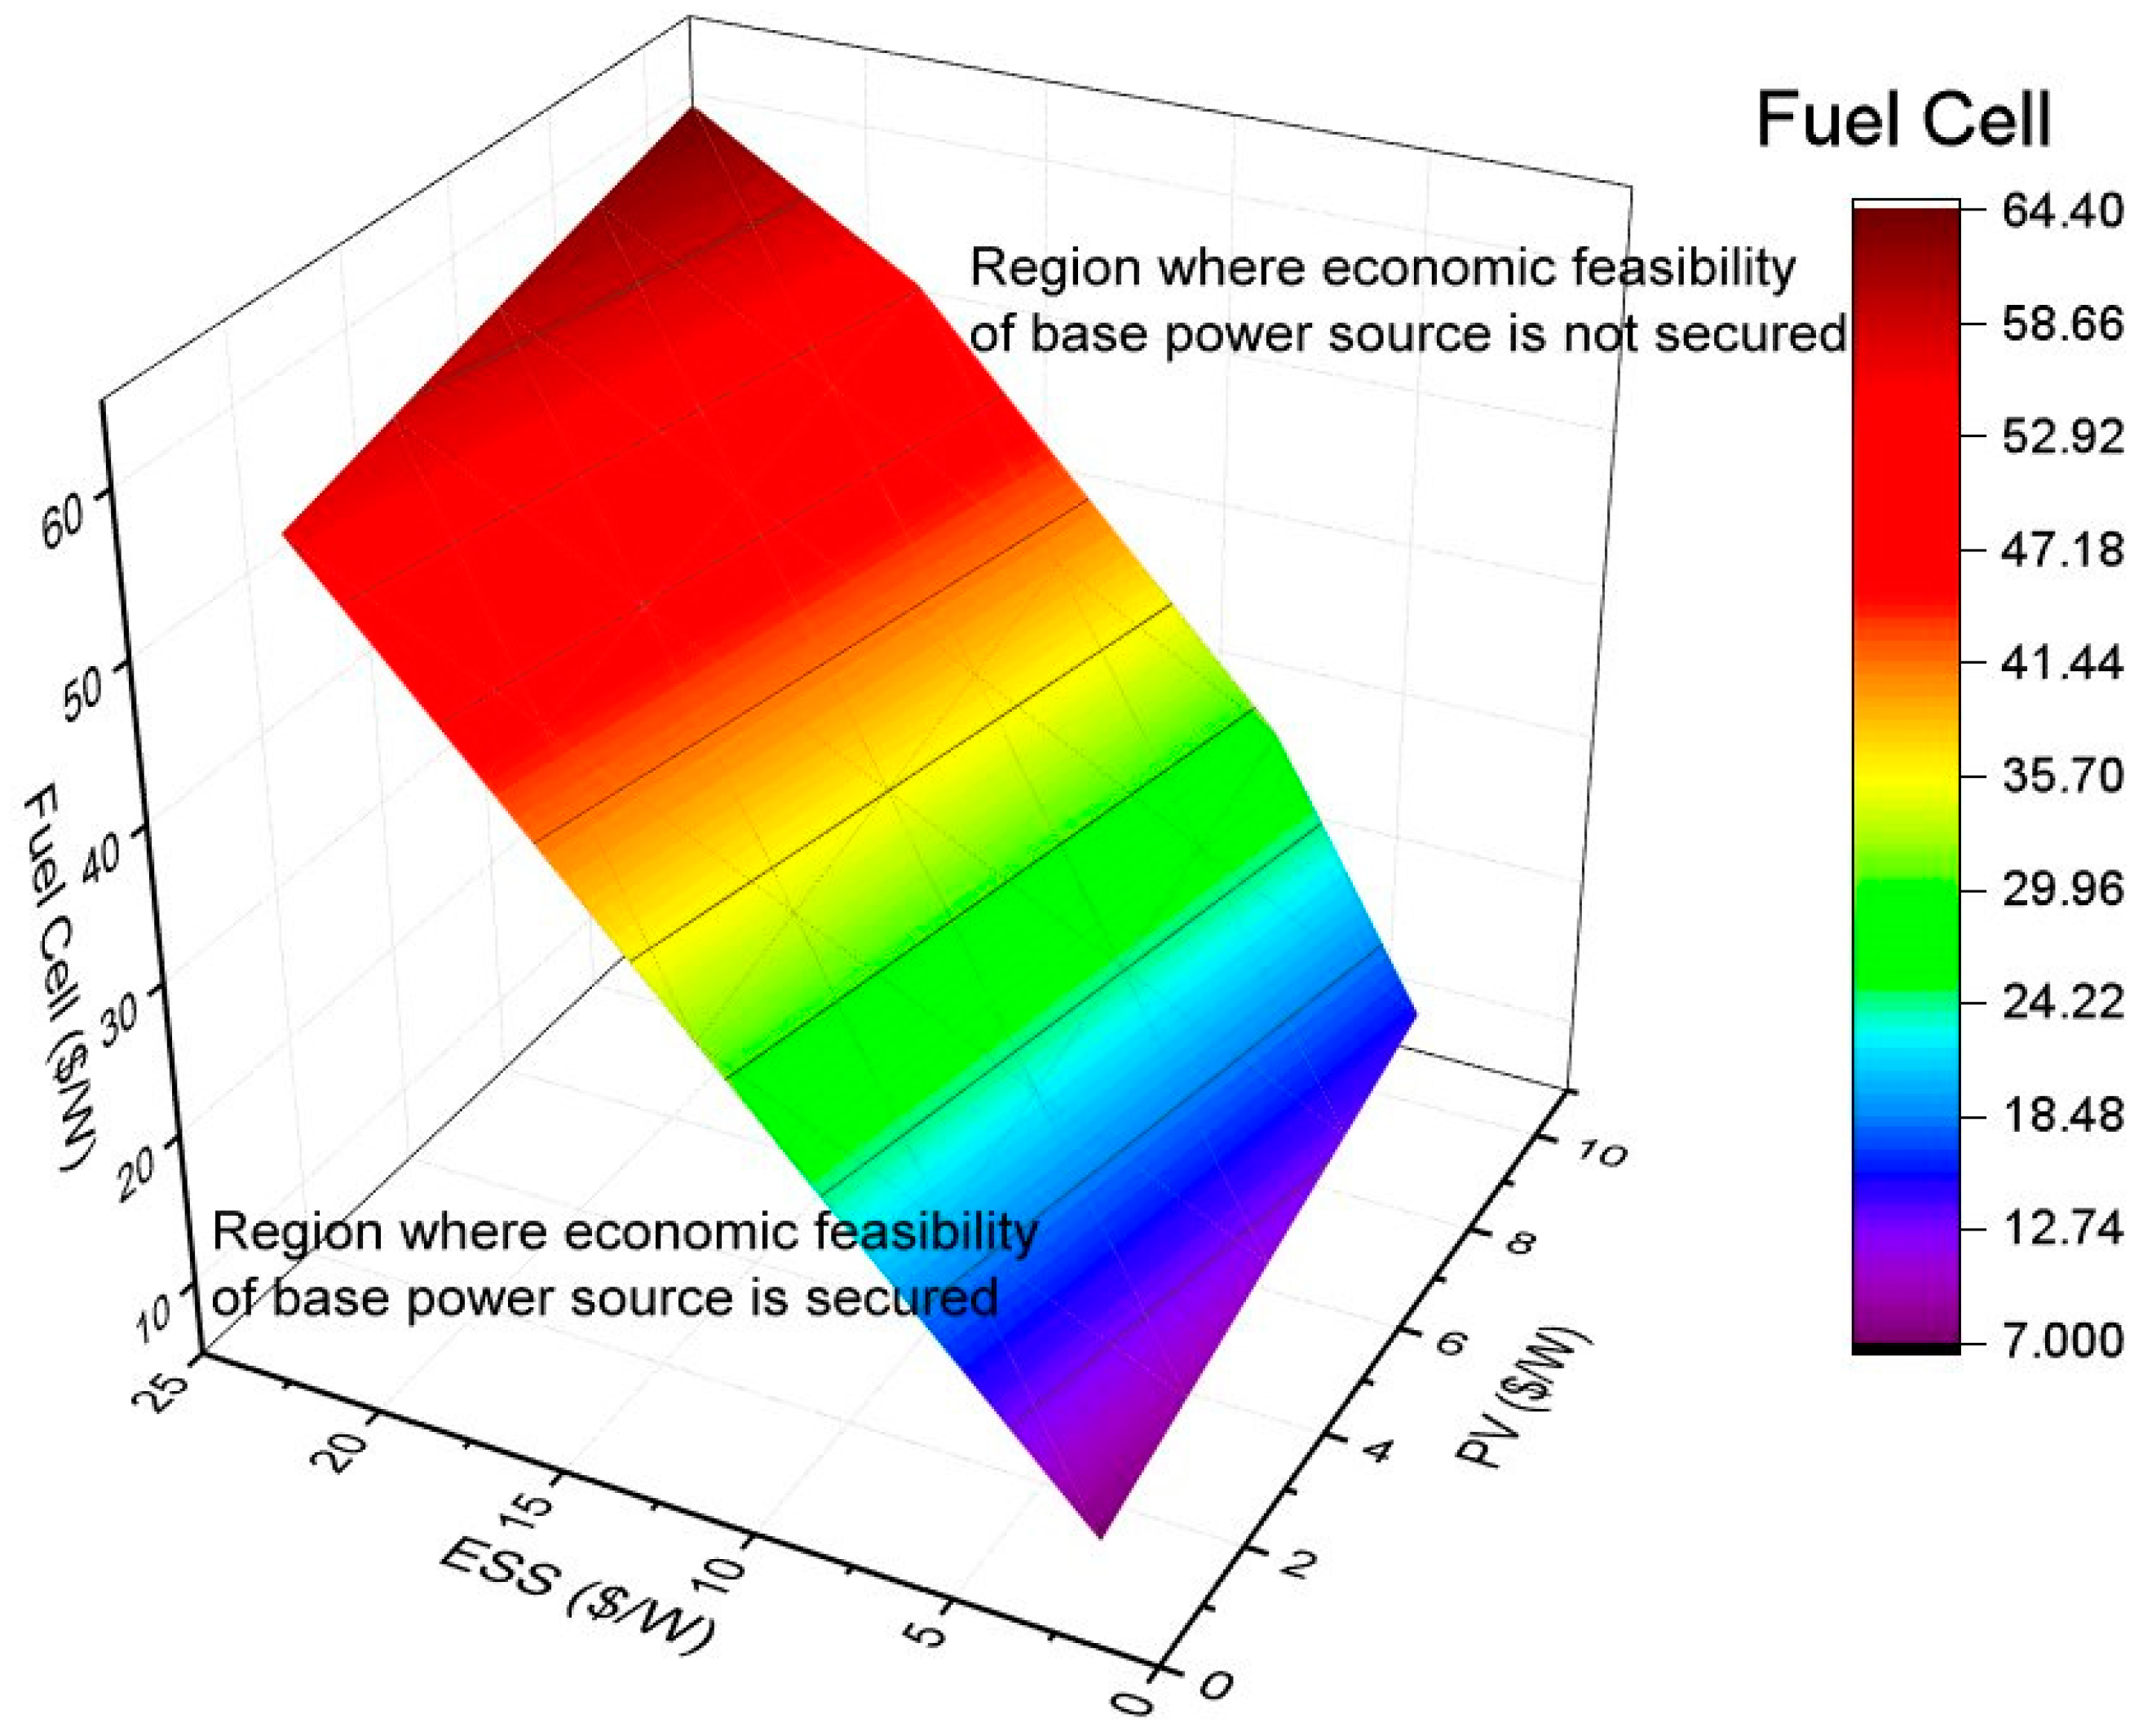
4.2. Cost Comparison (Economic Analysis)

By comparing the system cost according to the presence or absence of a base power source in Figure 6, it was estimated that the cost of a system with a base power source would be USD 533,849.15, cheaper than that of a system without a base power source, resulting in a cost reduction of about 30.03%.
Even though the fuel cell, which is a rather expensive power source, was used as the base power source in this study, improved economic feasibility was obtained compared to the referenced design method. However, the design method proposed in this study cannot always secure superior economic efficiency over the referenced design method. There will be fluctuations in the results of the economic analysis based on differences in the types of base power sources and the unit cost. In other words, if the unit price of the base power source is too high, then a design method that does not take the base power source may be more favorable in terms of economics. Therefore, we propose criteria for deciding whether to adopt a base power source in the system design according to the unit cost.
Equations (9) and (10) reorganize the capacity of the ESS as the capacity of the PV power generation system.
To analyze the relationships between the system components, the rest of the variables except for the variables related to the power generation source in (9) are treated as constants. Other variables, except those related to the power generation source, such as E S S 0 and P V E , are also treated as constants using the figures presented in Section 2, thus forming (12).
E S S 0 = { 3.56 0.965 × 0.9 × 0.9 0.47 × 3.56 × 0.965 × ( 1 0.01 ) } P V E   [ k W h ] E S S 0 = 2.96 P V E   [ k W h ]
From (12), we can see that the capacity of the ESS is presented as 2.96 times the PV power generation capacity regardless of the magnitude of the power load. In addition, this ratio is the same regardless of whether the base power source is adopted.
We will derive the criteria for deciding whether to adopt the base power source into the system design based on the unit cost of the base power source. If the total system capacity is 1, then the base load ( A ) and remaining load ( B ), excluding the base load, can be expressed as (13), in which the base load ( A ) and remaining load ( B ) are ratio values rather than actual capacity values.
A + B = 1  
The system unit cost of the base power source (fuel cell) is expressed as x , the PV power system unit price is expressed as y , and the ESS unit price is expressed as z . The cost of a system without a base power source is expressed as C 1 , and the cost of a system with a base power source is expressed as C 2 . Using the variables defined above, (12), (13), and C 1 can be expressed as (14). Here, α is a value for correcting A and B , defined as a ratio, and is an arbitrary constant to determine the actual capacity of A and B .
C 1   =   ( A + B ) α · y + 2.96 ( A + B ) α · z
The cost of a system with a base power source C 2 can be expressed as (15).
C 2   =   A · α · x + B · α · y + 2.96 B · α · z
To analyze the economic feasibility according to the presence or absence of a base power source, we attempted to find a branch point where the two systems have the same cost; that is, C 1 and C 2 are the same.
C 1   = C 2
This can be expressed as follows from (14) and (15).
( A + B ) α · y + 2.96 ( A + B ) α · z   = A · α · x + B · α · y + 2.96 B · α · z ( A + B ) y + 2.96 ( A + B ) z   = A · x + B · y + 2.96 B · z
The above equation can be summarized simply as (16).
x   = y + 2.96 z  
From (16), it can be seen that when the unit cost of a base power source (fuel cell) is equal to the sum of the unit cost of the PV and 2.96 times the unit cost of ESS, the costs of adopting and not adopting the base power source are the same. Because it is advantageous to adopt a base power source for the stability of the system’s power supply, it is recommended to adopt a base power source if the unit cost of the base power source is equal to or less than y + 2.96 z . In other words, when a base power source is adopted, the criterion for securing the system power supply stability and economic efficiency can be presented as (17).
x   y + 2.96 z
The value of C 0 , 2.96, is a variable value depending on the characteristics of the system components (inverter, ESS, cable, etc.). However, it can be treated as a constant figure because the efficiency of the inverter and the characteristics of the ESS are generally set as generalized and leveled values. If there is a problem when this constant value is applied as 2.96, owing to technological or environmental changes in the future, then it can be corrected by modifying the value of the constant ( C 0 ) using (11).
To visually see the condition of (17), a random variable was put into (17) and illustrated as a graph, as shown in Figure 7. Because the x value must be smaller than y + 2.96 z or the same in the equation, the area under the group consisting of multiple points corresponds to the criterion. The base power source has an advantageous condition in terms of economics when the x , y , and z values are located within this area.

5. Conclusions

Most of the systems with one type of renewable energy source consist of PV power generation and an ESS. Although the ESS is used as an auxiliary device in a PV power system, since it lacks the ability to generate constant power every day, there are obvious limitations to the stability of the power supply because there may be a situation (e.g., the rainy season) where solar energy cannot be received for a long period of time. In order to increase the stability of the power supply, it is essential to introduce a second energy source that can always secure a constant amount of power generation. A second energy source should be used as a base power source responsible for the minimum load in order to minimize wasted power generation.
In this paper, a design technique for constructing a renewable energy-based power system based on the customer’s power load was proposed. This design method introduces a second renewable energy power generation source in charge of the base load by improving the referenced design method with one type of renewable energy power source. The fuel cell was introduced as the base power source, and the main power source was set as PV power generation and an ESS for the middle and peak loads.
The average daily load of the area targeted in this study is 2197 kWh, and the minimum load is 32.28 kW in a year.
The capacity of the fuel cell was set to 35 kW, which is a rated capacity higher than the base load, and the amount of daily power supplied by the fuel cell is 840 kWh. The capacity of the PV and ESS is designed to supply power as much as 1357 kWh, which is middle and peak loads that the fuel cells cannot supply. The designed capacities of the fuel cell (base power sources), PV power, and ESS were set to 35 kW, 442.15 kW, and 1375.96 kWh, respectively. The total cost of the designed power generation facility was estimated to be USD 1,243,874.70. It was determined that with using a base power source, the cost would be lower than the system by a margin of USD 533,849.15. Moreover, it was calculated that there would be a cost reduction of approximately 30.03%.
In conclusion, when x (the system unit cost of the base power source (fuel cell)) is equal to or less than y (the PV power system unit price) + 2.96 z (the unit price of the ESS), the stability and economic feasibility of a power system with a base power source are secured. It should be noted that the 2.96 of the proposed criteria in this study is a value driven from a general PV system and its components’ (inverter, ESS, etc.) condition. Therefore, this figure could be changed according to technological advances or environmental changes. Equations (10) and (11) explain the elements that make up the constant 2.96 and their correlation.
It would be possible to promote the supply of economically feasible renewable energy through the proposed criterion of adopting a base power source and the system design method proposed in this study. The unit cost of the ESS and fuel cells, which are still high, will gradually decrease with the development of technology, which would also support the promotion of the spread of renewable energy. The lowest load during the year should be determined as the base load with different seasonal, monthly, and daily changes. It would then be necessary to calculate the capacity of the base power source according to such changes for future works.

Author Contributions

S.H.L.: Conceptualization, methodology, writing—original draft preparation; W.L.: data curation, writing—review and editing, formal analysis; J.H.H.: investigation, data curation; B.G.B.: visualization, validation; J.C.: resources, software; H.K.A.: supervision. All authors have read and agreed to the published version of the manuscript.

Funding

This research received no external funding.

Conflicts of Interest

The authors declare no conflict of interest.

References

  1. Dawoud, S.M.; Lin, X.; Okba, M.I. Hybrid renewable microgrid optimization techniques: A review. Renew. Sustain. Energy Rev. 2018, 82, 2039–2052. [Google Scholar] [CrossRef]
  2. Madtharad, C.; Chinabut, T. Microgrid Design for Rural Island in PEA Area. In Proceedings of the 2018 53rd International Universities Power Engineering Conference (UPEC), Glasgow, Scotland, 4–7 September 2018; pp. 1–5. [Google Scholar]
  3. Suman, G.K.; Roy, O.P. Microgrid System for A Rural Area—An Analysis of HOMER Optimised Model Using MATLAB. In Proceedings of the 2019 3rd International Conference on Recent Developments in Control, Automation & Power Engineering (RDCAPE), Noida, India, 10–11 October 2019. [Google Scholar]
  4. Bianchi, M.; Branchini, L.; Ferrari, C.; Melino, F. Optimal sizing of grid-independent hybrid PV–battery power systems for household sector. Appl. Energy 2014, 136, 805–816. [Google Scholar] [CrossRef]
  5. Arefifar, S.A.; Mohamed, Y.A.-R.I.; El-Fouly, T.H.M. Optimum Microgrid Design for Enhancing Reliability and Supply-Security. IEEE Trans. Smart Grid 2013, 4, 1567–1575. [Google Scholar] [CrossRef]
  6. Arangarajan, V.; Oo, A.M.T.; Shafiullah, G.M.; Seyedmahmoudian, M.; Stojcevski, A. Optimum design and analysis study of Stand-alone residential solar PV Microgrid. In Proceedings of the 2014 Australasian Universities Power Engineering Conference (AUPEC), Perth, Australia, 28 September–1 October 2014; pp. 1–7. [Google Scholar]
  7. Lee, C.K.; Bhang, B.G.; Kim, D.K.; Lee, S.H.; Cha, H.L.; Ahn, H.K. Estimation of Load Pattern for Optimal Planning of Stand-Alone Microgrid Networks. Energies 2018, 11, 2012. [Google Scholar] [CrossRef] [Green Version]
  8. Kim, G.G.; Choi, J.H.; Park, S.Y.; Bhang, B.G.; Nam, W.J.; Cha, H.L.; Park, N.; Ahn, H.K. Prediction Model for PV Performance With Correlation Analysis of Environmental Variables. IEEE J. Photovolt. 2019, 9, 832–841. [Google Scholar] [CrossRef]
  9. Cho, C.Y.; Lee, W.; Bhang, B.G.; Choi, J.H.; Lee, S.H.; Woo, S.C.; Ahn, H.K. Convergence Analysis of Capacities for PVs and ESS Considering Energy Self-Suciency Rates and Load Patterns of Rural Areas. Appl. Sci. 2019, 9, 5323. [Google Scholar] [CrossRef] [Green Version]
  10. Rezk, H.; Abdelkareem, M.A.; Ghenai, C. Performance evaluation and optimal design of stand-alone solar PV-battery system for irrigation in isolated regions: A case study in Al Minya (Egypt). Sustain. Energy Technol. Assess. 2019, 36, 100556. [Google Scholar] [CrossRef]
  11. Ghenai, C.; Bettayeb, M. Grid-Tied Solar PV/Fuel Cell Hybrid Power System for University Building. Energy Procedia 2019, 159, 96–103. [Google Scholar] [CrossRef]
  12. Sichilalu, S.; Tazvinga, H.; Xia, X. Integrated Energy Management of Grid-tied-PV-fuel Cell Hybrid System. Energy Procedia 2016, 103, 111–116. [Google Scholar] [CrossRef]
  13. Obara, S.; Kawai, M.; Kawae, O.; Morizane, Y. Operational planning of an independent microgrid containing tidal power generators, SOFCs, and photovoltaics. Appl. Energy 2013, 102, 1343–1357. [Google Scholar] [CrossRef]
  14. Liu, Z.; Zhang, Z.; Zhuo, R.; Wang, X. Optimal operation of independent regional power grid with multiple wind-solar-hydro-battery power. Appl. Energy 2019, 235, 1541–1550. [Google Scholar] [CrossRef]
  15. Chae, W.-K.; Lee, H.-J.; Won, J.-N.; Park, J.-S.; Kim, J.-E. Design and Field Tests of an Inverted Based Remote MicroGrid on a Korean Island. Energies 2015, 8, 8193–8210. [Google Scholar] [CrossRef]
  16. Bhang, B.G.; Lee, W.; Kim, G.; Choi, J.H.; Park, S.Y.; Ahn, H.K. Power Performance of Bifacial c-Si PV Modules with Different Shading Ratios. IEEE J. Photovolt. 2019, 9, 1413–1420. [Google Scholar] [CrossRef]
  17. Ndwali, P.K.; Njiri, J.G.; Wanjiru, E.M. Optimal Operation Control of Microgrid Connected PV-Diesel Generator Backup System under Time of Use Tariff. J. Control Autom. Elect. Syst. 2020, 31, 1001–1014. [Google Scholar] [CrossRef]
  18. Alramlawi, M.; Timothy, A.F.; Gabash, A.; Mohagheghi, E.; Li, P. Optimal Operation of PV-Diesel MicroGrid with Multiple Diesel Generators Under Grid Blackouts. In Proceedings of the 2018 IEEE International Conference on Environment and Electrical Engineering and 2018 IEEE Industrial and Commercial Power Systems Europe (EEEIC/I&CPS Europe), Palermo, Italy, 12–15 June 2018; pp. 1–6. [Google Scholar]
  19. Tang, Q.; Liu, N.; Zhang, J. Optimal Operation Method for Microgrid with Wind/PV/Diesel Generator/Battery and Desalination. J. Appl. Math. 2014, 2014, 857541. [Google Scholar] [CrossRef] [Green Version]
  20. Zhang, J.; Huang, L.; Shu, J.; Wang, H.; Ding, J. Energy Management of PV-diesel-battery Hybrid Power System for Island Stand-alone Micro-grid. Energy Procedia 2017, 105, 2201–2206. [Google Scholar] [CrossRef]
  21. Gharibi, M.; Askarzadeh, A. Technical and economical bi-objective design of a grid-connected photovoltaic/diesel generator/fuel cell energy system. Sustain. Cities Soc. 2019, 50, 101575. [Google Scholar] [CrossRef]
  22. Ghenai, C.; Bettayeb, M. Modelling and performance analysis of a stand-alone hybrid solar PV/Fuel Cell/Diesel Generator power system for university building. Energy 2019, 171, 180–189. [Google Scholar] [CrossRef]
  23. Das, B.K.; Zaman, F. Performance analysis of a PV/Diesel hybrid system for a remote area in Bangladesh: Effects of dispatch strategies, batteries, and generator selection. Energy 2019, 169, 263–276. [Google Scholar] [CrossRef]
  24. Bosisio, A.; Moncecchi, M.; Cassetti, G.; Merlo, M. Microgrid design and operation for sensible loads: Lacor hospital case study in Uganda. Sustain. Energy Technol. Assess. 2019, 36, 100535. [Google Scholar] [CrossRef]
  25. Krishan, O.; Suhag, S. Grid-independent PV system hybridization with fuel cell-battery/supercapacitor: Optimum sizing and comparative techno-economic analysis. Sustain. Energy Technol. Assess. 2020, 37, 100625. [Google Scholar] [CrossRef]
  26. Khan, M.W.; Wang, J.; Xiong, L.; Ma, M. Modelling and optimal management of distributed microgrid using multi-agent systems. Sustain. Cities Soc. 2018, 41, 154–169. [Google Scholar] [CrossRef]
  27. Gharibi, M.; Askarzadeh, A. Size and power exchange optimization of a grid-connected diesel generator-photovoltaic-fuel cell hybrid energy system considering reliability, cost and renewability. Int. J. Hydrogen Energy 2019, 44, 25428–25441. [Google Scholar] [CrossRef]
  28. Singh, S.; Chauhan, P.; Singh, N. Capacity optimization of grid connected solar/fuel cell energy system using hybrid ABC-PSO algorithm. Int. J. Hydrogen Energy 2020, 45, 10070–10088. [Google Scholar] [CrossRef]
  29. Saleem, M.S.; Abas, N.; Kalair, A.R.; Rauf, S.; Haider, A.; Tahir, M.S.; Sagir, M. Design and optimization of hybrid solar-hydrogen generation system using TRNSYS. Int. J. Hydrogen Energy 2020, 45, 15814–15830. [Google Scholar] [CrossRef]
  30. Romeri, M.V. Considering Hydrogen Fuel Cells Powertrain as Power Generation Plant. World Electr. Veh. J. 2010, 4, 933–938. [Google Scholar] [CrossRef] [Green Version]
  31. Staffell, I.; Scamman, D.; Abad, A.V.; Balcombe, P.; Dodds, P.E.; Ekins, P.; Shah, N.; Ward, K.R. The role of hydrogen and fuel cells in the global energy system. Energy Environ. Sci. 2019, 12, 463–491. [Google Scholar] [CrossRef] [Green Version]
  32. Yujin, O. Current status and prospect of the domestic renewable energy market and fuel cell power generation industry. Hana Ind. Inf. 2019, 1, 1–26. [Google Scholar]
Figure 1. The set-off power in a day.
Applsci 10 07822 g001
Figure 2. Flow chart of the system design method.
Applsci 10 07822 g002
Figure 3. Hourly power load of the residential and industrial complexes in a year (cumulative amount).
Applsci 10 07822 g003
Figure 4. Average monthly power load of the residential area and industrial complexes.
Applsci 10 07822 g004
Figure 5. Portion of each generation source for the day loads.
Applsci 10 07822 g005
Figure 6. Cost comparison according to the presence or absence of a base power source.
Applsci 10 07822 g006
Figure 7. Visualization of the criterion under which a system with base power source is economical.
Applsci 10 07822 g007
Table 1. Monthly power consumption of the target areas.
LoadResidential Area
(kWh)
Industrial Complexes (kWh)Total
(kWh)
Period
June 201928,49532,37060,865
July 201935,53133,26868,799
August 201939,92027,64867,568
September 201933,88928,58962,478
October 201935,50541,84277,347
November 201938,13926,06364,202
December 201940,96433,71874,682
January 202040,08635,45675,542
February 202035,81938,09673,915
March 202036,46030,13666,596
April 202032,82326,16558,988
May 202027,40323,47250,875
Total425,034376,821801,855
Monthly Average35,42031,40266,821
Daily Average116410322197
Table 2. Results of the system design according to the presence or absence of a base power source.
Power GenerationReferenced Research
(Without Base Load
Power Generation)
Current Research
(With Base Load
Power Generation)
PV ( P V E )715.84 kW442.15 kW
ESS ( E S S 0 )2227.70 kWh1375.96 kWh
Fuel cell ( F 0 )-35.00 kW
Table 3. Unit cost by system components.
ComponentUnit Cost
PV generation system1083 $/kW
ESS450 $/kWh
Fuel cell generation system4167 $/kW
Table 4. Cost of the system designed with a base generation power source.
ComponentUnit PriceInstallation CapacityCost (USD)
PV ( P V E )1083 $/kW442.15 kW478,846.93
ESS ( E S S 0 )450 $/kWh1375.96 kWh619,182.77
Fuel cell ( F 0 )4167 $/kW35.00 kW145,845.00
Total1,243,874.70
Publisher’s Note: MDPI stays neutral with regard to jurisdictional claims in published maps and institutional affiliations.

