Article

Spatial Mobility of U and Th in a U-enriched Area (Central Portugal)

1
Institute of Earth Sciences, Campus de Gualtar, University of Minho, 4710-057 Braga, Portugal
2
GeoBioTec–Department Geosciences, University of Aveiro, 3810-193 Aveiro, Portugal
3
Institute of Earth Sciences, Polytechnic Institute of Castelo Branco, Campus da Talagueira, University of Évora, 6000-767 Castelo Branco, Portugal
*
Author to whom correspondence should be addressed.
Appl. Sci. 2020, 10(21), 7866; https://doi.org/10.3390/app10217866
Submission received: 13 October 2020 / Revised: 31 October 2020 / Accepted: 2 November 2020 / Published: 6 November 2020

Abstract

:
Uranium and thorium are toxic in different environments. The exploitation of uranium mines and associated mine drainage leaching towards streams, sediments, and soils cause relevant pollution. The U-mine areas present high concentrations of potentially toxic elements with several consequences to ecosystems and human health. Physicochemical and potentially toxic elements of mine dumps, stream sediments, and soils from the Canto Lagar uranium mine area (Central Portugal) were analyzed. Stream sediments, soils, and mine dumps show a large range in the concentration values of Fe, U, As, Cu, Zn, Pb, and Th, suggesting geological and mine contributions. Most of the selected potential toxic elements from sediments present a low to moderate contamination degree, except for As, W, and U, which vary between high and very high contamination index. The soils must not be used in agricultural or residential activities due to contamination in As and U. This abandoned mine represents an environmental risk due to the spatial mobility and dispersion of potentially toxic elements from the dumps to the sediments and soils, as well as by surface runoff and wind.

1. Introduction

The metal uranium (U) is toxic due to its chemical and radioactivity. However, its chemical toxicity is harmful to human health, while thorium (Th) is considered only radiotoxic. The biochemical toxicity of U has a higher danger than that resulting from its radioactivity, by six orders of magnitude [1]. The uranium mines, with associated open-pits and dumps, promote the leaching of uranium to streams, sediments, and soils. This uranium mobility causes relevant pollution to surface and groundwater, sediments, soils, and humans. Different areas of closed U-bearing mines are potentially dangerous to the environment and human health due to high uranium concentrations. Uranium can be mobilized from mine dumps to water (surface and groundwater), sediments, and soils.
Uranium is a toxic metal that causes kidney disease and increases the risk associated with reproductive cancers and human fertility problems [2]. In areas with uranium-contaminated sites, this metal could enter the human food chain by water (surface and groundwater) and/or from soil to plants, and consequently to animals. In mining areas, some metals, like uranium, being transferred from mine dumps to sediments and soils, by water drainage and atmospheric deposition processes, constitute a major issue concerning soil pollution [3].
The human health hazards associated with the radionuclides depend on their ability to accumulate in human tissues [4].
In Europe, uranium mines overtook the maximum exploitation rate, particularly during the period 1960–1990, and consequently a U depletion of the deposits occurred and the mines ceased their activities [5]. As a result, in the European Union, there are about 150 uranium mines, particularly concentrated in the eastern region of Europe [6,7]. These uranium mines present several millions of tons of tailings and associated mine wastes [8]. However, the effect of naturally occurring radioactive material (NORM) and the impact of solid waste on human health are not understood [9]. There are abandoned mines in France [10], Poland [11], Portugal [12], the United Kingdom [13], and Spain [14], where workers and citizens are exposed to human health risks. In Portugal, more than 60 uranium mines were developed, including underground and/or open-pit mines. These mines were included in a national program, and were strongly associated with the collaboration with the United Kingdom Atomic Energy Authority, to provide uranium materials for nuclear armament support during the Cold War in the late 1940s [15]. There are uranium deposits from Portugal that were also used in the nuclear industry in the United States [16].
Risk assessments of soil contamination with NORM are very important, particularly for young children, due to soil ingestion whether purposefully or inadvertently [17].
The abandoned uranium mine of Canto do Lagar is located in the center region of Portugal. The mine area includes two dumps with deposited rejected materials and an open pit filled with rainwater. The main subject of this paper is the evaluation of U and Th mobility, and associated trace elements, through the mine dump’s materials, stream sediments, and soils. The obtained results allow for the assessment of mobility processes from different solid reservoirs and the potential contamination associated with the old mine and background enrichment from the region.

2. Materials and Methods

The exploitation of the uranium mine from Canto do Lagar produced about 12.4 tons of tri-uranium octoxide (U3O8), during 1987–1988, in an open pit. The geology mainly comprises coarse-grained granite rock, with two micas (higher biotite amounts than muscovite).
The uranium mineralization is represented by two brecciated areas, with an average direction N30°E, which is parallel to the coarse-grained porphyritic granite. The uranium deposit has a width of approximately 10 m and is silicified, sericitized, and reddish jasperized. The gaps are accompanied by two thin veins of white quartz, orientated 70° to 80° WNW, with iron and jasper enrichment, containing minerals of chalcedony, red jasper, and opal. The uranium deposit is associated with quartz veins containing secondary phosphates of uranium-autunite and torbernite. The mine is abandoned. The rejected materials (1,000,000 tons) were deposited in two dumps (Figure 1a), and a lake, with an area of about 5000 m2 (Figure 1b), formed in the open pit. All these materials are exposed to atmospheric agents, which constitute a possible source of contamination for agricultural soils and water lines in their surroundings.
The area presents rural features, including abundant vegetation, containing dominantly Pinus and underbrush. Agricultural areas are located around the abandoned mine, dominated by olive groves, chestnut trees, and vineyards with pine trees and pastures (Figure 1c,d). The water from the S. Paio river is used for the irrigation of agricultural products (Figure 1e), and the water is extracted from wells located on the riverbanks (Figure 1f). Surface water drainage occurs at the S. Paio stream, which is located around 200 m on the northwest from the Canto Lagar area, an affluent of the left margin from Mondego River, at 1000 m NNW of the abandoned mine area. The surface relief is smooth, with altitudes ranging from 300 to 380 m, where the abandoned mine with dumps and open pit is located.
The Canto Lagar region has a warm and temperate climate of the Csb type in the classification of Köppen and Geiger [18]. The annual average precipitation is 134 mm. The winter season registers a higher amount of precipitation than summer, with a difference of about 236 mm rainwater between the wettest and driest months. Generally, the wet period occurs from October to May, and the average annual temperature is 13.8 °C, according to the registration of the meteorological station from Gouveia, in the center of Portugal [19].
In the study area, a total of 16 dump samples, collected in two different mine dumps, 14 stream sediment samples, and 40 samples of soil were selected. The sediment samples were located in the active stream-bed along the S. Paio stream (7 samples), in the seasonal tributary which traverses the mine dumps (4 samples), and also three samples were located upstream of the mine site. The soil sample of each point was represented by a homogenized mixture of three subsamples from the same local area. Soil samples from the study area were also collected upstream of the mine influence area (7 samples), which represent the natural background and allow to evaluate the mobility of the metal due to the abandoned mine’s activities.
The stream sediments and soils were collected at a 20 to 30 cm depth from the surface and carried out in clean containers of polyethylene to the Chemical Laboratory of the Department of Earth Sciences, University of Coimbra (Portugal). All samples were placed in an oven (temperature of 40 °C) to dry, and after that were disjointed using a rubber hammer. The disaggregated samples were sieved using a sieve of nylon with a 2 mm diameter. The water parameter (pH) was determined using a suspension solution of solid and water, with a ratio of 2.5 from liquid/solid [20]. The water physicochemical values of electrical conductivity (EC) were also obtained using a suspension solution of solid and water, with a ratio of 2.5 [21].
All sample fractions <250 µm were chemically attacked using a solution of aqua regia (3 HCl:1 HNO3) and filtered by a filter with a 2 µm diameter. Selected metals, metalloids, and rare earth elements (REEs) were detected using Inductively Coupled Plasma-Optical Emission Spectroscopy (ICP-OES), with a Horiba Jobin Yvon JV2000 2 spectrometer. In each batch of 26 samples, a duplicate of the blank sample and an internal laboratory standard sample were analyzed. The soil laboratory standard was also chemically attacked by aqua regia solution, and the obtained results were compared with the certified BCR-143R sewage sludge amended soil (Table 1). The detection limit of each element was calculated from the signal of a blank sample, and the analytical differences were obtained by the signal from each half-second interval of the sample [22].
The detection limit of each element was obtained in mg/L and had to be converted to mg/kg with the following expression:
Detection Limit = (X × 0.1)/m, where “X” corresponds to the Detection Limit obtained by the analytical equipment, in mg/L, and “m” represents the average heavy masses of the samples, in kg.

3. Results and Discussion

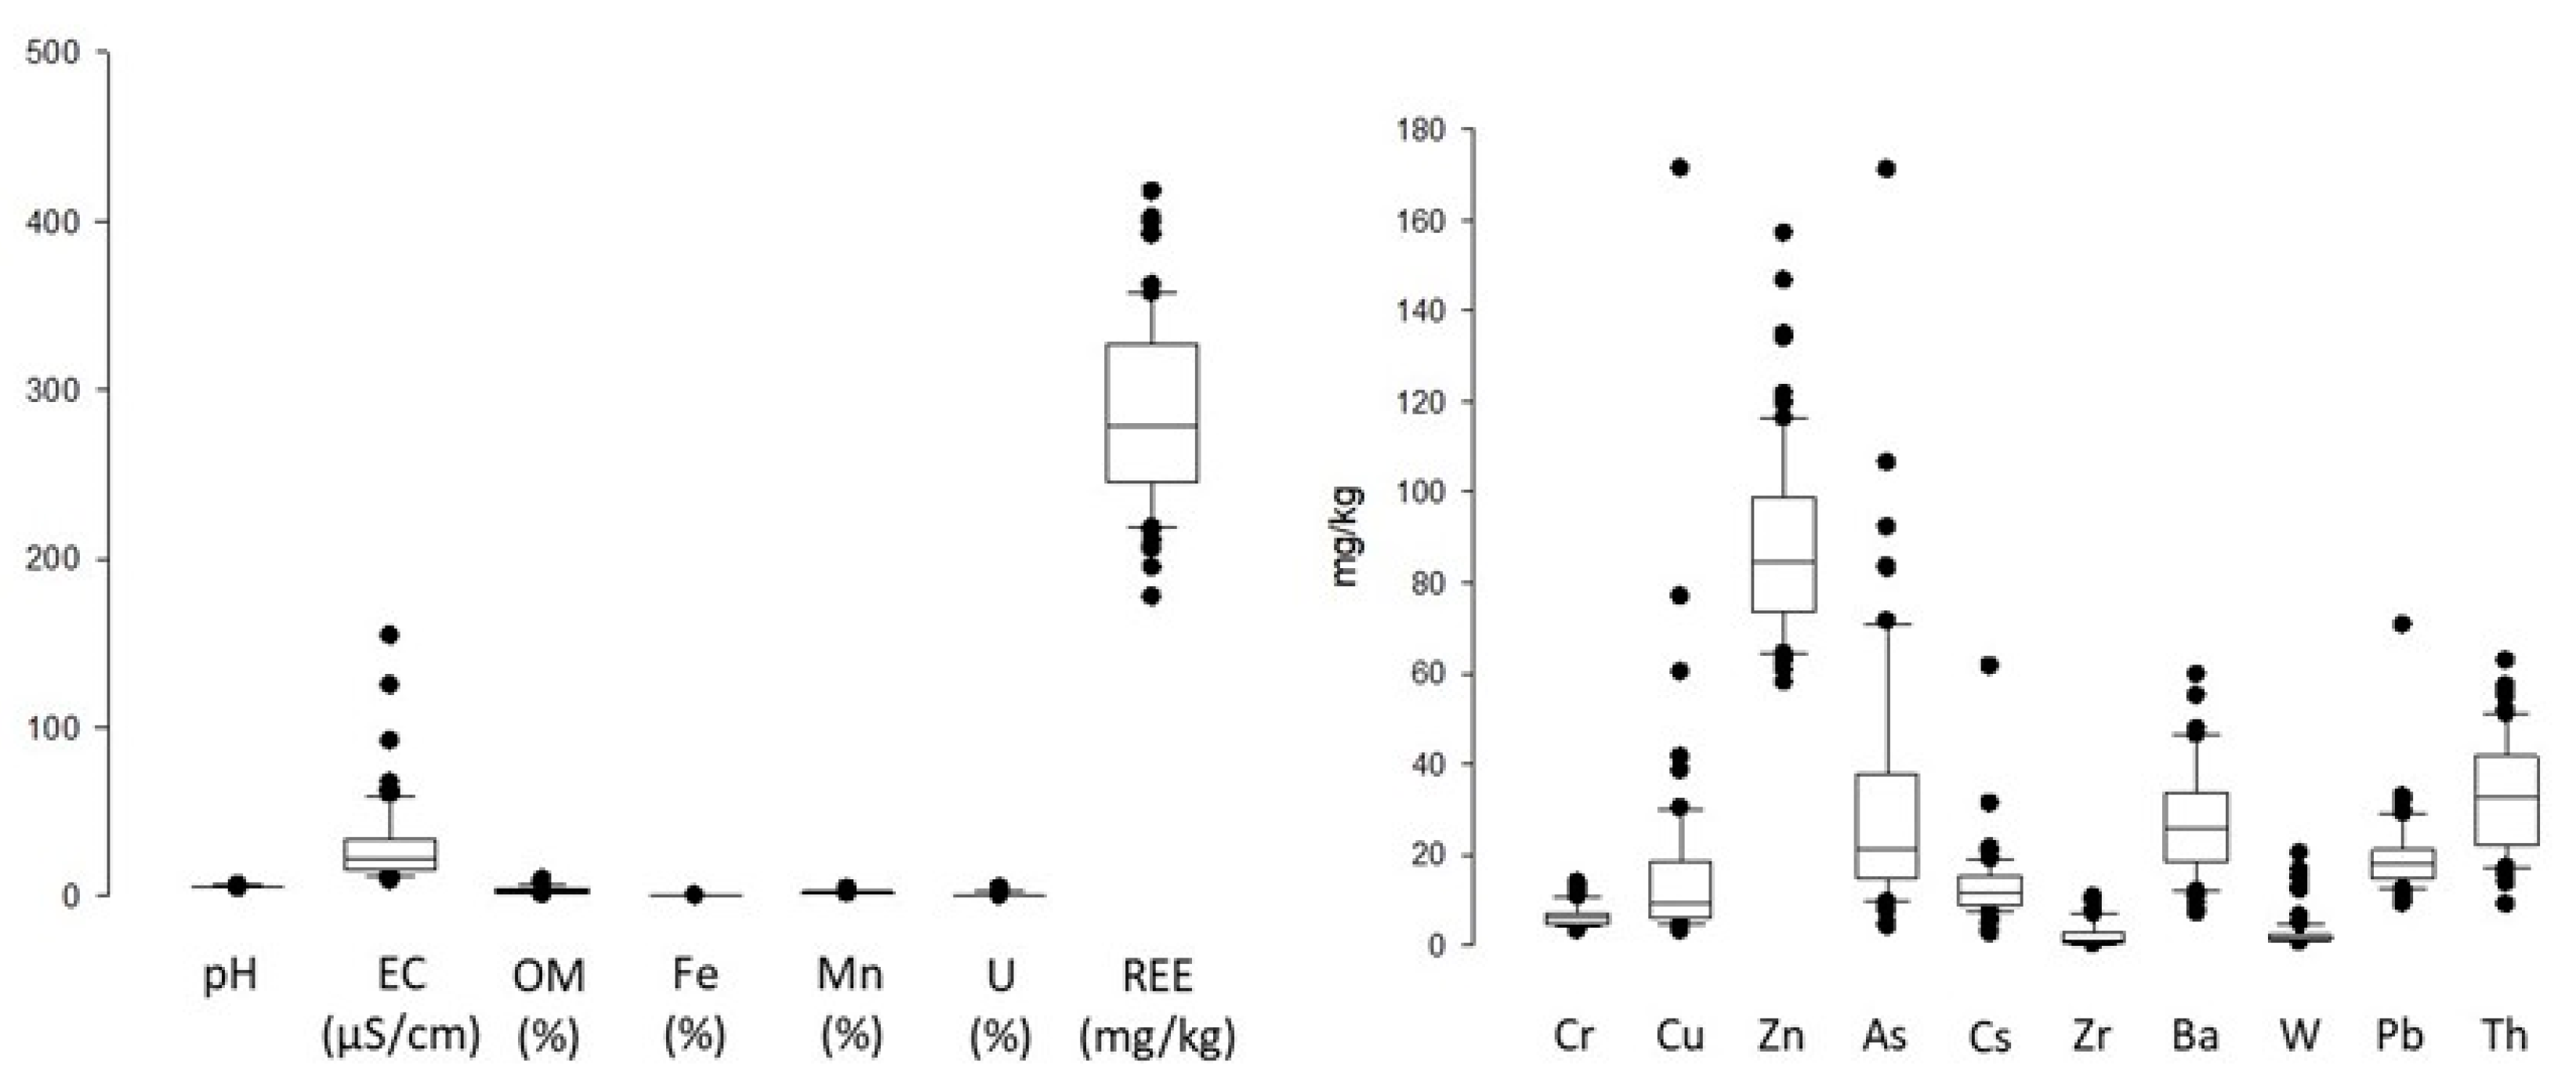
3.1. Geochemistry of Stream Sediments and Soils

The average, median, and standard deviation of physicochemical parameters, potentially toxic elements, and rare earth elements concentrations from stream sediments, soils, and mine dumps from the Canto Lagar area are presented in Table 2.
Almost all of the element contents detected in stream sediments, soils, and mine dumps showed a huge variation, with values up to Fe—42,559 mg/kg, U—4541 mg/kg, As—171 mg/kg, Cu—171 mg/kg, Zn—157 mg/kg, Pb—71 mg/kg, and Th—63 mg/kg, associated with the natural environment but also with the mine contribution. The highest As, U, Pb, and Th were found on the mine dumps. Otherwise, the highest REE (417.5 mg/kg), Zn (134.9 mg/kg), Cu (171.4 mg/kg), Cs (61.5 mg/kg), Ba (59.7 mg/kg), and Ni (19.5 mg/kg) contents occurred in soils and reflect the geogenic influence, associated with the background lithologies cropping out of the area.
The variation of the physicochemical parameters, trace elements, and REE concentrations in stream sediments, soils, and mine dumps are represented as boxplots (Figure 2). The Y-axis depicts the concentration of each element. The boxplot limits draw non-outliers, represented by the upper and the lower quartile, respectively, within an amplitude for interquartile of 1.5 times. Electrical conductivity, Cu, and As presented with severe outliers (Figure 2).
Stream sediments, soils, and mine dumps from the Canto Lagar area showed a large range in the concentration values of trace elements. The highest As, U, Pb, and Th contents were found on the mine dumps, suggesting mine influence. Otherwise, the highest REE, Zn, Cu, Cs, Ba, and Ni contents were found in the soil and reflect geogenic influence associated with the background lithologies from the region. Iron occurred in high concentrations and is associated with the presence of Fe-oxy and hydroxides and the capacity of metals and metalloids adsorption, as found in other mine areas [12,23,24].

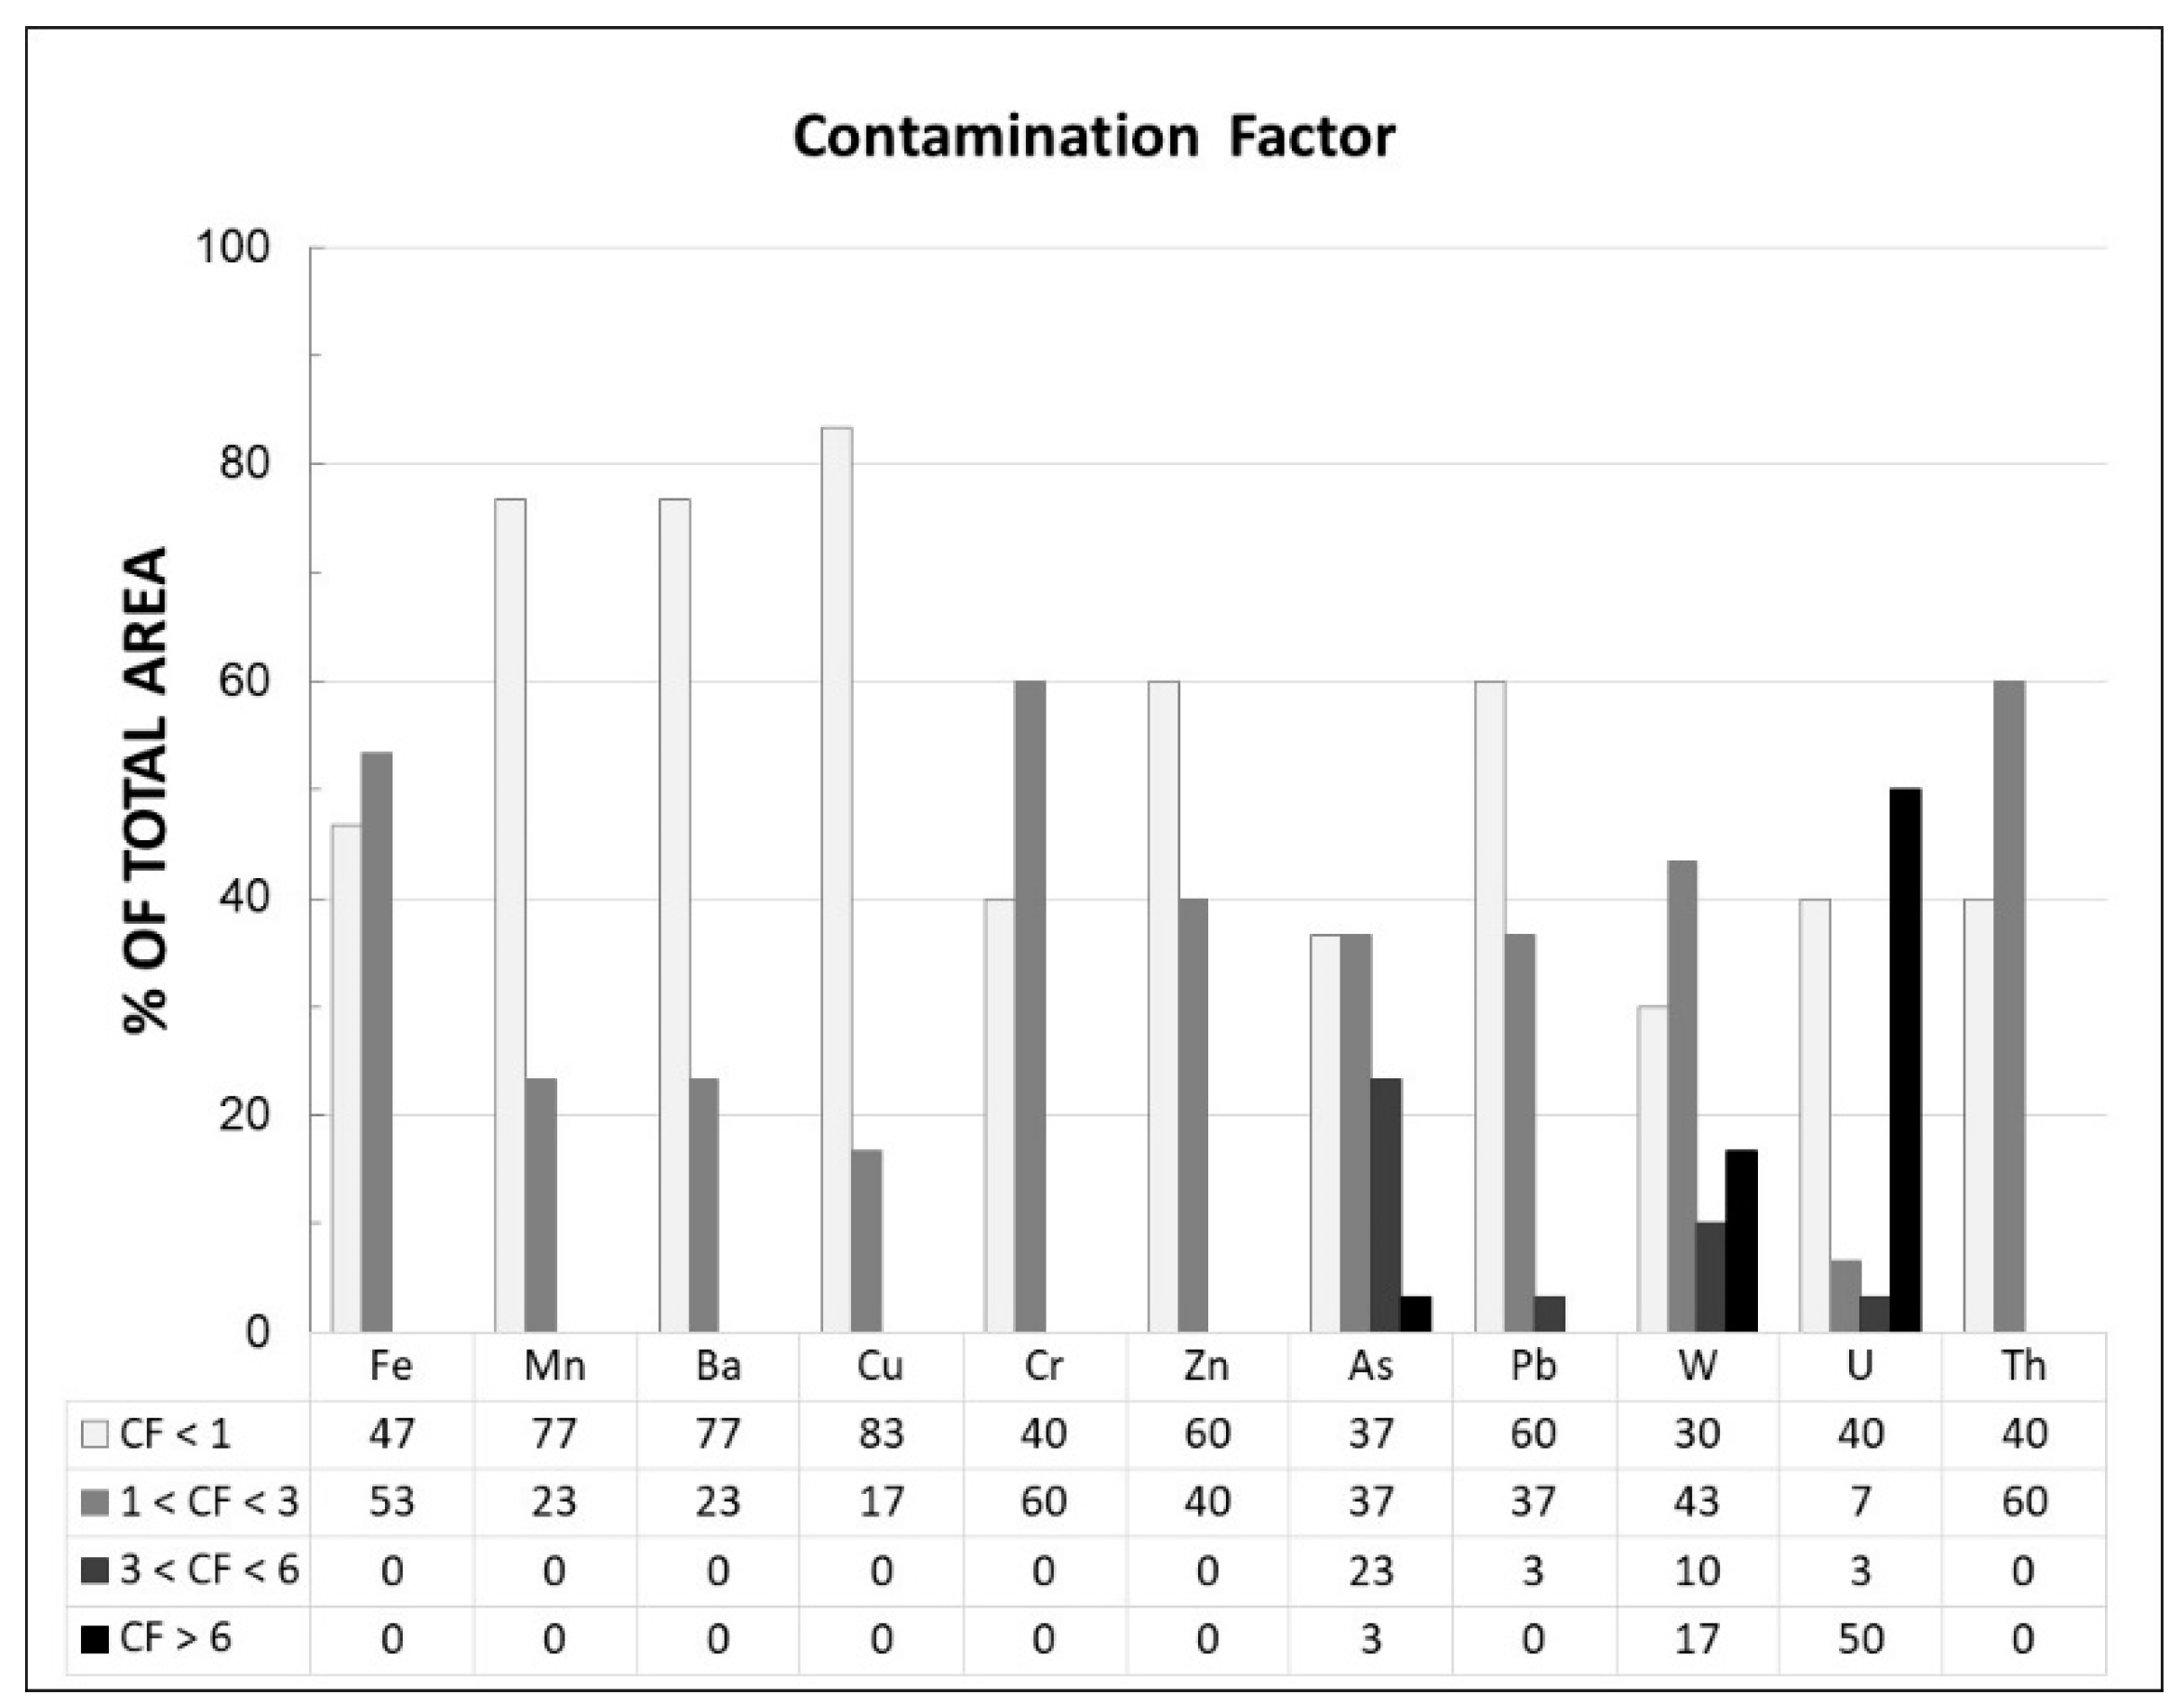
3.2. Contamination Indexes

Several international methods for the evaluation of potentially toxic elements in stream sediments and soils have been described in different study cases, such as contamination factor, contamination degree, enrichment factor, geoaccumulation index, and potential ecological risk index (e.g., [25,26,27,28]). Some of them were applied to assess the enrichment of stream sediments located under the influence of mine activities [25,29,30].
The degree of pollution in mine dumps and sediments was classified using the geoaccumulation index, and most of them were classified as moderately to extremely polluted, particularly upon receiving the influence of dump materials. Stream sediments were polluted relatively to As (35.8 mg/kg), W (4.76 mg/kg), U (454.04 mg/kg), and Th (32.02 mg/kg), and they had high electrical conductivity (154.20 µS/cm).
The contamination factor of each element is the ratio of the element content to the reference value of the element [29]. The considered reference values were the median of background concentrations for stream sediments, collected upstream of the mine influence of the Canto Lagar area (Table 2). The range and median values of contamination factor to mine dumps and sediments for the studied elements are indicated in Table 3.
Practically all the selected potential toxic elements from the mine dump exhibited a degree of contamination classified as low to moderate. Otherwise, for As and W the contamination degree was classified as high, while U had a very high contamination. The mobility of elements from mine dumps to stream sediments was low and presented a low to moderate contamination (Table 3).
The average values of contamination factor for stream sediments varied in the following descending order: U > W > As > Th > Fe > Zn > Pb = Mn > Cr > Ba for mine dumps, and Zn > W > Pb > Ba = Cr > Fe > Th > U = Mn for stream sediments.
The sum of the contamination factor was reclassified as a contamination degree considering the total of variables (Table 3). In the Canto Lagar mine area, the contamination degree varied from 8.7 up to 54, indicating a low to very high contamination degree, particularly in the mine dump sediments (Table 3).
Throughout the analyzed samples, about 50% presented a low contamination factor for Mn (77%), Ba (77%), Cu (83%), Zn (60%), and Pb (60%), moderate contamination for Cr (60%) and Th (60%), and very high contamination for U (50%; Figure 3).
According to the obtained results, most of the selected potential toxic elements from mine dumps exhibited a contamination degree varying from low to moderate. Moreover, As and W presented a high contamination degree, while U presented a very high contamination degree. This situation is primarily associated with the Canto Lagar uranium mineralizations.
The background values from Portugal for Zn, As, U, and Th (Zn = 60 ppm; As = 6.0 ppm; U = 5 ppm, and Th = 18 ppm; [31]) were lower than background reference values considered for Canto Lagar, regarding the geological and mineralization settings of this U-enriched region. Almost all sediments from the Canto Lagar area showed an increase in the contamination index for Zn, As, U, and Th relative to Portuguese background values, which show moderate to very high contamination (Figure 4).
The average contents of Cu, Zn, As, W, Pb, and U and maximum values of Zn, Th, and U (Table 4) exceeded the reference values from the European Geochemical Atlas [32].
In general, soils from the Canto Lagar area presented higher median values for Zn, As, Cs, W, Th, and U and higher values for U (Table 5) than the values included in the Geochemical Atlas of Europe [32].
There are no Portuguese-legislated standard values for soil contamination. Consequently, the soil standards from Ontario were applied in this study. The soil from the Canto Lagar uranium mine area was contaminated by As and U and cannot be used in agricultural or residential occupations (Table 5), in accordance with the soil standards from Ontario [33]. Moreover, roughly all soils could be applied in commercial and/or industrial occupations.

4. Conclusions

The spatial variation in the concentration of potentially toxic elements in mine dumps, stream sediments, and soils from a U-enriched area was studied, and the potential contamination degree was evaluated according to international contamination indexes and contamination soil guide values.
The mobility of elements from mine dumps to stream sediments was relatively low. However, some sediments and soils from the area were contaminated. Considering the reference values for remediation purposes, the area is an appropriate subject for improvement and remediation proposals. The mine dumps represent an environmental risk because they can promote contamination with spatial mobility and dispersion of potentially toxic elements from the dumps to the sediments and soils, as well as by surface runoff and wind. The obtained results suggest that remediation must be done in the whole area, including the cover of mine dumps. The application of adequate remediation processes must be undertaken in the soils and sediments.
Future work requires an exhaustive, well-defined spatial design campaign that could be applied to understand the dynamic processes of potentially toxic elements and to identify the main sources for these elements and the local enrichment around the uranium mine area. The future application of multivariate and geostatistical methodologies will promote reconnaissance and consequently will allow adequate monitoring procedures to be defined in this area or similar ones.

Author Contributions

All authors have contributed extensively to the work presented in the paper. M.A. and A.S. were involved in fieldwork design, sampling, and laboratory analysis. All were involved in results, evaluation, and discussion. M.A. wrote the manuscript with the contribution and editing of all the co-authors. All authors have read and agreed to the published version of the manuscript.

Funding

This research was funded by FCT — Fundação para a Ciência e a Tecnologia, I.P., grant number FCT-SFRH/BPD/64921/2009 and Nano-MINENV PTDC/CTA-AMB/29259/2017.

Acknowledgments

The authors thank FCT–Fundação para a Ciência e a Tecnologia, I.P., through the project’s reference SFRH/BPD/64921/2009, UIDB/04683/2020, UIDP/04683/2020, and reference Nano-MINENV PTDC/CTA-AMB/29259/2017.

Conflicts of Interest

The authors declare no conflict of interest.

References

  1. Milvy, P.; Cothern, C.R. Scientific Background for the Development of Regulations for Radionuclides in Drinking Water. In Radon, Radium and Uranium in Drinking Water; Cothern, C.R., Rebers, P., Eds.; Lewis Publishers: Chelsea, MI, USA, 1990; pp. 1–16. [Google Scholar]
  2. EFSA—European Food Safety Authority. Uranium in food tuffs, in particular mineral water. Scientific opinion of the panel on contaminants in the food chain. EFSA J. 2009, 1018, 1–59. [Google Scholar]
  3. Antunes, I.; Neiva, A.; Albuquerque, M.; Carvalho, P.C.S.; Santos, A.C.T.; Cunha, P.P. Potential toxic elements in stream sediments, soils and waters in an abandoned radium mine (central Portugal). Environ. Geochem. Health 2017, 40, 521–542. [Google Scholar] [CrossRef] [Green Version]
  4. Arogunjo, A.; Höllriegl, V.; Giussani, A.; Leopold, K.; Gerstmann, U.; Veronese, I.; Oeh, U. Uranium and thorium in soils, mineral sands, water and food samples in a tin mining area in Nigeria with elevated activity. J. Environ. Radioact. 2009, 100, 232–240. [Google Scholar] [CrossRef]
  5. Dittmar, M. The end of cheap uranium. Sci. Total Environ. 2013, 461, 792–798. [Google Scholar] [CrossRef]
  6. Falck, W.E. The Long-Term Safety of Uranium Mine and Mill Tailings Legacies in an Enlarged EU; JCR Scientific and Technical Report #49047; Office for the Official Publications of the European Communities: Luxembourg, Germany, 2008; p. 33. [Google Scholar]
  7. Raeva, D.; Slavov, T.; Stoyanova, D.; Zivčič, L.; Tkalec, T.; Rode, Š. Expanded Nuclear Power capacity in Europe, Impact of Uranium mining and alternatives. EJOLT Rep. 2014, 12, 129. [Google Scholar]
  8. World Nuclear Association. Supply of Uranium. Available online: http://www.world-nuclear.org/info/inf75.html2015 (accessed on 24 September 2020).
  9. Brugge, D.; Buchner, V. Health effects of uranium: New research findings. Rev. Environ. Health 2011, 26, 231–249. [Google Scholar] [CrossRef]
  10. Cuvier, A.; Panza, F.; Pourcelot, L.; Foissard, B.; Cagnat, X.; Prunier, J.; Van Beek, P.; Souhaut, M.; Le Roux, G. Uranium decay daughters from isolated mines: Accumulation and sources. J. Environ. Radioact. 2015, 149, 110–120. [Google Scholar] [CrossRef] [PubMed]
  11. Kozak, K.; Mazur, J.; Vaupotič, J.; Grządziel, D.; Kobal, I.; Omran, K.M. The potential health hazard due to elevated radioactivity in old uranium mines in Dolina Białego, Tatra Mountains, Poland. Isot. Environ. Health Stud. 2013, 49, 274–282. [Google Scholar] [CrossRef]
  12. Neiva, A.; Carvalho, P.C.S.; Antunes, I.; Silva, M.M.V.G.; Santos, A.; Pinto, M.M.S.C.; Cunha, P.P. Contaminated water, stream sediments and soils close to the abandoned Pinhal do Souto uranium mine, central Portugal. J. Geochem. Explor. 2014, 136, 102–117. [Google Scholar] [CrossRef] [Green Version]
  13. Foulkes, M.; Millward, G.E.; Henderson, S.; Blake, W. Bioaccessibility of U, Th and Pb in solid wastes and soils from an abandoned uranium mine. J. Environ. Radioact. 2017, 173, 85–96. [Google Scholar] [CrossRef] [Green Version]
  14. Villa, M.; Manjón, G.; Hurtado-Bermúdez, S.; García-Tenorio, R.; Villa-Alfageme, M. Uranium pollution in an estuary affected by pyrite acid mine drainage and releases of naturally occurring radioactive materials. Mar. Pollut. Bull. 2011, 62, 1521–1529. [Google Scholar] [CrossRef]
  15. White, P.A.F.; Smith, S.E. Review of uranium ore processing research. J. Br. Nucl. Energy Soc. 1969, 8, 93–102. [Google Scholar]
  16. Kaksonen, A.H.; Lakaniemi, A.-M.; Tuovinen, O.H. Acid and ferric sulfate bioleaching of uranium ores: A review. J. Clean. Prod. 2020, 264, 121586. [Google Scholar] [CrossRef]
  17. Abrahams, P.W. Soils: Their implications to human health. Sci. Total Environ. 2002, 291, 1–32. [Google Scholar] [CrossRef] [Green Version]
  18. IPMA. Instituto Português do Mar e da Atmosfera. Clima de Portugal Continental. Available online: https://www.ipma.pt/pt/oclima/normais.clima/ (accessed on 16 August 2020).
  19. SNIRH, Sistema Nacional de Informação de Recursos Hídricos. Available online: https://snirh.apambiente.pt/index.php?idMain=1&idItem=1.1 (accessed on 10 September 2020).
  20. British Standard (BS) 7755. Soil Quality, Part 3. Chemical Methods, Section 3.2. Determination of pH; ISSO 10390; British Standards Institution: Glasgow, UK, 1995; p. 1. [Google Scholar]
  21. British Standard (BS) 7755. Soil Quality, Part 3. Chemical Methods, Section 3.4. Determination of Specific Electrical Conductivity; ISSO 11265; British Standards Institution: Glasgow, UK, 1995; p. 1. [Google Scholar]
  22. User Manual. Jobin Yvon ICP Spectometers. Version 3.0; Reference: 31088486. 2001, pp. 20–23. Available online: https://www.horiba.com/cn/scientific/products/optical-spectroscopy/newsletter/october-2009/find-out-about-our-latest-spectroscopy-software-synerj (accessed on 13 October 2020).
  23. Antunes, I.; Albuquerque, M.; Roque, N. Spatial environmental risk evaluation of potential toxic elements in stream sediments. Environ. Geochem. Health 2018, 40, 2573–2585. [Google Scholar] [CrossRef]
  24. Antunes, I.; Gomes, M.; Neiva, A.; Carvalho, P.; Santos, A. Potential risk assessment in stream sediments, soils and waters after remediation in an abandoned W > Sn mine (NE Portugal). Ecotoxicol. Environ. Saf. 2016, 133, 135–145. [Google Scholar] [CrossRef]
  25. Håkanson, L. An Ecological Risk Index for aquatic pollution control—A sedimentological approach. Water Res. 1980, 14, 975–1001. [Google Scholar] [CrossRef]
  26. Wenyl, H.; Fengru, H.; Jingsheng, C. Comparative study of assessment method for river particulate heavy metal pollution. Sci. Geogr. Sinca 1997, 17, 81–86. [Google Scholar]
  27. Vreča, P.; Dolenec, T. Geochemical estimation of copper contamination in the healing mud from Makirina Bay, central Adriatic. Environ. Int. 2005, 31, 53–61. [Google Scholar] [CrossRef]
  28. Karydas, C.G.; Tzoraki, O.A.; Panagos, P. A New Spatiotemporal Risk Index for Heavy Metals: Application in Cyprus. Water 2015, 7, 4323–4342. [Google Scholar] [CrossRef] [Green Version]
  29. Sutherland, R.A. Bed sediment-associated trace metals in an urban stream, Oahu, Hawaii. Environ. Earth Sci. 2000, 39, 611–627. [Google Scholar] [CrossRef]
  30. Andrews, S.; Sutherland, R.; Sutherland, R.A. Cu, Pb and Zn contamination in Nuuanu watershed, Oahu, Hawaii. Sci. Total Environ. 2004, 324, 173–182. [Google Scholar] [CrossRef]
  31. Ferreira, A.M.P.J. Dados Geoquímicos de Base de Sedimentos Fluviais de Amostragem de Baixa Densidade de Portugal Continental: Estudo de Factores de Variação Regional. Ph.D. Thesis, Universidade de Aveiro, Aveiro, Portugal, 2000. [Google Scholar]
  32. Salminen, R.; Batista, M.J.; Bidovec, M.; Demetriades, A.; De Vivo, B.; De Vos, W.; Duris, M. FOREGS Geochemical Atlas of Europe, Methodology and Maps; Part 1–526p and Part 2–690p; Geological Survey of Finland: Espoo, Finland, 2005. [Google Scholar]
  33. Canadian Soil Guidelines. Canadian Soil Quality Guidelines for the Protection of Environmental and Human Health; 2017; Summary tables 1–6. Available online: https://www.ccme.ca/files/ceqg/en/backup/250-081209115239.pdf (accessed on 13 October 2020).
Figure 1. Images illustrating the old abandoned mine area of Canto Lagar (Central Portugal): (a) mine dumps; (b) open pit; (c) pasture areas; (d) agricultural activities in the S. Paio stream margin; (e) S. Paio stream; (f) well located in the stream margins.
Applsci 10 07866 g001
Figure 2. Box plots for physicochemical parameters, trace elements, and REE concentrations in stream sediments, soils, and mine dumps from Canto Lagar region. The symbol ● represents values of minimum (lower end), maximum (upper end) and outlier (intermediate) concentrations.
Applsci 10 07866 g002
Figure 3. Percentage of contamination factor classes in the Canto Lagar area.
Applsci 10 07866 g003
Figure 4. Comparison of contamination factor classes percentage for Zn, As, U, and Th using Canto Lagar background values (CL) and Portuguese background values (Pt).
Applsci 10 07866 g004
Table 1. References for accuracy and precision of obtained results.
AccuracyPrecision
Concentration Relatively
to Detection Limit (DL)
l g C ¯ = | l g C i ¯ l g C s | λ = i = 1 n ( l g C i l g C s ) 2 n 1
<3 DL≤0.0240.031
>3 DL≤0.0150.018
C i ¯ —standard average values of B C R i , in sediments, soils, and mine dumps; C i —standard average values of BCR; C s —value recommended for standards BCR; n—total samples inserted in the sample pack.
Table 2. Physicochemical, potential toxic elements, and rare earth element concentrations of stream sediments, soils, and mine dumps from Canto Lagar.
pHECOMFeMnCrCuZnAsCsZrBaREEWPbThU
µS/cm%mg/kg
Stream sediments_upstreamMedian6.0422.601.671.850.054.9517.7790.6318.3119.220.6830.74262.731.2618.0125.56131.86
Minimum5.9912.700.791.610.034.1411.4881.3413.7017.290.3423.09218.301.0512.9820.96102.48
Maximum6.1334.202.641.980.075.5821.34102.0822.5321.420.9635.40327.121.6222.0230.26182.75
St deviation0.0810.850.930.200.020.745.4610.544.432.080.316.6757.090.324.614.6544.25
N3
Stream sediments_downstreamMedian5.9255.162.591.580.039.2917.01108.0613.248.860.4930.10234.192.0023.1518.9787.70
Minimum4.4025.101.021.330.023.143.7064.344.047.410.1210.78177.130.569.608.9519.01
Maximum6.42154.205.821.970.0613.7630.27157.1435.8813.743.4547.70355.994.7631.7832.02454.04
St deviation0.5635.851.350.240.013.047.5228.818.991.730.989.6750.001.366.906.94125.78
N11
Soil_backgroundMedian5.3623.122.991.980.056.2030.8491.3415.3425.560.9339.18303.981.0318.4338.1450.14
Minimum5.0912.802.131.510.034.597.0673.2711.1810.520.3623.46265.760.6113.9729.2213.06
Maximum5.7312.804.332.430.087.95171.41109.6538.0661.532.3859.72401.901.6322.8951.00195.59
St deviation0.2239.920.760.340.021.1359.8313.569.0717.840.7413.3957.020.393.086.7159.57
N7
Soil_mine influenceMedian5.2526.644.511.930.036.3911.2780.7324.8712.501.2429.39282.121.2318.9930.33168.27
Minimum4.7110.701.811.530.023.383.0757.974.683.490.2312.97223.560.549.0815.81-
Maximum5.9591.809.572.530.0513.3641.46134.8660.4820.529.5555.00417.482.9332.8054.801561.06
St deviation0.3216.012.030.260.012.5110.1517.9014.693.351.8710.1043.710.555.5110.01329.31
N33
Mine dumpsMedian5.4616.361.762.540.055.249.8490.6666.129.655.5714.00320.306.6918.1445.302318.62
Minimum4.349.100.891.700.023.564.7663.1624.612.510.737.00232.281.1911.3821.19132.45
Maximum6.3641.005.964.260.097.9416.47121.71171.1620.7310.5924.07399.0620.2770.6662.714540.06
St deviation0.578.801.450.640.011.443.3713.5837.664.582.714.6046.656.3614.2510.011188.03
N16
St deviation—standard deviation; N—number of samples. EC—electrical conductivity; OM—organic matter. All the elements are in mg/kg, except OM, Fe, and Mn, in %.
Table 3. Values of contamination factor and contamination degree of mine dumps and stream sediments from Canto Lagar.
Mine DumpsStream Sediments
MinMaxMedMinMaxMed
Fe0.92.31.40.71.10.9
Mn0.51.71.00.41.40.7
Ba0.20.80.50.41.61.0
Cr0.30.90.60.21.71.0
Zn0.71.61.10.62.81.7
Pb0.63.91.00.51.81.2
As1.39.33.60.22.00.8
W0.916.15.30.43.81.5
U1.034.417.60.13.40.7
Th0.82.51.80.41.30.8
CD11.654.134.78.714.511.4
Min—minimum; Max—maximum, Med—median. Contamination factor: low contamination for CF ˂ 1 (black color); moderate contamination for CF 1–3 (green color); high contamination for CF 3–6 (blue color); very high contamination for CF > 6 (red color). Contamination degree CD = sum of CF: low contamination degree with CD ˂ 13; moderate contamination degree with CD 13–26; high contamination degree with CD 26–39; very high contamination degree with CD > 39.
Table 4. Comparison of Fe (%) and selected potential toxic element (mg/kg) contents from Canto Lagar sediments and Geochemical Atlas of Europe.
Canto Lagar AreaGeochemical Atlas of Europe
MinimumMaximumMedianMinimumMaximumMedian
Fe1.34.31.80.0620.01.97
Mn0.00.10.024.018900452
Cr3.113.85.22.0175021.0
Cu3.730.317.01.099814.0
Zn63.2157.190.77.011.060.0
As4.0171.218.3<5231.06.0
W0.620.32.0<0.0582.01.2
Pb9.670.718.1<3488014.0
Th8.962.725.6<113.9253
U19.04540.1131.9<198.02.0
Table 5. Comparison of potentially toxic elements values of soil from Canto Lagar area with European values and reference values of Canadian guidelines.
Canto Lagar Geochemical Atlas of EuropeCanadian Soil Guidelines
MinimumMaximumMedianMinimumMaximumMedianAgriculturalResidential Parkland
Fe1.512.531.960.115.21.96--
Mn0.020.080.04<106480382--
Cr3.3813.366.3012340226464
Cu3.07171.4121.06<1118136363
Zn57.97134.8686.044227048200200
As4.6860.4820.11522061212
Cs3.4961.5319.03<0.569.13.71--
Zr0.239.551.0951060231--
Ba12.9759.7234.2910170065750500
W0.542.931.13<514<5--
Pb9.0832.818.71<31588670140
Th15.8154.834.240.375.97.24--
U-1561.06109.20.253.22.032323
All soil concentrations are in mg/kg, while Fe and Mn are expressed in percent.
Publisher’s Note: MDPI stays neutral with regard to jurisdictional claims in published maps and institutional affiliations.

