Assessing the Impact of an EV Battery Swapping Station on the Reliability of Distribution Systems


Abstract
:1. Introduction
- Proposing a comprehensive methodological framework to study the impact of BSSs on the reliability of distribution networks.
- Analyzed and compared the influence of different charging strategy (peak-to-valley price-based charging and constant power charging) on the reliability of the distribution network.
- Using LHS to generate the time series of uncertain factors (including the fault status of the distribution network components, the traffic flow of the BSS, and initial State of Charge (SOC) of the replaced EV batteries), which improves the accuracy and convergence performance of the evaluation, as compared with traditional SMCS method.
2. Overview of Battery Swapping Station
- (a)
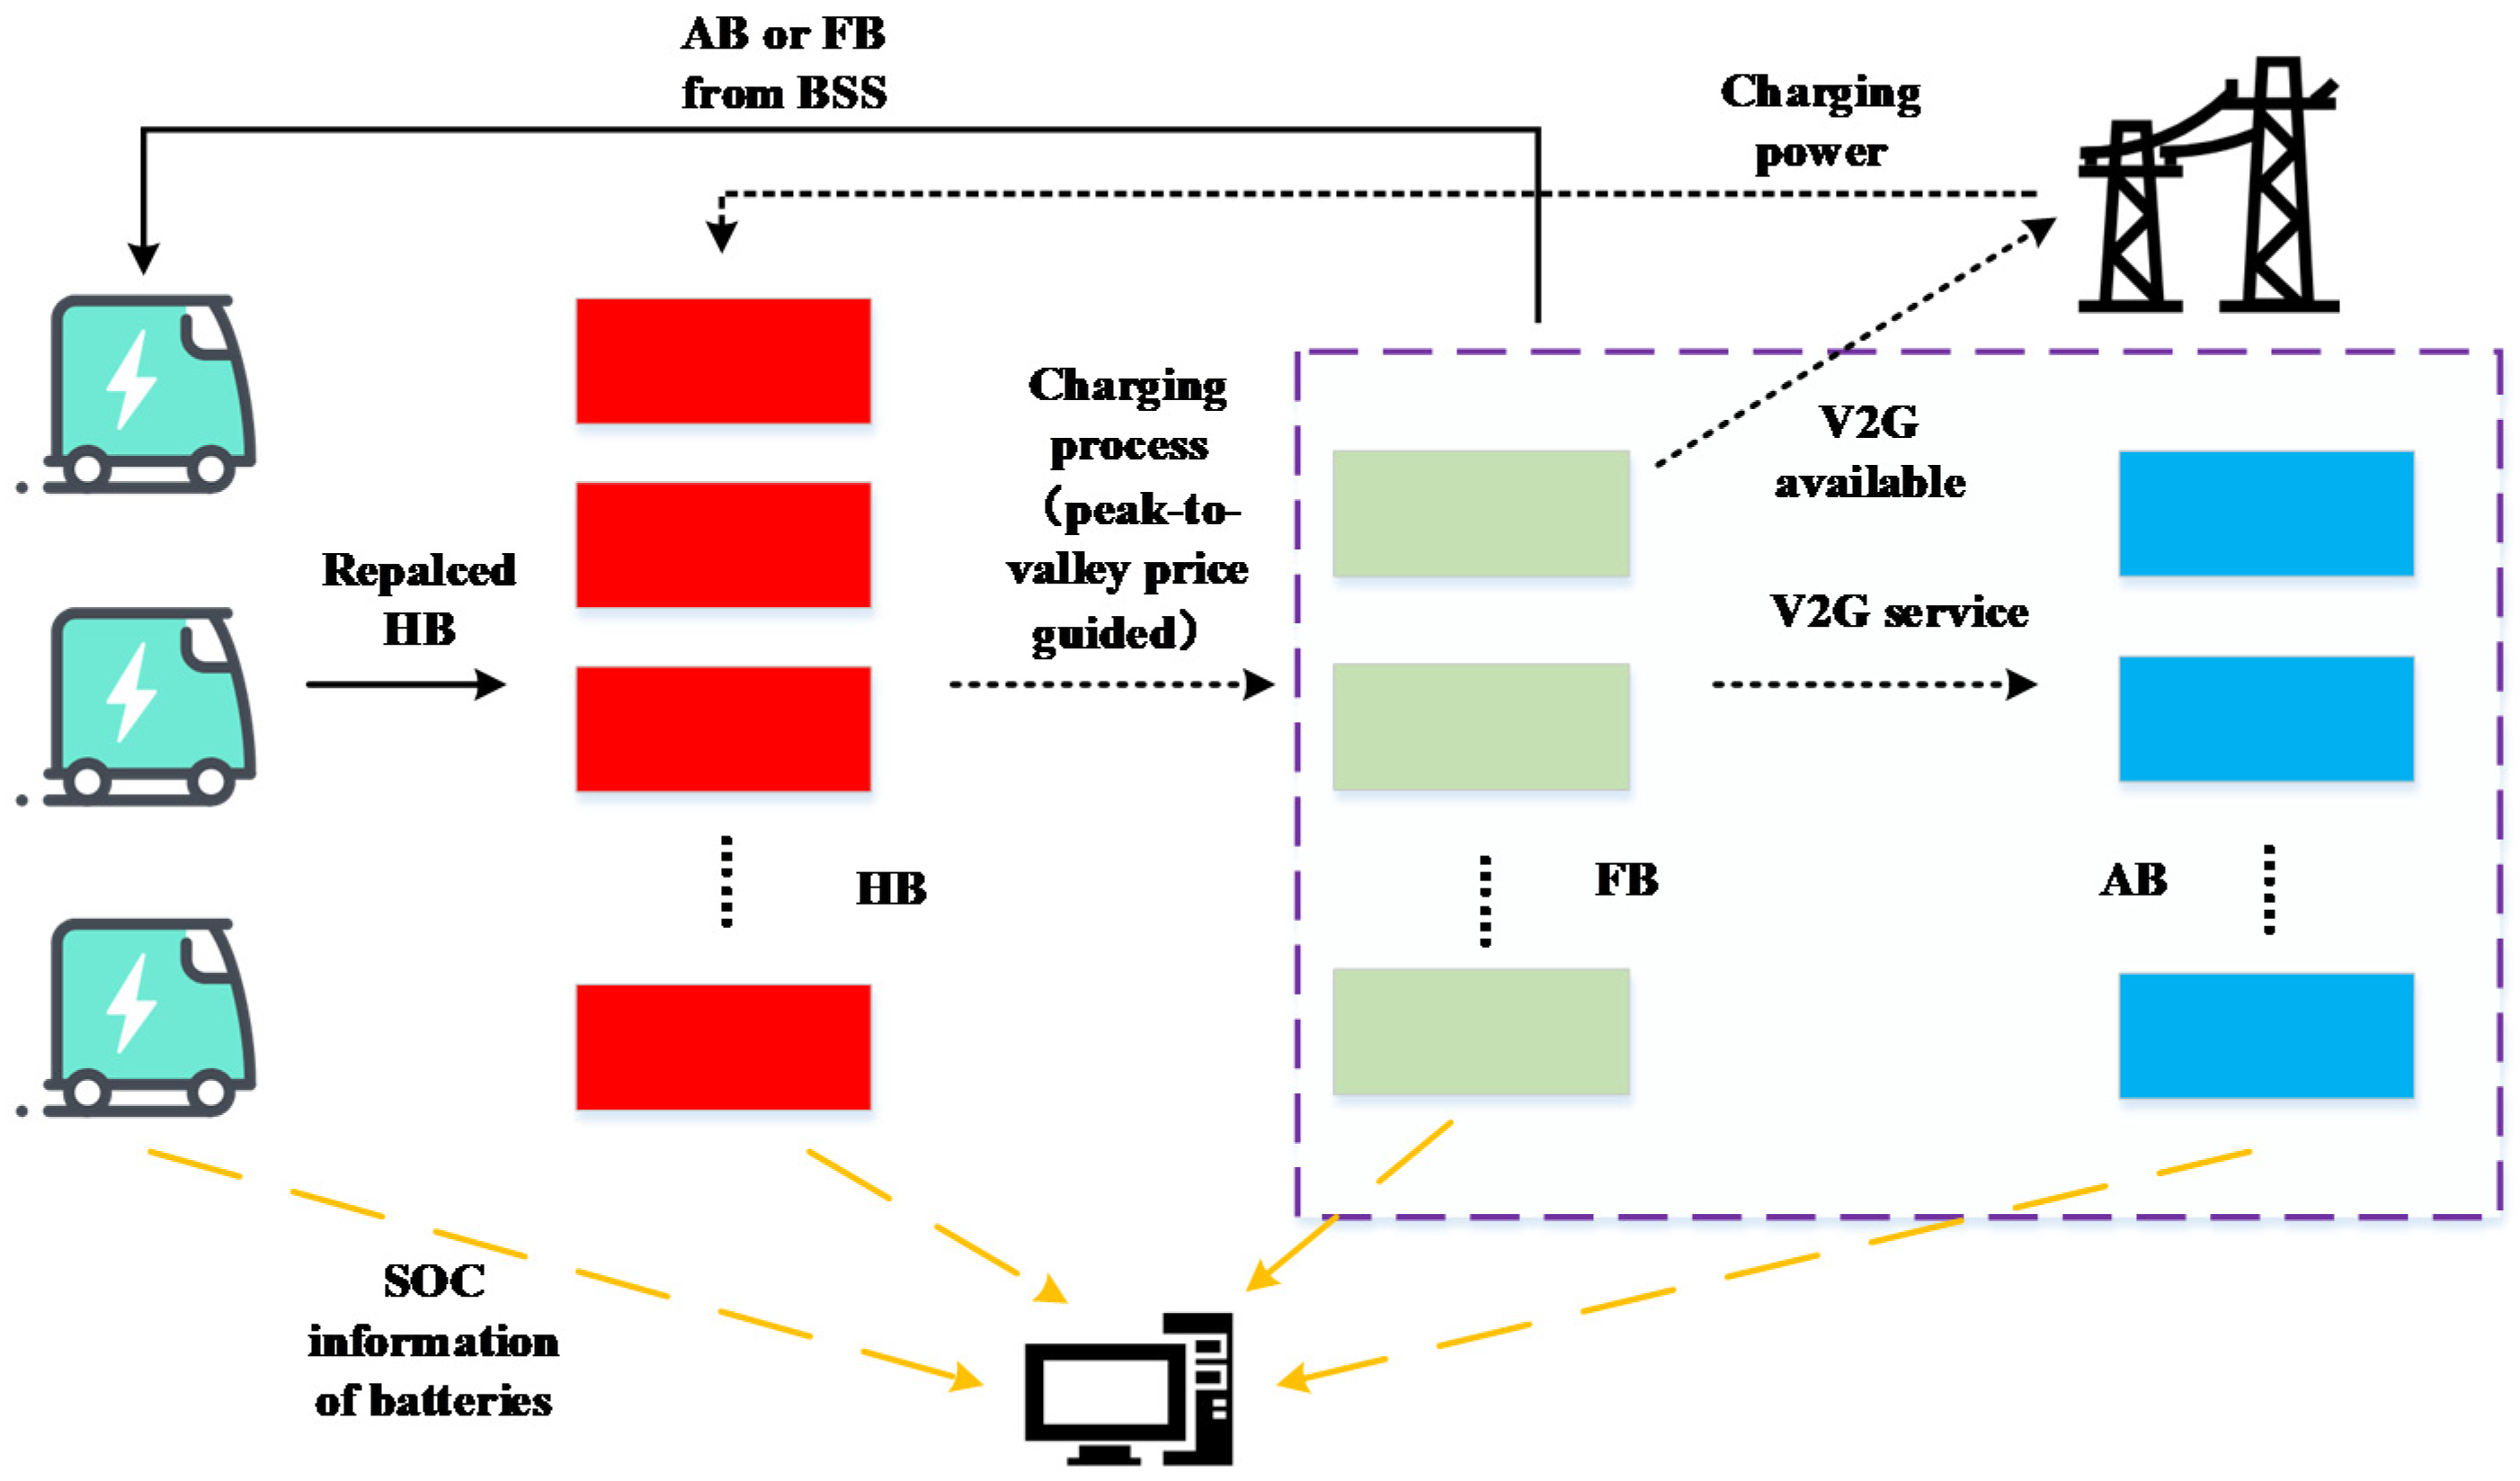
- Assuming that all batteries are charged using slots, each battery corresponds to a slot. The battery needs to be continuously exchanged between the charging slot and the EV during the battery exchange process, while charging slots are fixed. Therefore, from the perspective of BSS, the number of charging slots is more meaningful. Therefore, a battery of a certain number refers to the battery in the slot of a certain number, not the battery itself.
- (b)
- The model in this paper takes one hour as the unit time interval. The charging and discharging power within one hour are the same, but the charging and discharging power in different hours are different. Since the time scale is one hour, and the battery replacement takes only a few minutes to complete, it is considered that the battery replacement does not require time.
- (c)
- We assume that the BSS has the ability to quickly replace batteries of EVs, and the traffic capacity of the road around the BSS is strong, which will not cause road congestion.
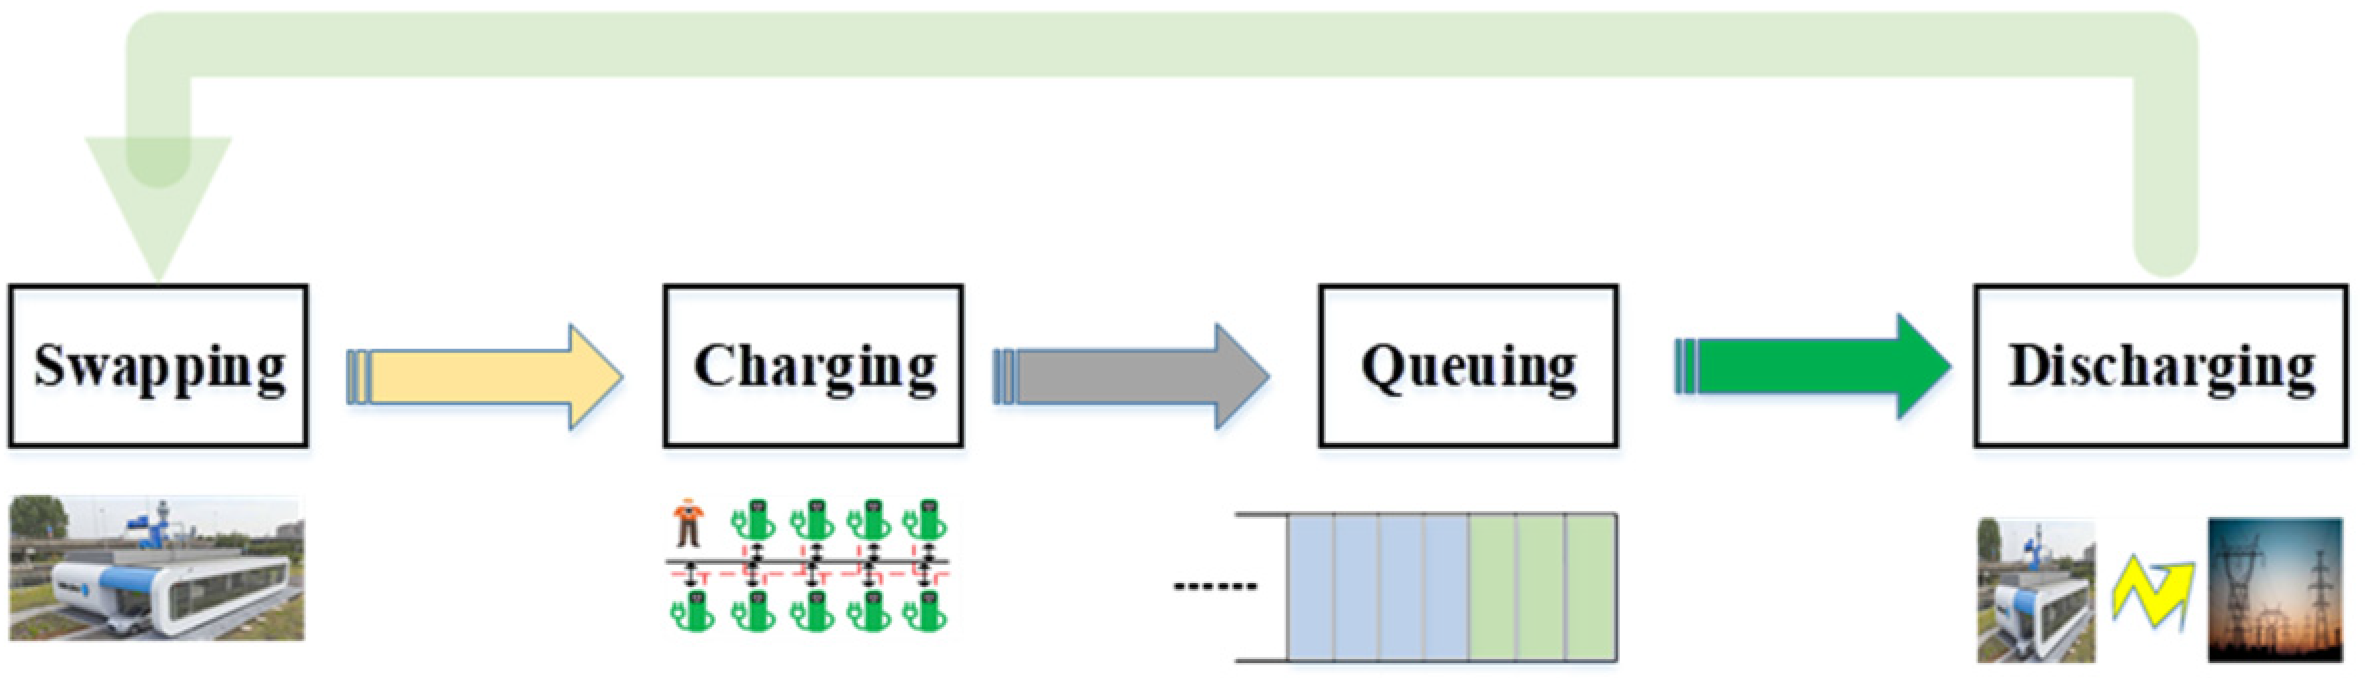
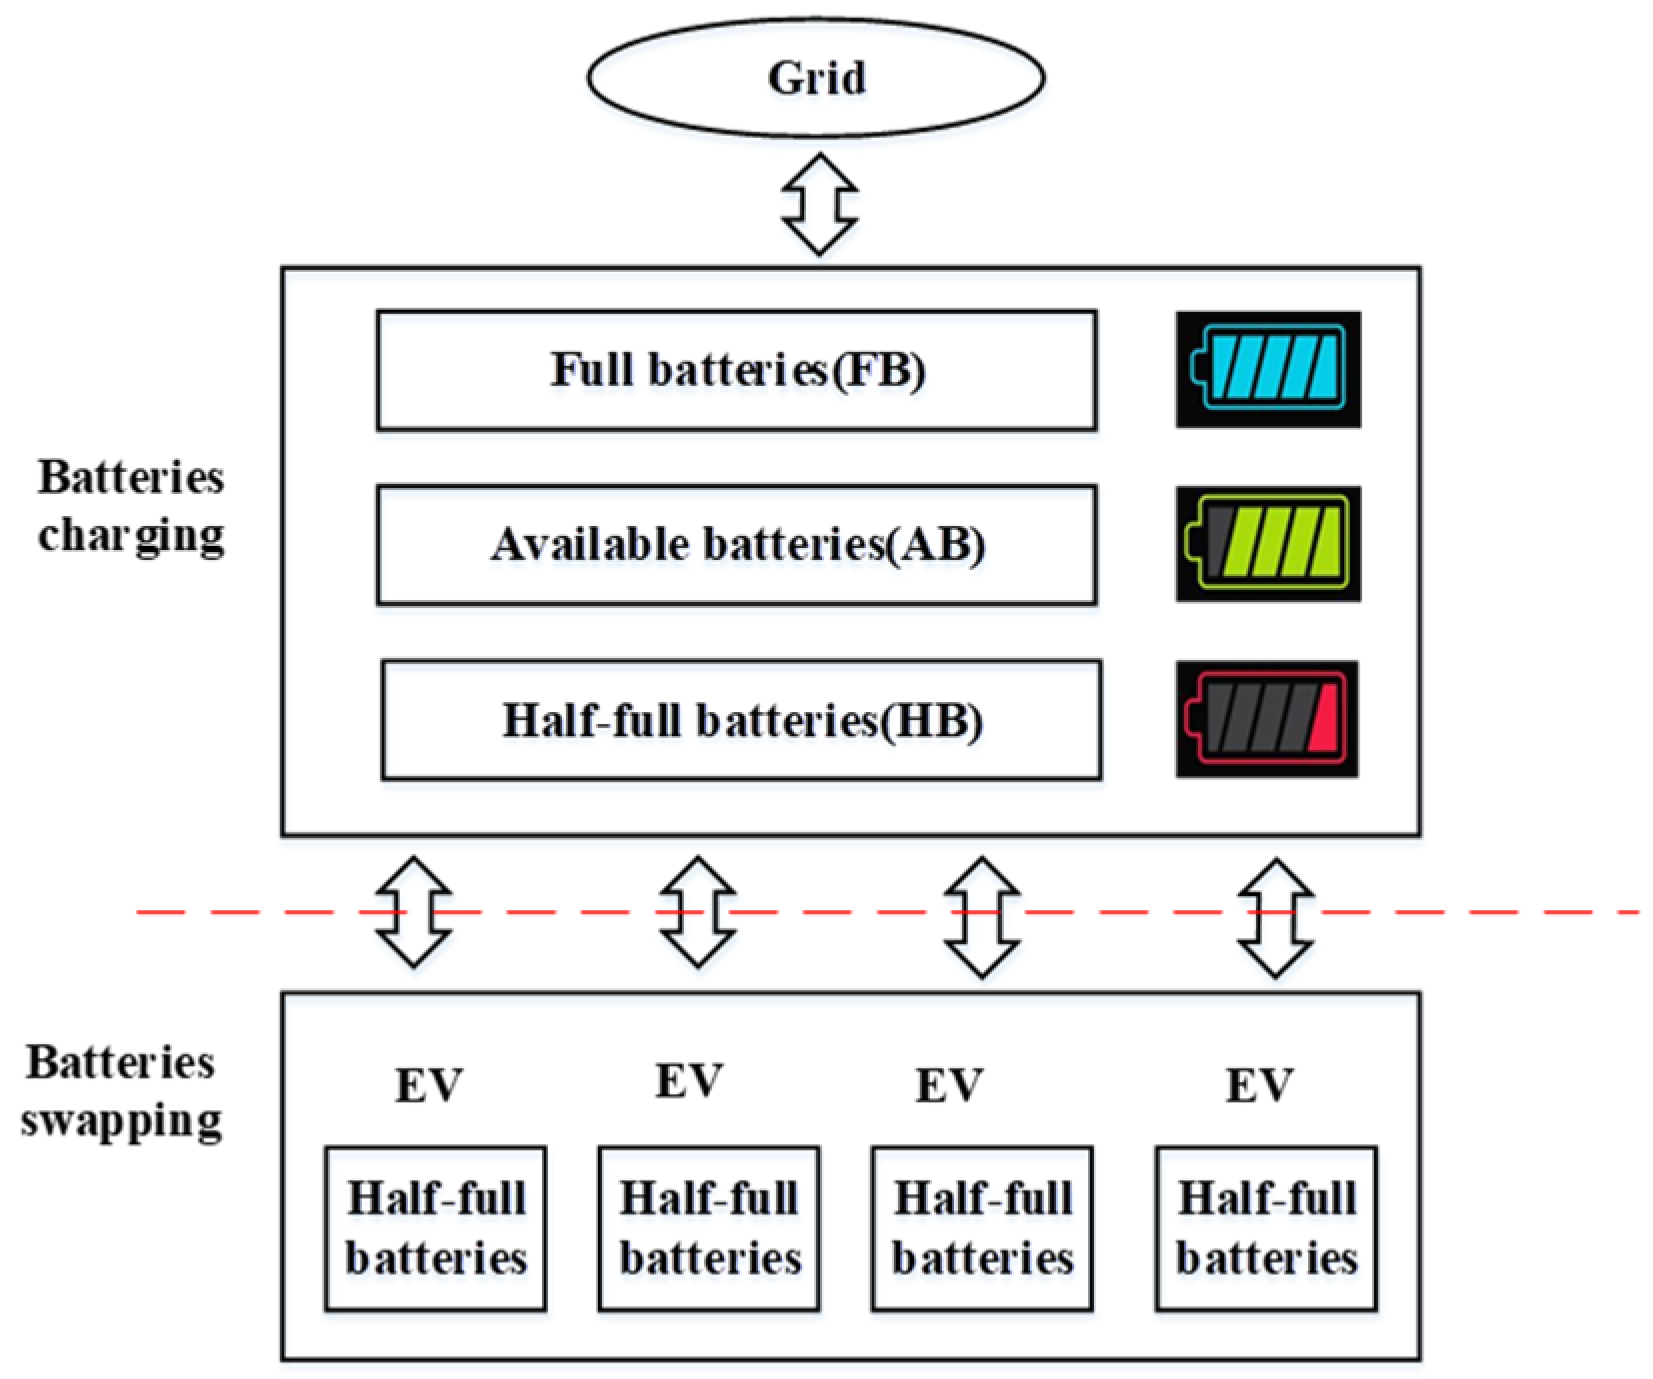
2.1. Structure
2.2. Battery Swapping Model
2.3. Charging Strategy
2.4. Management Strategy of Batteries with Different Charge Levels
3. Assessment of Available Generation Capacity (AGC)
3.1. EV Users Swap Behavior Modeling
3.2. Calculation of the AGC of BSSs
4. Reliability Modeling of Distribution Network
5. Evaluation of Distribution Network Reliability
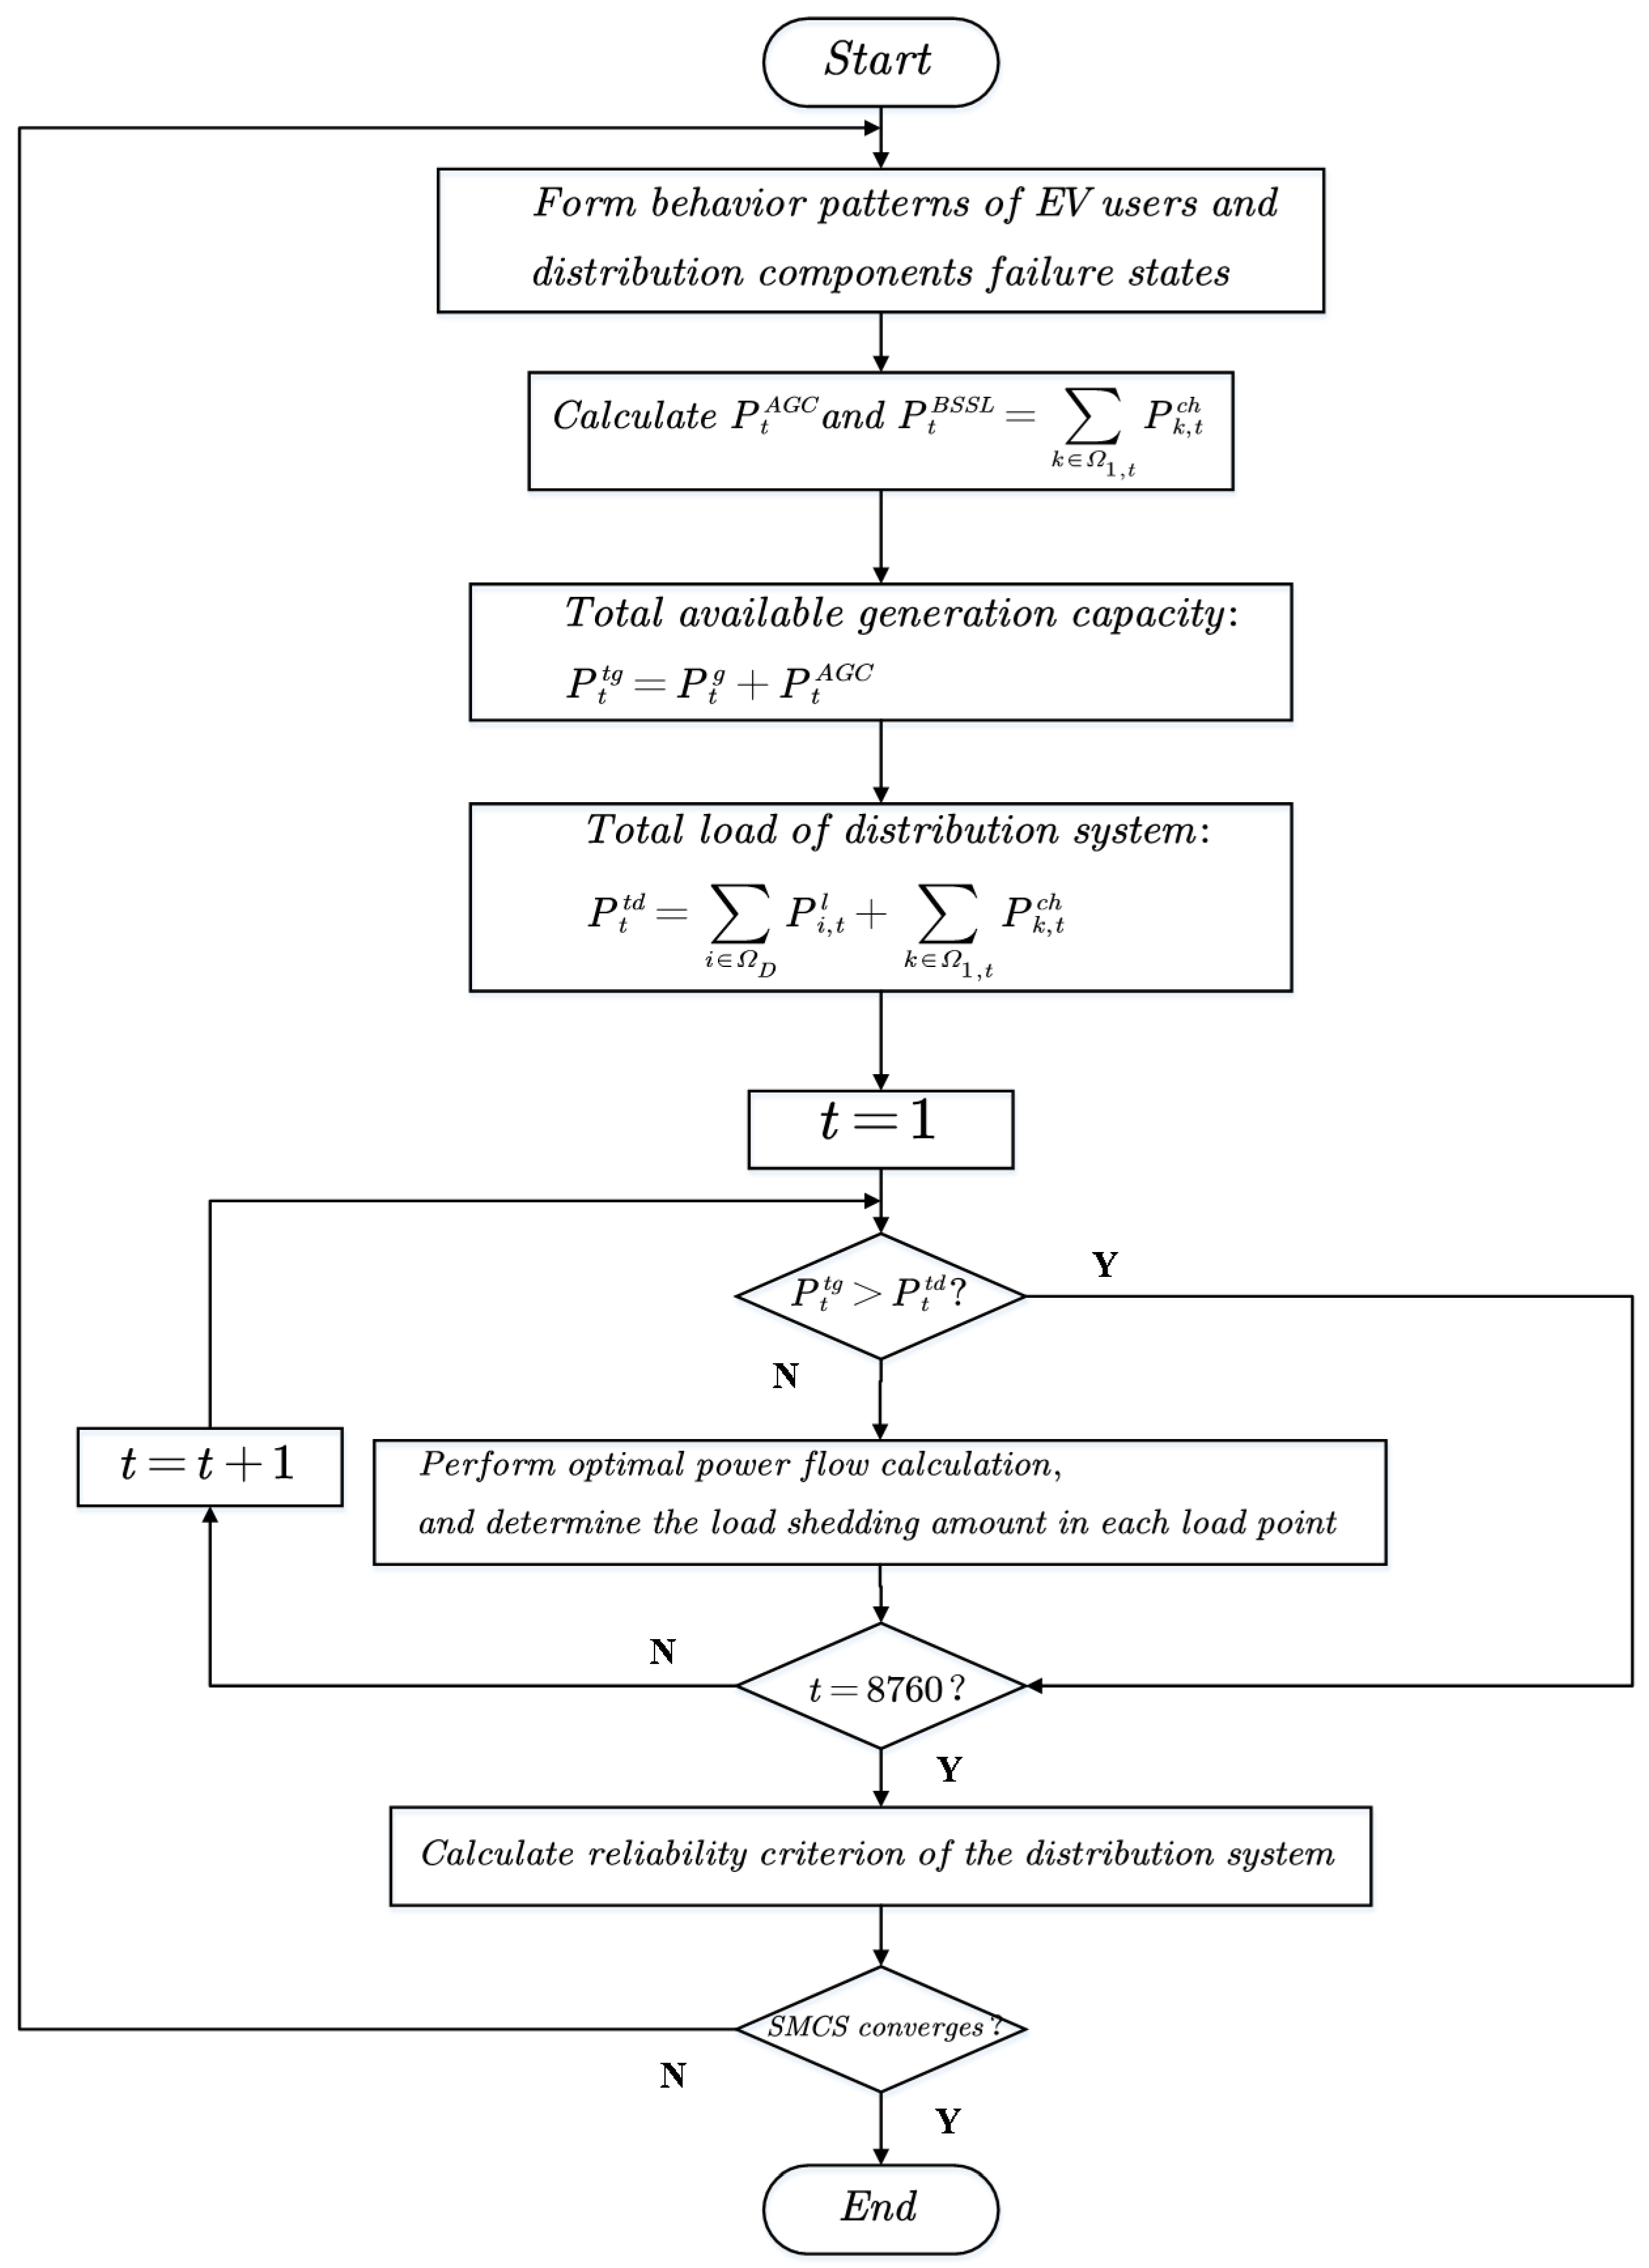
- 1)
- Using LHS to form the behavior patterns of EV users and distribution components failure states. The behavior patterns of EV users include the time series of the arriving EV number and SOC of each replaced empty battery, while the distribution components failure states consist of a time series of the failure states of the external grid, transformers and load buses.
- 2)
- According to the procedure described in Section 3.2, calculate the available generation capacity and real-time load of BSS . Therefore, the total available generation capacity provided by the whole system can be described by the summation of power from grid and ; the total load of distribution can be calculated by adding the load of every load bus and .
- 3)
- Start a new simulation year. For each time t, if is greater than , it means that the distribution system suffers an outage. Perform optimal power flow with the goal of minimum load shedding and determine the load shedding amount in each load point.
- 4)
- Calculate the reliability criterion of the distribution system, including the system average interruption frequency index (SAIFI), system average interruption duration index (SAIDI), system expected energy not supplied (SEENS), load average interruption frequency index (LAIFI), load average interruption duration index (LAIDI), and load average expected energy not supplied index (LEENS).
- 5)
- Judge whether the procedure converges. Choose SEENS as the basis for convergence judgment. If , the procedure converges, where σ(·) and E(·) denote the standard deviation and expectation of the sample and Ny denotes the total simulation years [18]. Otherwise, repeat (1)–(4) until it converges.
- 6)
- Take the average value of reliability indexes of each simulation year as the final index values.
6. Numerical Study
6.1. Data
6.2. Results
- 1)
- Case-1: The distribution network does not have a BSS, and all electrical power is provided by the external grid. When the grid fails, the system has no backup power source.
- 2)
- Case-2: The distribution network is equipped with a BSS, but it does not have the capability of V2G. It is equivalent to increase the load on the distribution network.
- 3)
- Case-3: The distribution network is equipped with a BSS and has the capability of V2G. In the event of a grid failure, BSS can be used as a backup power source to supply power back to the distribution network.
6.3. Comparison of of Different Charging Strategies
6.4. Analysis on the Performance of Sampling Methods Adopted
7. Conclusions
Author Contributions
Funding
Conflicts of Interest
References
- Zhou, B.; Littler, T.; Meegahapola, L.; Zhang, H. Power system steady-state analysis with large-scale electric vehicle integration. Energy 2016, 115, 289–302. [Google Scholar] [CrossRef] [Green Version]
- Yi, T.; Zhang, C.; Lin, T.; Liu, J. Research on the spatial-temporal distribution of electric vehicle charging load demand: A case study in China. J. Clean. Prod. 2020, 242, 118457. [Google Scholar] [CrossRef]
- Guille, C.; Gross, G. A conceptual framework for the vehicle-to-grid (V2G) implementation. Energy policy 2009, 37, 4379–4390. [Google Scholar] [CrossRef]
- Green II, R.C.; Wang, L.; Alam, M. The impact of plug-in hybrid electric vehicles on distribution networks: A review and outlook. Renew. Sust. Energ. Rev. 2011, 15, 544–553. [Google Scholar] [CrossRef]
- Zhou, Y.; Li, Z.; Wu, X. The multiobjective based large-scale electric vehicle charging behaviours analysis. Complexity 2018. [Google Scholar] [CrossRef] [Green Version]
- Mwasilu, F.; Justo, J.J.; Kim, E.K.; Do, T.D.; Jung, J.W. Electric vehicles and smart grid interaction: A review on vehicle to grid and renewable energy sources integration. Renew. Sust. Energ. Rev. 2014, 34, 501–516. [Google Scholar] [CrossRef]
- Zeng, B.; Feng, J.; Liu, N.; Liu, Y. Co-optimized public parking lot allocation and incentive design for efficient PEV integration considering decision-dependent uncertainties. IEEE Trans. Industr. Inform. 2020. [Google Scholar] [CrossRef]
- Tao, Y.; Huang, M.; Chen, Y.; Yang, L. Orderly charging strategy of battery electric vehicle driven by real-world driving data. Energy 2020, 193, 877–885. [Google Scholar] [CrossRef]
- Hou, H.; Xue, M.; Xu, Y.; Xiao, Z.; Deng, X.; Xu, T.; Liu, P.; Cui, R. Multi-objective economic dispatch of a microgrid considering electric vehicle and transferable load. Appl. Energy 2020, 262, 114489. [Google Scholar] [CrossRef]
- Zeng, B.; Dong, H.; Sioshansi, R.; Xu, F.; Zeng, M. Bi-level robust optimization of electric vehicle charging stations with distributed energy resources. IEEE Trans. Ind. Appl. 2020, 56, 5836–5847. [Google Scholar] [CrossRef]
- Subramanian, V.; Das, K.T. A two-layer model for dynamic pricing of electricity and optimal charging of electric vehicles under price spikes. Energy 2019, 167, 1266–1277. [Google Scholar] [CrossRef]
- Rasheed, M.B.; Awais, M.; Alquthami, T.; Khan, I. An Optimal Scheduling and Distributed Pricing Mechanism for Multi-Region Electric Vehicle Charging in Smart Grid. IEEE Access 2020, 8, 40298–40312. [Google Scholar] [CrossRef]
- Zheng, Y.; Dong, Z.Y.; Xu, Y.; Meng, K.; Zhao, J.H.; Qiu, J. Electric vehicle battery charging/swap stations in distribution systems: Comparison study and optimal planning. IEEE Trans. Power Syst. 2014, 29, 221–229. [Google Scholar] [CrossRef]
- Ahmad, F.; Alam, M.S.; Alsaidan, I.S.; Shariff, S.M. Battery swapping station for electric vehicles: Opportunities and challenges. IET Smart Grid 2020, 3, 280–286. [Google Scholar] [CrossRef]
- Jordehi, A.R.; Javadi, M.S.; Catalão, J.P. Energy management in microgrids with battery swap stations and VAR compensators. J. Clean. Prod. 2020, 272, 122943. [Google Scholar] [CrossRef]
- Yang, S.; Yao, J.; Kang, T.; Zhu, X. Dynamic operation model of the battery swapping station for EV (electric vehicle) in electricity market. Energy 2014, 65, 544–549. [Google Scholar] [CrossRef]
- Amiri, S.S.; Jadid, S.; Saboori, H. Multi-objective optimum charging management of electric vehicles through battery swapping stations. Energy 2018, 165, 549–562. [Google Scholar] [CrossRef]
- Sun, B.; Tan, X.; Tsang, D.H.K. Optimal Charging Operation of Battery Swapping and Charging Stations With QoS Guarantee. IET Smart Grid 2018, 9, 4689–4701. [Google Scholar] [CrossRef]
- Sun, L.; Wang, X.; Liu, W.; Lin, Z.; Wen, F.; Ang, S.P.; Salam, M.A. Optimisation model for power system restoration with support from electric vehicles employing battery swapping. IET Gener. Transm. Distrib. 2016, 10, 771–779. [Google Scholar] [CrossRef]
- Zeng, B.; Wei, X.; Sun, B.; Qiu, F.; Zhang, J.; Quan, X. Assessing capacity credit of demand response in smart distribution grids with behavior-driven modeling framework. Int. J. Electr. Power Energy Syst. 2020, 118, 105745. [Google Scholar] [CrossRef]
- Zeng, B.; Zhu, Z.; Xu, H.; Dong, H. Optimal public parking lot allocation and management for efficient PEV accommodation in distribution systems. IEEE Trans. Ind. Appl. 2020, 56, 5984–5994. [Google Scholar] [CrossRef]
- Zeng, B.; Sun, B.; Wei, X.; Gong, D.; Zhao, D.; Singh, C. Capacity value estimation of plug-in electric vehicle parking-lots in urban power systems: A physical-social coupling perspective. Appl. Energy 2020, 265, 114809. [Google Scholar] [CrossRef]
- Guner, S.; Ozdemir, A. Reliability improvement of distribution system considering EV parking lots. Electr. Power Syst. Res. 2020, 185, 106353. [Google Scholar] [CrossRef]
- Keane, A.; Milligan, M.; Dent, C.J.; Hasche, B.; D’Annunzio, C.; Dragoon, K.; Holttinen, H.; Samaan, N.; Soder, L.; O’Malley, M. Capacity value of wind power. IEEE Trans. Power Syst. 2011, 26, 564–572. [Google Scholar] [CrossRef] [Green Version]
- Bao, Y.; Wang, Y.; Tang, J.; Guo, C.; Wang, X.; Shi, H. Analysis on differences of applying sequential Monte Carlo methods in power grid reliability assessment. Power Syst. Technol. 2014, 38, 1189–1195. [Google Scholar]
- Zeng, B.; Zhang, J.; Yang, X.; Wang, J.; Dong, J.; Zhang, Y. Integrated planning for transition to low-carbon distribution system with renewable energy generation and demand response. IEEE Trans. Power Syst. 2014, 29, 1153–1165. [Google Scholar] [CrossRef]
- Zhou, B.; Xu, D.; Li, C.; Chung, C.Y.; Cao, Y.; Chan, K.W.; Wu, Q. Optimal scheduling of biogas–solar–wind renewable portfolio for multicarrier energy supplies. IEEE Trans. Power Syst. 2018, 33, 6229–6239. [Google Scholar] [CrossRef] [Green Version]
- BAIC New Energy Official Website. Available online: https://www.bjev.com.cn/html/eu300.html (accessed on 10 October 2020).
- Jirutitijaroen, P.; Singh, C. Comparison of simulation methods for power system reliability indexes and their distributions. IEEE Trans. Power Syst. 2008, 23, 486–493. [Google Scholar] [CrossRef]


| Bus | Load (MW) | Household (a) | Bus | Load (MW) | Household (a) |
|---|---|---|---|---|---|
| 1 | 0.4845 | 32 | 17 | 0.4361 | 29 |
| 2 | 0.4361 | 29 | 18 | 0.4361 | 29 |
| 3 | 0.5814 | 39 | 19 | 0.4361 | 29 |
| 4 | 0.2907 | 19 | 20 | 0.4361 | 29 |
| 5 | 0.2907 | 19 | 21 | 0.4361 | 29 |
| 6 | 0.9690 | 65 | 22 | 0.4361 | 29 |
| 7 | 0.9690 | 65 | 23 | 2.0350 | 136 |
| 8 | 0.2907 | 19 | 24 | 2.0350 | 136 |
| 9 | 0.2907 | 19 | 25 | 0.2907 | 19 |
| 10 | 0.2180 | 15 | 26 | 0.2907 | 19 |
| 11 | 0.2907 | 19 | 27 | 0.2907 | 19 |
| 12 | 0.2907 | 19 | 28 | 0.5814 | 39 |
| 13 | 0.5814 | 39 | 29 | 0.9690 | 65 |
| 14 | 0.2907 | 19 | 30 | 0.7268 | 48 |
| 15 | 0.2907 | 19 | 31 | 1.0175 | 68 |
| 16 | 0.2907 | 19 | 32 | 0.2907 | 19 |
| Index | External Grid | 110/10 kV Transformer | Load Bus |
|---|---|---|---|
| MTTF(h) | 87600 | 14600 | 39820 |
| MTTR(h) | 7.5 | 3 | 5 |
| Parameters | Value |
|---|---|
| Rated charging power (kW) | 9 |
| Rated discharging power (kW) | 4 |
| Batteries efficient | 0.95 |
| Batteries capacity (kWh) | 45 |
| Queue parameters (S0,S) | (50,80) |
| Electricity price ($) [13] | 0.5 (peak time) |
| 0.2 (shoulder peak time) | |
| 0.15 (off peak time) |
| System | Load Point | 1 | 2 | 3 | 4 | 5 | 6 | 7 | 8 | |
|---|---|---|---|---|---|---|---|---|---|---|
| SAIFI (time/c-y) | 0.6157 | LAIFI (time/c-y) | 0.2000 | 0.2000 | 0.2000 | 0.3000 | 1.3000 | 0.8000 | 0.5000 | 1.4000 |
| SAIDI (h/c-y) | 2.3443 | LAIDI (h/c-y) | 0.6000 | 0.6000 | 0.6000 | 0.7000 | 2.7000 | 4.6000 | 1.1000 | 4.8000 |
| SEENS (MWh/y) | 28.7209 | LEENS (MWh/y) | 0.2214 | 0.1992 | 0.2656 | 0.1414 | 0.6028 | 3.0214 | 0.8242 | 0.9343 |
| Load point | 9 | 10 | 11 | 12 | 13 | 14 | 15 | 16 | ||
| LAIFI (time/c-y) | 1.3000 | 0.8000 | 0.4000 | 0.5000 | 0.3000 | 1.4000 | 1.2000 | 1.9000 | ||
| LAIDI (h/c-y) | 2.1000 | 3.5000 | 3.1000 | 2.0000 | 0.7000 | 3.0000 | 3.9000 | 9.2000 | ||
| LEENS (MWh/y) | 0.4645 | 0.4317 | 0.4771 | 0.3173 | 0.3091 | 0.6371 | 0.7806 | 1.7565 | ||
| Load point | 17 | 18 | 19 | 20 | 21 | 22 | 23 | 24 | ||
| LAIFI (time/c-y) | 0.8000 | 0.3000 | 0.6000 | 0.4000 | 0.2000 | 0.2000 | 0.5000 | 0.5000 | ||
| LAIDI (h/c-y) | 1.7000 | 0.7000 | 1.8000 | 0.9000 | 0.6000 | 0.6000 | 2.3000 | 2.7000 | ||
| LEENS (MWh/y) | 0.6022 | 0.2249 | 0.6362 | 0.3135 | 0.1992 | 0.1992 | 2.8083 | 3.4102 | ||
| Load point | 25 | 26 | 27 | 28 | 29 | 30 | 31 | 32 | ||
| LAIFI (time/c-y) | 1.4000 | 1.6000 | 1.2000 | 0.7000 | 0.6161 | 0.6000 | 0.5000 | 0.2000 | ||
| LAIDI (h/c-y) | 2.7000 | 5.0000 | 3.1000 | 4.3000 | 1.3881 | 3.6000 | 2.7000 | 0.6000 | ||
| LEENS (MWh/y) | 0.5652 | 1.0695 | 0.5894 | 1.7143 | 0.9947 | 1.7466 | 2.1303 | 0.1328 |
| System | Load Point | 1 | 2 | 3 | 4 | 5 | 6 | 7 | 8 | |
|---|---|---|---|---|---|---|---|---|---|---|
| SAIFI (time/c-y) | 0.6466 | LAIFI (time/c-y) | 0.7000 | 0.7000 | 0.5000 | 0.5000 | 1.3000 | 0.7000 | 0.4000 | 1.3000 |
| SAIDI (h/c-y) | 2.9339 | LAIDI (h/c-y) | 2.2000 | 2.3000 | 1.8000 | 3.1000 | 4.1000 | 4.5000 | 1.6000 | 4.2000 |
| SEENS (MWh/y) | 40.8239 | LEENS (MWh/y) | 0.6671 | 0.7583 | 0.7865 | 0.6555 | 0.9269 | 2.8531 | 1.1190 | 0.8685 |
| Load point | 9 | 10 | 11 | 12 | 13 | 14 | 15 | 16 | ||
| LAIFI (time/c-y) | 1.0000 | 0.5000 | 0.6000 | 0.4000 | 0.3000 | 1.3000 | 1.7000 | 1.2000 | ||
| LAIDI (h/c-y) | 3.3000 | 4.5000 | 3.6000 | 1.9000 | 1.5000 | 3.9000 | 6.4000 | 3.7000 | ||
| LEENS (MWh/y) | 0.7519 | 0.6614 | 0.7467 | 0.4088 | 0.6469 | 0.8804 | 1.3367 | 0.8357 | ||
| Load point | 17 | 18 | 19 | 20 | 21 | 22 | 23 | 24 | ||
| LAIFI (time/c-y) | 1.0000 | 0.7000 | 1.0000 | 0.8000 | 0.7000 | 0.3000 | 0.5000 | 0.3000 | ||
| LAIDI (h/c-y) | 5.3000 | 3.7000 | 4.3000 | 4.8000 | 2.9000 | 1.5000 | 2.3000 | 1.5000 | ||
| LEENS (MWh/y) | 1.6864 | 1.1407 | 1.3197 | 1.4358 | 0.8455 | 0.4852 | 3.5709 | 2.2642 | ||
| Load point | 25 | 26 | 27 | 28 | 29 | 30 | 31 | 32 | ||
| LAIFI (time/c-y) | 1.3000 | 1.0000 | 1.4000 | 0.4000 | 0.9160 | 0.5289 | 0.3000 | 0.6000 | ||
| LAIDI (h/c-y) | 4.3000 | 3.8000 | 4.0000 | 1.8000 | 5.8540 | 2.2867 | 1.5000 | 3.5000 | ||
| LEENS (MWh/y) | 0.9737 | 0.8201 | 0.8933 | 0.7412 | 3.9894 | 4.0019 | 1.1321 | 0.6206 |
| System | Load Point | 1 | 2 | 3 | 4 | 5 | 6 | 7 | 8 | |
|---|---|---|---|---|---|---|---|---|---|---|
| SAIFI (time/c-y) | 0.6313 | LAIFI (time/c-y) | 0.7000 | 0.7000 | 0.5000 | 0.5000 | 1.4000 | 0.7000 | 0.4000 | 1.4000 |
| SAIDI (h/c-y) | 2.8657 | LAIDI (h/c-y) | 2.2000 | 2.3000 | 1.8000 | 3.1000 | 4.0000 | 4.5000 | 1.6000 | 4.1000 |
| SEENS (MWh/y) | 39.8603 | LEENS (MWh/y) | 0.6671 | 0.7583 | 0.7865 | 0.6555 | 0.9067 | 2.8531 | 1.1190 | 0.8483 |
| Load point | 9 | 10 | 11 | 12 | 13 | 14 | 15 | 16 | ||
| LAIFI (time/c-y) | 1.0000 | 0.5000 | 0.6000 | 0.4000 | 0.3000 | 1.3000 | 1.7000 | 1.2000 | ||
| LAIDI (h/c-y) | 3.3000 | 4.5000 | 3.6000 | 1.9000 | 1.5000 | 3.9000 | 6.4000 | 3.7000 | ||
| LEENS (MWh/y) | 0.7519 | 0.6614 | 0.7467 | 0.4088 | 0.6469 | 0.8804 | 1.3367 | 0.8357 | ||
| Load point | 17 | 18 | 19 | 20 | 21 | 22 | 23 | 24 | ||
| LAIFI (time/c-y) | 0.8000 | 0.7000 | 0.9000 | 0.7000 | 0.7000 | 0.3000 | 0.5000 | 0.3000 | ||
| LAIDI (h/c-y) | 4.7000 | 3.7000 | 4.2000 | 4.6000 | 2.9000 | 1.5000 | 2.3000 | 1.5000 | ||
| LEENS (MWh/y) | 1.4859 | 1.1407 | 1.2857 | 1.3642 | 0.8455 | 0.4852 | 3.5709 | 2.2642 | ||
| Load point | 25 | 26 | 27 | 28 | 29 | 30 | 31 | 32 | ||
| LAIFI (time/c-y) | 1.2000 | 1.0000 | 1.4000 | 0.4000 | 0.7823 | 0.5289 | 0.3000 | 0.6000 | ||
| LAIDI (h/c-y) | 4.2000 | 3.8000 | 4.0000 | 1.8000 | 5.0834 | 2.2867 | 1.5000 | 3.5000 | ||
| LEENS (MWh/y) | 0.9523 | 0.8201 | 0.8933 | 0.7412 | 3.3938 | 4.0019 | 1.1321 | 0.6206 |
| System | Load Point | 1 | 2 | 3 | 4 | 5 | 6 | 7 | 8 | |
|---|---|---|---|---|---|---|---|---|---|---|
| SAIFI (time/c-y) | 0.6886 | LAIFI (time/c-y) | 0.7570 | 0.7634 | 0.5063 | 0.5457 | 1.3822 | 0.7068 | 0.4111 | 1.3711 |
| SAIDI (h/c-y) | 3.1099 | LAIDI (h/c-y) | 2.4107 | 2.5219 | 1.8284 | 3.4009 | 4.4924 | 4.7184 | 1.7280 | 4.2596 |
| SEENS (MWh/y) | 43.0769 | LEENS (MWh/y) | 0.6952 | 0.8277 | 0.8488 | 0.7184 | 0.9877 | 2.8633 | 1.2140 | 0.9496 |
| Load point | 9 | 10 | 11 | 12 | 13 | 14 | 15 | 16 | ||
| LAIFI (time/c-y) | 1.0679 | 0.5379 | 0.6446 | 0.4157 | 0.3197 | 1.3223 | 1.8200 | 1.2038 | ||
| LAIDI (h/c-y) | 3.3914 | 4.5208 | 3.6350 | 2.0565 | 1.6042 | 4.0237 | 7.0081 | 3.7127 | ||
| LEENS (MWh/y) | 0.7849 | 0.6867 | 0.8038 | 0.4413 | 0.6590 | 0.9235 | 1.3962 | 0.8897 | ||
| Load point | 17 | 18 | 19 | 20 | 21 | 22 | 23 | 24 | ||
| LAIFI (time/c-y) | 1.0709 | 0.7528 | 1.0276 | 0.8544 | 0.7459 | 0.3049 | 0.5059 | 0.3150 | ||
| LAIDI (h/c-y) | 5.8087 | 3.8259 | 4.5517 | 4.9074 | 3.1179 | 1.5383 | 2.4164 | 1.6049 | ||
| LEENS (MWh/y) | 1.8367 | 1.2501 | 1.3919 | 1.4557 | 0.8581 | 0.4977 | 3.8711 | 2.3218 | ||
| Load point | 25 | 26 | 27 | 28 | 29 | 30 | 31 | 32 | ||
| LAIFI (time/c-y) | 1.4059 | 1.0244 | 1.5301 | 0.4140 | 0.9340 | 0.5422 | 0.3185 | 0.6284 | ||
| LAIDI (h/c-y) | 4.4512 | 4.1157 | 4.2341 | 1.8990 | 6.3910 | 2.3520 | 1.6136 | 3.7638 | ||
| LEENS (MWh/y) | 1.0108 | 0.8667 | 0.9000 | 0.7452 | 4.2011 | 4.3137 | 1.2378 | 0.6287 |
| Sampling Method | SRS | LHS |
|---|---|---|
| EV flow | 0.0524 | 0.0100 |
| Initial SOC | 0.0663 | 0.0098 |
| Component failure state | 0.0110 | 0.0098 |
Publisher’s Note: MDPI stays neutral with regard to jurisdictional claims in published maps and institutional affiliations. |
© 2020 by the authors. Licensee MDPI, Basel, Switzerland. This article is an open access article distributed under the terms and conditions of the Creative Commons Attribution (CC BY) license (http://creativecommons.org/licenses/by/4.0/).
Share and Cite
Zeng, B.; Luo, Y.; Zhang, C.; Liu, Y. Assessing the Impact of an EV Battery Swapping Station on the Reliability of Distribution Systems. Appl. Sci. 2020, 10, 8023. https://doi.org/10.3390/app10228023
Zeng B, Luo Y, Zhang C, Liu Y. Assessing the Impact of an EV Battery Swapping Station on the Reliability of Distribution Systems. Applied Sciences. 2020; 10(22):8023. https://doi.org/10.3390/app10228023
Chicago/Turabian StyleZeng, Bo, Yangfan Luo, Changhao Zhang, and Yixian Liu. 2020. "Assessing the Impact of an EV Battery Swapping Station on the Reliability of Distribution Systems" Applied Sciences 10, no. 22: 8023. https://doi.org/10.3390/app10228023
APA StyleZeng, B., Luo, Y., Zhang, C., & Liu, Y. (2020). Assessing the Impact of an EV Battery Swapping Station on the Reliability of Distribution Systems. Applied Sciences, 10(22), 8023. https://doi.org/10.3390/app10228023