Article

TD-DFT Prediction of the Intermolecular Charge-Transfer UV-Vis Spectra of Viologen Salts in Solution

by
Giacomo Saielli
1,2
1
CNR Institute on Membrane Technology, Padova Unit, Via Marzolo, 1-35131 Padova, Italy
2
Department of Chemical Sciences, University of Padova, Via Marzolo, 1-35131 Padova, Italy
Appl. Sci. 2020, 10(22), 8108; https://doi.org/10.3390/app10228108
Submission received: 27 October 2020 / Revised: 11 November 2020 / Accepted: 13 November 2020 / Published: 16 November 2020

Abstract

:

Featured Application

The proposed computational protocol can be used as an efficient tool to predict the absorption maximum of the charge transfer band of a viologen salt in a solvent of low to medium polarity.

Abstract

The absorption spectrum of viologen salts in a medium or low polar solvent is an essential feature that influences all its “chromic” applications, whether we are considering thermochromic, electrochromic, photochromic or chemochromic devices. The prediction by quantum chemical methods of such absorption bands, typically observed in the visible range and due to charge transfer (CT) phenomena, is a very challenging problem due to strong solvent effects influencing both the geometry and the electronic transitions. Here we present a computational protocol based on DFT to predict with very high accuracy the absorption maxima of the CT bands of a series of viologen salts in solvents of low and medium polarity. The calculations also allow a clear dissection of the solvent effects, direct and indirect, and orbital contributions to the CT band.
Keywords:
viologen; UV-Vis; TD-DFT

1. Introduction

Viologen salts [1], that is salts of N-disubstituted 4,4′-bipyridinium, represent a textbook example of compounds whose color can be finely tuned by several stimuli. Thus, viologens are known to exhibit electrochromism [2,3] (color dependence on electricity), thermochromism [4,5] (color dependence on temperature), photochromism [6,7] (color dependence on light), sometimes all included in the same compound [8]. In addition to the external physical stimuli, viologen salts’ color is also dependent on the chemistry of the counter-anions, substituents on the bipyridinium core, pH and the solvent (chemochromism) [1,9].
One interesting aspect of the photochemistry of viologens is the color of the salts and corresponding solutions in low- or nonpolar solvents due to charge-transfer from the donor anion to the bipyridinium unit. As an example, N-N’-dialkyl-4,4′-bipyridinum salts, in the solid state, are white with noncoordinating and hard anions such as hexafluorophosphate and 1,1,1-trifluoro-N-((trifluoromethyl) sulfonyl) methanesulfonamide (also known as bistriflimide) [10,11,12,13]; bromide salts are yellow [11], iodide salts are red [14] while iodide salts of N-N’-dialkyl-2-2′-6-6′-tetrametyl-4,4′-bipyridinum are orange [10], to mention but a few examples which nevertheless highlight how relatively minor chemical differences can affect the UV-Vis absorption spectrum. When dissolved in low- or nonpolar solvents the corresponding solutions have a similar color to the solid salt [9].
The prediction of the absorption spectrum of organic dyes, by quantum chemical protocols, is nowadays quite advanced: covalent systems do not pose significant problems and it is possible to successfully predict the UV-Vis spectrum of organic compounds, using Time-Dependent Density Functional Theory (TD-DFT), with very high accuracy [15,16,17]. On the other hand, the application of the same protocols to noncovalent systems is much more challenging [18]: Which is the correct geometry to be considered for a noncovalent compound? Is DFT capable to correctly account for long-range effects and electron density in noncovalently bound systems? Moreover, especially regarding viologen salts in solution, can intermolecular charge transfer (CT) bands be accurately modelled by DFT methods?
In this work we will test several TD-DFT protocols for the calculation of the absorption spectra of viologen salts in medium and low polar solvents in order to provide a recipe for the prediction of the maximum of the CT absorption. To this end we select here few experimental data, mostly from the author, concerning different viologen salts in different solvents.
The experimental data of the maximum of the absorption of the lowest energy band in the UV-Vis spectrum in dichloromethane (CH2Cl2) for four representative examples of viologen salts, have been taken from the literature and listed in Table 1. For octylviolgen iodide, we also have experimental data in acetone. As discussed in Ref. [9] and also consistent with the observations reported by Arduini et al. [19,20], there is no evidence of significant aggregation of bromides and iodides viologens salts in solvents of low and medium polarity, except for the formation of neutral clusters. This is in striking contrast with the aggregation behavior of viologens salts of “hydrophobic” anions, like bistriflimide, which show a strong dependence of the spectroscopic properties on the concentration [21,22]. However, for the systems investigated here it is reasonable to assume the formation of just neutral clusters of 1:2 stoichiometry.

2. Materials and Methods

The structures of the model systems were built with the Molden software package [23]. Neutral clusters made of a dimethylviologen cation and two anions have been considered since the alkyl chains, although important in order to guarantee some solubility in low-polar solvent, does not give any significant contribution to the charge-transfer band between the anions and the bipyridinium core. Energy minimization was run at the B3LYP-D3(PCM)/6-31+G(d,p), that is including the dispersion correction of Grimme [24] and the long-range solvent dielectric response [25]. n-Hexane (ε = 1.8819), dichloromethane (ε = 8.93) and acetone (ε = 20.493) were selected as solvents. All structures were checked, by frequency calculations, to be true minima with no imaginary frequencies. Xyz coordinates can be found in Supporting Information. Subsequent TD-DFT calculations were run with a variety of functionals and two basis sets of double and triple-ζ quality: 6-31+G(d,p) and aug-cc-pVTZ. Functionals used for the TD-DFT, again always including the Polarizable Continuum Model (PCM model) of solvation, were: PBE0 [26], M06-2X [27], CAM-B3LYP [28], ωB97-XD [29] and LC-ωHPBE [30,31]. The number of states used for the calculations was set to 10. All calculations have been run with the software package Gaussian16 [32]. GaussView [33] software was used to simulate the UV-Vis spectrum applying a line broadening of 0.4 eV.

3. Results and Discussion

3.1. Geometry

As mentioned in the Materials and Methods Section, while experimental systems consist of dialkylviologens with relatively long alkyl chains (C8 and C10), the model systems used in the calculations are the simpler methylviologens (C1). This structural difference is expected not to affect the comparison between calculated and experimental results since the optical properties of the viologen salts are not influenced by the length of the alkyl chain. In fact, recent experiments concerning the electrochemistry and UV-Vis properties of several alkyl and polyfluoroalkyl viologens revealed that the CV (Cyclic Voltammetry) potentials and spectral properties are not affected by the chain length (though they are affected by the type of chain, alkyl vs. polyfluoroalkyl) [3]. Moreover, as we will see below, none of the relevant orbitals involved in the electronic transitions are localized on the methyl group of the model systems, but only on the bipyridinium core and anions, see also [34]. On the other hand, the weak electron-donor effect of the alkyl chain can be well-modelled by a simple methyl group.
We first discuss the geometry of the model systems and its dependence on the solvent reaction field. In Table 2 we report some relevant structural parameters, that is the average X-N distance (with respect to the closest nitrogen) in the neutral cluster MVX2, where MV represents a model viologen, and MTMV is a model 2,2′,6,6′-tetramethyl methylviologen, and the anion X (Br, I or P for PF6), and the dihedral angle between the two aromatic rings of the cation.
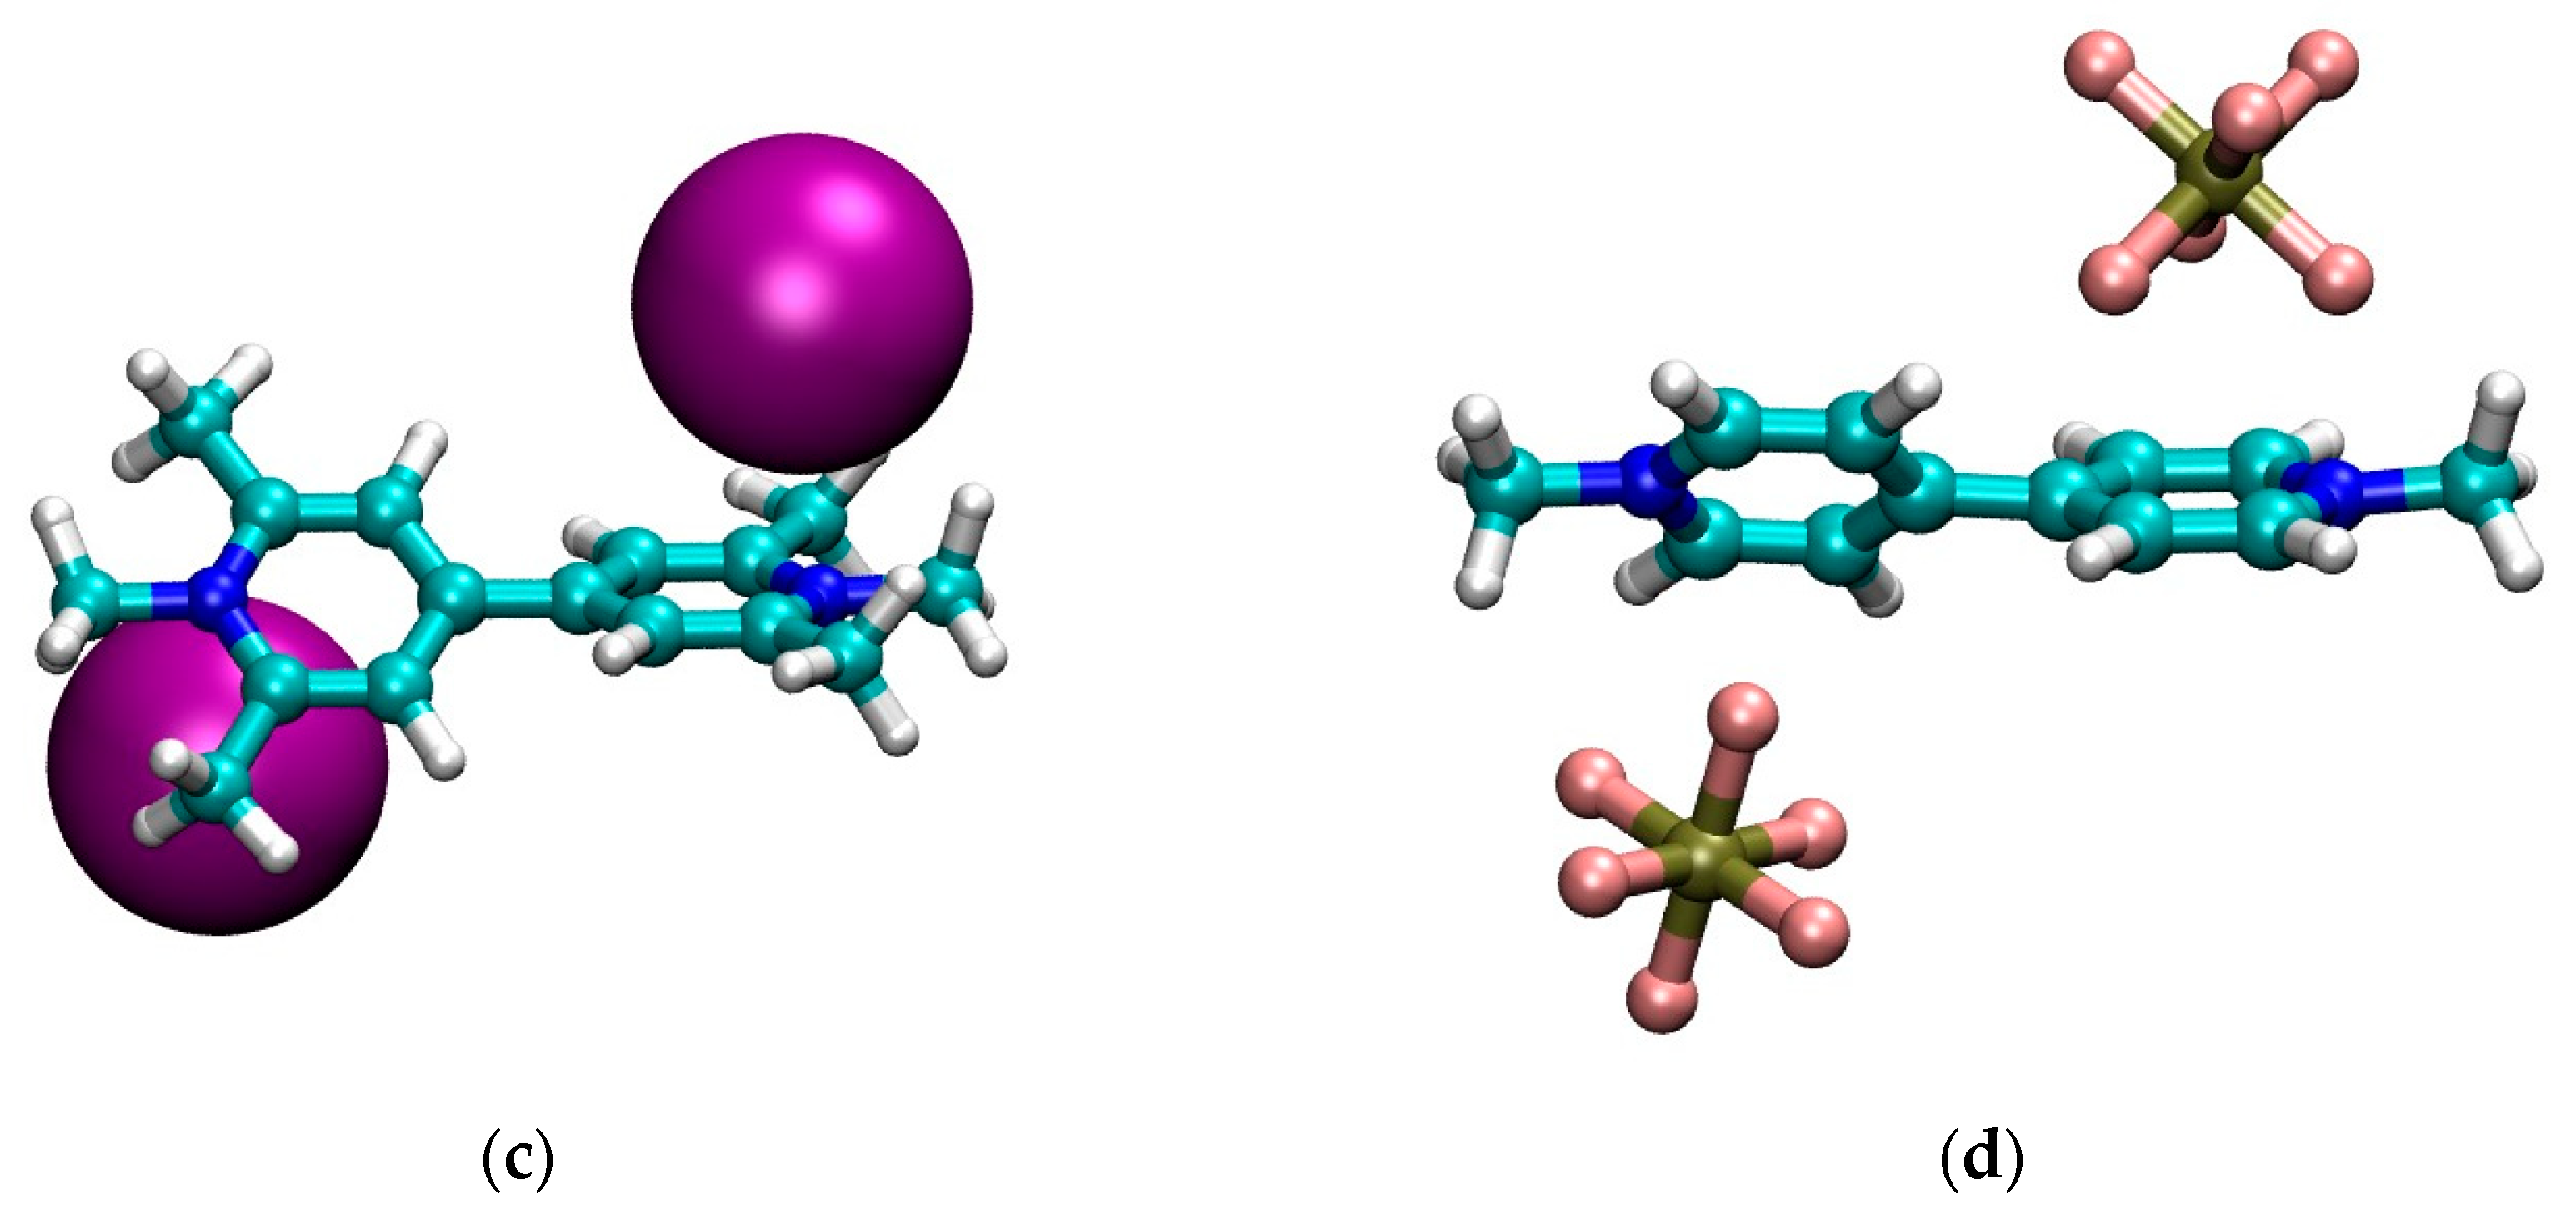
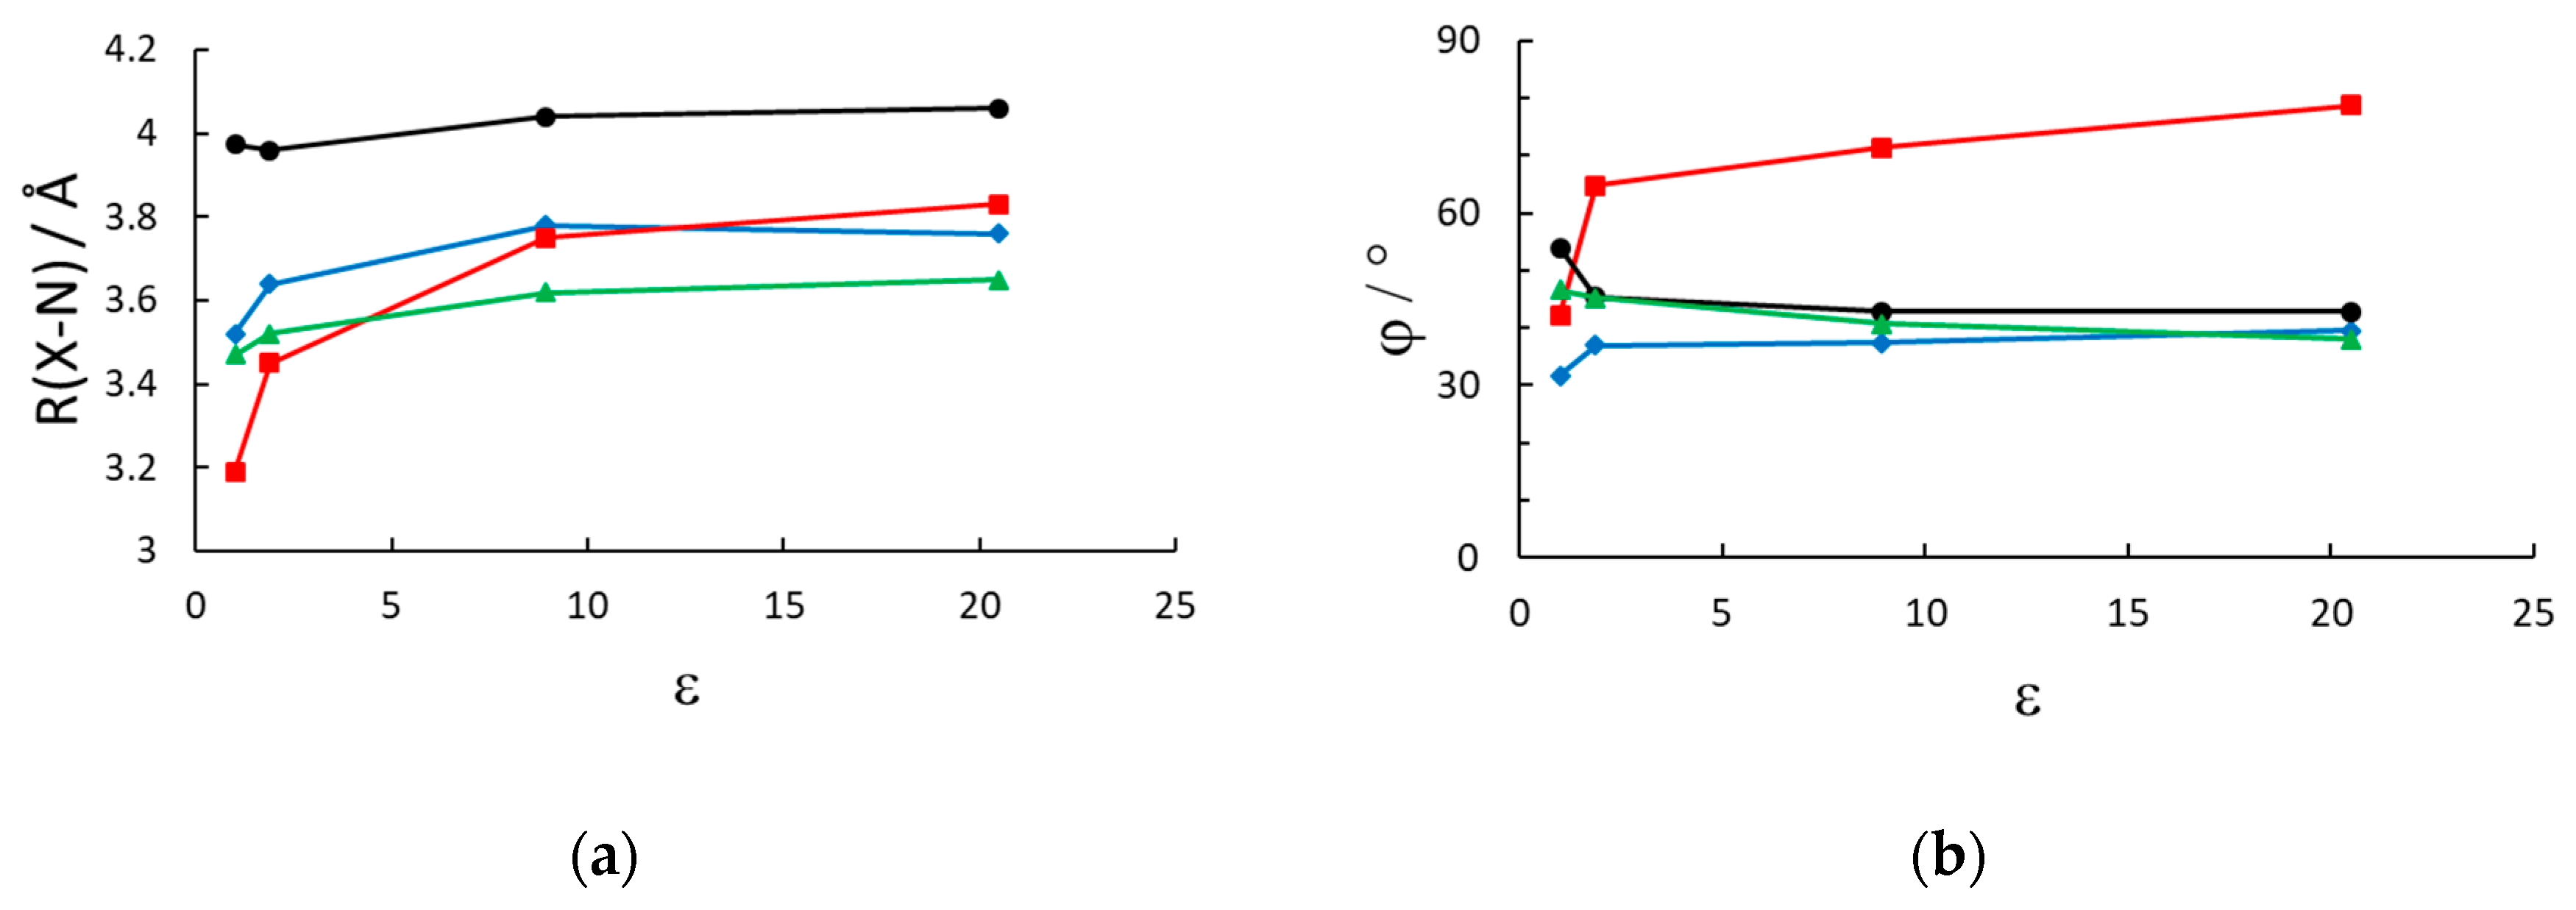
The optimized structures in CH2Cl2 for the four model systems are shown in Figure 1. Finally, in Figure 2 we graphically show the trend of the geometrical parameters of Table 2 as a function of the dielectric constant of the solvent.
First we note that, qualitatively, the structure in CH2Cl2 of the neutral cluster MVBr2, in Figure 1b, is quite different from the other ones. For the bromide case, each anion is approximately sitting on top of the pyridinium ring and the two pyridinium rings are strongly twisted (φ ~ 70°). The other systems, instead, feature the anion closer to the nitrogen and the twist of the two pyridinium units is smaller, see Table 2. The structure of the iodide viologen salt is qualitatively rather similar to the structure of iodide methylviologen in the solid state [36] since the anion is close to the positive nitrogen and to the ortho carbons of the pyridinium ring. However, the bipyriinium is planar in the solid state. The similarity with the solid state structure is much less for the bromide salt, both concerning the position of the anion as well as for the twist angle between the pyridinium units [36].
The geometry also appears to be influenced by the inclusion of a solvent reaction field in the optimization run. As expected for charged systems, the presence of a solvent decreases the strength of the electrostatic interaction compared to the gas phase. The effect is the largest for the bromide salt, with bromide being the hardest anion considered, and almost negligible for the PF6 case, since the charge density is largely reduced in the hexafluorophosphate anion. Therefore the inclusion of the solvent in the optimization of the geometry is strongly recommended, and, especially for relatively low polar solvents, it makes a significant effect on the geometry, compared to vacuum. The effect, being a nonspecific reaction field only dependent on the dielectric constant (and geometric details of the cavity) levels off for dielectric constants larger than about 10 a result which is consistent with the dielectric response in the simpler Onsager model [37] of a dipole in a spherical cavity, which is 2(ε − 1)/(2ε + 1).

3.2. TDDFT Results

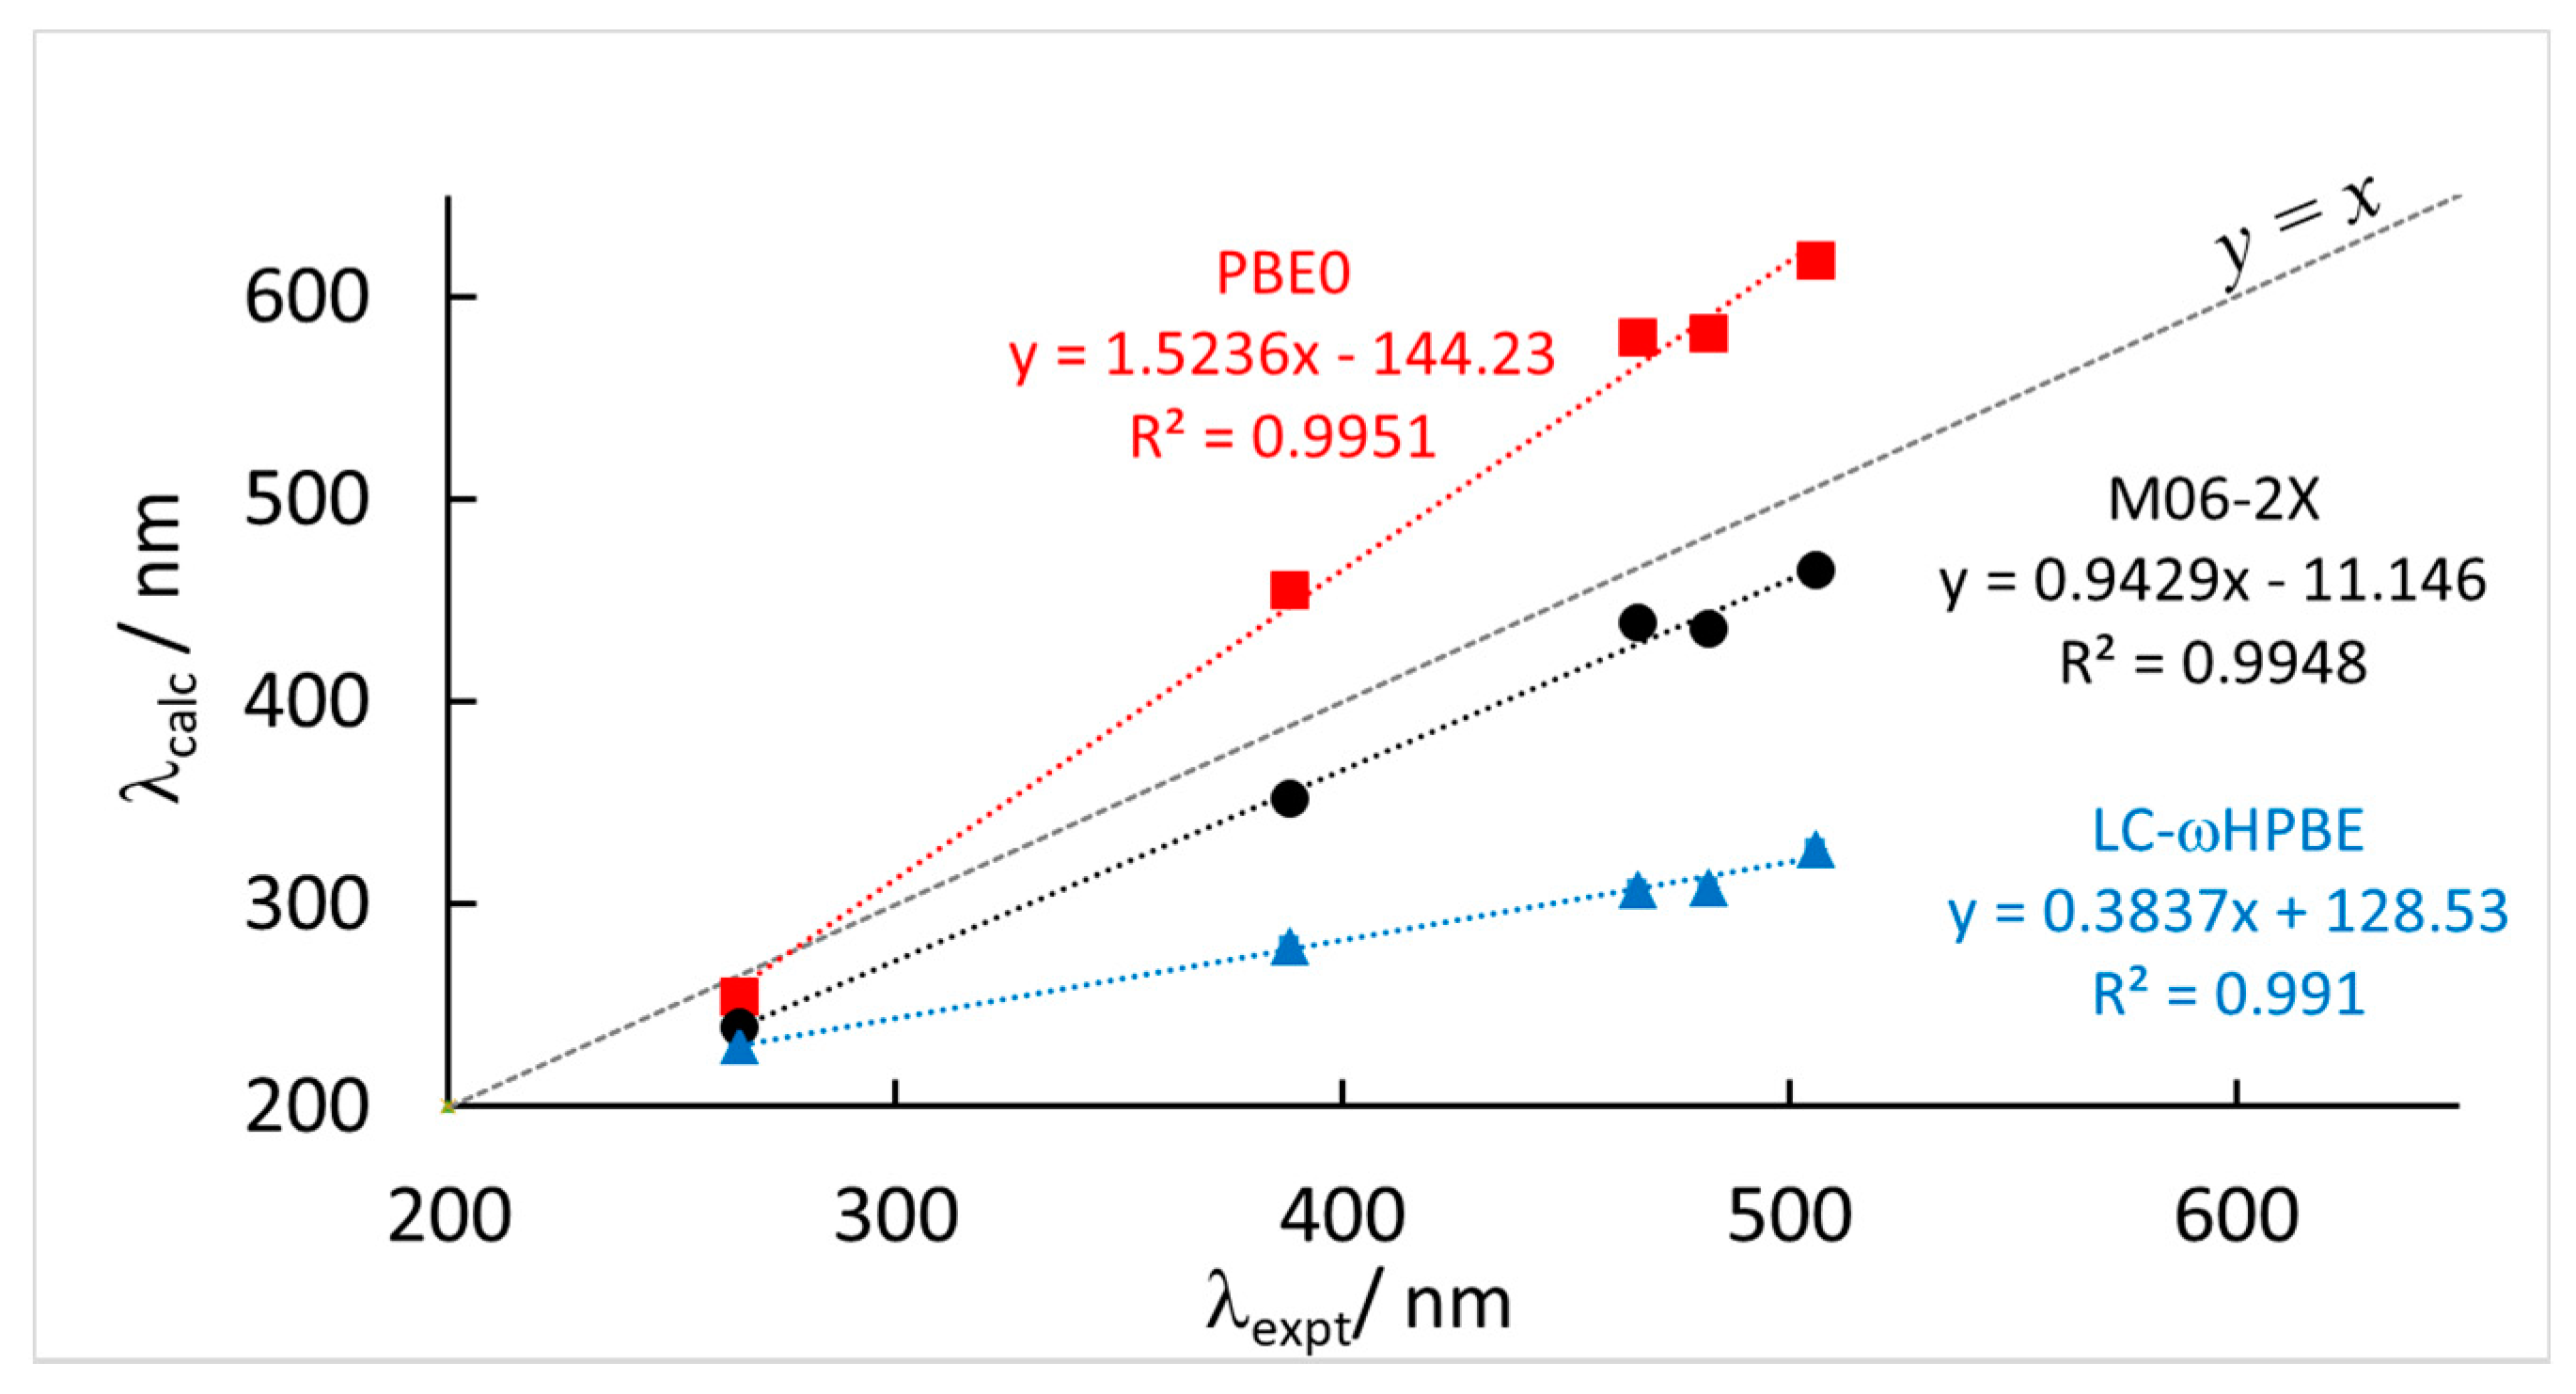
In this section, we will compare the results of the TD-DFT calculations, as described in the computational section. In Figure 3, we show the correlation between the calculated wavelength of the maximum of the absorption CT band of the model cluster and the experimental values reported in Table 1 and Table 3. First we note that by using a double-ζ and or a triple-ζ basis set, namely the 6-31+G(d,p) and the aug-cc-pVTZ with the CAM-B3LYP functional, the calculated absorption spectra change very little, as we can appreciate by inspecting the corresponding columns in Table 3. Therefore, all the remaining calculations were run using the smaller basis set of double-ζ quality which strongly reduces the computational burden.
Concerning the functionals used, we note that the correlation itself is always rather good, with relatively high correlation coefficients R2 for all levels of theory used. Nevertheless, some of the functionals strongly overestimate the slope of the correlation, namely PBE0, while others underestimate it, for example, LC-ωHPBE. Also CAM-B3LYP and ωB97-XD do not perform particularly well. In contrast, M06-2X gives calculated values of λmax in very good agreement with the experimental values. Not only the correlation is good, but also the slope of the fitting line is close to unity and the mean absolute error (MAE) is significantly smaller than for the other cases. The calculated results, at the M06-2X level, appear to be only systematically shifted to lower values, compared to experiments, by a roughly constant value.
The result obtained at the M06-2X(PCM)/6-31+G(d,p)//B3LYP-D3(PCM)/6-31G+(d,p), represent, therefore, the ones in better agreement with experiments among the protocols tested. At the same time, this is a relatively cheap protocol from a computational point of view. The predicting power of the protocol is extremely high if we consider that we are concerned with intermolecular CT bands between anions and cations, therefore noncovalently bound donors and acceptors. Moreover, the experimental values are obtained from systems differing because of the anion (Br, I and PF6), the cation (viologen and tetramethylviologen) and the solvent (dicholoromethane and acetone). Therefore the protocol appears robust. From a practical point of view, in the visible range of wavelengths, once the absorption maximum has been calculated with the above TD-DFT computational protocol, it is sufficient to rescale the calculated value by adding about 35 nm in order to get the experimental result: λmax = λmax(TD-DFT) + 35.2 nm. The additive constant proposed, 35.2 nm, is obtained directly from the MAE reported in Table 3: since all calculated data are underestimated with respect to the experimental wavelength, but nevertheless well linearly correlated, adding the MAE brings the DFT predictions in closest match with experiments.
In order to get more insights on the electronic transitions involved in the calculated absorption bands, we present an analysis of the orbitals involved.
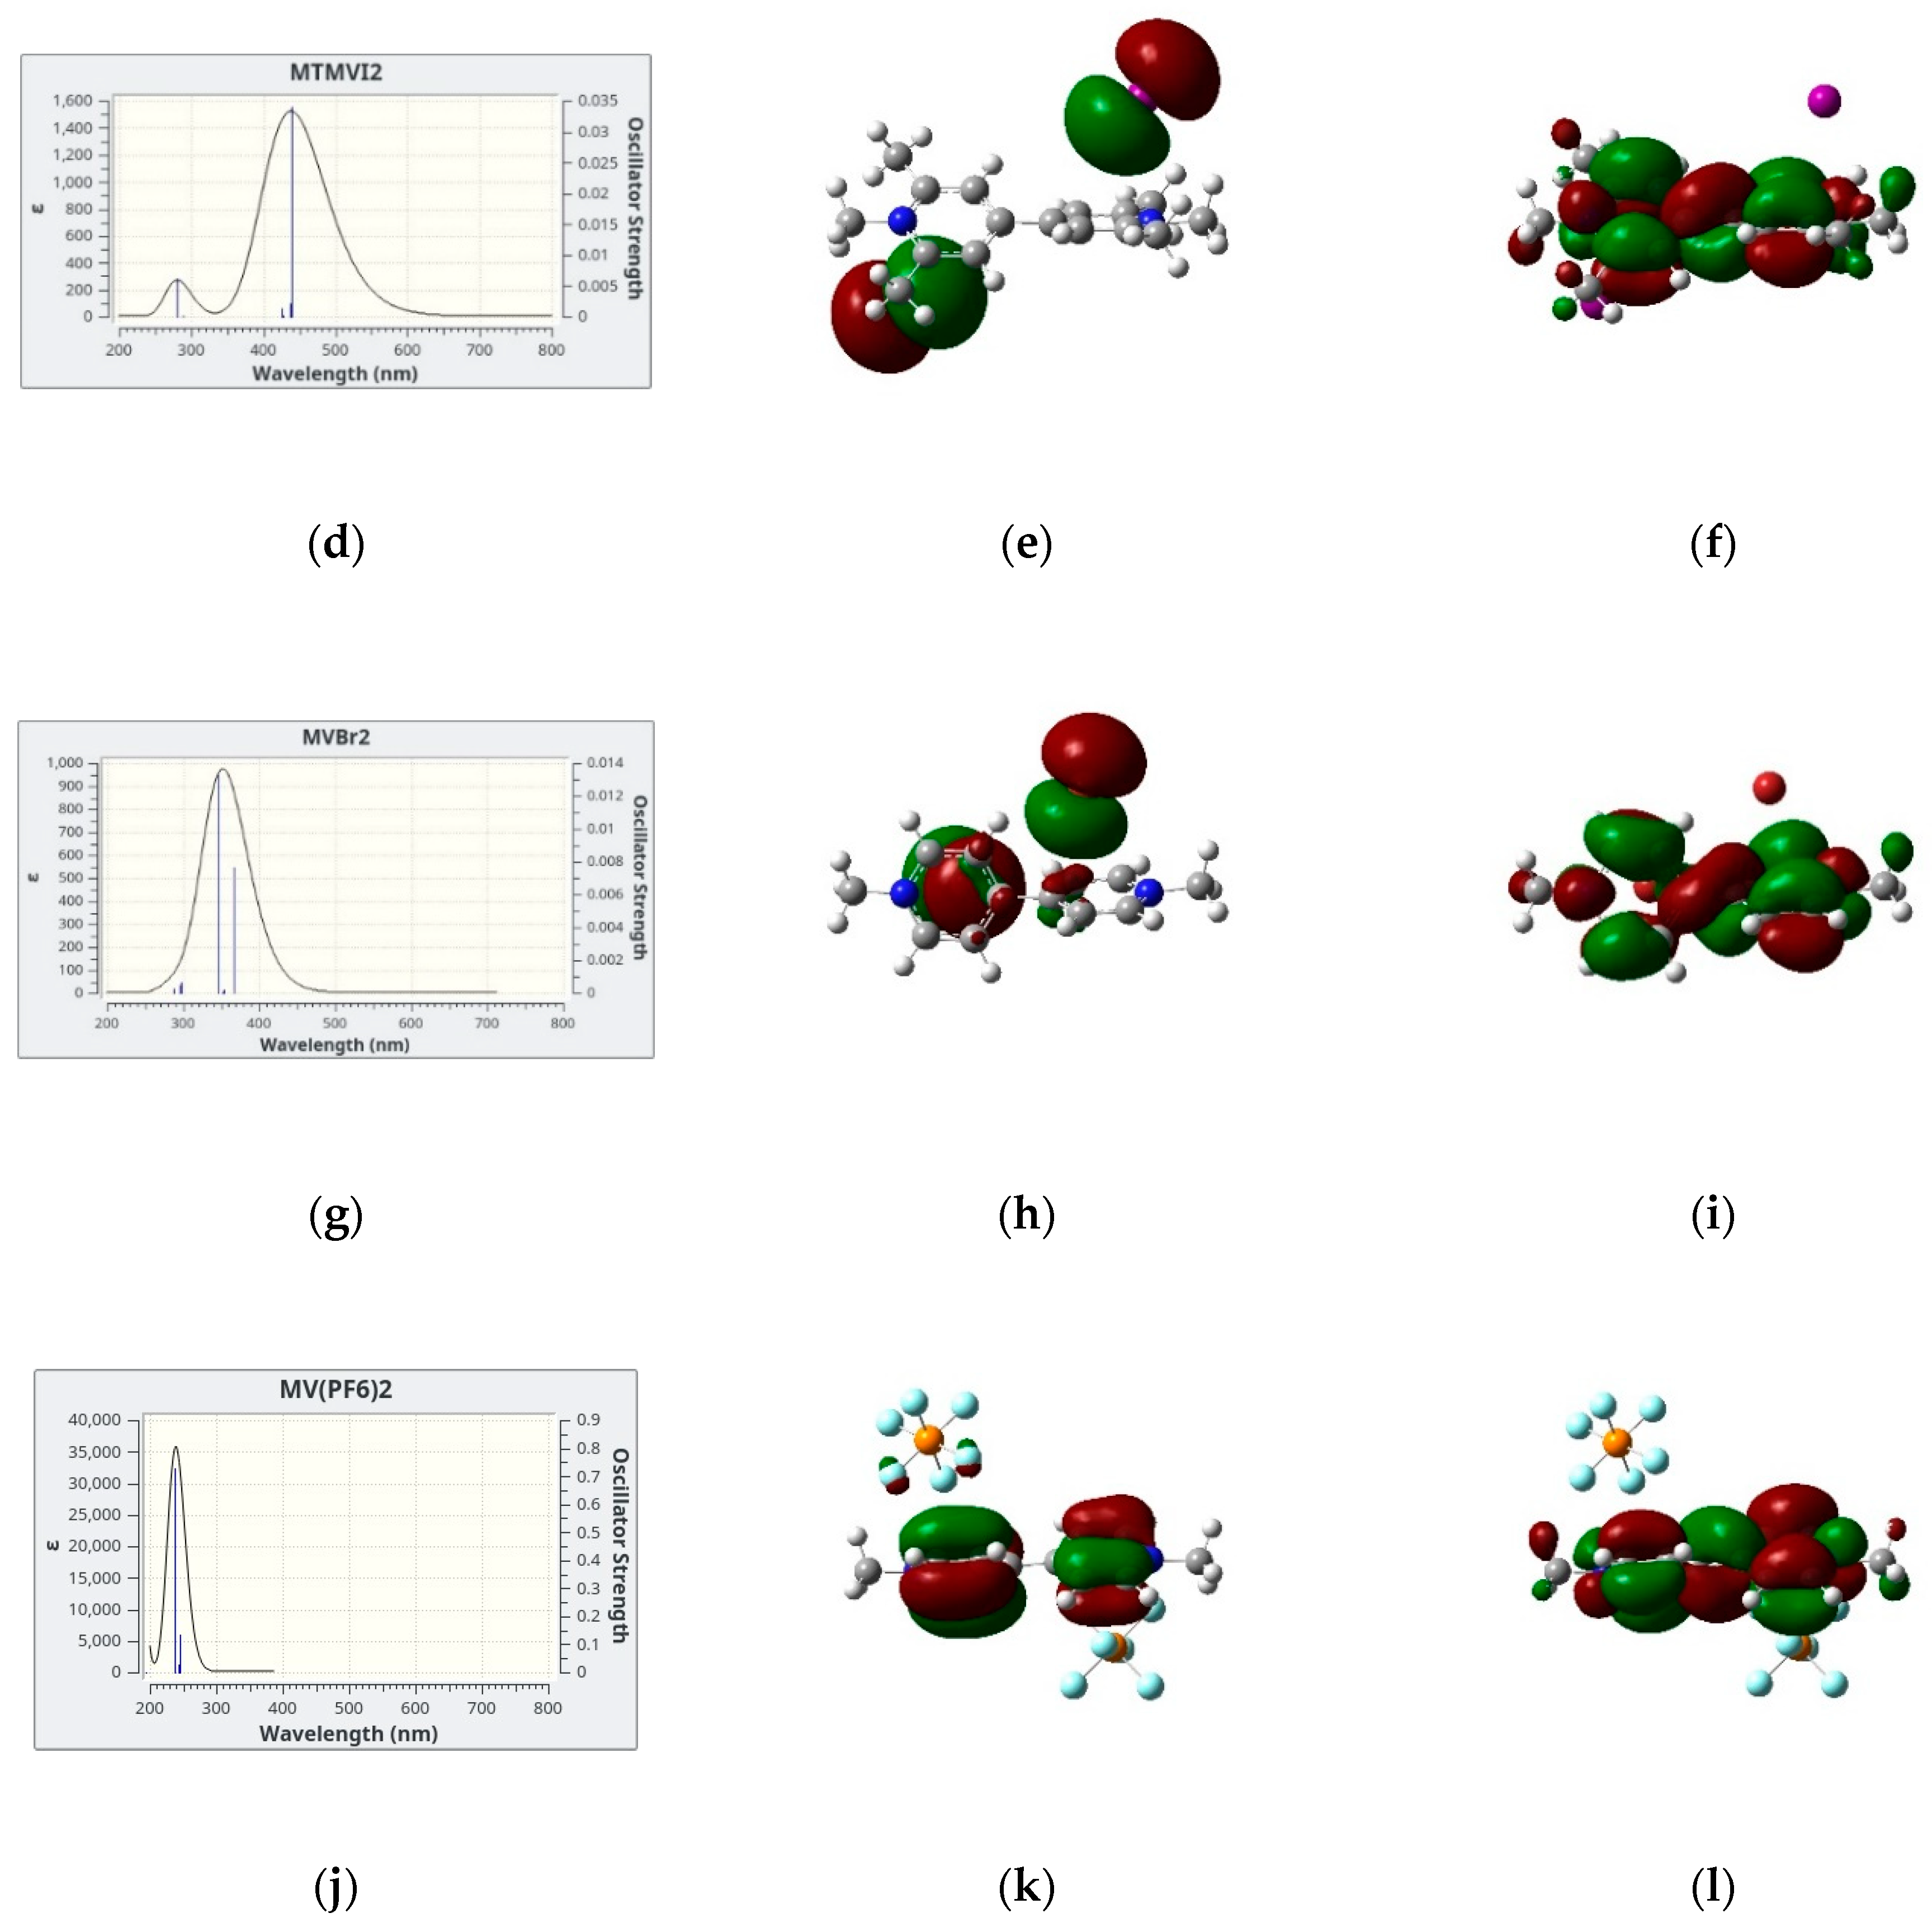
In Figure 4, we show the simulated lowest energy absorption band of four salts in dicholomethane together with the two electronic orbitals giving the largest contribution to the electronic transition(s) which are responsible for the absorption band itself. We limit our analysis to the four cases in CH2Cl2 since the results for MVI2 in acetone are qualitatively similar. In all cases, the largest contribution comes from a HOMO → LUMO transition, the two orbitals also represented in Figure 4, these two being the Highest Occupied Molecular Orbital (HOMO) and the Lowest Unoccupied Molecular Orbital (LUMO). However, while for the iodide and bromide cases, the HOMO is represented by the p orbitals of the anion and the LUMO by a delocalized π system of the cation, for the hexafluorophosphate salt both HOMO and LUMO are localized on the cation, therefore in this case no CT band is predicted. This is, in fact, in agreement with the absence of color of the corresponding solutions and solid salts.
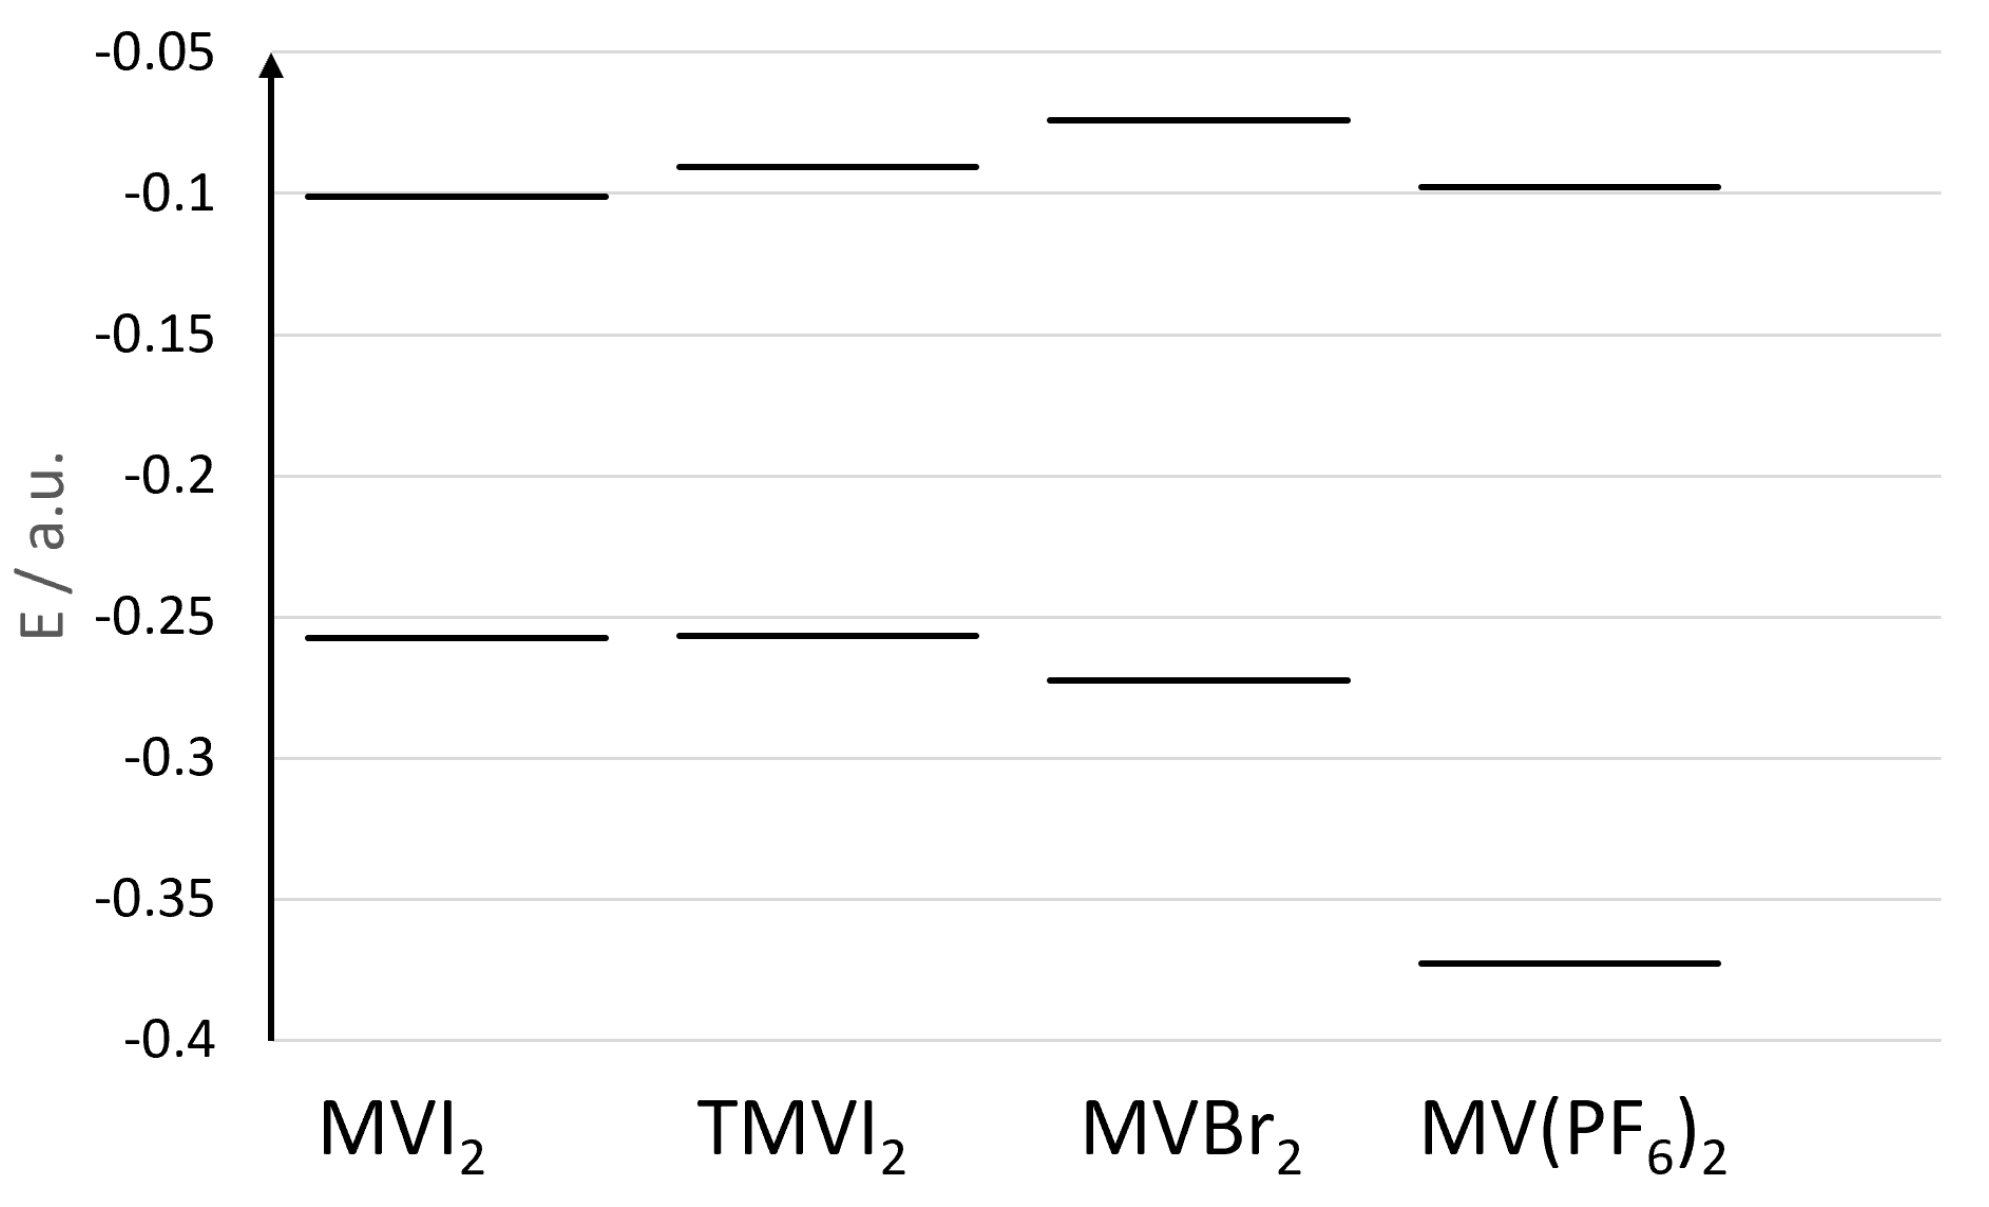
In Figure 5, we show the orbital energies of the HOMO orbitals of the four representative samples in CH2Cl2 (between −0.40 and −0.25 a.u.), and the corresponding LUMO’s (between −0.15 and −0.05 a.u.). It is clear from the figure that the tetramethyl substitution of the bipyridinium core destabilizes the LUMO level, while the HOMO level (being that of the iodide anions) is almost unaffected. This leads to a blue shift of the band. On the other hand, replacing the iodide anion with bromide, induces both a stabilization of the HOMO level (now localized on the bromide anion) as well as a destabilization of the LUMO level of the bipyridinium core leading to an even larger blue shift of the CT band. Finally, the HOMO level in the case of the hexafluorophosphate salt, is much lower in energy being also localized on the bipyridinium ring, thus producing an absorption band at much higher energy without any significant CT contribution.

3.3. Direct and Indirect Solvent Effects

Having obtained a rather good correlation between calculated and experimental CT bands of viologens in low and medium polar solvents, we now proceed to analyze the direct and indirect solvent effects. Direct solvent effects are the ones directly affecting the TD-DFT calculation of the absorption band, for a fixed geometry, while indirect solvent effects are those due to a different geometry (in turn due to the selection of a different solvent for the optimization). Therefore, we will see how the maximum of the CT band changes, using the methylviologen iodide as a reference system, as we change the solvent during the calculation both of the minimum energy structure as well as the absorption band.
An interesting result that we obtain from the calculation is that direct solvent effects on the calculation of the CT energies of transition are very large, while they have a minor impact through the geometry. In other words, having optimized the geometry in a “wrong” solvent, that is using a different dielectric constant, does not affect too much the final result. Of course, optimizing the system in vacuum has a non-negligible effect on the final result, as we mentioned already, but the indirect solvent effect appears to levels off quite rapidly with increasing dielectric constant. Much more important is the careful selection of the solvent for the subsequent TD-DFT calculation. As we can see in Table 4, calculating the CT transition energy in vacuum leads to a huge red-shift. Moreover, the maximum of the absorption is also strongly influenced by the solvent dielectric constant, especially in passing from n-hexane to dichloromethane. The effect is less evident, but still significant, in passing from dichloromethane to acetone.

4. Conclusions

We have analyzed the results of TD-DFT calculations of the absorption charge transfer band of viologen salts in solution of medium to low polar solvents. Comparison of the calculated results with experimental data, using several computational protocols, allowed us to select the TD-DFT = M06-2X(PCM)/6-31+G(d,p)//B3LYP-D3(PCM)/6-31G+(d,p), as the protocol with the best accuracy to computational cost ratio among the ones investigated. A very good linear dependence of the calculated results in the UV-Vis region allowed us to propose the following empirical equation, λmax = λmax(TD-DFT) + 35.2 nm, as a tool to predict the absorption of the viologen salts in a given solvent.
In this work, we have not included highly polar and protic solvents, such as methanol or water, where we expect our computational protocol to fail because the continuum model of solvation cannot capture the additional effect due to hydrogen bonds between water and the anions. Therefore, too tightly bound species would be predicted in this case not corresponding to the real structure in solution. On the other hand, considering explicit solvent molecules for these cases, is not expected to allow quantitative prediction of the kind discussed above. The reason, as shown in Ref. [9], is also related to the fact that when the ions are well solvated and separated, the CT band is hardly detectable and, even if a weak absorption can be observed at some relatively low wavelengths (high energy due to the large separation of donor and acceptor), its position strongly depends on the solvent, as well as ion cluster, dynamics. Such dynamic behavior, however, cannot be properly described by DFT static calculations.

Supplementary Materials

The following are available online at https://www.mdpi.com/2076-3417/10/22/8108/s1, xyz coordinates of the optimized geometries.

Funding

This research received no external funding.

Conflicts of Interest

The authors declare no conflict of interest.

References

  1. Monk, P.M.S. The Viologens, Physicochemical Properties, Synthesis and Applications of the Salts of 4,4’-bipyridine; John Wiley & Sons, Ltd.: New York, NY, USA, 1998. [Google Scholar]
  2. Madasamy, K.; Velayutham, D.; Suryanarayanan, V.; Kathiresan, M.; Ho, K.-C. Viologen-based electrochromic materials and devices. J. Mater. Chem. C 2019, 7, 4622–4637. [Google Scholar] [CrossRef]
  3. Pibiri, I.; Beneduci, A.; Carraro, M.; Causin, V.; Casella, G.; Corrente, G.A.; Chidichimo, G.; Pace, A.; Riccobono, A.; Saielli, G. Mesomorphic and electrooptical properties of viologens based on non-symmetric alkyl/polyfluoroalkyl functionalization and on an oxadiazolyl-extended bent core. J. Mater. Chem. C 2019, 7, 7974–7983. [Google Scholar] [CrossRef]
  4. Hu, M.; Xing, F.; Zhao, Y.; Bai, Y.-L.; Li, M.-X.; Zhu, S. Phenolacetyl Viologen as Multifunctional Chromic Material for Fast and Reversible Sensor of Solvents, Base, Temperature, Metal Ions, NH3 Vapor, and Grind in Solution and Solid State. ACS Omega 2017, 2, 1128–1133. [Google Scholar] [CrossRef]
  5. Kinuta, T.; Sato, T.; Tajima, N.; Kuroda, R.; Matsubara, Y.; Imai, Y. Solid-state thermochromism observed in charge-transfer complex composed of binaphthol and viologen. J. Mol. Struct. 2010, 982, 45–49. [Google Scholar] [CrossRef]
  6. Liu, J.; Li, J.; Zhao, G. Photochromism of supramolecular assemblies based on benzenecarboxylate donors and viologen acceptors. New J. Chem. 2019, 43, 6607–6614. [Google Scholar] [CrossRef]
  7. Kan, W.-Q.; Wen, S.-Z.; He, Y.-C.; Xu, C.-Y. Viologen-Based Photochromic Coordination Polymers for Inkless and Erasable Prints. Inorg. Chem. 2017, 56, 14926–14935. [Google Scholar] [CrossRef] [PubMed]
  8. Li, X.-N.; Tu, Z.-M.; Li, L.; Wang, Z.-H.; Zhang, H. A novel viologen-based coordination polymer with multi-stimuli responsive chromic properties: Photochromism{,} thermochromism{,} chemochromism and electrochromism. Dalt. Trans. 2020, 49, 3228–3233. [Google Scholar] [CrossRef] [PubMed]
  9. Saielli, G. Ion-pairing of octyl viologen diiodide in low-polar solvents: An experimental and computational study. J. Phys. Chem. A 2008, 112, 7987–7995. [Google Scholar] [CrossRef] [PubMed]
  10. Causin, V.; Saielli, G. Effect of a structural modification of the bipyridinium core on the phase behaviour of viologen-based bistriflimide salts. J. Mol. Liq. 2009, 145, 41–47. [Google Scholar] [CrossRef]
  11. Causin, V.; Saielli, G. Effect of asymmetric substitution on the mesomorphic behaviour of low-melting viologen salts of bis(trifluoromethanesulfonyl)amide. J. Mater. Chem. 2009, 19, 9153–9162. [Google Scholar] [CrossRef]
  12. Bhowmik, P.K.; Han, H.S.; Nedeltchev, I.K.; Cebe, J.J. Room-temperature thermotropic ionic liquid crystals: Viologenbis(triflimide) salts. Mol. Cryst. Liq. Cryst. 2004, 419, 27–46. [Google Scholar] [CrossRef]
  13. Bhowmik, P.K.; Han, H.S.; Cebe, J.J.; Burchett, R.A.; Acharya, B.; Kumar, S. Ambient temperature thermotropic liquid crystalline viologen bis(triflimide) salts. Liq. Cryst. 2003, 30, 1433–1440. [Google Scholar] [CrossRef]
  14. Casella, G.; Causin, V.; Rastrelli, F.; Saielli, G. Ionic liquid crystals based on viologen dimers: Tuning the mesomorphism by varying the conformational freedom of the ionic layer. Liq. Cryst. 2016, 43, 1161–1173. [Google Scholar] [CrossRef]
  15. Martynov, A.G.; Mack, J.; May, A.K.; Nyokong, T.; Gorbunova, Y.G.; Tsivadze, A.Y. Methodological Survey of Simplified TD-DFT Methods for Fast and Accurate Interpretation of UV–Vis–NIR Spectra of Phthalocyanines. ACS Omega 2019, 4, 7265–7284. [Google Scholar] [CrossRef]
  16. Shao, Y.; Mei, Y.; Sundholm, D.; Kaila, V.R.I. Benchmarking the Performance of Time-Dependent Density Functional Theory Methods on Biochromophores. J. Chem. Theory Comput. 2020, 16, 587–600. [Google Scholar] [CrossRef] [Green Version]
  17. Charaf-Eddin, A.; Planchat, A.; Mennucci, B.; Adamo, C.; Jacquemin, D. Choosing a Functional for Computing Absorption and Fluorescence Band Shapes with TD-DFT. J. Chem. Theory Comput. 2013, 9, 2749–2760. [Google Scholar] [CrossRef]
  18. Saielli, G. Computational Spectroscopy of Ionic Liquids for Bulk Structure Elucidation. Adv. Theory Simulations 2018, 1, 1800084. [Google Scholar] [CrossRef]
  19. Arduini, A.; Calzavacca, F.; Pochini, A.; Secchi, A. Unidirectional Threading of Triphenylureidocalix[6]arene-Based Wheels: Oriented Pseudorotaxane Synthesis. Chem. Eur. J. 2003, 9, 793–799. [Google Scholar] [CrossRef]
  20. Credi, A.; Dumas, S.; Silvi, S.; Venturi, M.; Arduini, A.; Pochini, A.; Secchi, A. Viologen-Calix[6]arene Pseudorotaxanes. Ion-Pair Recognition and Threading/Dethreading Molecular Motions. J. Org. Chem. 2004, 69, 5881–5887. [Google Scholar] [CrossRef]
  21. Li, S.; Saielli, G.; Wang, Y. Aggregation behavior of dihexadecylviologen bistriflimide ionic liquid crystal in different solvents: Influence of polarity and concentration. Phys. Chem. Chem. Phys. 2018, 20, 22730–22738. [Google Scholar] [CrossRef]
  22. Marotta, E.; Rastrelli, F.; Saielli, G. Aggregation behavior of octyl viologen di[bis(trifluoromethanesulfonyl) amide] in nonpolar solvents. J. Phys. Chem. B 2008, 112, 16566–16574. [Google Scholar] [CrossRef] [PubMed]
  23. Schaftenaar, G.; Noordik, J.H. Molden: A pre- and post-processing program for molecular and electronic structures. J. Comput. Aided. Mol. Des. 2000, 14, 123–134. [Google Scholar] [CrossRef] [PubMed]
  24. Grimme, S.; Antony, J.; Ehrlich, S.; Krieg, H. A consistent and accurate ab initio parametrization of density functional dispersion correction (DFT-D) for the 94 elements H-Pu. J. Chem. Phys. 2010, 132, 154104. [Google Scholar] [CrossRef] [Green Version]
  25. Tomasi, J.; Mennucci, B.; Cammi, R. Quantum mechanical continuum solvation models. Chem. Rev. 2005, 105, 2999–3093. [Google Scholar] [CrossRef] [PubMed]
  26. Adamo, C.; Barone, V. Toward reliable density functional methods without adjustable parameters: The PBE0 model RID C-7344-2008. J. Chem. Phys. 1999, 110, 6158–6170. [Google Scholar] [CrossRef]
  27. Zhao, Y.; Truhlar, D.G. The M06 suite of density functionals for main group thermochemistry, thermochemical kinetics, noncovalent interactions, excited states, and transition elements: Two new functionals and systematic testing of four M06-class functionals and 12 other function. Theor. Chem. Acc. 2008, 120, 215–241. [Google Scholar] [CrossRef] [Green Version]
  28. Yanai, T.; Tew, D.P.; Handy, N.C. A new hybrid exchange–correlation functional using the Coulomb-attenuating method (CAM-B3LYP). Chem. Phys. Lett. 2004, 393, 51–57. [Google Scholar] [CrossRef] [Green Version]
  29. Chai, J.-D.; Head-Gordon, M. Long-range corrected hybrid density functionals with damped atom-atom dispersion corrections. Phys. Chem. Chem. Phys. 2008, 10, 6615–6620. [Google Scholar] [CrossRef] [Green Version]
  30. Henderson, T.M.; Izmaylov, A.F.; Scalmani, G.; Scuseria, G.E. Can short-range hybrids describe long-range-dependent properties? J. Chem. Phys. 2009, 131, 44108. [Google Scholar] [CrossRef]
  31. Vydrov, O.A.; Scuseria, G.E.; Perdew, J.P. Tests of functionals for systems with fractional electron number. J. Chem. Phys. 2007, 126, 154109. [Google Scholar] [CrossRef]
  32. Frisch, M.J.; Trucks, G.W.; Schlegel, H.B.; Scuseria, G.E.; Robb, M.A.; Cheeseman, J.R.; Scalmani, G.; Barone, V.; Petersson, G.A.; Nakatsuji, H.; et al. Gaussian16 2016; Gaussian, Inc.: Wallingford, CT, USA, 2016. [Google Scholar]
  33. Dennington, R.; Keith, T.A.; Millam, J.M. GaussView 2019; Gaussian, Inc.: Wallingford, CT, USA, 2019. [Google Scholar]
  34. di Matteo, A. Structural, electronic and magnetic properties of methylviologen in its reduced forms. Chem. Phys. Lett. 2007, 439, 190–198. [Google Scholar] [CrossRef]
  35. Humphrey, W.; Dalke, A.; Schulten, K. VMD—Visual Molecular Dynamics. J. Mol. Graph. 1996, 14, 33–38. [Google Scholar] [CrossRef]
  36. Russell, J.H.; Wallwork, S.C. The crystal structures of the dichloride and isomorphous dibromide and diiodide of the N,N’-dimethyl-4,4’-bipyridylium ion. Acta Crystallogr. Sect. B 1972, 28, 1527–1533. [Google Scholar] [CrossRef]
  37. Onsager, L. Electric Moments of Molecules in Liquids. J. Am. Chem. Soc. 1936, 58, 1486–1493. [Google Scholar] [CrossRef]
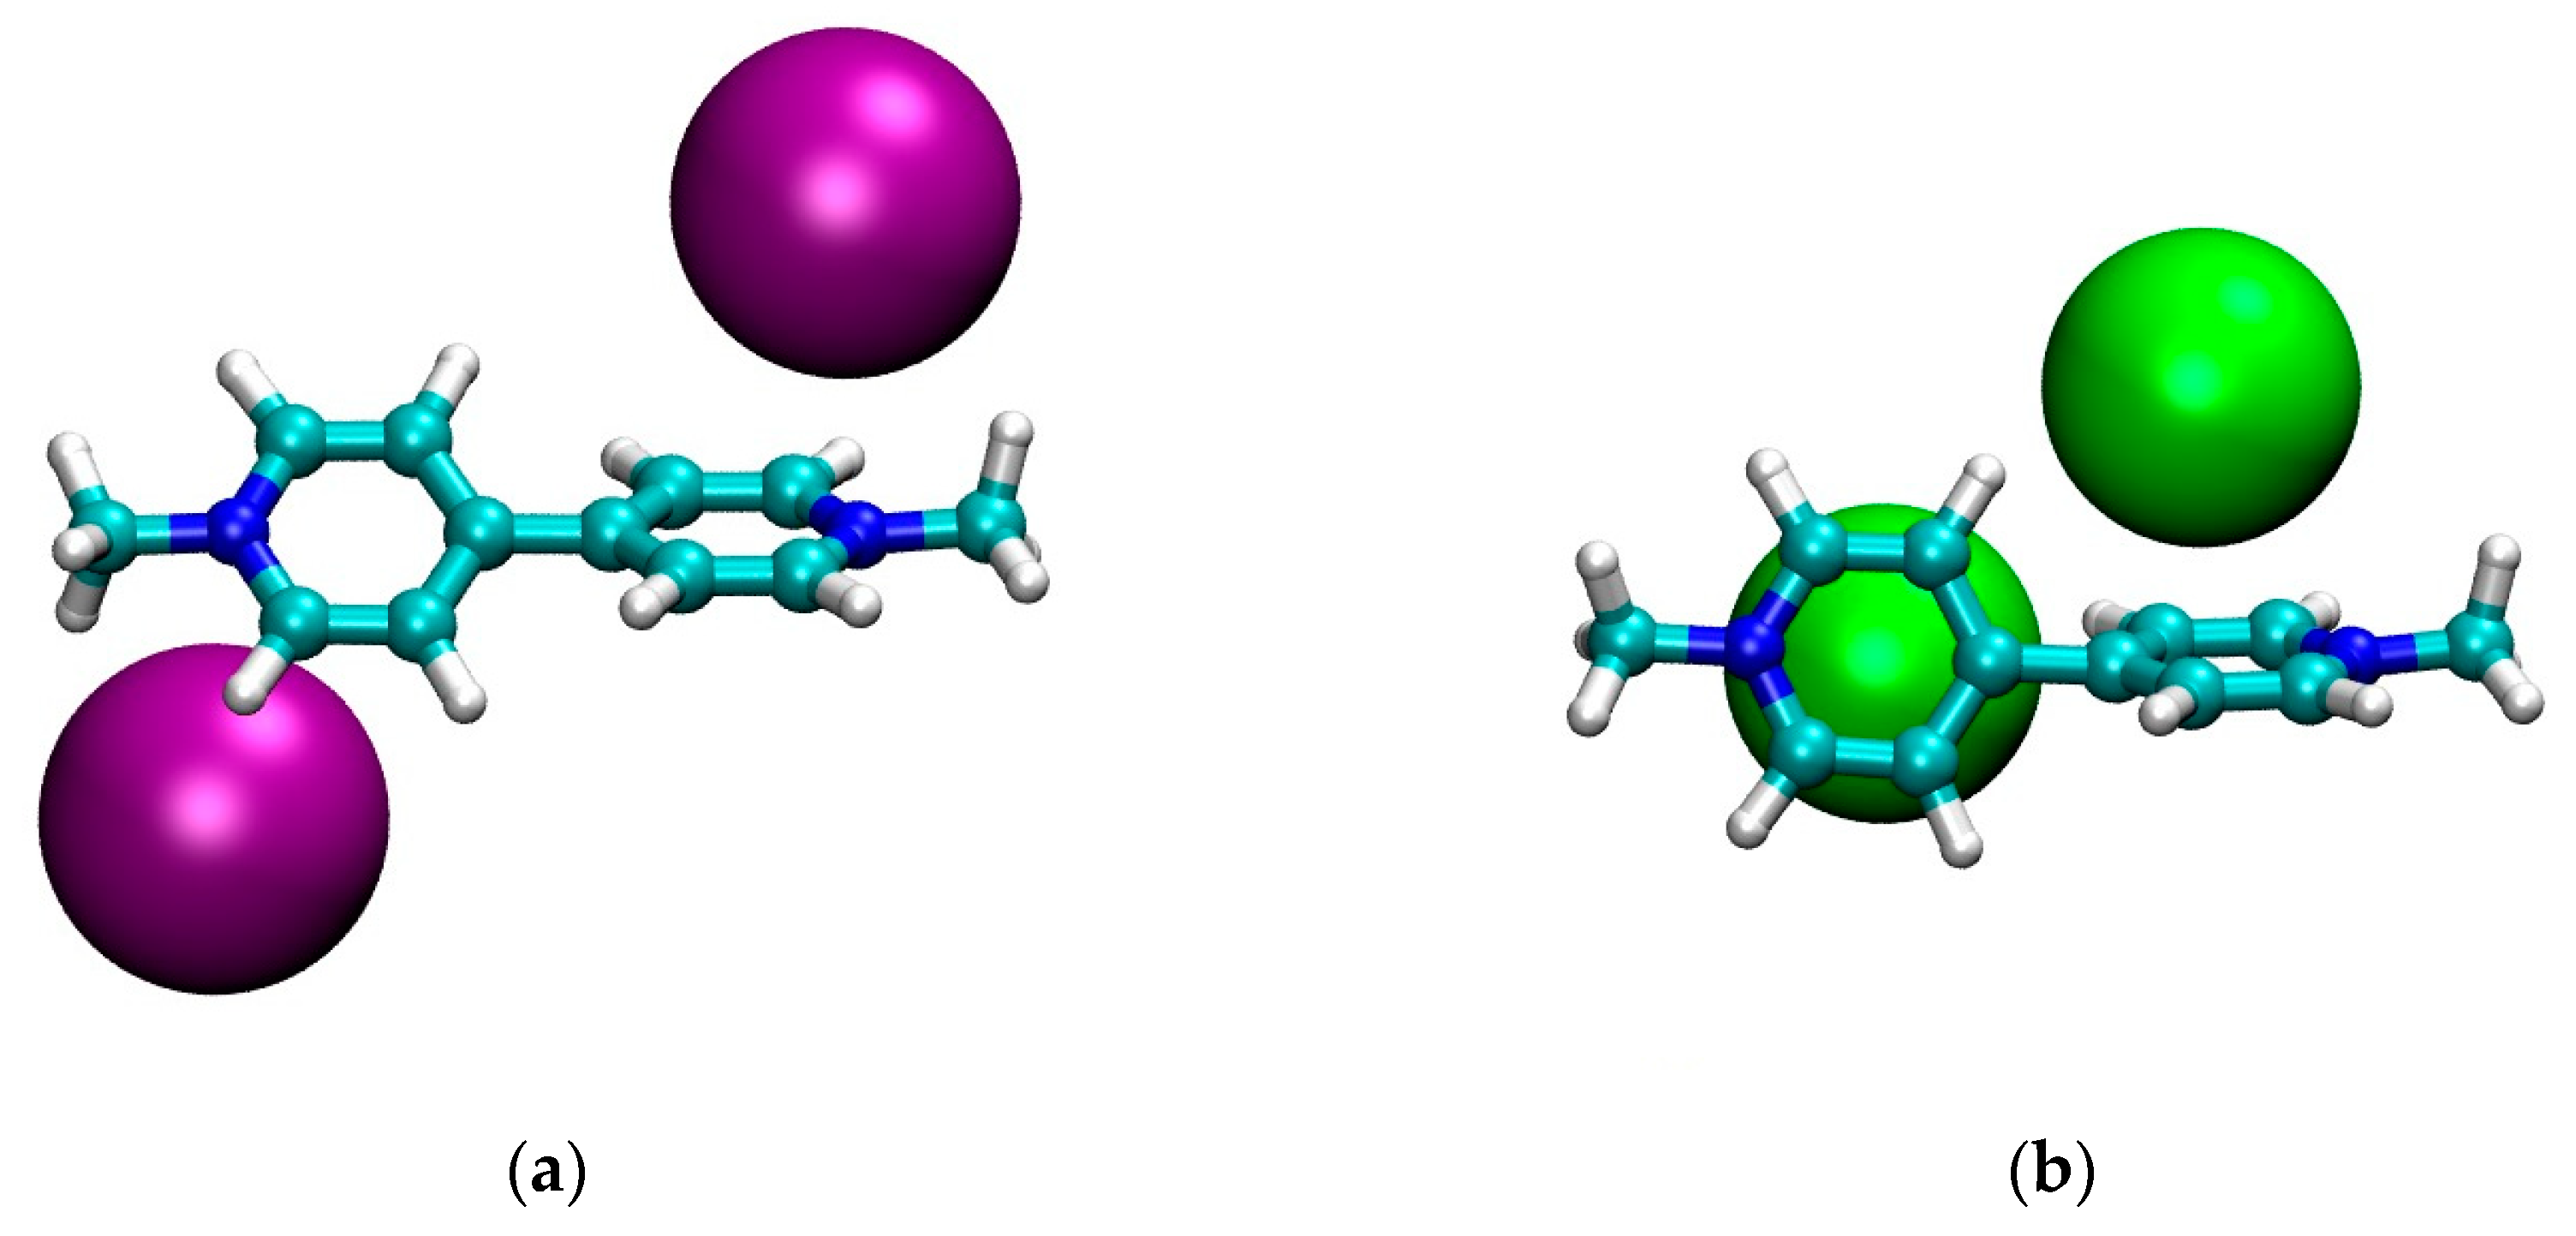
Figure 1. Optimized geometries in CH2Cl2 of: (a) MVI2; (b) MVBr2; (c) MTMVI2; (d) MV(PF6)2. Graphics produced with VMD [35].
Applsci 10 08108 g001aApplsci 10 08108 g001b
Figure 2. Geometrical parameters of the energy minimized structures vs. the dielectric constants of the solvent (vacuum, n-hexane, dichloromethane, acetone). (a) Average distance between each pyridinium nitrogen and the closest anion’s center of mass and (b) dihedral angle between the two pyridinium rings. (black circles): MV(PF6)2; (red squares): MVBr2; (green triangles): MTMVI2; (blue rhombi): MVI2.
Applsci 10 08108 g002
Figure 3. Correlation between calculated (λcalc) and experimental (λexpt) maximum wavelength absorption of the most red-shifted band of the model systems corresponding to the experimental values of Table 1 and Table 3 at three different levels of theory, TD-DFT(PCM)/6-31+G(d,p). See Table 3 for complete data. Solvent reaction field is included in the TD-DFT calculation (either CH2Cl2 or acetone).
Applsci 10 08108 g003
Figure 4. (a,d,g,j): Simulated absorption spectra with the underlying vertical transitions: (b,e,h,k): HOMOs and (c,f,i,l): LUMOs orbitals involved in the CT band of the four systems investigated in dichloromethane.
Applsci 10 08108 g004aApplsci 10 08108 g004b
Figure 5. Energies (a.u.) of the HOMOs (lower energies) and LUMOs (higher energies) orbitals of the four systems investigated in dichloromethane.
Applsci 10 08108 g005
Table 1. Experimental maximum absorption wavelength, λmax in nm, of the lowest-energy band for the compounds in solution. Concentration was in the range 2–5 × 10⁻² M.
Compoundλmax (nm) Lowest Energy BandRef.
[OV][PF6] in CH2Cl2265[20]
[OV]Br2 in CH2Cl2388[9]
[DTMV]I2 in CH2Cl2466[10]
[OV]I2 in acetone482[9]
[OV]I2 in CH2Cl2506[9]
OV = octylviologen, 1,1′-dioctyl-4,4′-bipyridinium; DTMV = decyltetramethylviologen, 1,1′-didecyl-2,2′,6,6′-tetramethyl-1,1′-bipyridinium.
Table 2. Some relevant geometrical parameters of the systems investigated.
R(X-N)/Åφ (C-C-C-C)/°
Vacuumn-HexaneCH2Cl2AcetoneVacuumn-HexaneCH2Cl2Acetone
MVI23.523.643.783.7631.737.037.539.5
MVBr23.193.453.753.8342.364.871.478.7
MV(PF6)23.973.964.044.0653.945.442.842.9
MTMVI23.473.523.623.6546.645.340.838.0
Table 3. Experimental (see Table 1) and calculated λmax data (nm) and statistical parameters of the linear fit y = a·x + b. MAE is the mean absolute error; R2 the correlation coefficient. In the last two columns we report the data of the absorption maxima and statistical parameters in eV.
6-31+G(d,p)aug-cc-pVTZ 6-31+G(d,p)
ExptPBE0M06-2XωB97-XDCAM-B3LYPLC-ωHPBECAM-B3LYPExpt (eV)M06-2X (eV)
2652542392402422302444.685.19
3884553523423492793493.203.52
4665804393844073074142.662.82
4825824363794063084122.572.84
5066184654044323274402.452.67
a1.52360.94290.65930.77610.38370.8032 1.136
b−144.23−11.14671.97740.161128.5333.349 −0.126
R20.99510.99480.97730.99270.99100.9946 0.9982
MAE80.835.271.654.2131.249.6 0.30
Table 4. Direct and indirect solvent effects on the absorption maxima, λmax, of the CT band of viologen iodide.
SolventDirect Effect 1max)Indirect Effect 2max)
vacuum890455
n-hexane683463
CH2Cl2465465
Acetone436466
1 Fixed geometry obtained optimizing the structure with CH2Cl2 as a solvent, TD-DFT calculation in vacuum and with the three solvents. 2 Fixed TD-DFT calculation using CH2Cl2 as a solvent, geometries obtained after optimization in vacuum and with the three solvents.
Publisher’s Note: MDPI stays neutral with regard to jurisdictional claims in published maps and institutional affiliations.