Article

Monitoring Microarthropods Assemblages along a pH Gradient in a Forest Soil over a 60 Years’ Time Period

Department of Animal Ecology and Physiology, Institute of Water and Wetland Research, Radboud University Nijmegen, Heyendaalseweg 135, 6525 AJ Nijmegen, The Netherlands
*
Author to whom correspondence should be addressed.
Appl. Sci. 2020, 10(22), 8202; https://doi.org/10.3390/app10228202
Submission received: 30 October 2020 / Revised: 15 November 2020 / Accepted: 17 November 2020 / Published: 19 November 2020
(This article belongs to the Special Issue Forest Soil Monitoring)

Abstract

:
In 1959, a small forest lot has been investigated thoroughly by the former Dutch Institute of Applied Biological Research in Nature (ITBON). The site was selected because of the steep gradients found in soil pH and moisture content. We focus here on the pH gradient from 6.7 to 3.2 (pH-KCl) in 1959 over a distance of 20 m (five plots). The decades thereafter N deposition from industry, traffic and especially surrounding agriculture caused an acidification of soils. The highest N deposition values (up to 90 kg N ha−1 a−1) were recorded in the late 1980s, after which N deposition decreased to more moderate, but still elevated levels till now (35 kg N ha−1 a−1). The site was sampled again at the very precise gradient plots in 1987 and 2019. We present our findings on soil microarthropods on this small-scale pH gradient over time and discuss especially the problems we faced with this long-term monitoring taking into account exact sampling, constancy in mode of extraction, constancy in slide preparation, and identification and how to deal with changes in systematics as even a number of species were described new to science meanwhile.

1. Introduction

Acidification is a natural process initiated by organic remnants from incomplete decomposition of lignin and hemicellulose compounds resulting in fulvo and humic acids that leach downward in soil and bind to iron and aluminum [1,2]. Soil acidity is then the result of both input of these acid components and the buffer capacity of the parent material. The buffer capacity is determined on the short run by the percentage of base saturation [2] and the amount of pedochemical weatherable minerals in soil on the longer run [3]. Acidity or pH is an important factor in soil, which to a large extend determines the abundance and species composition of soil microarthropods [4]. At the onset of soil biology in the Netherlands, Dr. Joop van der Drift initiated an integrated study on various factors influencing soil life in a small forest of Hackfort, such as humidity and water regime [5], soil pH, and degradability of organic matter [6,7,8], as well as soil life itself [9,10]. The site remained an important study area for various decades thereafter [9,10,11,12,13,14].
In 1959, a gradient study has been executed in the Hackfort forest on the influence of pH on soil microarthropods, of which at the time only the oribatid mites have been identified to the species level. In 1987, when the Netherlands suffered from an enormous increase of atmospheric acid deposition up to more than 3000 mol ha−1, the gradient has been sampled again [15] and in 2019, when deposition levels decreased to an average of 2000 mol ha−1, another sampling of the gradient took place. The initial (1959) pH gradient was predominantly set by the amount of weatherable clay minerals in the top soil. It is expected that acidification will occur especially in the lower pH trajectory (plots III–V) due to high atmospheric acid deposition levels tipping mid-1980s. Furthermore, it is expected that on the higher pH trajectory (plots I–III), a resilience effect of pH may occur in 2019, as acid deposition decreased again, resulting in values comparable to 1959.
In this paper, we will focus on the relation between soil pH and soil microarthropods on a time scale of 60 years. As soil microarthropods in a stable forest soil do not vary a lot between years [16], long-term shifts might be detected by these larger intervals. The extended period of the dataset, however, creates additional issues. In shorter time series, a single researcher samples the sites always following the same precise protocol (see for some other time series [17,18,19]). In this case, we had to deal with sampling procedures partly done by others. We can distinguish five crucial factors that must be kept constant for comparable results over the years of long-term time series: (1) exact sampling area, (2) exact sampling procedure (size and depth, including litter layer), (3) extraction procedure, (4) slide preparation, and (5) identification (taking into account taxonomic and systematic changes over the years). We will show, for some of these steps, the magnitude of variation, even with important related deviations in the final results.

2. Material and Methods

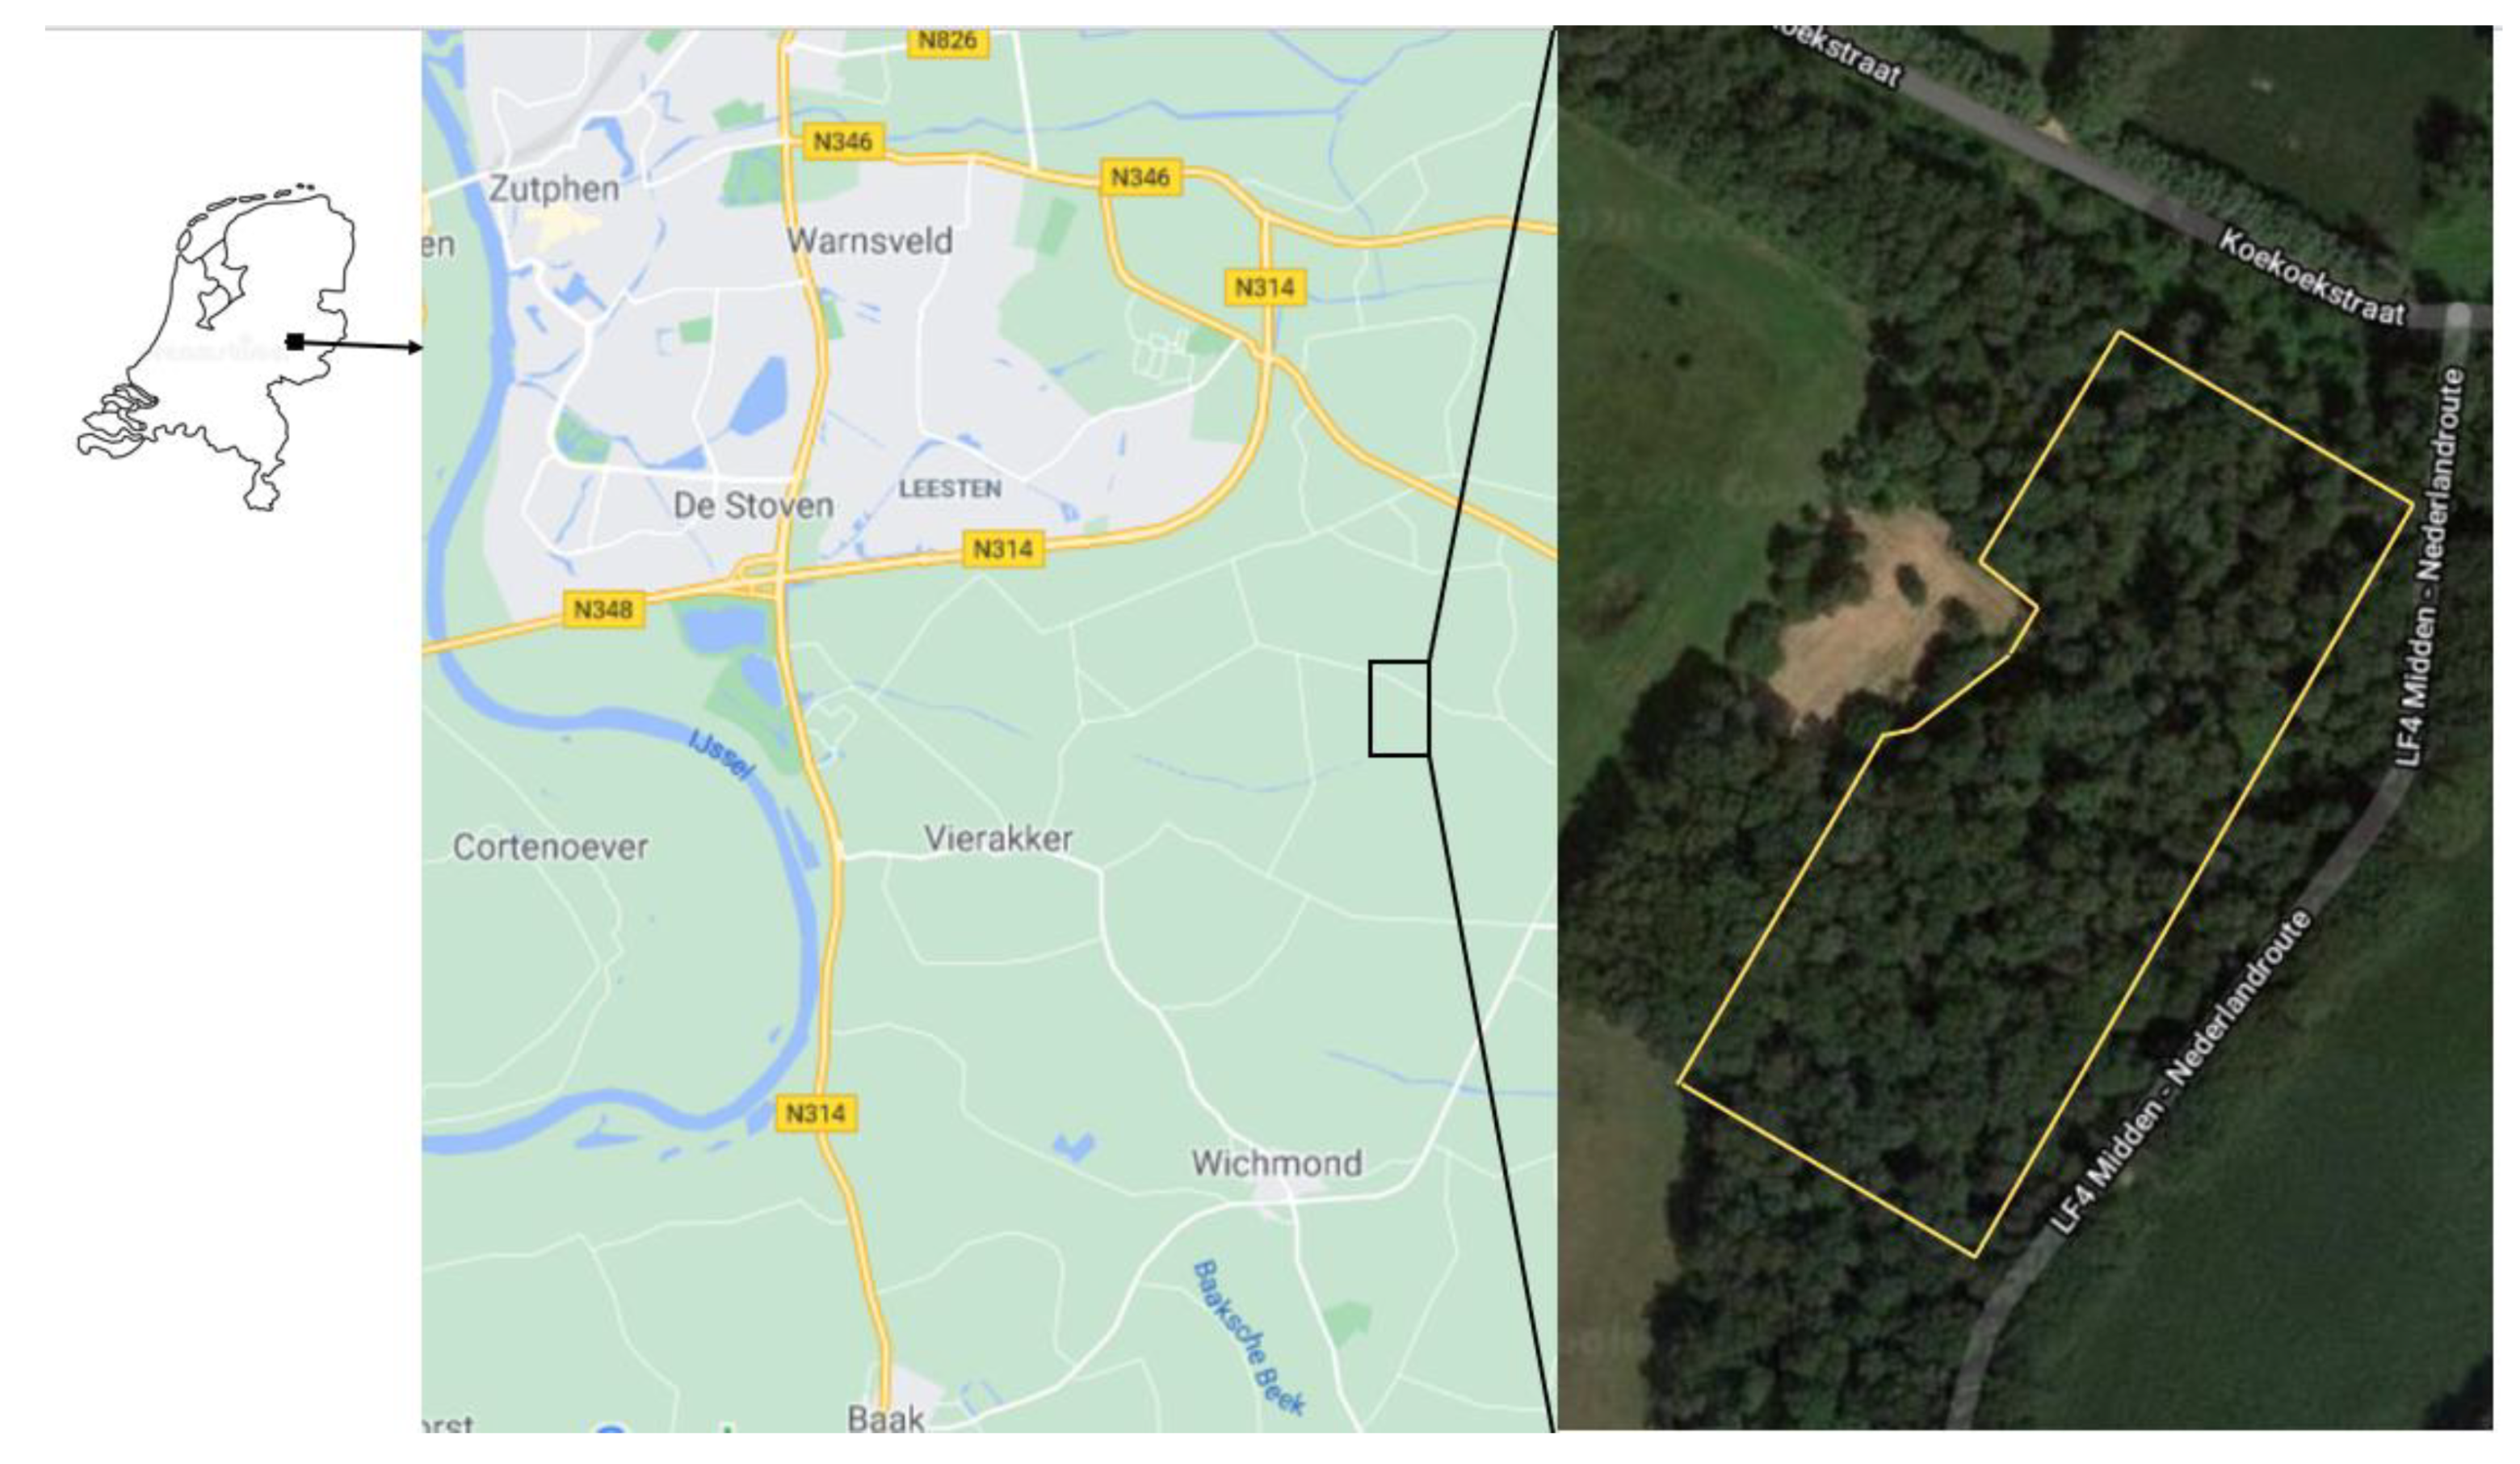
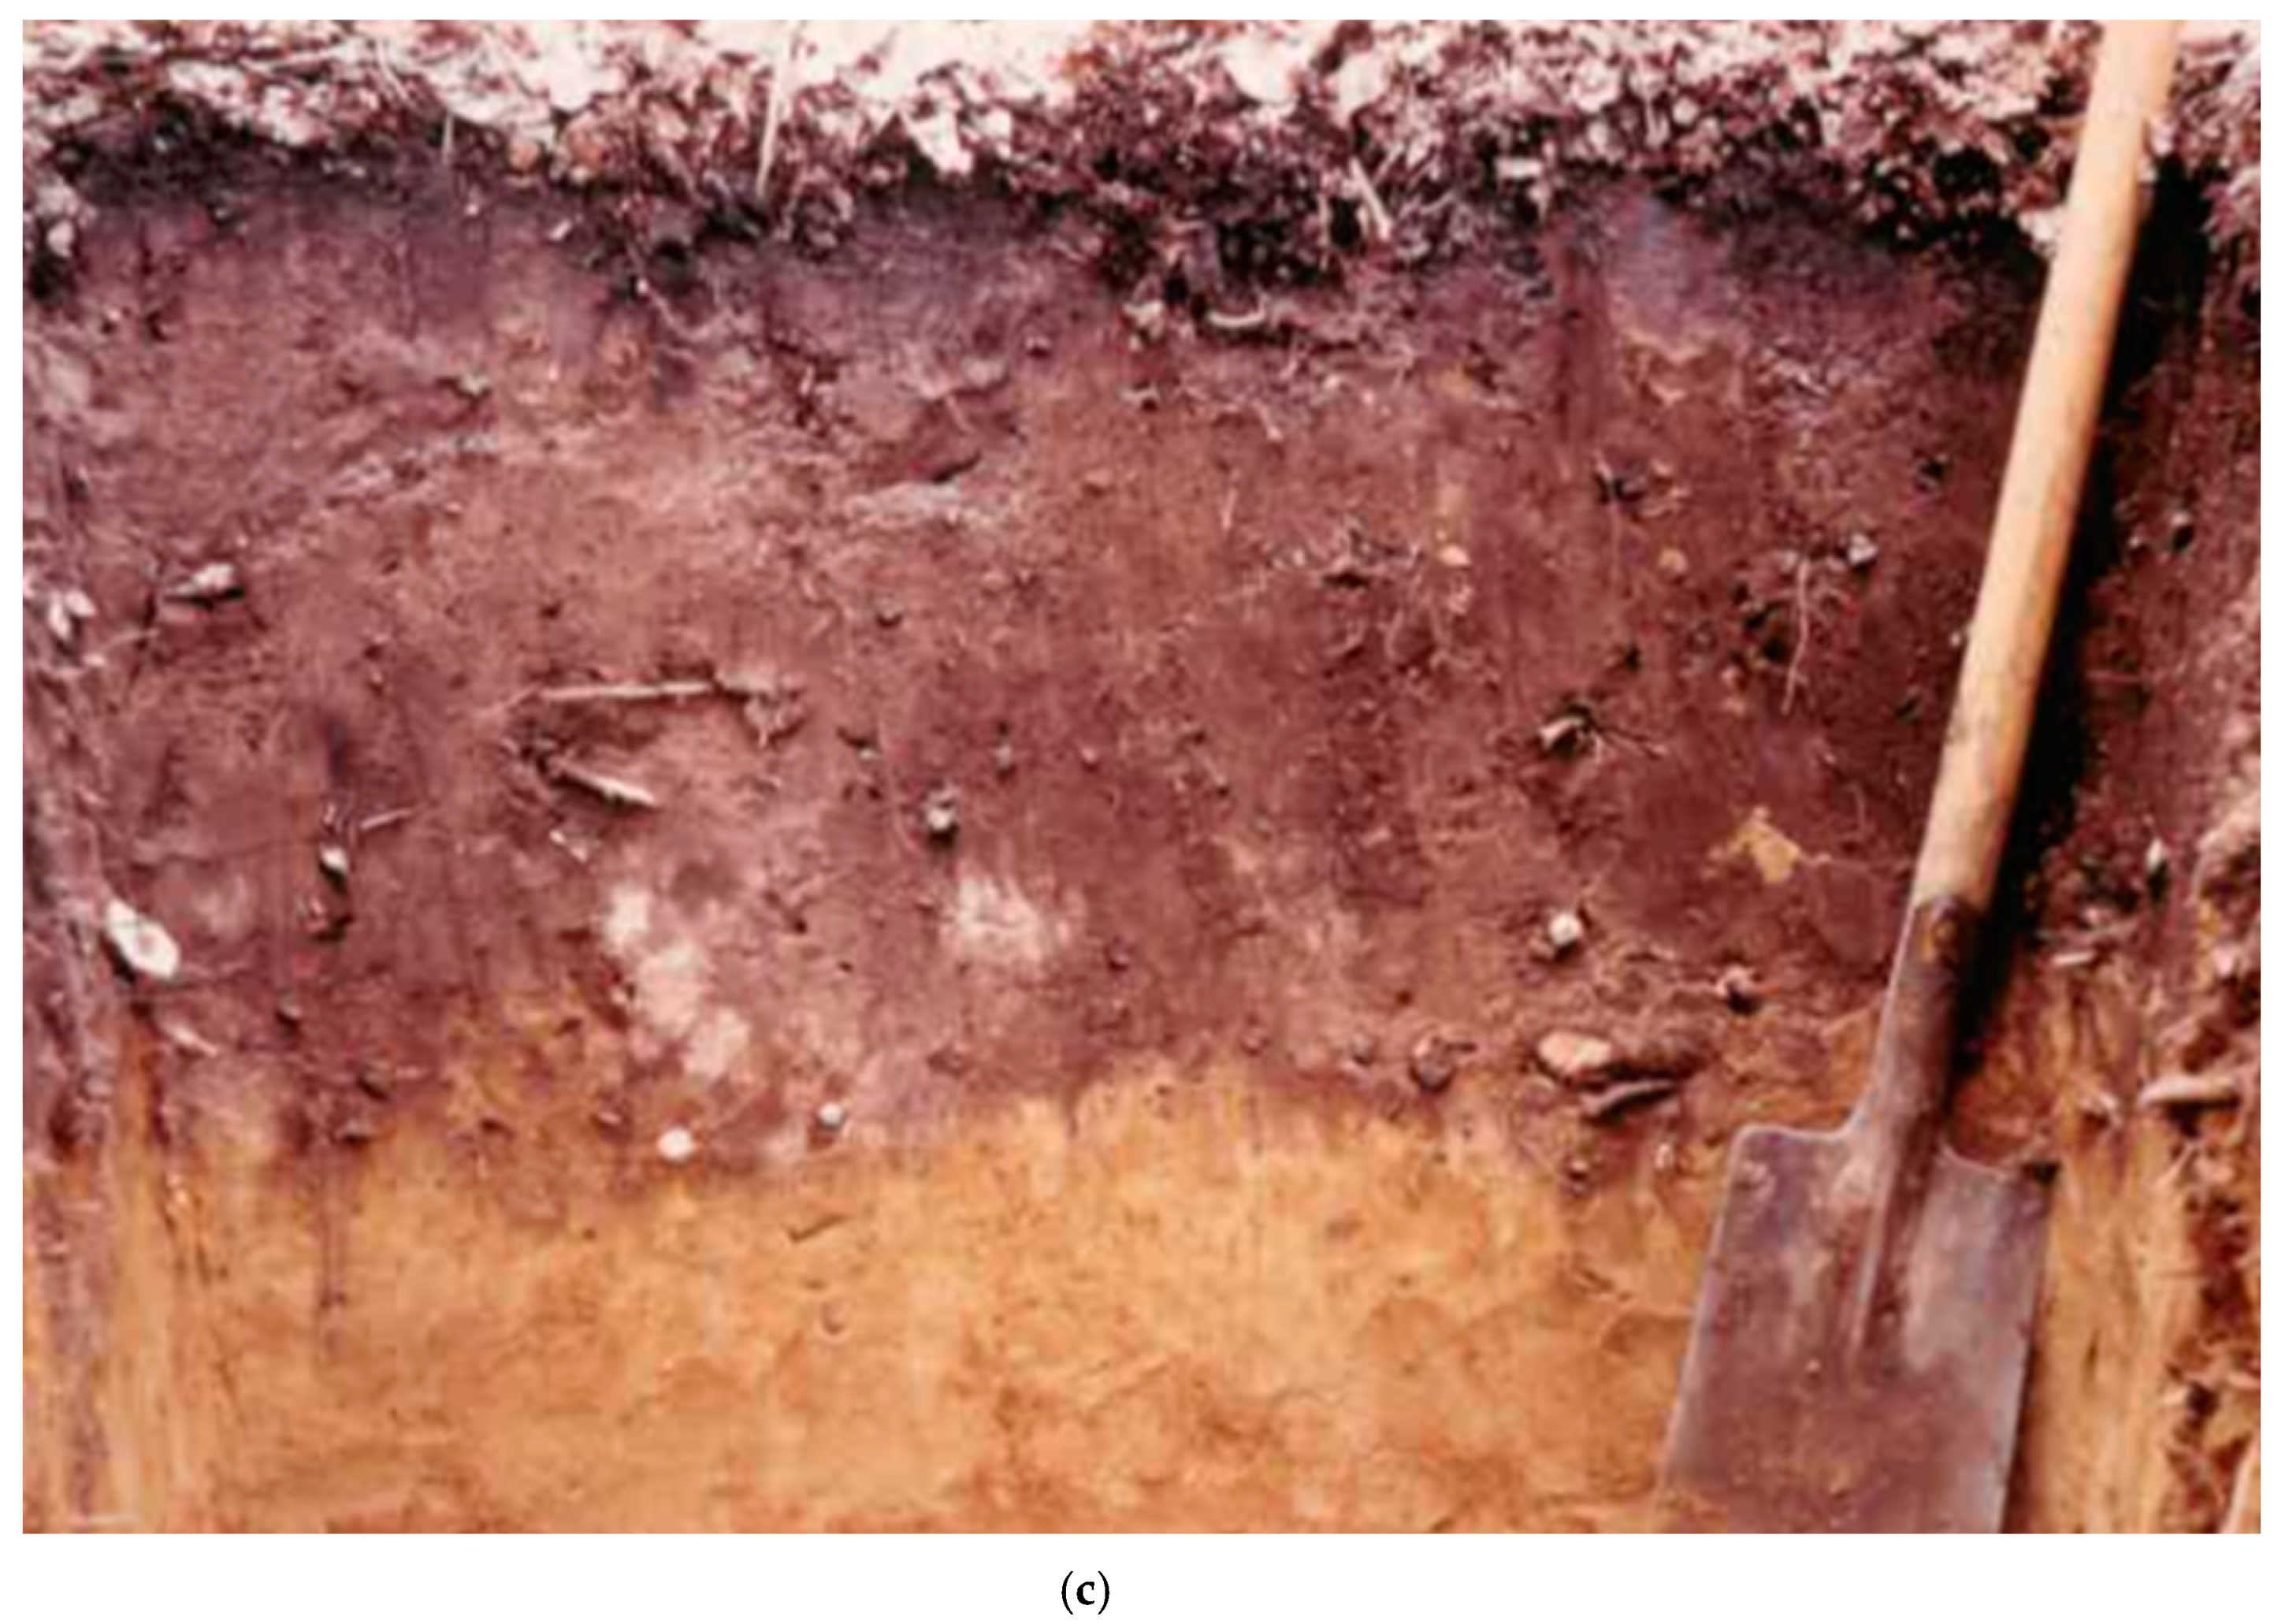
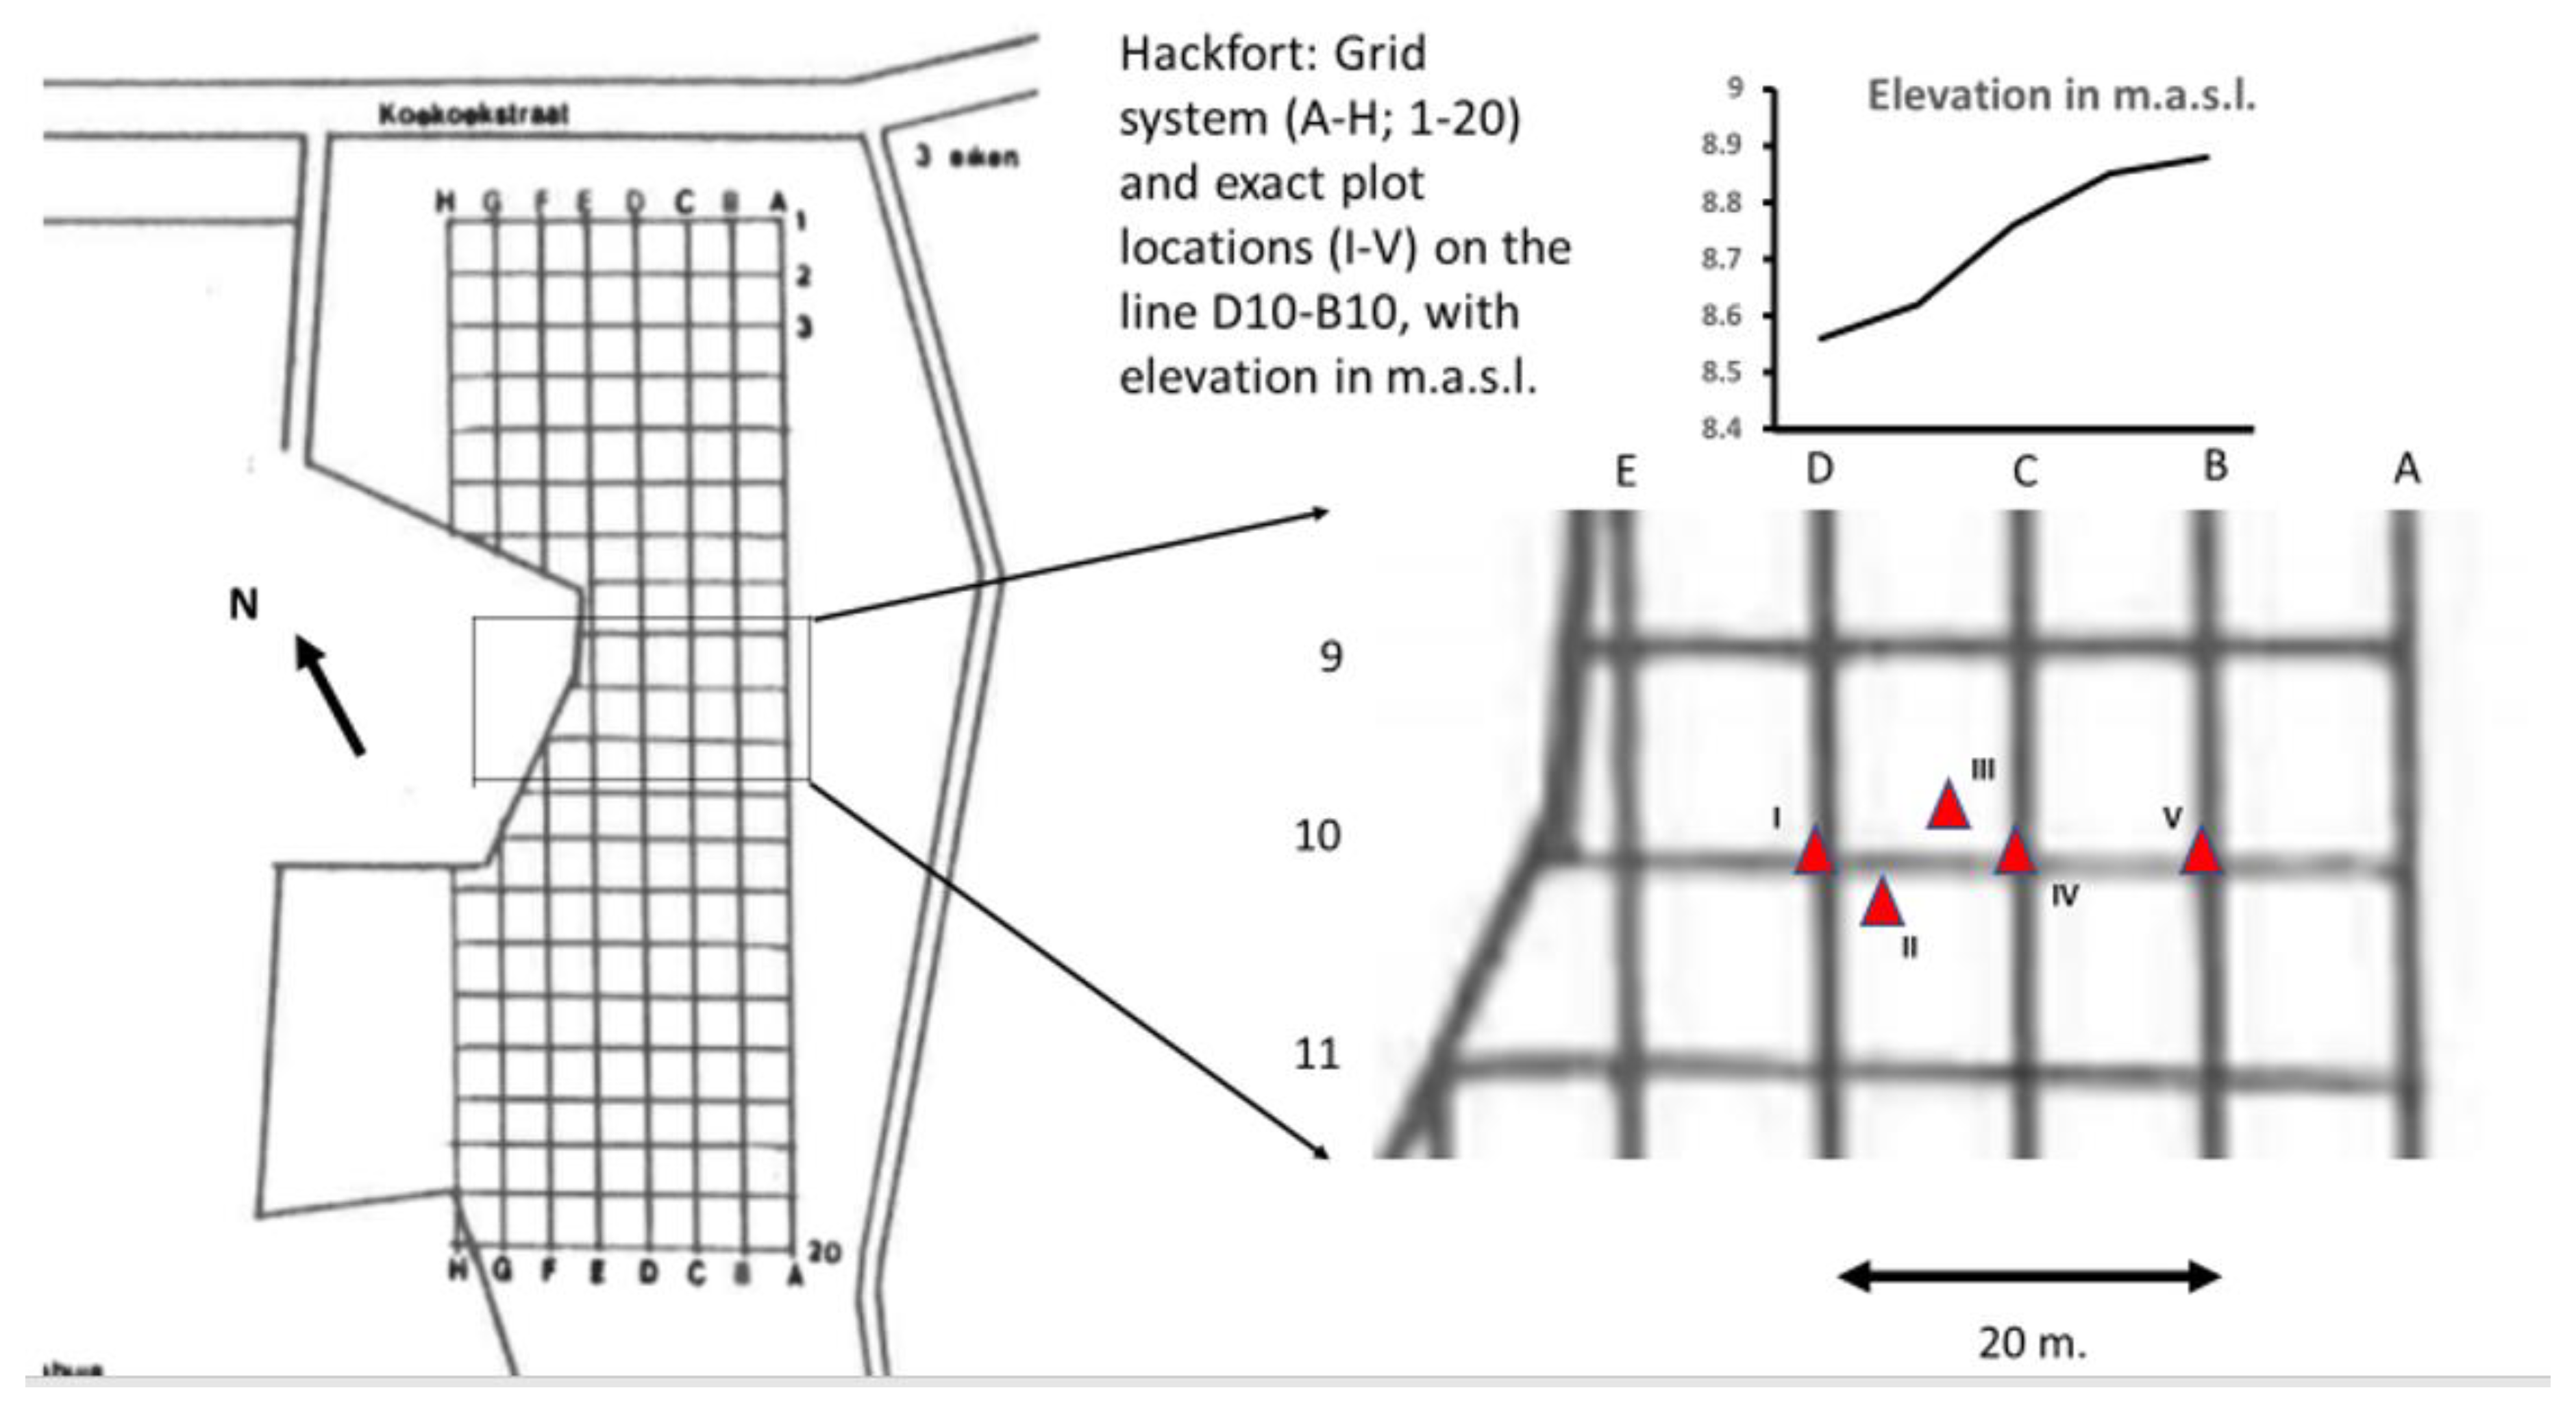
2.1. Site Description

Hackfort is an oak coppice grove in the East-Southeast of the city of Zutphen in the province of Gelderland, the Netherlands, 52°06′09.7″ N, 6°15′56.0″ E (see Figure 1). The experimental area is about 1.5 ha and is divided in a 10 m × 10 m grid. Vegetation is dominated by common oak (Quercus robur), mixed with birch (Betula pendula), and had in 1959, an understory of wood sage plugs (Teucrium scorodonia), wood anemone (Anemone nemorosa), bracken (Pteridium aquilinum), and wavy-hair grass (Deschampsia flexuosa). In later years, the understory became more dominated by bramble species (Rubus fruticosus and R. idaeus) and common nettles (Urtica dioica) at the edges of the forest, due to increased N deposition from adjacent farmland. The forest is situated at the transition from western riverine deposits and eastern periglacial cover sands. The soil is a riverine deposit with a few elevation differences, making a number of gradients in clay and loam content, which results in many short-distance gradients in soil types, varying from typic haplaquolls with the largest loam contents, via psammaquentic haplorthods to humaqueptic spodic psammaquents, slightly elevated and low in loam contents. Figure 2 shows the profiles of these soil types. In the experimental site, an area was chosen in 1959 to study the microarthropod distribution over a relatively steep gradient on pH (pH-KCL from 6.7 at plot I to 3.2 at plot V) over a distance of 20 m and an elevation difference of 35 cm (see Figure 3). Litter type at plot I is typically mull, while towards plot V a slight litter accumulation is visible to a moder type. Due to a land consolidation project in the wider area, groundwater tables dropped ever since 1959 till mid-1980s. The grid system (Figure 3) is visible in the field with pickets bearing the coordinates of that point (e.g., D10). Pickets were placed in 1956 and most are still visible making a complete reconstruction of the grid possible in 1987 and 2019.

2.2. Microarthropod Sampling and pH Measurement

In 1959, samples were taken at three subsequent dates: 11 September, 9 October, and 30 October. Samples in 1987 were taken on one date, 9 October, just as on 30 October 2019. Samples were taken following a standard procedure, developed at the Institute for Applied Biological Research in Nature, Arnhem, the Netherlands (later merged into the Research Institute for Nature management, Institute for Forestry and Nature Research and Alterra resp., now known as Wageningen Environmental Research); this procedure has been published by Siepel and Van de Bund in 1988 [20]. Each mineral soil sample has 100 cc: a volume of 5 cm diameter and 5 cm depth plus litter on top. In 1959, two samples per date were taken on each plot, making a total of 6 samples (only pooled data are available); in 1987 and in 2019, 4 and 5 samples were taken for each plot, respectively (data per sample available).
Soil cores were put on a Tullgren funnel for 1 week, during which temperature was increased from 35 to 45 °C, and then, microarthropods were collected in 70% alcohol and later put into 20% lactic acid for clarification and identification [20]. The Tullgren funnel used for extraction [21] has been used ever since 1936 and efficiency has not changed as the tool and protocol was the same all over the years.
Identification was done to the species level as much as possible using at present the keys for Oribatida [22], for Gamasina [23], for Uropodina [24], and for Collembola [25]. Material from the extractions of 1959 and 1987 was re-examined as far as possible to check the correct species identification. In the 1959 and 1987 samples, only oribatid mites were identified to the species level, whereas in 1959, all species of Quadroppiidae, Oppiidae, and Suctobelbidae were pooled. In 2019, all microarthropods were identified to the species level. Sorting and identification of the 1959 microarthropods was carried out by an experienced acarologist (J.G. de Gunst), in 1987, this was done by a student (C. Arnold) and completed and checked by the second author. For the 2019 samples, we decided to demonstrate the potential difference in picking out the microarthropods from the extraction fluid into the slides for identification as part of the experiment: the first author made a first series of slides including all distinguished animals (dataset 2019 a), while the second author made an extra set of slides with the animals missed by the first (dataset 2019 b). The first author did know since the beginning that the second author would check all samples after her sorting session. In this way, we intended to demonstrate the potential difference in this crucial part of the procedure by a starting and an experienced professional. In the analysis, we compare dataset (2019 a) with (2019 a + b), in order to highlight the difference between a starting and an experienced acarologist. Nomenclature adopted was updated according to current standards, following, e.g., the checklists for Oribatida [26], for Astigmatina [27], and for Mesostigmata [28]. Values of pH-KCl were measured in the core material after the extraction of the microarthropods, both in 1959, 1987, and 2019.

2.3. Statistical Analysis

Data on microarthropods and pH collected in 1959, 1987, and 2019 were all analyzed across the five plots. We started the statistical analysis with the most extensive dataset (2019 a + b) and calculated for every identified species (having a total of >25 individuals, equaling the number of samples) the correlation coefficient in R. In the case of significant p-values (<0.05), we grouped the species distinguishing those having a positive correlation with pH (preference for high pH values) from those with a negative correlation. For these species, we checked the abundance and distribution in the 1987 and 1959 datasets over the plots and compared these with the results of 2019 study. The latter analysis was done for oribatids only as these were the only microarthropods identified to the species level in the older datasets. Furthermore, we compared the differences of datasets (2019 a) and (2019 a + b), to assess the difference between a starting and an experienced acarologist both in terms of totals, as well as in terms of species composition (in order to test the hypothesis that not every species is missed in equal proportions). In addition, we also test the significance of pH differences during the years and the same to specimens’ abundances in different years.

3. Results

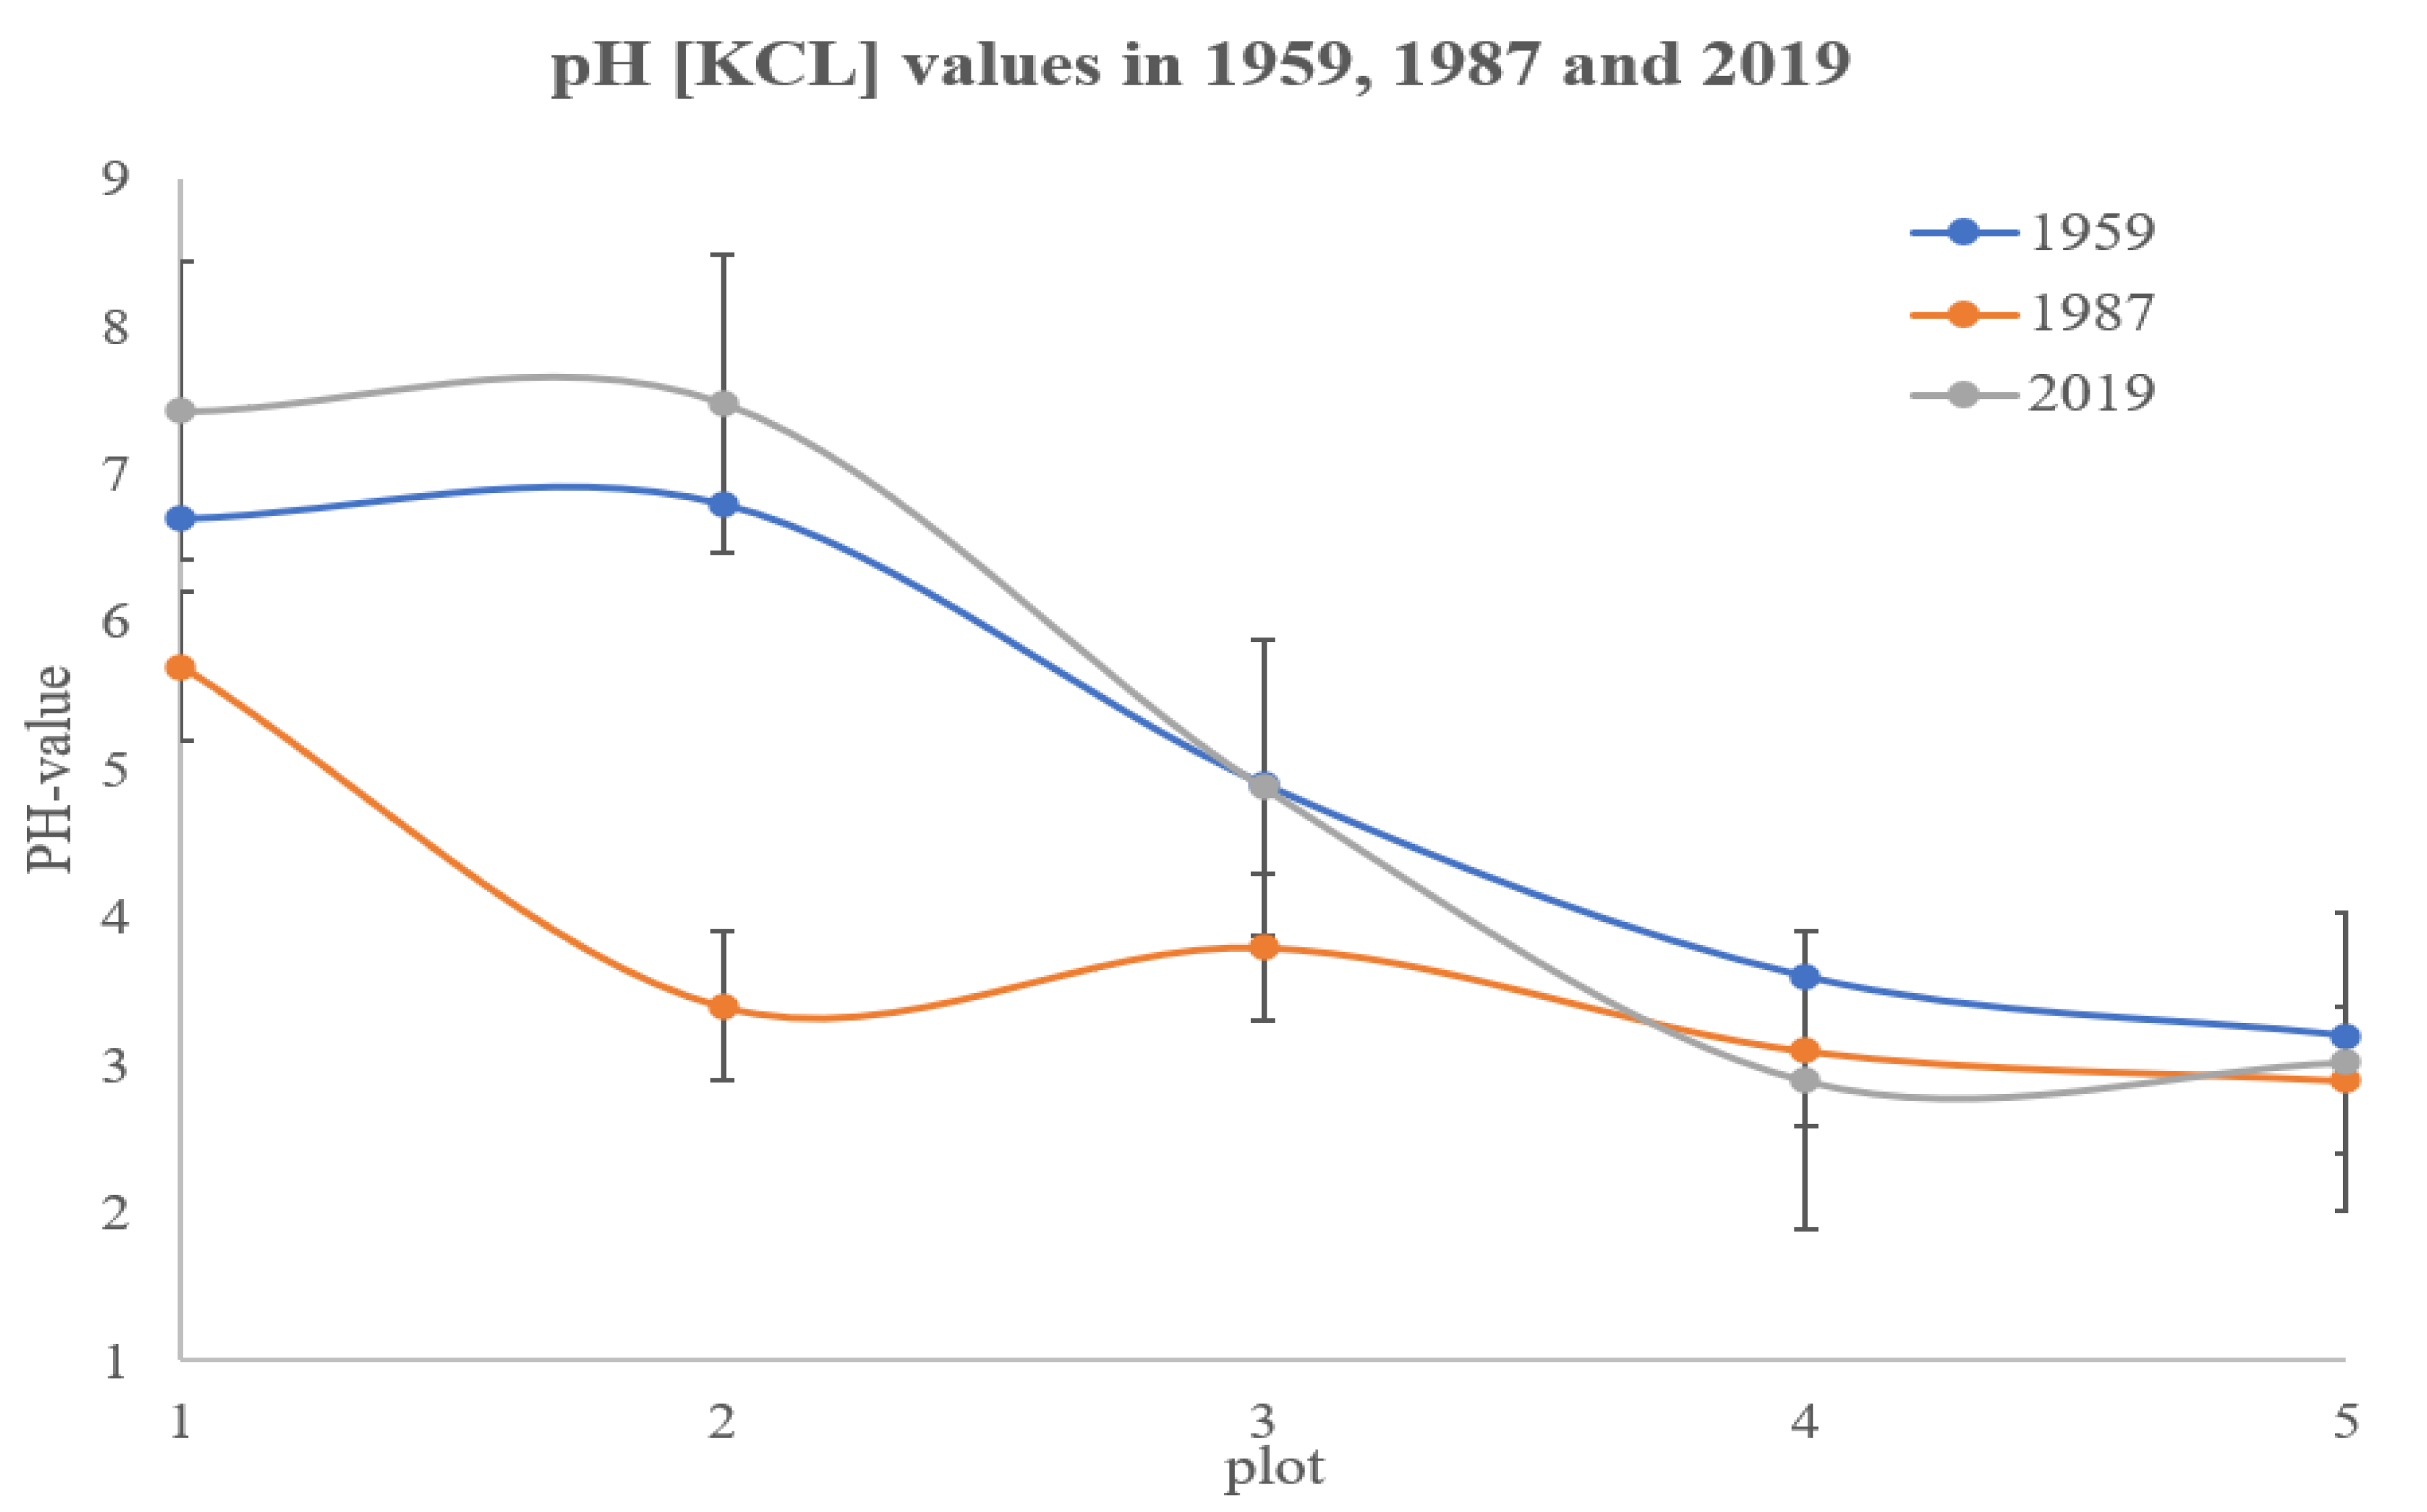
3.1. pH Values Variation During 60 Years Over the Gradient

Average pH values were in the range of 2.9–7.5 (Figure 4) over the years. The pH (KCl) gradient in 1959 started with 6.7–6.8 at plots I and II and steeply decreased to 3.2 at plot V over a distance of 20 m. In 1987, pH was lower over the whole of the gradient, however, the differences were largest in the middle section of the gradient (plot II and III showed a pH decrease in 3.4 and 1.1 units, respectively), whereas the value of the already acid plot V decreased only 0.3 units. In 2019, the previous trend was reversed, i.e., plots I and II even showed an increased pH value (7.4–7.5), plot III equaled the 1959 pH value, and the acid part (plots IV and V) remained low (2.9–3.0).

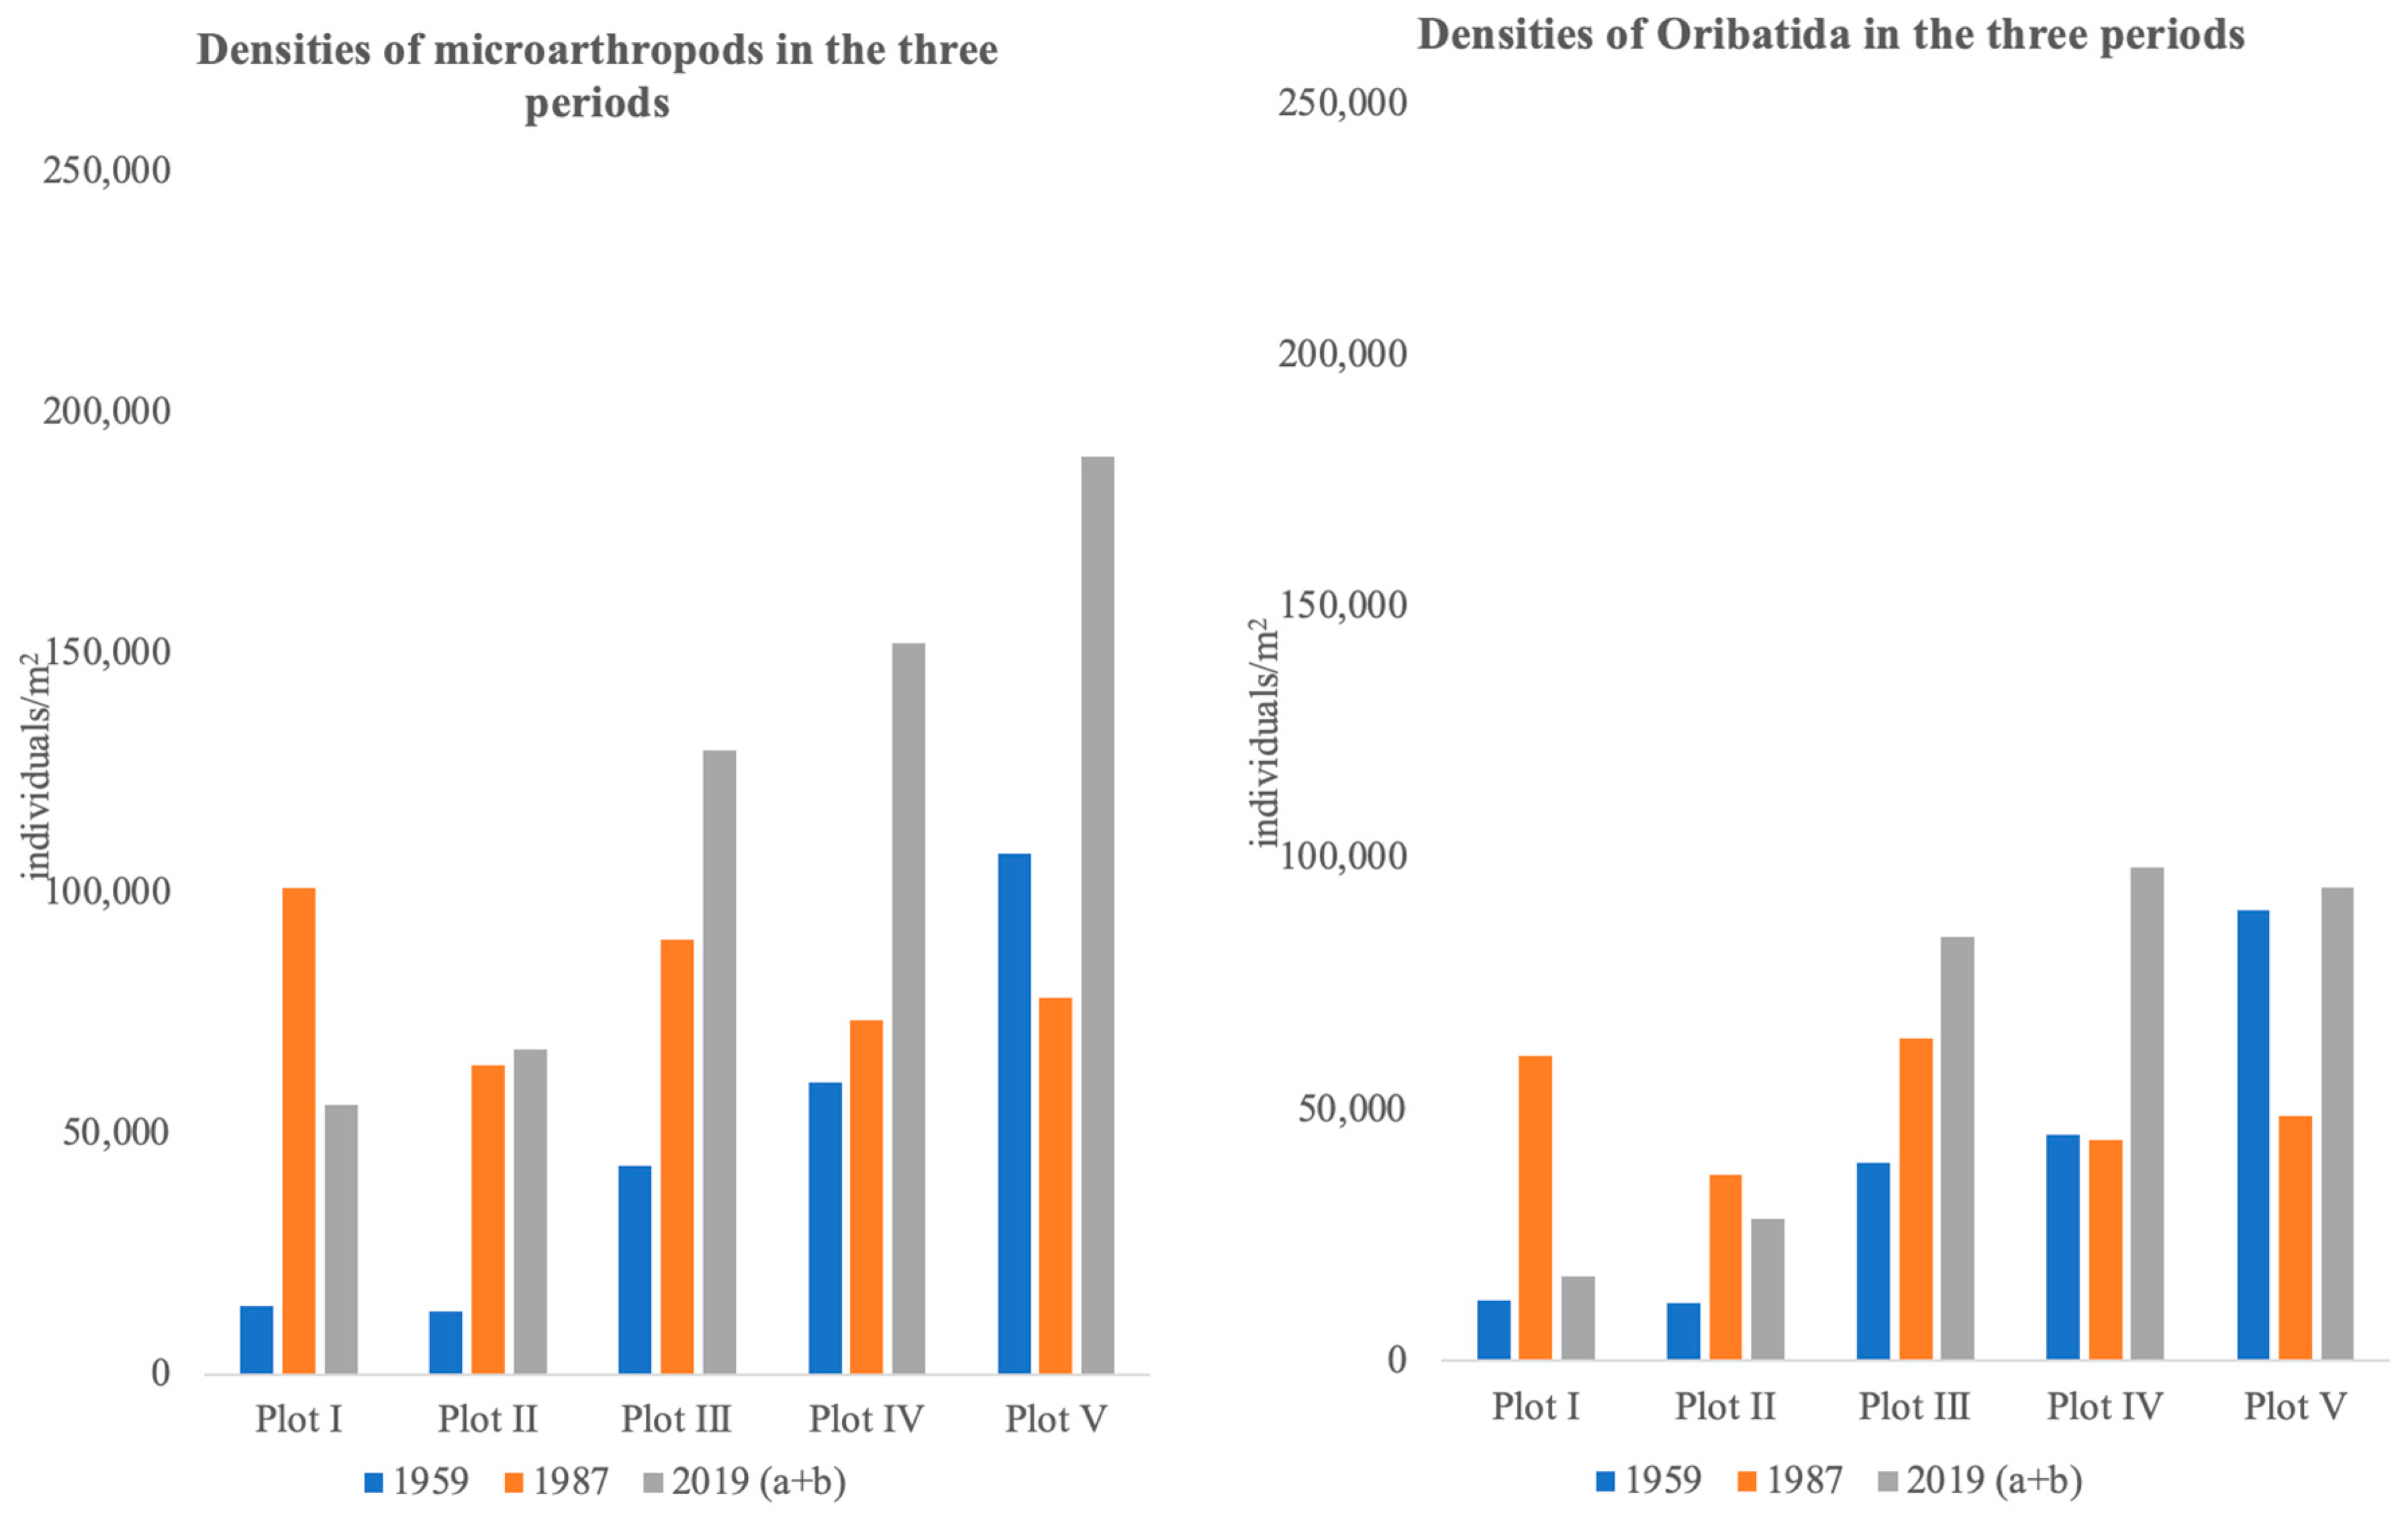
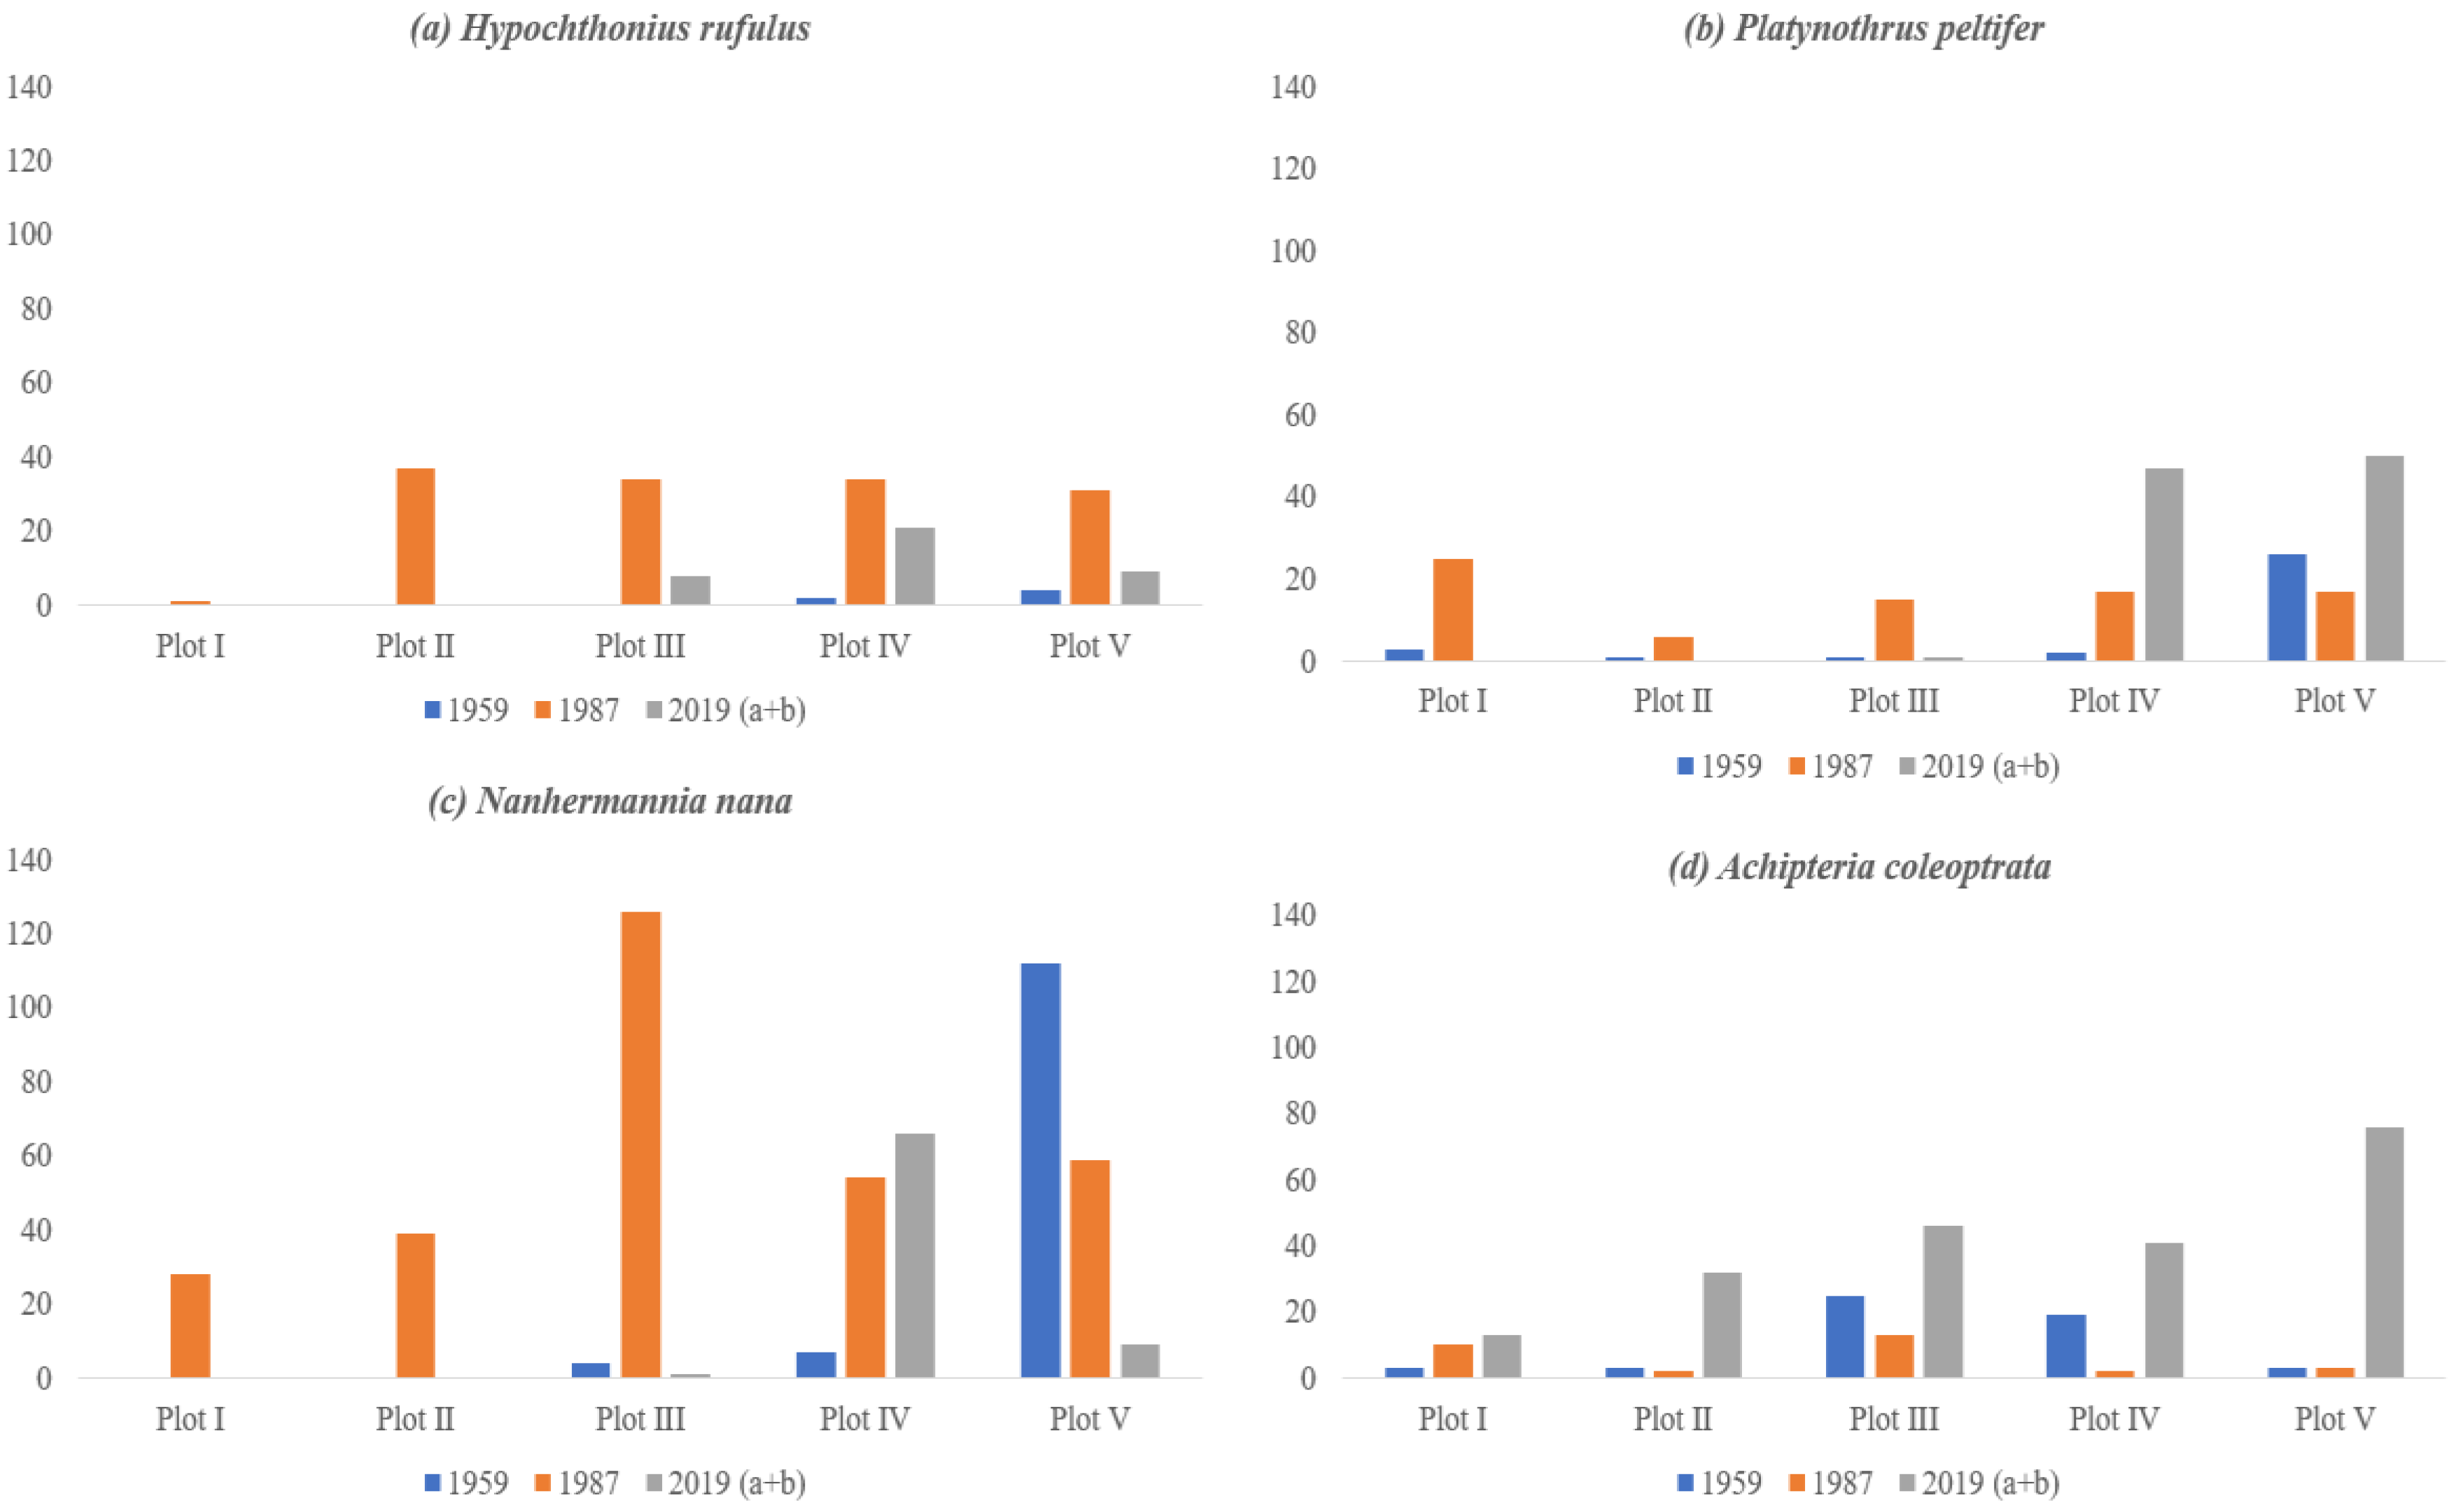
3.2. Abundance and Distribution of Microarthropods

We recorded a total of 2396 individuals belonging to 48 taxa in 1959, 4079 belonging to 43 taxa in 1987, 2841 belonging to 122 taxa in 2019 (a) and 5963 belonging to 133 taxa in 2019 (a + b). Table 1 gives the numbers of the different groups found during the years 1959–2019 per sample. Acari and Collembola were the most abundant groups among those sampled. Total numbers were substantially lower in 1959 compared to 1987 and 2019 (a + b), especially for Mesostigmata and Prostigmata. In addition, the 2019 (a) numbers were substantially lower than 2019 (a + b). The 2019 (a) dataset had 10 species less than 2019 (a + b), these species were either rare (Adoristes ovatus, Berniniella bicarinata, Chamobates cuspidatus, and Paragamasus lapponicus) or inconspicuous (Liochthonius alpestris, Speleorchestes pratensis, Villersia sp., Raphignatha sp., Pygmephorus sp., and Imparipes hystrinicus). Differences in numbers were largely explained by large differences in small and inconspicuous species such as Microppia minus (105 in (a) versus 782 in (a + b)). Numbers of Oribatida species hardly differed taking into account that 13 species of Oppiidae and Suctobelbidae were not identified to the species level in 1959 and 1987. Figure 5 presents the densities of total microarthropods (Figure 5, left) and total Oribatida (Figure 5, right) over the plots for the three time periods. Both 1959 and 2019 (a + b) show increasing numbers of both total density and density of Oribatida with decreasing pH (increasing plot number), whereas no pattern was visible in the 1987 data. Densities in 2019 were higher than in 1959, both total, as well as relative to Oribatida only.

3.3. The Relation between pH and Soil Microarthropods

We correlated the 2019 soil microarthropod data (between 2019 a + b and 2019 a) and abundance of soil microarthropods 2019 (a + b) with pH. We can see a significant correlation between 2019 a + b and 2019 a, r = 0.917, p = 0.028. Moreover, Table 2 gives the values for 6 species positively correlated with pH, i.e., have a preference for more neutral environments and for 17 species negatively correlated with pH, i.e., have a preference for more acid environments. There are two examples of species belonging to the same genus with opposite pH preferences: Hypochthonius luteus and H. rufulus (Oribatida) and Rhodacarus calcarulatus and R. coronatus (Mesostigmata).
Among species listed in Table 2, just four species showed a relationship with pH values, also considering the past samplings: Hypochthonius rufulus, Platynothrus peltifer, Nanhermannia nana, and Achipteria coleoptrata. All these species show a similar pattern (Figure 6): a clear preference for the more acid plots in 1959 (Achipteria coleoptrata, Figure 6d, is more intermediate), an increase of the range and numbers towards the lower plot numbers in 1987 (acidification of the area), and a retraction again to the higher plot numbers in 2019 (resilience of pH, compare Figure 5).
A comparison of datasets of 2019 (a) and 2019 (a + b) reveals that the complete set 2019 (a + b) has four more microarthropods (Nanorchestes arboriger, Nothrus anauniensis, Friesea mirabilis, and Pseudosinella alba) that are significantly positively correlated with pH and two significantly negatively correlated (Dissorhina ornata and Poecilophysis pseudoreflexa) (Table 2). On the other hand, one species turned out to lose its correlation in the completed dataset: Isotomiella minor appears to give a false positive result in set 2019 (a).

4. Discussion

4.1. The Relation between pH with Soil Microarthropods

The aim of this study was to monitor a pH gradient in a forest soil over a 60 years’ time period using the microarthropod community, initially oribatids only, but extended to all microarthropods later. The distribution and abundance of soil microarthropods are determined by a large number of factors. Among the abiotic factors, soil pH is of high importance [29]. Our results showed a significant negative trend of soil microarthropod communities in 1959 and 2019 with pH (see Supplementary S2), as 1959 and 2019 have indeed similar pH gradients, whereas the 1987 series showed a mixed pattern, maybe due to the decrease in pH values, that not all species could follow equally. Several authors have proven that the number of soil biota strongly depends on the state of acidification of the soils [30,31,32,33]. Soil acidification induces a mobilization of potentially toxic Al and heavy metals [34,35,36,37,38,39] and a decrease in base nutrients such as K, Ca, and Mg, which make some species not normally absorb water at a low pH [40,41]. That microarthropods may directly recognize the acidity of the pore water was suggested by Jaeger and Eisenbeis in 1984 [42]. Studies about pH preferences highlighted difference among species and habitats. Some species appear to prefer the lower pH range, such as Hypochthonius rufulus, shown by Van Straalen and Verhoef in 1997 [43], which in our data also showed a negative correlation with pH (preference for low pH). However, referring to Platynothrus peltifer, we found a preference for low pH, whereas Siepel in 1990 [21] found the species also in the less acidified habitats. Dunger and Voigtländer in 2004 [44] suggested that the most informative groups of microarthropods are oribatids and collembolans because of their high species diversity as well as their relatively well-developed taxonomy compared to other groups of mites. This study shows that soil microarthropod communities could be an interesting tool in order to monitor soil acidity (pH).
Although in acid forest soils, soil-fauna activity is strongly reduced, differences between species are striking. Oppiella nova, for instance, has been reported to be strongly reduced in abundance from older forest liming experiments [45], which makes sense as in our results, it is negatively correlated with pH, while some species show an opposite correlation. For example, liming in a Lodgepole pine forest gave increased abundance of the potworm Enchytronia parva and a corresponding tendency for Friesea mirabilis, while artificial acid rain in a spruce forest gave a nonsignificant decrease in the abundance of Parisotoma notabilis [46,47]. Our data evidenced a positive correlation of Friesea mirabilis with pH and a negative one for Paristoma notabilis, which corresponds to these findings. Isotomiella minor is, according to Gisin in 1943 [48], quite independent of soil pH, which indicate that this species is well represented in all soil types; in our data, we found the species also having no correlation with pH, although the incomplete dataset 2019 (a) gave a false correlation result.
One of the most interesting observations made in this study was the remarkable opposite relationship with pH of two couples of species belonging to the same genera, one among the oribatids Hypochthonius luteus and H. rufulus, where H. luteus filled the gap at the higher pH values. In 1959, nor in 1987, the latter species has been found in the gradient, although it was known from the area as could be confirmed from slides in the institutes collection. The other couple is among the Mesostigmata (Rhodacarus calcarulatus and R. coronatus). It is plausible to expect that these congeneric species have about the same food preferences and that their segregation is caused by abiotic preferences such as pH or humidity [49]. Thus the “realized pH niche” might be a combination of many factors.

4.2. Changes in the pH Gradient Over Time

Although at the beginning, this study was not drawn in order to follow changes in pH over time, the industrial and agricultural developments in the Netherlands over the past six decades resulted in a dramatic increase of sulfur and nitrogen deposition (e.g., Bobbink et al., 2010 [50]). The consequence of this increase is acidification of the less buffered soils with well-known effects on natural values; for an extensive overview on the effect on fauna see Nijssen et al. in 2017 [51]. The existing well-documented gradient gave an excellent opportunity to follow the soil pH changes over time. As soil acidity is set by both input from acidifying compounds and the buffer capacity and weatherability of soil components [2,3], a change of pH in a natural gradient from pH KCl 6.8 to 3.2 can be expected, as the lower part obviously has no cation buffer capacity left. As expected, we saw a significant decrease in pH in the gradient in 1987, the peak in N deposition in the Netherlands. After early 1990s, national measures to protect the environment resulted in a significant decrease in sulfur deposition and some decrease in nitrogen deposition [52]. As weathering of minerals is a more or less constant and slow process over time [53], the decrease in pH in the middle section of the gradient can be assigned to an acid deposition higher than could be compensated by weathering of minerals. The recovery afterwards (measurement of 2019) could then indicate that the present amount of minerals in soil is enough to compensate the current acid deposition, but only when weatherable minerals are left. The lower pH range shows no recovery, or even a further acidification, indicating the absence of weatherable minerals in that part. These results support the idea of combatting acidification effects with the use of rock dust, as the current measures of liming appear to have negative effects due to the excess of Ca left in soil [54]. It also indicates that natural recovery from acidification effects is possible when deposition is decreased, given that there is some loam or other weatherable minerals left in soil.

4.3. Methodological Aspects

We started this study with two goals: the study of a pH gradient in a period of increasing and decreasing acid deposition as reported above and review of methodological aspects concerning real long time series. We have not found time series, equally long, dealing with soil properties in relation to soil animals in literature as the one presented here. So, this series gives a nice opportunity to evaluate the needs and potential pitfalls for such a study. The frequency of measurements in this study is rather low, only three points in time: 1959, 1987, and 2019. It is, however, questionable whether a higher frequency would have added more results. It would have had a more disturbing effect on the gradient, as room to take undisturbed samples becomes limited rather soon on such a small-distance gradient. As we know from other shorter time series, which indicate a rather constant soil fauna [16], the necessity to increase the frequency is not present as well. Given the situation of a long series with a low frequency, other challenges appear: the time series transcends normal project periods and even researchers’ life times. A good description of the site, with exact coordinates of plots and samples, becomes evident. Our gradient has a total length of 20 m, resulting in interplot distances of 5 m. Thanks to the present labelled pickets, it was possible to reconstruct the entire grid and the exact location of the plots sampled in 1959 and 1987. Small deviations would have given large disturbances, as the change of the population area of, for instance, Hypochthonius rufulus (occupying almost the whole gradient, when that suffered from acidification in 1987 and retracting towards the acid part in 2019) would have been unnoticed or seen as spatial noise. Sampling itself has been subject to a constant institute’s protocol [20]; small variations therein would have led also to noise, now in a temporal way. In addition, the use of the same equipment for the extraction procedure could be kept constant in this study as differences in extraction method or equipment can give different results [55]. We used the Tullgren funnels of the institute that originate from 1936 and efficiency has not changed as the tool and procedure was the same all over the years. A next, very important step in the procedure is the preparation of the slides from the alcohol material the specimens were collected in. In this study, we treated this step as an experiment, where the first author, as part of her training, made the slides initially: dataset 2019 (a). A thorough re-examination of the rest material by the second author resulted in an extra set of slides making the dataset complete: 2019 (a + b). Dataset 2019 (a) had on average 50.8% of all specimens. Strikingly, this rather big deviation gave no differences in the analysis of the group totals, as data appeared rather robust here. As some inconspicuous species were not or hardly present in dataset 2019 (a) (for instance, 13.4% in Microppia minus and 2.5% in Nanorchestes arboriger and none in Speleorchestes pratensis), analysis at the species level did show discrepancies. Deviations of this kind are hard to discover in literature, although in some cases, the efficiency of this step in the procedure can be questioned. Finally, it proved to be useful to store at least some specimens from every species and sampling period for later examination. We could rectify a few identification mistakes in this way (one from 1959 and one from 1987). Moreover, species can be detected later. In our 2019 (a + b) dataset Quadroppia galaica occurs, a species that has been described in 1985, much later than the start of our time series. Last but not least, the necessity of proper checklists helps to translate older synonyms to current valid names.

Supplementary Materials

The following are available online at https://www.mdpi.com/2076-3417/10/22/8202/s1, Supplementary S1: Abundance and list of taxa discovered during sampling; Supplementary S2: The relation of pH and microarthropods.

Author Contributions

Conceptualization, Y.G. and H.S.; methodology, Y.G. and H.S.; formal analysis, Y.G. and H.S.; investigation, Y.G. and H.S.; writing—original draft preparation, Y.G. and H.S.; writing—review and editing, Y.G. and H.S.; supervision, H.S. All authors have read and agreed to the published version of the manuscript.

Funding

This research was funded by Yuxi GUO grant number CSC201906170222 and the APC was funded by Chinese Scholarship Council.

Acknowledgments

We thank Wim Dimmers (Wageningen Environmental Research) for his cooperation in helping us to find the older slides in the collection and for the use of the Tullgren funnels. Udo Hassefras (Natuurmonumenten) is acknowledged for the permission to take samples in the Hackfort forest. Annette A. Wiersinga kindly assisted with the reconstruction of the grid in the Hackfort forest.

Conflicts of Interest

The author declares no conflict of interest.

References

  1. Buol, S.W.; Southard, R.J.; Graham, R.C.; McDaniel, P.A. Soil Genesis and Classification, 2nd ed.; John Wiley & Sons: Hoboken, NJ, USA, 2011. [Google Scholar]
  2. Coleman, N.T.; Thomas, G.W. The basic chemistry of soil acidity. In Soil Acidity and Liming; American Society of Agronomy, Inc.: Madison, WI, USA, 1967; pp. 1–40. [Google Scholar]
  3. Jackson, M.L.; Sherman, G.D. Chemical Weathering of Minerals in Soils. Adv. Agron. 1953, 5, 219–318. [Google Scholar] [CrossRef]
  4. Hagvar, S. Effects of liming and artificial acid rain on Collembola and Protura in coniferous forest. Pedobiologia 1984, 27, 341–354. [Google Scholar]
  5. Minderman, G. Mull and mor (Müller-Hesselman) in relation to the soil water regime of a forest. Plant Soil 1960, 13, 1–27. [Google Scholar] [CrossRef]
  6. Went, J.C. Cellophane as a Medium to study the Cellulose Decomposition in Forest Soils. Acta Bot Neerl. 1959, 8, 490–491. [Google Scholar] [CrossRef]
  7. Went, J.C.; de Jong, F. Decomposition of Cellulose in Soils. Antonie Leeuwenhoek 1966, 32, 39–56. [Google Scholar] [CrossRef] [PubMed]
  8. Minderman, G. Addition, Decomposition and Accumulation of Organic Matter in Forests. J. Ecol. 1968, 355–362. [Google Scholar] [CrossRef]
  9. van Grinsven, J.J.M.; Kros, J.; van Breemen, N.; van Riemsdijk, W.H.; van Eek, E. Simulated response of an acid forest soil to acid deposition and mitigation measures. NJAS Wagening. J. Life Sci. 1989, 37, 279–299. [Google Scholar]
  10. Stams, A.J.M.; Marinka Flameling, E.; Marnette, E.C.L. The importance of autotrophic versus heterotrophic oxidation of atmospheric ammonium in forest ecosystems with acid soil. FEMS Microbiol. Lett. 1990, 74, 337–344. [Google Scholar] [CrossRef]
  11. Mulder, J.; Stein, A. The solubility of aluminum in acidic forest soils: Long-term changes due to acid deposition. Geochim. Cosmochim. Acta 1994, 58, 85–94. [Google Scholar] [CrossRef] [Green Version]
  12. De Vries, W.; Leeters, E.; Hendriks, C.; Van Dobben, H.; Burg, J.V.D.; Boumans, L. Large scale impacts of acid deposition on forests and forest soils in the Netherlands. Stud. Environ. Sci. 1995, 64, 261–277. [Google Scholar] [CrossRef]
  13. Wesselink, L.; Breemen, N.; Mulder, J.; Janssen, P. A simple model of soil organic matter complexation to predict the solubility of aluminium in acid forest soils. Eur. J. Soil Sci. 1996, 47, 373–384. [Google Scholar] [CrossRef]
  14. Weng, L.; Temminghoff, E.J.; Van, W.H.; Van Riemsdijk, W.H. Interpretation of humic acid coagulation and soluble soil organic matter using a calculated electrostatic potential. Eur. J. Soil Sci. 2002, 53, 575–588. [Google Scholar] [CrossRef]
  15. Arnold, C. Invloed van Bodemverzuring op Mosmijten (Acari, Sarcoptiformes) in een Eikenhakhoutbosje te Hackfort. Internal Report Research Institute for Nature Management, Arnhem; Rijksinstituut voor Natuurbeheer: Arnhem, The Netherlands, 1989. [Google Scholar]
  16. Kampichler, C.; Geissen, V. Temporal predictability of soil microarthropod communities in temperate forests. Pedobiologia 2005, 49, 41–50. [Google Scholar] [CrossRef]
  17. Hoy, J.B. Long-Term Effects of Lindane on the Oribatid Community in a Pine Plantation. Environ. Entomol. 1990, 19, 898–900. [Google Scholar] [CrossRef]
  18. Koehler, H. Secondary succession of soil mesofauna: A thirteen year study. Appl. Soil Ecol. 1998, 9, 81–86. [Google Scholar] [CrossRef]
  19. Wolters, V. Long-term dynamics of a collembolan community. Appl. Soil Ecol. 1998, 9, 221–227. [Google Scholar] [CrossRef]
  20. Siepel, H.; van de Bund, C.F. The influence of management practices on the microarthropod community of grassland. Pedobiologia 1988, 31, 339–354. [Google Scholar]
  21. Siepel, H. Niche relationships between two panphytophagous soil mites, Nothrus silvestris Nicolet (Acari, Oribatida, Nothridae) and Platynothrus peltifer (Koch) (Acari, Oribatida, Camisiidae). Biol. Fertil. Soils 1990, 9, 139–144. [Google Scholar] [CrossRef]
  22. Weigmann, G. Acari, Actinochaetidae Hornmilben (Oribatida); Goecke and Evers: Keltern, Germany, 2006; Volume 520. [Google Scholar]
  23. Lehtinen, P. Review: Acari (Acarina), Milben. Parasitiformes (Anactinochaeta) Cohors Gamasina Leach. Raubmilben. Entomol. Fenn. 1994, 5, 10–12. [Google Scholar] [CrossRef]
  24. Karg, W. Acari (Acarina), Milben, Unterordnung Parasitiformes (Anactinochaeta), Uropodina Kramer, Schildkrötenmilben; VEB Gustav Fischer Verlag: Berlin/Heidelberg, Germany, 1989. [Google Scholar]
  25. Hopkin, S.P. A key to the Collembola (springtails) of Britain and Ireland; Field Studies Council (AIDGAP Project): Telford, UK, 2007; p. 246. [Google Scholar]
  26. Siepel, H.; Zaitsev, A.S.; Berg, H. Checklist of the oribatid mites of the Netherlands (Acari: Oribatida). Ned. Faun. Meded. 2009, 30, 83–111. [Google Scholar]
  27. Siepel, H.; Cremers, H.; Vierbergen, B. Provisional checklist of the astigmatic mites of the Netherlands (Acari: Oribatida: Astigmatina). Ned. Faun. Meded. 2016, 47, 49–88. [Google Scholar]
  28. Siepel, H. Checklist of the mesostigmatic mites of the Netherlands. Ned. Faun. Meded. 2018, 51, 115–188. [Google Scholar]
  29. Hågvar, S.; Abrahamsen, G. Colonisation by Enchytraeidae, Collembola and Acari in Sterile Soil Samples with Adjusted pH Levels. Oikos 1980, 34, 245. [Google Scholar] [CrossRef]
  30. Francis, A.J. Effects of acidic precipitation and acidity on soil microbial processes. Water Air Soil Pollut. 1982, 18, 375–394. [Google Scholar] [CrossRef]
  31. Kandeler, E.; Kampichler, C.; Horak, O. Influence of heavy metals on the functional diversity of soil microbial communities. Biology Fertil. of Soils 1996, 23, 299–306. [Google Scholar] [CrossRef]
  32. Raubuch, M.; Beese, F. Interaction between microbial biomass and activity and the soil chemical conditions and the processes of acid load in coniferous forest soils. Zeitschrift für Pflanzenernährung und Bodenkunde 1998, 161, 59–65. [Google Scholar] [CrossRef]
  33. Tyler, S.W.; Wheatcraft, S.W. Fractal Scaling of Soil Particle-Size Distributions: Analysis and Limitations. Soil Sci. Soc. Am. J. 1992, 56, 362–369. [Google Scholar] [CrossRef]
  34. Brümmer, G.W. Heavy Metal Species, Mobility and Availability in Soils. In The Importance of Chemical “Speciation” in Environmental Processes; Springer Science and Business Media LLC: Berlin/Heidelberg, Germany, 1986; pp. 169–192. [Google Scholar]
  35. Geissen, V. Reactions of Soil Fauna (Lumbricidae, Annelida; Collembola, Arthropoda) to Varying Nutrient and Toxic Element Contents of Forest Soils After Liming and Fertilization; Institut für Bodenkunde: Hannover, Germany, 2000; p. 31. [Google Scholar]
  36. Ulrich, B. Soil Acidity and its Relations to Acid Deposition. In Effects of Accumulation of Air Pollutants in Forest Ecosystems; Springer Science and Business Media LLC: Dordrecht, The Netherlands, 1983; pp. 127–146. [Google Scholar]
  37. Ulrich, B. Natural and anthropogenic components of soil acidification. J. Plant Nutr. Soil Sci. 1986, 149, 702–717. [Google Scholar] [CrossRef]
  38. Wilke, B.-M. Determination of Chemical and Physical Soil Properties. In Soil Biology; Springer Science and Business Media Springer: Berlin/Heidelberg, Germany, 2005; pp. 47–95. [Google Scholar]
  39. Zottl, H.W. Zur Frage der toxischen Wirkung von Aluminium auf Pflanzen. Allg. Forstz. 1983, 38, 206–208. [Google Scholar]
  40. Pannatier, E.G.; Walthert, L.; Blaser, P. Solution chemistry in acid forest soils: Are the BC: Al ratios as critical as expected in Switzerland? J. Plant Nutr. Soil Sci. 2004, 167, 160–168. [Google Scholar] [CrossRef]
  41. Zöttl, H.W.; Hüttl, R.F. Schadsymptome und Ernährungszustand von Fichtenbeständen im südwestdeutschen Alpenvorland. Allg. Forstz. 1985, 40, 197–199. [Google Scholar]
  42. Jaeger, G.; Eisenbeis, G. pH-dependent absorption of solutions by the ventral tube of Tomocerus flavescens (Tullberg, 1871) (Insecta, Collembola). Rev. Ecol. Biol. Sol 1984, 21, 519–531. [Google Scholar]
  43. Van Straalen, N.M.; Verhoef, H.A. The Development of a Bioindicator System for Soil Acidity Based on Arthropod pH Preferences. J. Appl. Ecol. 1997, 34, 217. [Google Scholar] [CrossRef]
  44. Dunger, W.; Voigtländer, K. Assessment of biological soil quality in wooded reclaimed mine sites. Geoderma 2005, 129, 32–44. [Google Scholar] [CrossRef]
  45. Franz, G.J. Splashes as Sources of Sound in Liquids. Cit. J. Acoust. Soc. Am. 1959, 31, 1080. [Google Scholar] [CrossRef]
  46. Hågvar, S.; Abrahamsen, G. Effect of artificial acid rain on Enchytraeidae, Collembola and Acarina in coniferous forest soil, and on Enchytraeidae in Sphagnum bog: Preliminary results. Ecol. Bull. 1977, 25, 568–570. [Google Scholar]
  47. Hauge, E.; Hagvar, S.; Ostbye, E. Pit-fall catches of surface-active arthropods in some high mountain habitats at Finse, south Norway. III. The species of Araneida. Nor. J. Entomol. 1978, 25, 207–220. [Google Scholar]
  48. Gisin, H. Ökologie und Lebensgemeinschaften der Collembolen im schweizerischen Exkursionsgebiet Basels. Rev. Suisse Zool. 1943, 50, 131–224. [Google Scholar]
  49. Hågvar, S. Reactions to soil acidification in microarthropods: Is competition a key factor? Biol. Fertil. Soils 1990, 9, 178–181. [Google Scholar] [CrossRef]
  50. Bobbink, R.; Hettelingh, J.-P.; Braun, S.; Nordin, A.; Power, S.; Schütz, K.; Strengbom, J.; Weijters, M.; Tomassen, H. Review and revision of empirical critical loads and dose-response relationships. In Proceedings of the An Expert Workshop, Noordwijkerhout, The Netherlands, 23–25 June 2010. [Google Scholar]
  51. Nijssen, M.; WallisDeVries, M.; Siepel, H. Pathways for the effects of increased nitrogen deposition on fauna. Biol. Conserv. 2017, 212, 423–431. [Google Scholar] [CrossRef] [Green Version]
  52. Buijsman, E.; Aben, J.M.M.; Hetteling, J.P.; Van Hinsberg, A.; Koelemeijer, R.B.A.; Maas, R.J.M. Zure regen: Een analyse van dertig jaar verzuringsproblematiek in Nederland | Hydrotheek. Available online: https://library.wur.nl/WebQuery/hydrotheek/1949388 (accessed on 11 November 2020).
  53. Zehetner, F.; Lair, G.J.; Maringer, F.; Gerzabek, M.H.; Hein, T. From sediment to soil: Floodplain phosphorus transformations at the Danube River. Biogeochemistry 2008, 88, 117–126. [Google Scholar] [CrossRef]
  54. Siepel, H.; Bobbink, R.; Van De Riet, B.P.; Burg, A.B.V.D.; Jongejans, E. Long-term effects of liming on soil physico-chemical properties and micro-arthropod communities in Scotch pine forest. Biol. Fertil. Soils 2019, 55, 675–683. [Google Scholar] [CrossRef] [Green Version]
  55. Sakchoowong, W.; Nomura, S.; Ogata, K.; Chanpaisaeng, J. Comparison of Extraction Efficiency between Winkler and Tullgren Extractors for Tropical Leaf Litter Macroarthropods. Thai J. Agric. Sci. 2007, 40, 97–105. [Google Scholar]
Figure 1. Location of the Hackfort site in the Netherlands (left), more in detail on the topographic map (middle) and aerial photo of the experimental area (right).
Applsci 10 08202 g001
Figure 2. Soil profiles: typic haplaquoll ((a), at plot I), psammaquentic haplorthod ((b), plot III), and humaqueptic spodic psammaquent ((c), plot V) (see spade for scaling).
Applsci 10 08202 g002aApplsci 10 08202 g002b
Figure 3. Experimental grid in the Hackfort site (left) with a magnification of the D–B gradient (right) presenting the exact locations of the plots (red triangles I–V) and a graph on the elevation in m.a.s.l. (top right).
Applsci 10 08202 g003
Figure 4. pH (KCl) values in 1959, 1987, and 2019 with standard deviation.
Applsci 10 08202 g004
Figure 5. Densities of all microarthropods (left) and Oribatida only (right) in the three periods 1959, 1987, and 2019 (a + b). Species density in our paper is defined as the total number of individuals m−2.
Applsci 10 08202 g005
Figure 6. Four species, Hypochthonius rufulus (a), Platynothrus peltifer (b), Nanhermannia nana (c), and Achipteria coleoptrata (d) found to have a significant negative correlation with pH over the gradient in 2019, with the numbers found in all three periods.
Applsci 10 08202 g006
Table 1. Numbers of microarthropods (total number of specimens/number of samples) found during the years.
195919872019 a2019 a + b
Oribatida330637317645
Astigmata313425
Endeostigmata # 148
Mesostigmata1612698121
Prostigmata2801456
Collembola19142128266
Protura2 27
Diplura 135
Pauropoda 15
Symphyla 11
Pseudoscorpionida 11
Species richness *4843122133
# Endeostigmata were included in Prostigmata in 1959 and 1987. * In 1959 and 1987, only oribatids were identified to the species level and Oppiidae/Suctobelbidae were pooled: 13 spp. in 2019.
Table 2. Species showing a significant relationship with pH values in 2019 (a + b).
PositiveNegative
SpeciesrpSpeciesrp
Hypochthonius luteus0.735<0.001Hypochthonius rufulus−0.755<0.001
Rhodacarus calcarulatus0.789<0.001Rhodacarus coronatus−0.5920.002
Nothrus anauniensis0.5440.005Platynothrus peltifer−0.705<0.001
Panthelozetes paollii0.5250.007Poecilophysis pseudoreflexa−0.707<0.001
Nanorchestes arboriger0.5000.011Oppiella nova−0.6080.001
Friesea mirabilis0.4940.012Suctobelbella subcornigera−0.5650.003
Pseudosinella alba0.4400.028Veigaia nemorensis−0.5520.004
Folsomia manolachei−0.5460.005
Pergamasus celticus−0.5420.005
Nanhermannia nana−0.5080.010
Parisotoma notabilis−0.5070.010
Dissorhina ornata−0.5000.011
Malaconothrus monodactylus−0.4900.013
Ceratophysella denticulata−0.4400.028
Eniochthonius minutissimus−0.4380.029
Oribatula tibialis−0.4280.033
Achipteria coleoptrata−0.4230.035
Publisher’s Note: MDPI stays neutral with regard to jurisdictional claims in published maps and institutional affiliations.

