Article

Optimization of Microwave and Ultrasound Extraction Methods of Açai Berries in Terms of Highest Content of Phenolic Compounds and Antioxidant Activity

by
Monika Hanula
*,
Jarosław Wyrwisz
,
Małgorzata Moczkowska
,
Olaf K. Horbańczuk
,
Ewelina Pogorzelska-Nowicka
and
Agnieszka Wierzbicka
Department of Technique and Food Product Development, Institute of Human Nutrition Sciences, Warsaw University of Life Sciences, Nowoursynowska 159c, 02-776 Warsaw, Poland
*
Author to whom correspondence should be addressed.
Appl. Sci. 2020, 10(23), 8325; https://doi.org/10.3390/app10238325
Submission received: 22 October 2020 / Revised: 19 November 2020 / Accepted: 20 November 2020 / Published: 24 November 2020
(This article belongs to the Section Food Science and Technology)

Abstract

:
Rapid technological progress focuses on lowering costs, labor and time. Thus, in order to minimize the expenses of bioactive compound production, great effort is undertaken to optimize the extraction of these compounds. Green extraction is popular and relatively inexpensive. However, the same extraction method does not always work for all types of matrixes due to the biological diversity of the tissue. Therefore, the purpose of this study was to identify the optimal green extraction method of açai berries (ultrasound or microwaves) able to isolate extracts containing the highest possible number of phenolic compounds with the highest antioxidant activity. The results show that the highest content of total phenolic compounds in the extracts was obtained after the application of a temperature of 45 °C, using ultrasound for 25 min and 45 min, microwaves for 3.16 min and a water bath for 25 min. Ultrasound turned out to be the most effective method of flavonoid extraction. In turn, the highest anthocyanin content was obtained for microwave extraction. Additionally, the application of microwaves for 4.33 min (45 °C) guaranteed the highest ferric-reducing antioxidant activity (FRAP) among the extracts. The results show that the use of microwaves shortens the açai extraction time and ensures both a high content of total phenolic compounds and strong antioxidant activity in the extract.

1. Introduction

In recent years, the nutritional awareness of consumers has increased significantly [1,2]. Nowadays, grocery customers are more frequently looking for healthy food rich in bioactive compounds. Phenolic compounds are a well-known and large group of bioactive substances, which are commonly spread in nature. Phenolic compounds regulate the number of free radicals formed during metabolomic transition, inhibit the growth of microorganisms, and extend the freshness and acceptance of products [3,4,5]. Therefore, manufacturers are looking for new natural sources to be used in functional foods [1,2].
Euterpe oleracea Mart. (açai) is a plant assigned to the family arecaceae, originating from Amazonia and characterized by a high number of phenolic compounds. Açai is considered a “superfruit” because it contains many secondary metabolite compounds (it was identified as having about 90 bioactive compounds: 31% are flavonoids, 23% phenolic compounds, 9% anthocyanins, 11% lignoids) [1,6]. Thanks to its composition, açai has a proven antioxidant activity against hydroxyl, peroxyl and 2,2-diphenyl picrylhydrazyl (DPPH) radicals and it also inhibits liposome oxidation [7,8]. Moreover, among Amazonian fruits such as bacuri, abiu, cupuaçu and graviola, açai berries have the highest activity against 2,2-anizobis-3-ethylbenzthiazoline-6-sulphonic acid (ABTS) radicals [9]. Açai is currently used as an anti-inflammatory agent, reducing the damage caused by oxidative stress and working against neurodegenerative diseases, even cancer [6,10,11]. Açai, due to its unique and broad-spectrum usage, drew the attention of both consumers and food producers [12], which, in turn, increased the demand for açai on the market [13]. Therefore, it seems to be of great importance to find and optimize the best method of açai extraction.
Two alternative groups of extraction methods are used:
Conventional methods use toxic solvents such as dichloromethane and long periods of heat exposure, which result in high energy requirements and the degradation of thermally labile molecules [15]. Green extraction reduces the energy consumption, time and/or the amount of organic solvents used in the procedure. Moreover, green extraction is also more efficient than the conventional method in maintaining the high amount and quality of isolated compounds [16]. Ultrasound breaks down the biological cellular structure through cellular sonoporation, which causes the formation of cell pores, and increases the extraction surface area [17,18]. This extraction method might be used at various stages (for raw materials and final products) and in various industries (food, biotechnology or agricultural technology) [19,20]. In turn, microwaves are used for extraction to separate components from the solid and create the liquid fraction. Microwaves are a form of radiation with an electromagnetic spectrum in the frequency range from 300 MHz to 300 GHz. The influence of microwaves on the processes of chemical synthesis and extraction is closely related to the conversion of electromagnetic energy into heat. Microwaves have electric and magnetic field components perpendicular to each other. Rapid dielectric heating is caused by the formation of a phase difference between the orientation of the field and the dipole [21].
Until now, microwaves and ultrasound have been utilized for extraction in different types of raw materials [22,23,24,25] and açai berries [26,27]. The study conducted by Aliaño-González (2020) proved that the extraction of phenolic compounds and acai anthocyanin might be optimized using microwaves and ultrasound. These studies mainly focused on obtaining as many of these compounds as possible. However, the most important characteristic of phenolic compounds is their antioxidant activity, which plays an important role in the “scavenging of radicals” [5,28,29]. Due to the further use of extracts in industry, an important issue is the extraction of as many phenolic compounds as possible, with a high antioxidant potential. Obtaining an extract with a large amount of phenolic compounds does not equate to this extract being characterized by high antioxidant activity [30]. It seems to be of high importance to study how green extraction affects the phenolic compound content and the antioxidant activity of the extract. Therefore, the aim of the study was to identify the green extraction method for acai berries—using a green solvent (ethanol)—that is the most effective in terms of antioxidant activity, extraction time and cost efficiency.

2. Materials and Methods

2.1. Extraction Process

Lyophilized and powdered açai (2 g) (superfoods, PL-EKO-07) were homogenized in 50 mL of 50% (v/v) ethanol for 2 min at 13,000 rpm (IKA T18 digital, Ultra Turrax, Germany). Then, the extraction process was carried out using ultrasound and microwaves. Ultrasound extraction was carried out at 37 kHz frequency and 100% amplitude (Elma Schmidbauer GmbH, Elmasonic S 180 H, Germany) for 5, 25 and 45 min, at 25 °C and at 45 °C. Microwave extraction (Microwave, HENDI, Model 281376, power output 1800 W) was carried out for 2, 3.16 and 4.33 min at 25 °C and at 45 °C (at 20% of power consumption). Conventional extraction (control) was carried out in a water bath at 25 °C and 45 °C for 25 min. The presented parameters were chosen based on previously conducted studies [19,31,32]. The temperature during extraction was monitored using a thermometer. To avoid heating of the samples during the extraction process, a constant temperature was set for ultrasound, while, for microwaves, the extraction was carried out in cycles (1–9 cycles). The açai extracts were centrifuged for 10 min at 9000 rpm (4 °C) and stored at 4 °C until analysis.

2.2. Total Phenolic Analysis

The total phenolic content (TPC) of açai extracts was measured by the Folin–Ciocalteu colorimetric method described by Singleton and Rossi [33]. Briefly, 0.1 mL of extract was mixed with 0.5 mL of Folin–Ciocalteu reagent, 1.5 mL of 7% (m/v) sodium carbonate solution and 7.9 mL of distilled water. The mixture was kept in a water bath for 30 min at 40 °C (in dark place). The absorbance was measured at a 765 nm wavelength using a UV–VIS spectrophotometer (UV-1800, Shimadzu Corp., 115 VAC, Tokyo, Japan) against the blank. TPC was expressed as mg of gallic acid equivalent per gram of dry mass (dm). A calibration curve (y = 0.5668x + 0.0123) was obtained for the gallic acid, R2 = 0.9998, detection range = 0–2 mg/mL.

2.3. Total Anthocyanin Analysis

The total anthocyanin content (TA) was measured by the pH differential method according to Belwal [34]. Briefly, a 100 µL aliquot of açai extract was mixed with 1.5 mL of potassium chloride (0.025 M, pH 1.0), while another was mixed with 1.5 mL of sodium acetate (0.4 M, pH 4.5). The absorbance was measured for both solutions at 520 nm and at 700 nm using a UV–VIS spectrophotometer (UV-1800, Shimadzu Corp., 115 VAC, Tokyo, Japan). TA content was calculated and expressed as mg of cyaniding 3-glucoside equivalent per gram of dry mass (dm).

2.4. Total Flavonoid Analysis

Total flavonoid (TF) contents were measured using the aluminum chloride colorimetric method described by Chang [35]. In brief, 0.5 mL of the extract was mixed with 0.5 mL of 10% aluminum trichloride (m/v), 1.5 mL of diluted water and 0.1 mL of potassium acetate (1 M) mixture, then incubated for 30 min at room temperature. After that, the absorbance was measured at 415 nm against the blank using a UV–VIS spectrophotometer (UV-1800, Shimadzu Corp., 115 VAC, Tokyo, Japan). The results were expressed as mg of quercetin equivalent per gram of dry mass (mg QE/g dm). A calibration curve (y = 0.0606x + 0.0083) was obtained for the quercetin, R2 = 0.9995, detection range = 0–12 mg/100 mL.

2.5. DPPH Radical Scavenging Activity

The free radical scavenging activity of the various extracts of açai was determined using the 2,2-diphenyl picrylhydrazyl (DPPH) method described by Belwal [34]. Açai extract (0.1 mL) was added to 2.9 mL of DPPH solution, shaken vigorously and incubated in the dark for 30 min (room temperature). Then, the absorbance was measured at 520 nm against the blank using a UV–VIS spectrophotometer (UV-1800, Shimadzu Corp., 115 VAC, Tokyo, Japan). The results were expressed as mg of ascorbic acid equivalent per gram of dry mass (dm). A calibration curve (y = −809.5x + 1.7438) was obtained for the ascorbic acid, R2 = 0.9983, detection range = 0–0.0015 M.

2.6. ABTS Radical Cation Scavenging Activity

The 2,2-anizobis-3-ethylbenzthiazoline-6-sulphonic acid (ABTS) was analyzed according to Belwal’s [34] method. Stock solution was prepared by mixing 2.45 mM potassium persulfate with 7 mM ABTS salt, kept in the dark at room temperature for 16 h before use. The ABTS mixture was diluted with ethanol until an absorbance of 0.7 was obtained (at 734 nm). In total, 0.1 mL of extract was added to 2.9 mL of ABTS solution, mixed and incubated at room temperature in the dark for 30 min. The absorbance was measured at 734 nm against the blank using a UV–VIS spectrophotometer (UV-1800, Shimadzu Corp., 115 VAC, Tokyo, Japan). The results were expressed as mg of ascorbic acid equivalent per gram of dry mass (dm). A calibration curve (y = 935.7x + 0.0151) was obtained for the ascorbic acid, R2 = 0.9995, detection range = 0–0.0006 M.

2.7. FRAP Antioxidant Assay Activity

Ferric-reducing antioxidant power (FRAP) analysis was carried out according to the methodology of Belwal [34]. FRAP solution was prepared by mixing ferric chloride (20 mM), 2,4,6-Tri(2-pyridyl)-s-triazine (10 mM in 40 mM hydrochloric acid) and sodium acetate buffer (300 mM, pH 3.6) in a ratio 1:1:10. The 1 mL extract was mixed in 3 mL of FRAP solution and incubated in the dark for 15 min The absorbance was measured at 593 nm against the blank using a UV–VIS spectrophotometer (UV-1800, Shimadzu Corp., 115 VAC, Tokyo, Japan). The results were expressed as mg of ascorbic acid equivalent per gram of dry mass (dm). A calibration curve (y = 9240.9x + 0.0298) was obtained for the ascorbic acid, R2 = 0.9998, detection range = 0–0.00025 M.

2.8. Color and pH Measurements

The obtained extracts were measured in the CIE L*a*b* system (International Commission on Illumination (L* for the lightness from black (0) to white (100), a* from green (−) to red (+), and b* from blue (−) to yellow (+)) using a Minolta CR-400 colorimeter (Konica Minolta Inc, Japan) with apparatus that had an 8 mm head diameter area. For calibration the white standard (L* = 98.45, a* = −0.10, b* = −0.13), illuminant D65 (6500 K color temperature) and an observation angle of 2° were used.
The pH was measured using a Five EasyTM pH-meter (MATTLER TOLEDO, Switzerland).

2.9. Statistical Analysis

The content of bioactive compounds and their antioxidant activity was analyzed three times for each sample. Samples subjected to physicochemical analysis were measured in ten repetitions. The results were presented as means ± standard deviation (SD). Data obtained during treatments were subjected to an analysis of variance (one-way ANOVA) followed by Tukey’s HSD test with a p-value 0.05. Additionally, factorial ANOVA was performed in order to test the impact of temperature, the type of extraction and the interaction of time × type of extraction on the phenolic compound content and antioxidant activity of extracts at 5%, 1% and 0.1% of confidence. Moreover, the strength of the relationships between total phenolic compound content, total anthocyanin content, total flavonoid content and antioxidative activity measured by FRAP, DPPH and ABTS methods was determined using Pearson’s correlation coefficients. All the analyses were performed using Statistica software version 13.3 (StatSoft).

3. Results and Discussion

3.1. Effect of Ultrasound and Microwave Extraction on the Content of Bioactive Compounds

The highest value of phenolic compound content (35.26–35.95 mg gallic acid/g DM) was obtained after applying a temperature of 45 °C and ultrasound extraction (25 min, 45 min). The same extraction yield for TPC was obtained using microwave extraction (3.16 min) and a water bath (25 min) at 45 °C (Table 2). In turn, the extracts obtained with the microwave method (at a temperature of 45 °C) were characterized by the lowest content of TPC compared to other types of extraction. This was probably due to the lower effect of microwave radiation within the electromagnetic spectrum on the pore formation in the açai berry cell wall [21]. Comparing TPC at the same temperature (25 °C), regardless of the type of extraction used, the content of these compounds was at a similar level. Therefore, when using extraction at 25 °C, it is possible to reduce the time from 5, 25 or 45 min (ultrasound, water bath) to 2 min (microwave), and still get the same amount of phenolic compounds. Moreover, extraction at a higher temperature (45 °C) increased the total number of phenolic compounds in the final extract. Research presented by González-Centeno [36], Hossain [37] and Li [38] showed similar trends.
The highest value of flavonoid content (6.03–6.04 mg of quercetin/g dm) was found in the extract obtained using sonication at 45 °C for 25 min and 45 min (Table 2). TF analysis showed a significant effect of temperature on extraction efficiency, regardless of the extraction type. Similar trends were noted by Zhang [39] and Dadi [40]. A higher temperature (45 °C) improves the solubility of the compounds, causes a decrease in the surface tension of the solvent and its viscosity, whereby the penetration of the solvent is facilitated between the pores in the extraction material [41]. The use of microwaves at 45 °C significantly reduced the number of flavonoids compared to other types of extraction at this temperature. This may indicate that those compounds are less stable in the presence of microwaves.
The highest content of anthocyanins (5.11–4.83 mg cyanidin-3-glucoside/g dm) was obtained at 25 °C using sonication for 25 min and microwaves at each tested time (Table 2). However, considering the error associated with the measured value, this value is statistically equal to that obtained by microwave extraction for 2 min at 25 °C (5.09 mg cyanidin-3-glucoside/g dm). Thus, we can conclude that microwaves offer a more time-efficient method. Microwave extraction at 45 °C carried out for up to 3.16 min significantly increased the amount of extracted TA in comparison to the ultrasound method. At lower temperatures, a difference was not detected. Zheng [42] reported that extraction carried out using microwaves for longer than 5 min and at a temperature above 50 °C caused a decrease in the anthocyanin content in the extract. A similar effect was obtained in the experiment, where the anthocyanin content decreased with increasing temperature. This is related to the high thermal stability of anthocyanins and their degradation at higher temperatures [15].
Extraction type, temperature and extraction type × temperature had an influence (p ≤ 0.001) on the content of flavonoids and anthocyanins in the analyzed extracts, whereas, in the case of total phenolic compounds, only temperature was statistically significant (p ≤ 0.001).

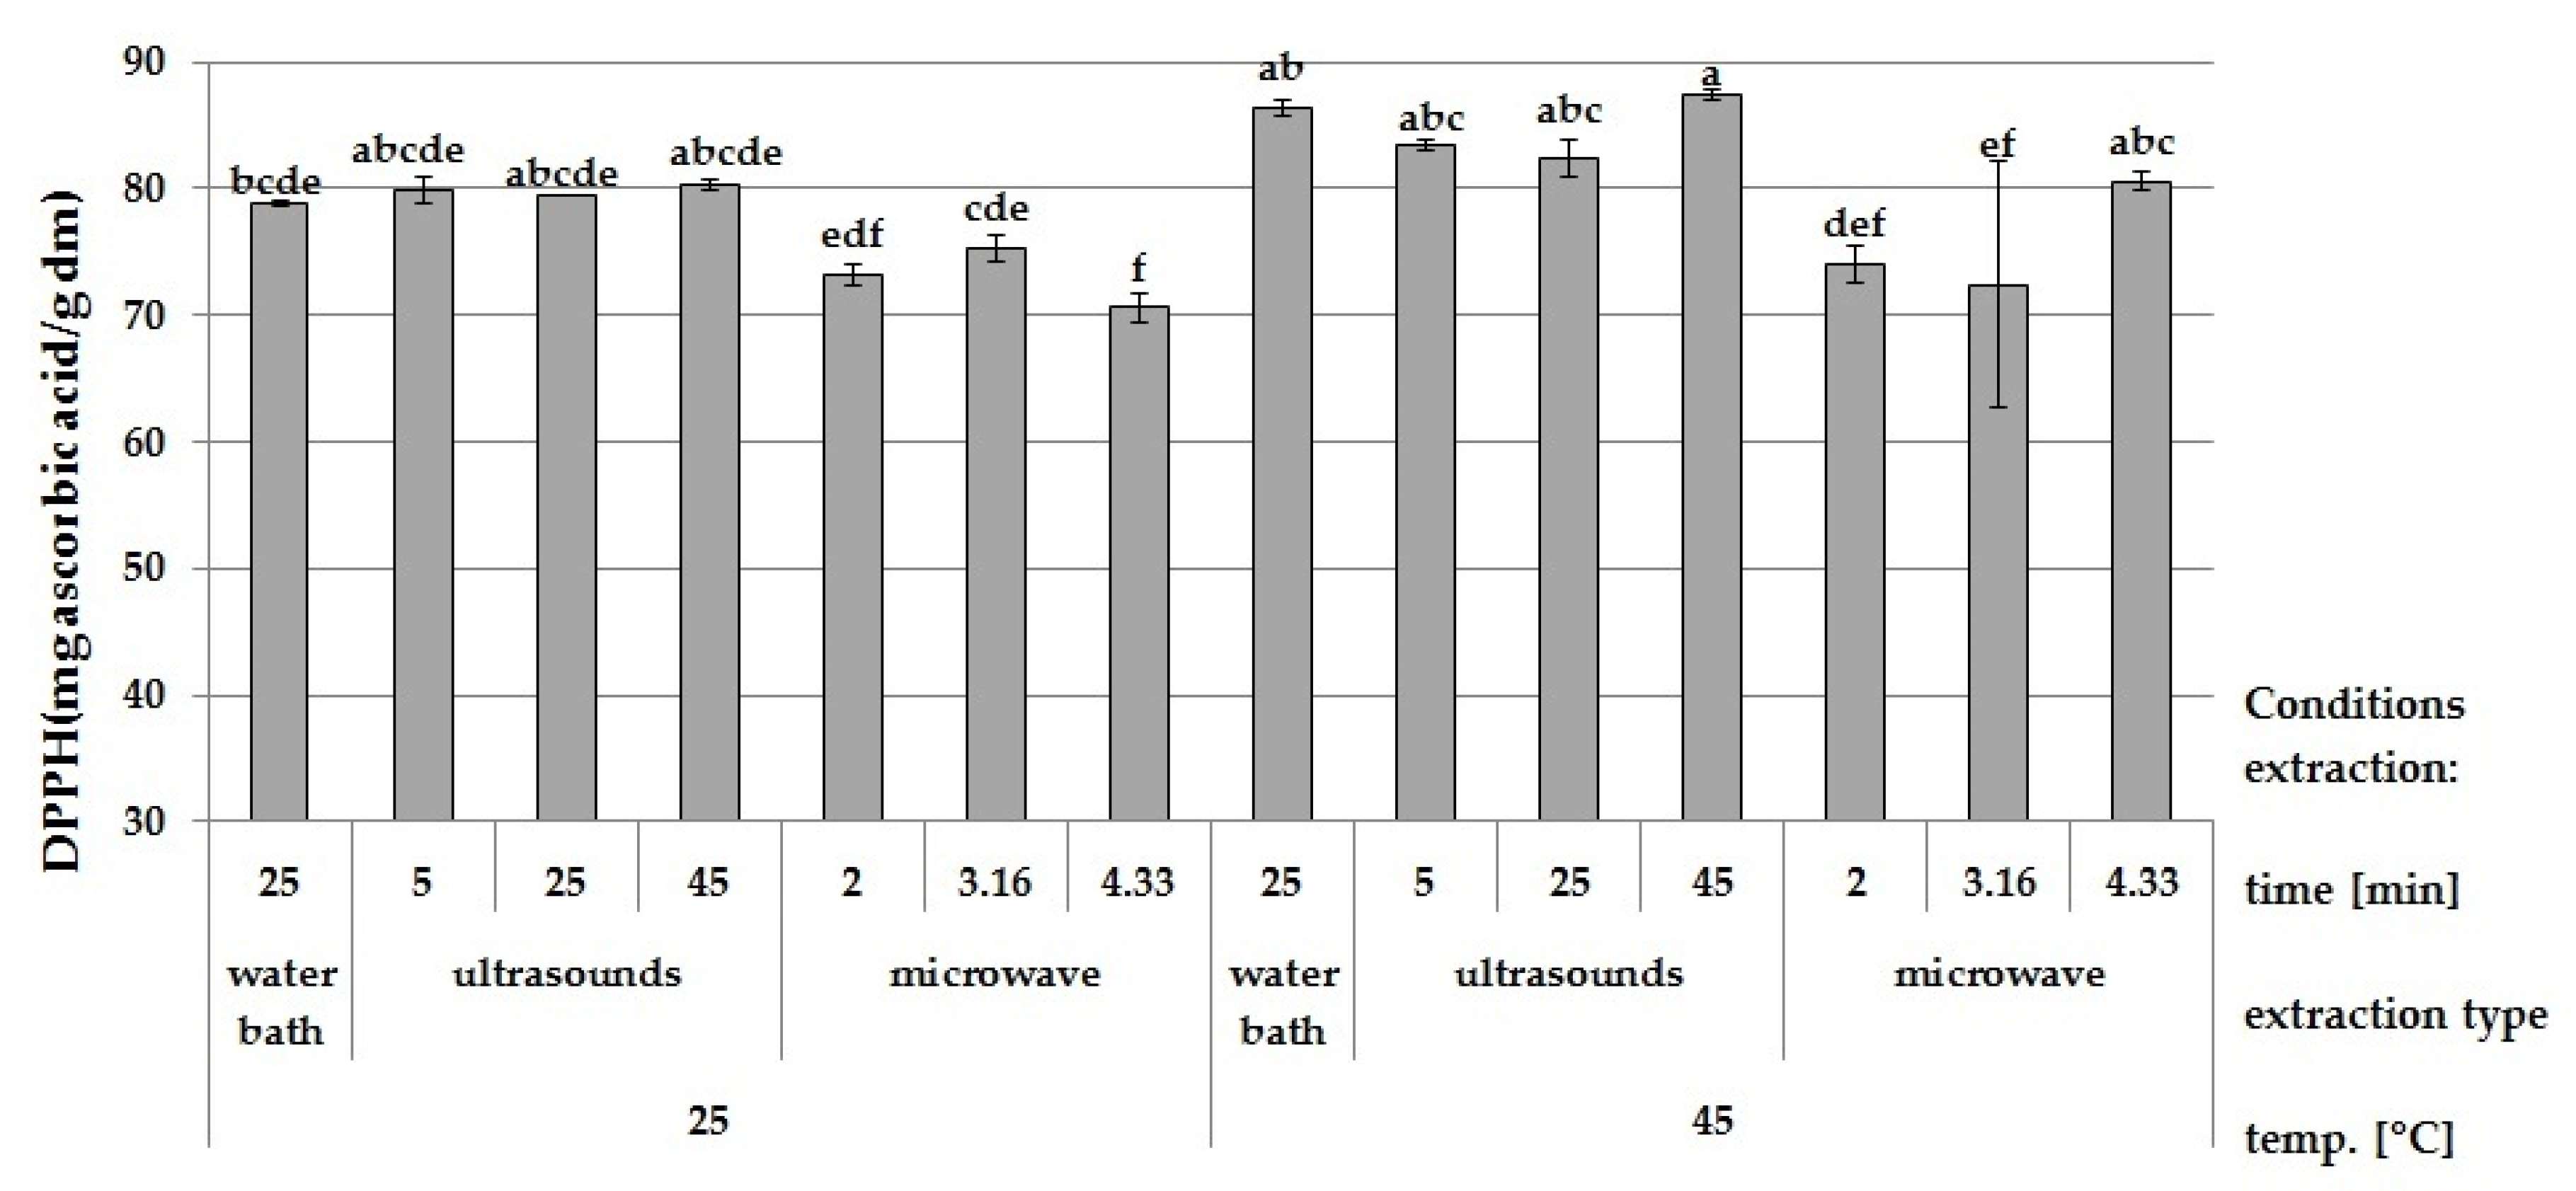
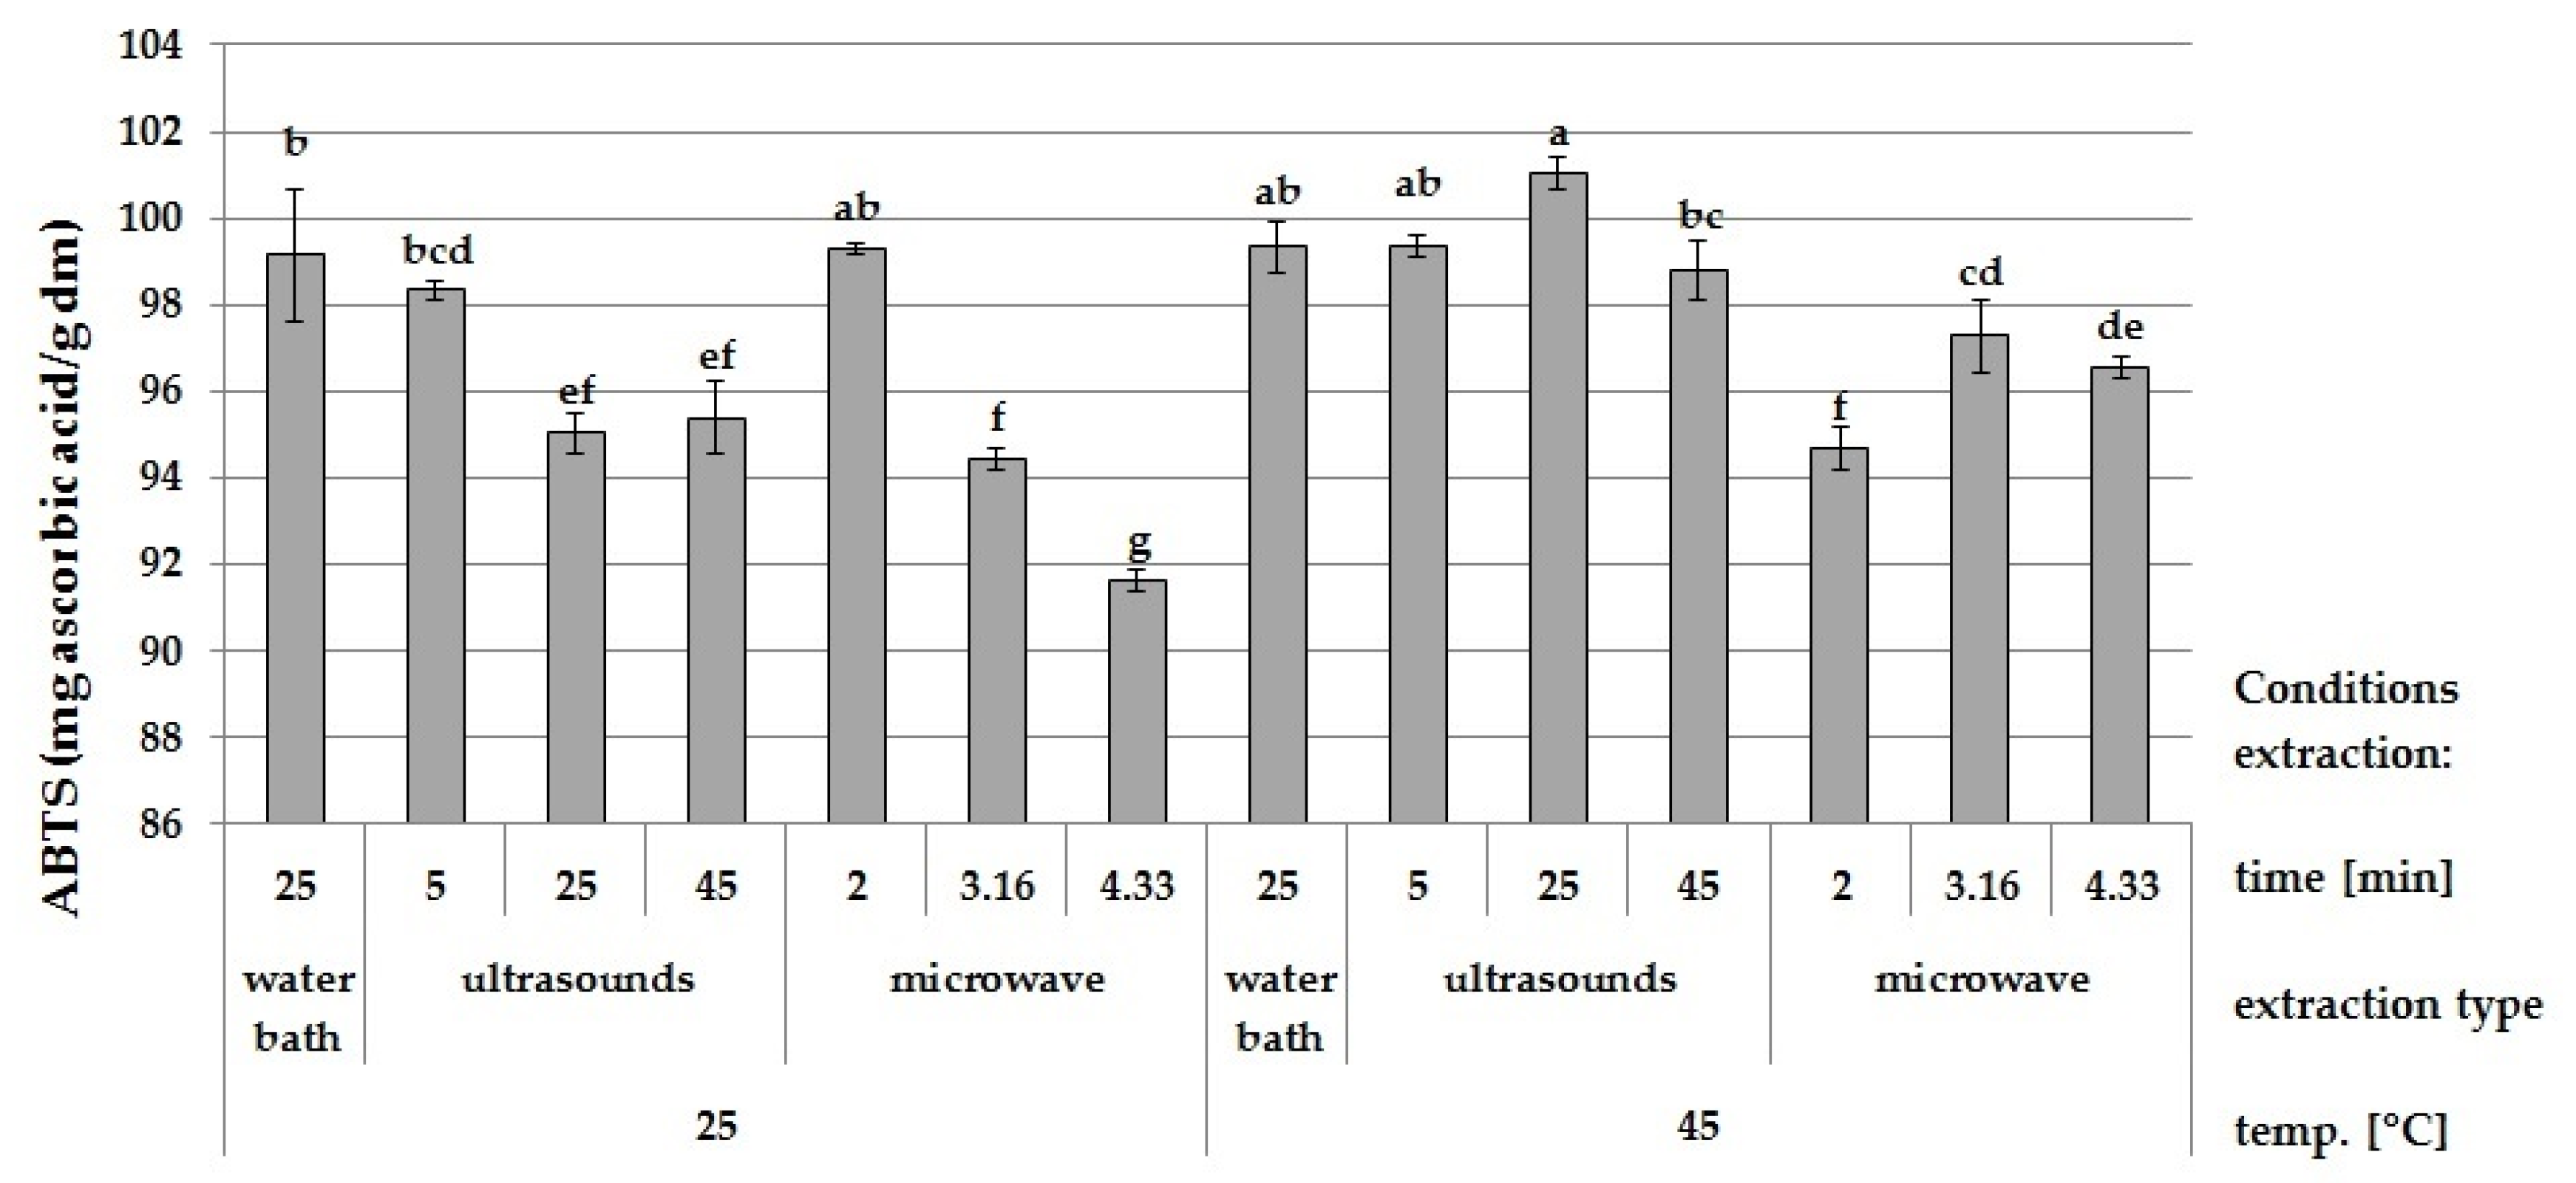
3.2. Effect of Ultrasound and Microwave Extraction on the Antioxidant Activity

In the case of DPPH radical analysis (Figure 1), extracts obtained using ultrasound at 45 °C were characterized by the highest antioxidant activity (83.45–87.42 mg ascorbic acid/g dm).
Moreover, the extract obtained by ultrasound was characterized by a higher antioxidant activity compared to microwaves. Thus, the exposure of the extract to microwaves was more detrimental to its antioxidant activity. In turn, ABTS radical analysis (Figure 2) showed that the highest ABTS value (101.02–99.34 mg ascorbic acid/g dm) was recorded for extracts obtained using ultrasound at 45 °C.
Dahmoune [43], observed that the antioxidant activity (IC50) of the extract obtained by ultrasound was higher than that obtained by microwaves. Moreover, the antioxidant activity of the ABTS radical was the same for the extract obtained after applying a temperature of 45 °C with the use of ultrasound (5 min, 25 min) and a water bath (25 min). The same antioxidant activity was obtained by using microwaves (2 min) at 25 °C. This probably resulted from the higher content of phenolic compounds and flavonoids in those extracts. Higher antioxidant activity was also observed in the case of ABTS analysis in comparison to DPPH, which may be caused by the fact that the ABTS radical has a stronger tendency to donate electrons than the DPPH radical [44]. Thus, it is possible to obtain a similar antioxidant activity in the extract, in shorter time and with less energy expenditure. The highest antioxidant activity of the FRAP radical (74.14–80.89 mg ascorbic acid/g dm) was observed in extracts obtained using microwaves at 25 °C and at 45 °C in comparison to ultrasound (Figure 3).
Additionally, the analysis showed that a higher FRAP value was obtained using microwave extraction when the processing time was longer. Dadi [40], who extracted Moringa stenopetala, noticed a reverse relationship. After 10, 20 and 30 min of extraction, FRAP values (expressed as Trolox) at 40 °C were 141.0, 133.3, 104.9 mg/g dm and 133.2, 128.6, 98.3 mg/g dm at 50 °C, respectively. The differences in the antioxidant activity of the açai extract may result from the presence of heterogeneous phenolic compounds in the samples, e.g., mono-, di-, and polyphenols. Moreover, the antioxidant activity of phenolic compounds depends on their structural conformation—for instance, compounds with a second hydroxyl group in the ortho or para positions are more active compared to compounds with this group in the meta position [45].

3.3. Effect of Ultrasound and Microwave Extraction on the Physicochemical Properties of the Extract

The values of color parameters (Table 3) in the extracts obtained using ultrasound, microwaves and water baths ranged from 19.33 to 20.86 for L*, from 1.97 to 3.38 for a* and from 2.99 to 3.95 for b*. The value of the L* color parameter was close to the value of açai pulp obtained in a study conducted by Lucas [1]. Furthermore, in a study performed by Neida and Elba [46], similar values of the a* (1.6–2.1) and b* (1.0–2.6) color parameters of açai pulp were noted, while the L* color parameter (33.4–35.1) was significantly higher. The pH (Table 3) of the extracts obtained by microwaves and ultrasound extractions was in the range of 5.36–5.52. The highest pH value was observed for the water bath extract obtained at 25 °C for 25 min. Color and pH value differences between extracts may occur due to the different amounts of TPC, TF and TA in the tested samples. Ahmed [47] showed a correlation between color levels and increased antioxidant activity, using the example of cold-brewed coffee extraction.

3.4. Effect of Extraction Conditions on Correlation Coefficients between Antioxidant Activity, pH, Color and Content of Phenolic Compounds, Anthocyanins, and Flavonoids

Flavonoid content (Table 4) was positively correlated with the antioxidant activity measured by DPPH and ABTS methods (p ≤ 0.001) and negatively correlated (p ≤ 0.001) with the antioxidant activity measured by FRAP analysis. This negative correlation probably relates to the mechanism of FRAP reaction and to flavonoids’ Fe2+ chelating properties [48]. TPC content was positively correlated (p ≤ 0.001) with antioxidant activity measured with the use of DPPH and ABTS radicals. Thaipong [49] obtained similar results (p ≤ 0.01) in research analyzing guava fruit extracts. Additionally, Anand [50] showed a positive correlation between TPC and DPPH in honey. A negative correlation (p ≤ 0.05) was also observed between the total content of phenolic compounds and the a* color parameter, which is responsible for the red color. The analyses did not show any significant correlation between the content of phenolic compounds in the extracts and the L* (brightness), b* (yellowness) and pH of the extract. Nonetheless, the content of anthocyanins was negatively correlated (p ≤ 0.001) with the antioxidative activity measured by DPPH and ABTS methods. In turn, a positive correlation (p ≤ 0.01) was noted between the content of anthocyanins and the antioxidant activity measured by the FRAP method. The content of anthocyanins in the extraction also showed a positive correlation (p ≤ 0.01) with the a* color parameter. It has been established that more anthocyanins affect the saturation of the red color of samples [51].

4. Conclusions

The highest content of phenolic compounds and flavonoids in samples was obtained by ultrasound extraction carried out at 45 °C for 25 min and 45 min, whereas, in the case of anthocyanin content, optimal extraction was identified for ultrasound application (25 °C for 25 min) and microwaves (25 °C for 2, 3.16, 4.33 min). Moreover, the highest total antioxidant activity (FRAP) was observed for extracts obtained by the microwave method (45 °C for 4.33 min). The content of flavonoids and anthocyanins was significantly influenced by the type of extraction and temperature as well as by the interaction between extraction type and temperature. Therefore, the use of unconventional green extraction methods such as microwaves not only allows us to obtain extracts with a higher bioactive compound content and higher antioxidant activity, but also reduces the extraction time and energy expenditure.

Author Contributions

Conceptualization, M.H., J.W., A.W.; methodology, M.H.; software, E.P.-N.; validation, M.H., formal analysis, M.H., M.M., O.K.H.; data curation, M.H.; writing—original draft preparation, M.H., E.P.-N.; writing—review and editing, M.H., E.P.-N.; visualization, M.H.; supervision, E.P.-N., A.W. All authors have read and agreed to the published version of the manuscript.

Funding

This research was financed by the Polish Ministry of Science and Higher Education within the funds of the Institute of Human Nutrition Sciences, Department of Technique and Food Product Development, Warsaw University of Life Sciences (WULS-SGGW), for scientific research.

Conflicts of Interest

The authors declare no conflict of interest.

References

  1. Lucas, B.F.; Zambiazi, R.C.; Costa, J.A.V. Biocompounds and physical properties of açaí pulp dried by different methods. LWT 2018, 98, 335–340. [Google Scholar] [CrossRef]
  2. Oliveira, S.R.; Chacón-Madrid, K.; Arruda, M.A.Z.; Barbosa Junior, F. In Vitro Gastrointestinal Digestion to Evaluate the Total; Bioaccessible and Bioavailable Concentrations of Iron and Manganese in Açaí (Euterpe Oleracea Mart.) Pulps. J. Trace Elem. Med. Biol. 2019, 53, 27–33. [Google Scholar] [CrossRef] [PubMed]
  3. Gantner, M.; Stokowska, A. Nie tylko przyprawy przedłużają trwałość mięss. Tech. Przetwórstwa Spożywczego 2015, 1, 86–90. [Google Scholar]
  4. Guo, Q.; Gao, S.; Sun, Y.; Gao, Y.; Wang, X.; Zhang, Z. Antioxidant efficacy of rosemary ethanol extract in palm oil during frying and accelerated storage. Ind. Crop. Prod. 2016, 94, 82–88. [Google Scholar] [CrossRef]
  5. Yeᶊilsu, F.A.; Özyurt, G. Oxidative stability of microencapsulated fish oil with rosemary; thyme and laurel extracts: A kinetic assessment. J. Food Eng. 2019, 240, 171–182. [Google Scholar] [CrossRef]
  6. Yamaguchi, K.K.; Pereira, L.F.; Lamarão, C.V.; Lima, E.S.; da Vejga-Junior, V.F. Amazon açai: Chemistry and biological activities: A review. Food Chem. 2015, 179, 137–151. [Google Scholar] [CrossRef]
  7. Sangronis, E.; Sanabria, N. Impact of solar dehydration on composition and antioxidant properties of acai (Euterpe oleracea Mart.). Arch. Latinoam. Nutr. 2011, 61, 74–80. [Google Scholar]
  8. Spada, P.D.; Dani, C.; Bortolini, G.V.; Funchal, C.; Henrigues, J.A.; Salvador, M. Frozen Fruit Pulp of Euterpe oleraceae Mart. (Açai) Prevents Hydrogen Peroxide-Induced Damage in the Cerebral Cortex; Cerebellum; and Hippocampus of Rats. J. Med. Food 2009, 12, 1084–1088. [Google Scholar]
  9. Canuto, G.A.B.; Xavier, A.A.O.; Neves, L.C.; Benassi, M.T. Physical and chemical characterization of fruit pulps from Amazonia and their correlation to free radical scavenger activity. Rev. Bras. Frutic. 2010, 32, 1196–1205. [Google Scholar] [CrossRef] [Green Version]
  10. Avila-Sosa, R.; Montero-Rodríguez, A.F.; Aguilar-Alonso, P.; Vera-López, O.; Lazcano-Hernández, M.; Morales-Medina, J.C.; Navarro-Cruz, A.R. Antioxidant Properties of Amazonian Fruits: A Mini Review of In Vivo and In Vitro Studies. Oxidative Med. Cell. Longev. 2019. [Google Scholar] [CrossRef]
  11. Mamindla, S.; Prasad, K.V.S.R.G.; Bharathi, K. Herb-drug interactions: An overview of mechanisms and clinical aspects. Int. J. Pharm. Sci. Res. 2016, 7, 3576. [Google Scholar]
  12. Viana, D.S.; de Carvalho, L.M.J.; Moura, M.R.L.; Peixoto, J.C.; de Carvalho, J.L.V. Biochemical assessment of oxidative stress by the use of açai (Euterpe oleracea Martius) gel in physically active individuals. Food Sci. Technol. 2017, 37, 90–96. [Google Scholar] [CrossRef] [Green Version]
  13. Chriboga, J.V.; Elst, K.; Camp, J.V.; Vera, E.; Ruales, J. Valorization of byproducts from tropical fruits: Extraction methodologies, applications, environmental, and economic assessment: A review (Part 1: General overview of the byproducts, traditional biorefinery practices, and possible applications). Compr. Rev. Food Sci. Food Saf. 2020, 19, 405–447. [Google Scholar]
  14. Quintin, D.; Garcia-Gomez, P.; Ayuso, M.; Sanmartin, A.M. Active biocompounds to improve food nutritional value. Trends Food Sci. Technol. 2019, 84, 19–21. [Google Scholar] [CrossRef]
  15. Putnik, P.; Kovačević, D.B.; Ježek, D.; Šustić, I.; Zorić, Z.; Dragović-Uzelac, V. High-pressure recovery of anthocyanins from grape skin pomace (Vitis vinifera cv. Teran) at moderate temperature. J. Food Process. Preserv. 2017, 42, e13342. [Google Scholar]
  16. Zu, G.; Zhang, R.; Yang, L.; Ma, C.; Zu, Y.; Wang, W.; Zhao, C. Ultrasound-Assisted Extraction of Carnosic Acid and Rosmarinic Acid Using Ionic Liquid Solution from Rosmarinus officinalis. Int. J. Mol. Sci. 2012, 13, 11027–11043. [Google Scholar] [CrossRef] [Green Version]
  17. Vinatoru, M.; Mason, T.J.; Calinescu, I. Ultrasonically assisted extraction (UAE) and microwave assisted extraction (MAE) of functional compounds from plant materials. Trends Anal. Chem. 2017, 97, 159–178. [Google Scholar] [CrossRef]
  18. Wang, L.; Boussetta, N.; Lebovka, N.; Lefebvre, C.; Vorobiev, E. Correlations between disintegration degree of fruit skin cells induced by ultrasound and efficiency of bio-compounds extraction. Ultrason. Sonochem. 2019, 52, 280–285. [Google Scholar] [CrossRef]
  19. Kadam, S.U.; Tiwari, B.K.; Smyth, T.J.; O’Donnell, C.P. Optimization of ultrasound assisted extraction of bioactive components from brown seaweed Ascophyllum nodosum using response surface methodology. Ultrason. Sonochem. 2014, 23, 308–316. [Google Scholar] [CrossRef]
  20. Roselló-Soto, E.; Galanakis, C.M.; Brnčić, M.; Orlien, V.; Trujillo, F.J.; Mawson, R.; Knoerzer, K.; Tiwari, B.K.; Barba, F.J. Clean recovery of antioxidant compounds from plant foods; by-products and algae assisted by ultrasounds processing. Modeling approaches to optimize processing conditions. Trends Food Sci. Technol. 2015, 42, 134–149. [Google Scholar] [CrossRef]
  21. Flórez, N.; Conde, E.; Dominguez, H. Microwave assisted water extraction of plant compounds. J. Chem. Technol. Biotechnol. 2014, 90, 590–607. [Google Scholar] [CrossRef]
  22. Ramli, N.S.; Ismail, P.; Rahmat, A. Influence of Conventional and Ultrasonic-Assisted Extraction on Phenolic Contents; Betacyanin Contents; and Antioxidant Capacity of Red Dragon Fruit (Hylocereus polyrhizus). Sci. World J. 2014. [Google Scholar] [CrossRef] [PubMed] [Green Version]
  23. Nayak, B.; Dahmoune, F.; Moussi, K.; Remini, H.; Dairi, S.; Amoun, O.; Khodir, M. Comparison of microwave; ultrasound and accelerated-assisted solvent extraction for recovery of polyphenols from Citrus sinensis peels. Food Chem. 2015, 187, 507–516. [Google Scholar] [CrossRef] [PubMed]
  24. Chan, C.-H.; See, T.-Y.; Yusoff, R.; Nhoh, G.-C.; Kow, K.-W. Extraction of bioactives from Orthosiphon stamineus using microwave and ultrasound-assisted techniques: Process optimization and scale up. Food Chem. 2017, 221, 1382–1387. [Google Scholar] [CrossRef] [PubMed]
  25. Wen, C.; Zhang, J.; Zhang, H.; Dzah, C.S.; Zandile, M.; Duan, Y.; Ma, H.; Luo, X. Advances in ultrasound assisted extraction of bioactive compounds from cash crops—A review. Ultrason. Sonochem. 2018, 48, 538–549. [Google Scholar] [CrossRef] [PubMed]
  26. Aliaño-González, M.J.; Espada-Bellido, E.; Ferreiro-González, M.; Carrera, C.; Palma, M.; Ayuso, J.; Álvarez, J.Á.; Barbero, G.F. Extraction of Anthocyanins and Total Phenolic Compounds from Açai (Euterpe oleracea Mart.) Using an Experimental Design Methodology. Part 2: Ultrasound-Assisted Extraction. Agronomy 2020, 10, 326. [Google Scholar]
  27. Aliaño-González, M.J.; Ferreiro-González, M.; Espada-Bellido, E.; Carrera, C.; Palma, M.; Ayuso, J.; Barbero, G.F.; Álvarez, J.Á. Extraction of Anthocyanins and Total Phenolic Compounds from Açai (Euterpe oleracea Mart.) Using an Experimental Design Methodology. Part 3: Microwave-Assisted Extraction. Agronomy 2020, 10, 179. [Google Scholar]
  28. Tungmunnithum, D.; Malika, A.E.; Drouet, S.; Kiani, R.; Garros, L.; Kabra, A.; Addi, M.; Hano, C. A Quick, Green and Simple Ultrasound-Assisted Extraction for the Valorization of Antioxidant Phenolic Acids from Moroccan Almond Cold-Pressed Oil Residues. Appl. Sci. 2020, 10, 3313. [Google Scholar] [CrossRef]
  29. Veiga, M.; Costa, E.M.; Silva, S.; Pintado, M. Impact of plant extracts upon human health: A review. Crit. Rev. Food Sci. Nutr. 2018, 60, 873–886. [Google Scholar] [CrossRef]
  30. Robya, M.H.H.; Sarhana, M.A.; Selima, K.A.-H.; Khalel, K.I. Evaluation of antioxidant activity, total phenols and phenolic compounds in thyme (Thymus vulgaris L.), sage (Salvia officinalis L.), and marjoram (Origanum majorana L.) extracts. Ind. Crop. Prod. 2013, 43, 827–831. [Google Scholar] [CrossRef]
  31. Azmir, J.; Zaidul, I.S.M.; Rahman, M.M.; Sharif, K.M.; Mohamed, A.; Sahena, F.; Jahurul, M.H.A.; Ghafoor, K.; Norulaini, N.A.N.; Omar, A.K.M. Techniques for extraction of bioactive compounds from plant materials: A review. J. Food Eng. 2013, 117, 426–436. [Google Scholar] [CrossRef]
  32. Teng, H.; Lee, W.Y. Optimization of microwave-assisted extraction of polyphenols from mulberry fruits (Morus alba L.) using response surface methodology. J. Korean Soc. Appl. Biol. Chem 2013, 56, 317–324. [Google Scholar] [CrossRef]
  33. Singleton, V.L.; Rossi, J.A. Colorimetry of total phenolics with phosphomolybdic-phosphotungstic acid reagents. Am. J. Enol. Vitic. 1965, 16, 144–158. [Google Scholar]
  34. Belwal, T.; Dhyani, P.; Bhatt, I.D.; Rawal, S.R.; Pande, V. Optimization Extraction Conditions for Improving Phenolic Content and Antioxidant Activity in Berberis Asiatica Fruits Using Response Surface Methodology (RSM). Food Chem. 2016, 207, 115–124. [Google Scholar] [CrossRef] [PubMed]
  35. Chang, C.C.; Yang, M.H.; Wen, H.M.; Chern, J.C. Estimation of Total Flavonoid Content in Propolis by Two Complementary Colorimetric Methods. J. Food Drug Anal. 2002, 10, 178–182. [Google Scholar]
  36. González-Centeno, M.R.; Comas-Serra, F.; Femenia, A.; Rosselló, C.; Simal, S. Effect of power ultrasound application on aqueous extraction of phenolic compounds and antioxidant capacity from grape pomace (Vitis vinifera L.): Experimental kinetics and modeling. Ultrason. Sonochem. 2015, 22, 506–514. [Google Scholar]
  37. Hossain, M.B.; Brunton, N.P.; Patras, A.; Tiwari, B.; O’Donnell, C.P.; Martin-Diana, A.B.; Barry-Ryan, C. Optimization of ultrasound assisted extraction of antioxidant compounds from marjoram (Origanum majorana L.) using response surface methodology. Ultrason. Sonochem. 2012, 19, 582–590. [Google Scholar] [CrossRef] [Green Version]
  38. Li, Y.; Skouroumounis, G.K.; Elsey, G.M.; Taylor, D.K. Microwave-assistance provides very rapid and efficient extraction of grape seed polyphenols. Food Chem. 2011, 129, 570–576. [Google Scholar] [CrossRef]
  39. Zhang, G.; He, L.; Hu, M. Optimized ultrasonic-assisted extraction of flavonoids from Prunella vulgaris L. and evaluation of antioxidant activities in vitro. Innov. Food Sci. Emerg. Technol. 2011, 12, 18–25. [Google Scholar] [CrossRef]
  40. Dadi, D.W.; Emire, S.A.; Hagos, A.D.; Eun, J.B. Effect of Ultrasound-Assisted Extraction of Moringa stenopetala Leaves on Bioactive Compounds and Their Antioxidant Activity. Food Technol. Biotechnol. 2019, 57, 77–86. [Google Scholar] [CrossRef] [Green Version]
  41. Xu, D.P.; Zheng, J.; Zhou, Y.; Li, Y.; Li, S.; Li, H.B. Ultrasound-assisted extraction of natural antioxidants from the flower of Limonium sinuatum: Optimization and comparison with conventional methods. Food Chem. 2017, 217, 552–559. [Google Scholar] [CrossRef]
  42. Zheng, X.; Xu, X.; Liu, C.; Sun, Y.; Lin, Z.; Liu, H. Extraction characteristics and optimal parameters of anthocyanin from blueberry powder under microwave-assisted extraction conditions. Sep. Purif. Technol. 2013, 104, 17–25. [Google Scholar] [CrossRef]
  43. Dahmoune, F.; Nayak, B.; Moussi, K.; Remini, H.; Madani, K. Optimization of microwave-assisted extraction of polyphenols from Myrtus communis L. leaves. Food Chem. 2015, 166, 585–595. [Google Scholar] [CrossRef] [PubMed]
  44. Giorgis, M.; Garella, D.; Cena, C.; Boffa, L.; Cravotto, G.; Marini, E. An evaluation of the antioxidant properties of Arthrospira maxima extracts obtained using non-conventional techniques. Eur. Food Res. Technol. 2017, 243, 227–237. [Google Scholar] [CrossRef]
  45. Brand-Williams, W.; Cuvelier, M.E.; Berset, C. Use of a Free Radical Method to Evaluate Antioxidant Activity. LWT—Food Sci. Technol. 1995, 28, 25–30. [Google Scholar] [CrossRef]
  46. Neida, S.; Elba, S. Caracterización del acai o manaca (Euterpe oleracea Mart.): Um fruto del Amazonas. Archivos Latinoamericanos de Nutrición. Arch. Latinoam. Nutr. 2007, 57, 94. [Google Scholar] [PubMed]
  47. Ahmed, M.; Jiang, G.H.; Lee, K.C.; Seok, Y.Y.; Eun, J.B. Effects of ultrasonication; agitation and stirring extraction techniques on the physicochemical properties; health-promoting phytochemicals and structure of cold-brewed coffee. J. Sci. Food Agric. 2019, 99, 290–301. [Google Scholar] [CrossRef] [PubMed] [Green Version]
  48. Van Acker, S.A.B.E.; Van Den Berg, D.J.; Tromp, M.N.J.L.; Griffioen, D.H.; Van Bennekom, W.P.; Van Der Vijgh, W.J.F.; Bast, A. Structural aspects of antioxidant activity of flavonoids. Free Radic. Biol. Med. 1996, 20, 331–342. [Google Scholar] [CrossRef]
  49. Thaipong, K.; Boonprakob, U.; Crosby, K.; Cisneros-Zevallos, L.; Byrne, D.H. Comparison of ABTS, DPPH, FRAP, and ORAC assays for estimating antioxidant activity from guava fruit extracts. J. Food Compos. Anal. 2006, 19, 669–675. [Google Scholar] [CrossRef]
  50. Anand, S.; Pang, E.; Livanos, G.; Mantri, N. Characterization of Physico-Chemical Properties and Antioxidant Capacities of Bioactive Honey Produced from Australian Grown Agastache rugosa and its Correlation with Colour and Poly-Phenol Content. Molecules 2018, 23, 108. [Google Scholar] [CrossRef] [Green Version]
  51. Bridle, P.; Timberlake, C.F. Anthocyanins as natural food colours-selected aspects. Food Chem. 1997, 58, 103–109. [Google Scholar] [CrossRef]
Figure 1. Antioxidant activity (2,2-diphenyl picrylhydrazyl (DPPH)) of açai extracts obtained using ultrasound, microwaves and water baths at different time and temperature. a, b, c, d, e, f means with different small superscript letters differ significantly for samples of the same extract at different temperatures.
Applsci 10 08325 g001
Figure 2. Antioxidant activity (2,2-anizobis-3-ethylbenzthiazoline-6-sulphonic acid (ABTS) of açai extracts obtained using water baths, ultrasound and microwaves at different times and temperatures. a, b, c, d, e, f, g means with different small superscript letters differ significantly for samples of the same extract at different temperatures.
Applsci 10 08325 g002
Figure 3. Antioxidant activity (ferric-reducing antioxidant activity (FRAP)) of açai extracts obtained using water baths, ultrasound and microwaves at different times and temperatures. a, b, c, d, e, f, g means with different small superscript letters differ significantly for samples of the same extract at different temperatures.
Applsci 10 08325 g003
Table 1. Types of extraction: conventional and green according Quintin (2019).
Extraction TypeExample
Conventionalhot extraction
maceration
Soxhlet
Greenmicrowaves
sonication
pulsating electric field
high voltage electric field
Table 2. Total phenol (TPC), total flavonoid (TF) and total anthocyanin (TA) contents in açai extracts obtained using water baths, ultrasound and microwaves at different times and temperatures. Factorial analysis of the impact of extraction type, temperature and extraction type × temperature on TPC, TF and TA. The results are presented as means (SD, standard deviation).
Temp. (°C)Extraction TypeTime (min)TPC (mg Gallic Acid/g dm)TF (mg Quercetin/g dm)TA (mg cyanidin-3-glucoside/g dm)
25water bath2533.87 (0.11) ab5.13 (0.10) cd4.60 (0.02) bc
ultrasound534.15 (0.09) a5.16 (0.03) c4.68 (0.02) bc
2534.18 (0.49) a5.26 (0.01) c5.11 (0.02) a
4534.12 (0.20) ab5.16 (0.01) c4.77 (0.03) e
microwave234.36 (0.19) a5.04 (0.12) cd5.09 (0.07) ab
3.1634.22 (0.15) a5.10 (0.07) cd4.94 (0.12) ab
4.3333.42 (0.30) b4.92 (0.09) d4.83 (0.05) abc
45water bath2535.26 (0.02) ab5.66 (0.08) b4.50 (0.03) cd
ultrasound534.35 (0.09) c5.67 (0.12) b4.24 (0.05) de
2535.95 (0.06) a6.03 (0.02) a4.05 (0.18) e
4535.76 (0.07) a6.04 (0.09) a4.01 (0.03) e
microwave234.26 (0.30) c5.15 (0.07) c4.92 (0.13) ab
3.1635.33 (0.11) ab5.19 (0.06) c4.88 (0.10) abc
4.3334.52 (0.77) bc5.22 (0.08) c4.72 (0.33) abc
Extraction typeNS******
Temperature *********
Extraction type × TemperatureNS******
a, b, c,d, e means with different small superscript letters differ significantly for samples of the same extract at different temperatures. NS—not significant; ***—significant at p ≤ 0.001.
Table 3. Color and pH of açai extracts obtained using water baths, ultrasound and microwaves at different times and temperatures. The results were presented as means (SD, standard deviation).
Temp (°C)Extraction TypeTime (min)L *(D65)a *(D65)b *(D65)pH
25water bath2519.61 (0.02) b1.97 (0.14) d3.95 (0.11) a5.52 (0.01) a
ultrasound519.36 (0.01) c3.38 (0.07) a3.90 (0.03) a5.39 (0.01) b
2519.39 (0.03) c3.15 (0.06) ab3.79 (0.07) a5.39 (0.01) b
4520.86 (0.19 a3.06 (0.09) b3.19 (0.06) b5.39 (0.02) b
microwave219.48 (0.05) bc2.44 (0.03) c3.79 (0.04) a5.39 (0.01) b
3.1619.45 (0.02) bc2.23 (0.17) cd3.89 (0.14) a5.43 (0.04) b
4.3319.45 (0.02) bc2.50 (0.04) c3.79 (0.03) a5.42 (0.01) b
45water bath2519.53 (0.02) bc2.12 (0.13) b3.55 (0.01) b5.40 (0.01) ab
ultrasound520.39 (0.08) a2.19 (0.12) b2.99 (0.06) c5.44 (0.02) a
2519.56 (0.03) bc2.17 (0.05) b3.80 (0.08) a5.44 (0.02) a
4519.75 (0.21) b2.26 (0.12) b3.66 (0.15) ab5.37 (0.01) b
microwave219.33 (0.02) c2.37 (0.10) b3.73 (0.09) ab5.43 (0.03) a
3.1619.43 (0.02) c2.74 (0.04) a3.81 (0.04) a5.36 (0.02) b
4.3319.53 (0.12) bc3.03 (0.14) a3.76 (0.05) ab5.42 (0.03) a
a, b, c, d means with different small superscript letters differ significantly for samples of the same extract at different temperatures.
Table 4. Pearson’s correlation coefficients between total phenol (TPC), total flavonoid (TF) and total anthocyanin (TA) contents and their antioxidant activity (DPPH, ABTS, FRAP), color parameters and pH of the extract.
TFTPCTA
DPPH0.73 ***0.47 **−0.64 ***
ABTS0.65 ***0.59 ***−0.58 ***
FRAP−0.53 ***−0.23 NS0.48 **
L *0.17 NS−0.07 NS−0.27 NS
a *−0.38 NS−0.24 *0.41 **
b *−0.28 NS0.00 NS0.28 NS
pH−0.09 NS−0.28 NS−0.18 NS
*** significant at p ≤ 0.001, ** significant at p ≤ 0.01, * significant at p ≤ 0.05, NS not significant.
Publisher’s Note: MDPI stays neutral with regard to jurisdictional claims in published maps and institutional affiliations.

