Abstract
Exploration of historical buildings during their life cycles is one of many aspects of the cultural heritage research. For studying different conditions of historical buildings over time, it is convenient to use photogrammetric surveys carried out in different time stages. Modern photogrammetric methods give the possibility to use archived analogue photogrammetric data, re-process them, and achieve new potentially valuable results with sufficient geometric accuracy and with high visual quality. The paper presents re-processing of analogue archival photogrammetric images captured by a metric camera in 1991 and compares the results to the new photogrammetric survey with a digital camera. The object of interest is Padise Abbey in Estonia. In 1991, parts of the abbey were in poor condition and conservation and renovation works were at an early stage. Nowadays, the abbey is partly renovated, and the results of the new photogrammetric survey give an opportunity to study two completely different conditions.
1. Introduction
Photogrammetry is a method that is used in the fields of cultural heritage and archeology to get a documentation of cultural heritage objects [1,2,3,4,5]. Due to the photogrammetric surveys carried out in different time stages, we can study the objects and explore two different conditions of the object.
In the past, metric analogue cameras were used for photogrammetric surveys and single-image photogrammetry and stereophotogrammetry were prevailing methods [6]. As a storing medium of photogrammetric images, glass plate negatives or photographic film were used. In the past, the metric cameras and other equipment were very expensive, and the processing required well-trained workers [7]. In 1990s, photogrammetry experienced a revolution with the arrival of digital cameras. Nowadays, close range images captured by digital cameras are often processed by effective and fast structure from motion (SfM) method. The structure from motion method has a background in computer vision science, which has different approach. The methods of computer vision were originally aimed at object recognition, navigation of autonomous vehicles, or object modelling. The internal parameters of source images for computer vision were not usually known in contrast to analogue photogrammetry, where the cameras had high optic quality with calibrated lenses and where the main topic was accuracy of a measurement [8].
Digitizing and re-processing of analogue images of photogrammetric surveys carried out during analogue era give an opportunity to get new and potentially valuable results. For example, one of the results of the re-processing of digitized analogue images could be point cloud and orthophoto of a cultural heritage object. These results can help to study how the object has changed. Re-processing of the analogue images could have high meaning in some particular cases. For example, re-processing of images was used by [9] to make a 3D restitution of destroyed and buried historical structures of the Beaufort Castle in Lebanon. Processing of digitized analogue images of the Kronentor of the Dresden Zwinger captured by non-metric cameras with mostly unknown camera geometry was presented by [10]. Archival analogue photogrammetric images of the Great Mosque in Aleppo, Syria were used and re-processed by [11]. The mosque has been damaged during the ongoing war. The analogue images were digitized and re-processed by structure from motion method and 3D results were generated. It is possible to study the former state of the mosque on those 3D results and it can help during the future renovation. By [12], the change of Erbil Al-Qala citadel was presented on comparison of historical and contemporary data.
Between 1972 and 1999, the group around Kalju Pärtna from the National Design Institute for Cultural Heritage carried out several photogrammetric surveys of important cultural heritage sites in Estonia and abroad. Photogrammetric images of the surveys contain important and high-quality records about heritage site conditions and provide valuable information for heritage researchers, owners, architects, engineers, conservators, and renovators. In 1991, one of the photogrammetric surveys was a survey of the south wall of Estonian Padise Abbey. At that time, walls of the abbey were in poor condition. Nowadays, the south wall has been renovated, so it is convenient to present the re-processing of analogue images using SfM method in this case. Twelve of the analogue images (six stereo-pairs) captured by UMK metric camera were digitized and re-processed. In 2017, new images were captured by digital camera and the images were processed by SfM method. Due to resulting point clouds and orthophotos by re-processing and by new survey, it is possible to compare the former and current state of the walls.
1.1. The Importance of Padise Abbey, Historical Background
Padise Area was an important trade settlement, e.g., the location of the stronghold suggests connections with the sea and a harbor site. Padise Stronghold, or the Old Stronghold (Vanalinnamägi) as it is popularly known, is a site of the Middle Iron Age (7th–8th centuries) hill fort.
There is the Padise Abbey (Estonian: Padise klooster) close to the Old Stronghold. The Abbey was a former Cistercian monastery in Padise in Harju County, Estonia, settled in 1310 by the dispossessed monks of Dünamünde Abbey in Latvia. It was converted into a fortress after its dissolution in 1559 and later used as a country house until 1766. The ruins are a museum now.
The interest of monks from Dünamünde Abbey in the present Daugavgrīva near Riga in Padise was first documented in 1283 in a letter from King Eric V of Denmark regarding the acquisition of land for the construction of a Cistercian monastery, but almost certainly they had had a presence there for several decades previously as a part of the Christianization of the territories of Estonia newly conquered by the Teutonic Knights. In 1305, Dünamünde Abbey was appropriated by the Teutonic Knights and the monks dispossessed. Then, King Eric VI of Denmark gave them permission to build a fortified monastery in Padise, where they moved in 1310, although construction of the stone buildings did not begin until 1317. The new monastery was made subordinate to Stolpe Abbey in Pomerania in 1319.
By 1343, at the time of the St. George’s Night Uprising, when it was still only partly built, the monastery was burnt down and rebuilding began after 1370.
By about 1400, the monastery had acquired extensive estates in Estonia and also in southern Finland and throughout the 15th century, it enjoyed a period of great prosperity and influence as one of the most important spiritual centers of Estonia.
During the Livonian War, in 1559, the monks were ejected, and the buildings and estates were confiscated. The monastery became a fortress, which the Swedes duly took in 1561, Russians took in 1576, and Swedes took again in 1580.
In 1622, King Gustavus Adolphus of Sweden gave the estates of the former Padise Abbey (Figure 1) to Thomas Ramm and it remained in the possession of his family until 1919 [13,14,15,16,17,18,19].
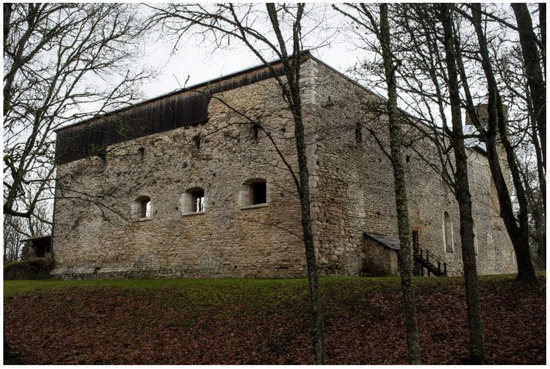
Figure 1.
Padise Abbey in 2017.
1.2. UMK Camera
For the photogrammetric survey, Kalju Pärtna and his team chose a metric camera UMK 6.5/1318 with a super wide lens SuperLamegon PI 5.6/64. From the photogrammetric perspective, for re-processing of the analogue images, it was important to study the used camera.
UMK cameras (Universal Messungs Kammer) were metric cameras with high-quality lenses manufactured by Carl Zeiss Company in Jena, formerly East Germany. As a first camera of the series, UMK 10/1318 with a wide-angle lens Lamegon 8/100A was designed. The designation of UMK 10/1318 refers to the focal length of the used lens (10 cm) and to the dimension of the storing medium (13 × 18 cm). As a universal UMK 10/1318 was not ideal for some photogrammetric applications, Carl Zeiss Company came with other types of UMK cameras. There were manufactured cameras UMK 20/1318 and UMK 30/1318 with longer focal lengths but also camera UMK 6.5/1318 with a super wide-angle lens SuperLamegon PI 5.6/64.
The lenses of cameras were focusable in steps, except of Super-Lamegon, which had a fixed-focus set to 8 m. UMK cameras were equipped with a shutter and adjustable aperture. The camera was possible to rotate by +/−15° and +/−30° upwards or downwards.
The construction of cameras was designed to have long-term steady parameters of interior orientation with low distortion. The parameters of interior orientation were usually calibrated in laboratories.
As a storing medium, glass plate negatives with dimension 13 × 18 cm (useful dimension was 120 × 166 mm) or roll-film 19-cm wide were used. The glass plate negatives were possible to use in portrait orientation or landscape orientation. A frame with fiducial marks that were projected to the image was placed in front of the images. It was possible to make marks on the frame (e.g., calibrated camera constant of camera, position of an image in stereo-pair) [20].
2. Original Survey
In 1991, K. Pärtna and his team from the National Design Institute for Cultural Heritage carried out a photogrammetric survey of the south wall of the Padise Abbey. As a photogrammetric method he chose stereophotogrammetry. Using a metric camera UMK 6.5/1318, he captured six stereo-pairs. As well as the glass plate negatives, we found only some of the documentation to the photogrammetric survey. From that documentation, we were able to read only partially how the original survey was carried out. Unfortunately, the calibration report of the camera was not found.
2.1. Photogrammetric Survey
From the available sketch of the original photogrammetric survey, we were able to read that K. Pärtna and his team captured images in stereo-pairs. The capturing scenario is apparent from the sketch (see Figure 2). Three stereo-pairs (A1–B1, A2–B2, A3–B3) were captured in one line and one stereo-pair (A5–B5) was shifted by 1 m to the line. One stereo-pair (A4–B4) was captured from an unknown further distance (according to the sketch, approximately 16 m). Stereo-pair A1_15–B1_15 (missing in Figure 2) was captured at exactly the same place as stereo-pair A1–B1 but the camera was rotated by 15° upwards. The distances between the images of the same stereo-pair were measured and were reported in an available document. There were markers M1–M6 on the south wall, signalized by crosses carved to the stones of the south wall of the abbey. The distances between those markers were measured most likely using a long tape. The result of the photogrammetric survey was a drawing of stones of the wall.
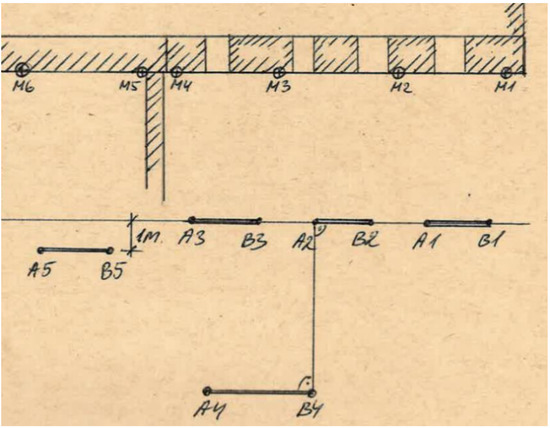
Figure 2.
Sketch of original photogrammetric survey in 1991.
2.2. Captured Images
Black and white images captured by UMK 6.5/1318 camera were stored on glass plate negatives (Figure 3). The used frame had four fiducial marks with calibrated coordinates. We also found information about calibrated camera constant of the used lens in mm on the frame. The used lens had camera constant c = 64.41 mm. On the frame, there were also found marks which signify the left/right position of an image in a stereo-pair (left image marked by “A” and right image marked by “B”). Another mark on the frame was a rotation angle ω (Figure 4). Most of the images were marked as ω = 0, so it means that zenith angle of the optical axis was z = 90°. Images of stereo-pair A1_15–B1_15 were marked as ω = +15°. Images of this stereo-pair were captured in exactly the same position as the stereo-pair A1–B1 (Figure 2) but they were rotated up by 15° so the zenith angle was z = 75°. Stereo-pairs (A1–B1, A1_15–B1_15, A2–B2, A3–B3) were captured approximately 8 m from the wall so their approximate scale was M = 1:124.
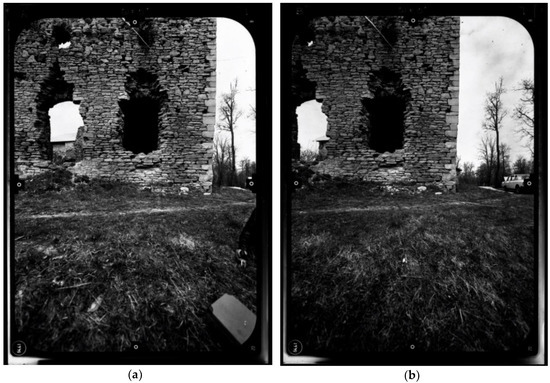
Figure 3.
Images of one stereo-pair of the south wall of Padise Abbey: (a) Left image A1; (b) Right image B1.
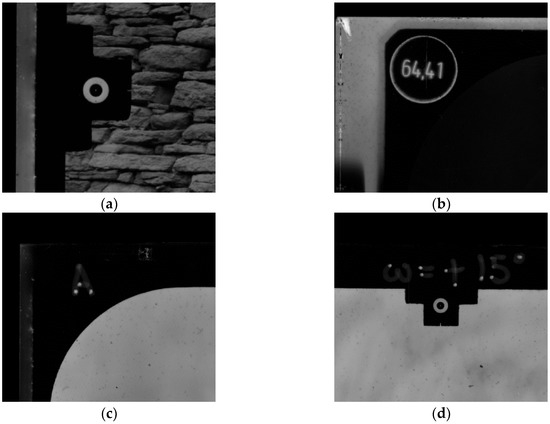
Figure 4.
Details of the frame: (a) one of the four fiducial marks; (b) camera constant in mm written on the frame; (c) mark “A” indicates that the image is the left image of a stereo-pair; (d) mark “ω = +15°” indicates that the axis of the lens is rotated by 15° upwards.
3. Re-Processing of Original Images
To compare different conditions of the south wall in 1991 to the current condition, we have digitized and re-processed glass plate negatives of the original photogrammetric survey and created results such as a point cloud and an orthophoto. Those results were possible to compare with results from the new photogrammetric survey carried out in 2017.
3.1. Data
All 12 images of photogrammetric survey carried out in 1991 were available for digitizing and re-processing. Most of the glass plates evinced some kind of mechanical decay. Most common decays were scratches and cracks. Overall, the negatives were assessed as they were in relatively good condition without any major imperfections.
For creating a complete picture of the original survey, it was necessary to acquire every available documentation. Despite the glass plate negatives, we had the sketch of the scene with six marked points on the south wall and measured distances between the marked points. We also had a report with measured distances between each image of each stereo-pair. For re-processing and following an accuracy check, we wanted to use all information about the original survey.
3.2. Digitization
The glass plate negatives were digitized on a flatbed scanner Epson Perfection V700 Photo. The glass plate negatives were scanned in 1200 dpi and 2400 dpi scanning resolution. After the comparison between the different scanning resolutions, we decided to work with 2400 dpi scanning resolution. We assumed that scanning under 1200 dpi scanning resolution was not sufficient because geometric value of the negatives was assessed as higher. Images scanned under 2400 dpi were demanding in terms of data size. Even these data were not easy to operate during pre-processing due to the size and scanning glass plate negatives under a higher scanning resolution than 2400 dpi would cause difficulties. Additionally, scanning under too high of a scanning resolution does not necessary increase geometric value of the digitized images. After digitization, knowing approximate image scale M = 1:124, we were able to calculate a ground sample distance (GSD), so 1 pixel in-image is equivalent to approximate 1.3 mm on the wall.
3.3. Pre-Processing
The digitized images had to be transformed to achieve the same position of the origin of the image coordinate system for all images. Fortunately, we had available a report from the original survey with calibrated coordinates of each fiducial mark. The coordinates were used as the destination coordinates in affine transformation. For transformation, affine transformation was considered as sufficient according to [21].
After the transformation, the images had to be cropped by rectangular region to obtain the same size in pixels for each image. Transformation and cropping were carried out in software Autodesk Raster Design. The final resolution of the images was 11,717 × 16,441 pixels.
3.4. Processing
For re-processing of the digitized glass plate negatives, we used structure from motion method and as a software tool, we chose commercial software Agisoft Metashape [22] in version 1.6.1. There are some freeware and opensource alternatives, e.g., MicMac [23]. By [24], it was shown that MicMac is suitable for processing digitized analogue photogrammetric images. There is also presented a comparison of the results between Agisoft Photoscan (predecessor of Agisoft Metashape) and MicMac. Based on the conclusions of the comparison, we chose Agisoft Metashape for our re-processing. The used workflow of processing images in Agisoft Metashape consisted of these steps:
- Relative orientation
- Scaling
- Refinement of orientation
- Point cloud generation
- Textured 3D model generation
- Orthophoto generation
At first, after uploading images to the software, it was necessary to insert focal length of the images and pixel size in mm in the image. In the case of digital images, this information is ordinarily stored in an EXIF file and the software reads the values automatically. The digitized images lack this information. The camera constant was written on the frame of the image and the physical size of 1 pixel in the image in millimeters, we were able to calculate from the known scanning resolution. We did not want to have the frame in the processing, so to cover the frame, a mask was created and applied on every image.
The relative orientation was carried out by function “Align Photos” in Agisoft Metashape. During this process, the algorithm finds corresponding tie points between the images. Based on the tie points, the relative position and rotation of the images is found. The root-mean-square (RMS) error of reprojection of the tie points of the relative orientation was 0.9 pix. After the relative orientation, the signalized markers on the wall were found in the images. The relative orientation was scaled using the longest measured distance on the wall. The rest of measured distances were left as check distances for an accuracy check. Then refinement of relative orientation was carried out by function “Optimize Cameras”.
After these steps, the parameters of interior orientation were calculated by self-calibration. The considered parameters of the interior orientation were camera constant, coordinates of the principal point, and coefficients of the radial distortion, k1, k2, and k3. The maximum of the radial distortion (Figure 5) is around 2 pix, which confirms the fact mentioned in chapter 1.2 that lenses of UMK cameras were designed to have low distortion. Unfortunately, due to the missing original calibration report, we could not compare all the computed parameters of the interior orientation to the calibrated parameters. The resulted parameters are presented in Table 1.
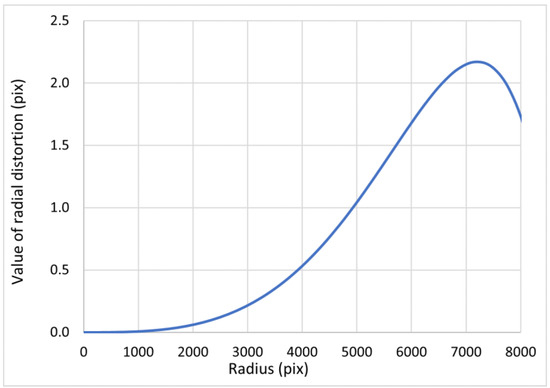
Figure 5.
Radial distortion for camera used in re-processing determined by self-calibration in Agisoft Metashape.

Table 1.
Resulted parameters of interior orientation (camera constant c and position of principal point ppx and ppy) by self-calibration. The calculated values are compared to the input values.
Using “Build Dense Cloud” function, a colored point cloud was generated. For point cloud generation, parameter “Medium” was used, so each size of the images was divided by 4. These down-sampled images were enough to create a sufficiently dense point cloud (Figure 6) for the next steps.
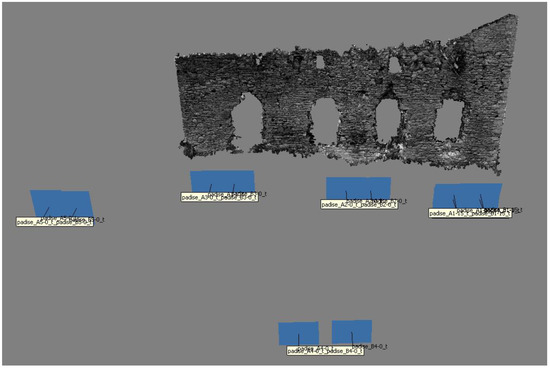
Figure 6.
Resulted point cloud of the south wall created by re-processing with relative position of captured images.
As a next step, a textured 3D model and orthophoto with resolution 0.002 m/pix were created. The resolution of the orthophoto was chosen according to the approximate GSD.
3.5. Accuracy Assessment
Accuracy checking is an integral part of photogrammetric processing. We have used all the available information that we found to provide a proper accuracy check. In the original survey, four distances were measured for scaling. We used the longest one for scaling and adjustment of our relative orientation. The remaining three distances we used as check distances and we calculated them in our photogrammetric model. The differences between measured value and calculated value are presented in Table 2. On check distances M1–M2 and M2–M3, there is a difference 0.005 m. This denotes a proper scaling of relative orientation. Check distance M5–M6 has a difference around 0.02 m. This distance is visible only on stereo-pair A5–B5, and markers M5 and M6 are placed out of the south wall.

Table 2.
Differences between measured distances and calculated distances from photogrammetric model.
In the original processing, distances between each image of each stereo-pair were measured. We used this information for an accuracy check. We calculated the distances from computed exterior orientation of images and compared them to the measured values from the original survey (see Table 3). The difference between images of stereo-pair A4–B4 is the largest (0.021 m). This stereo-pair captures the south wall from a farther distance (approx. 19 m farther) and the tie points are not well-distributed in the images, which could cause worse accuracy. The remaining differences do not exceed 0.007 m.

Table 3.
Differences between measured distances between images of each stereo-pair and distances calculated in photogrammetric model.
All the presented distances had direction more or less parallel to the X axis. The results show the accuracy of scaling the photogrammetric model in one axis. To have a proper accuracy check, we should check the distances in different directions (Y axis and Z axis). Since we did not have measured distances from the original measurement in different directions, it was not possible.
4. New Survey and Processing
Since the survey in 1991, Padise Abbey has been partly renovated. The renovation of the south wall of the abbey, in which we were interested, is already in an advanced stage and the state of the wall is very different on the first sight. After deeper inspection, it was obvious that during the renovation, original stones of the wall were preserved. It was even possible to find the carved markers (M1–M4) from the original survey. In 2017, we carried out a new photogrammetric survey. The new images were processed using structure from motion method and point cloud and orthophoto was created to have the possibility to compare the different state and condition of south wall of the abbey.
For capturing the images, we used a digital non-metric camera Nikon d610 with Nikon AF-S DX Nikkor 35 mm f/1.8G lens and we captured 30 images with resolution 6016 × 4016 pixels from different positions at different angles. The images were captured 18–39 m from the object with average GSD 4.8 mm/pix.
Structure from motion method was used to process the images and Agisoft Metashape was chosen as a software for SfM processing. After computation of relative orientation, the model was georeferenced to have the same coordinate system as we had in the photogrammetric model made by re-processing. As a control and check points, we used the markers (M1–M4) from the original survey, which were visible and identifiable also in new digital images. We also used significant corners of the stones (P1–P6) of the wall which were possible to identify in images captured in 1991 and in the new images captured in 2017 (see, Figure 7). The coordinates of the markers and significant points we measured in the photogrammetric model made by re-processing. In total, four control points equally distributed in-model were used for georeferencing.
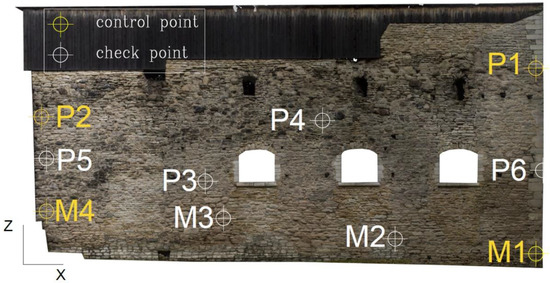
Figure 7.
Distribution of control points (yellow) and check points (white).
Then, refinement of the orientation was carried out. After the refinement, we measured six check points in images, and we compared their calculated coordinates to the coordinates calculated in the photogrammetric model of re-processing. In Table 4, there are presented differences in coordinates, Euclidean distance, and root mean square errors (RMSE) for each axis. The largest differences are in Y axis, which is due to the configuration of images. RMSE in X and Z axis (plane XZ is approximately parallel to the south wall) are under 0.01 m. In our case, the RMSE values represent only the accuracy of georeferencing of the new survey model to the model of the re-processing. The accuracy of the model of the new survey itself is represented by reprojection error in pixels on control and check points (Table 4). None of the reprojection error exceed 1 pixel. RMS reprojection error of the tie points was 0.4 pix.

Table 4.
Differences on control and check points between measured coordinates from re-processing and adjusted coordinates from new survey.
After the accuracy check on check points, point cloud, 3D model, and orthophoto with 0.005 m/pix resolution were generated. The resolution of the orthophoto was chosen according to the average GSD (4.8 mm/pix) and according to the fact that RMS reprojection error and reprojection errors on control points and check points do not exceed 1 pixel.
5. Comparison
The main and important difference between both processing are the datasets. The original images are digitized analogue images captured by a precisely manufactured metric camera and the images of the new survey are images captured by a non-metric camera, which is not designed for photogrammetric purposes. Due to the high cost of the images, just 12 images stored on glass plates were captured during the original survey. The average overlap on the object was approx. 5 images. During the survey in 2017, we captured 30 images and almost all objects are seeable on every image. During the new survey, we captured the images with larger GSD (avg. 4.8 mm/pix). This GSD is sufficient for determining if a stone was preserved or an outcome of the renovation. For processing digitized analogue and digital images, we used the same method, and we processed the data in the same software. Even though both datasets were inherently different, we achieved respectable reprojection error (in both cases, RMS reprojection error is under 1 pix.). The comparison of datasets is presented in Table 5. The merged point clouds and difference in capturing scenario is presented in Figure 8.

Table 5.
Comparison of datasets of the re-processing and the new survey.
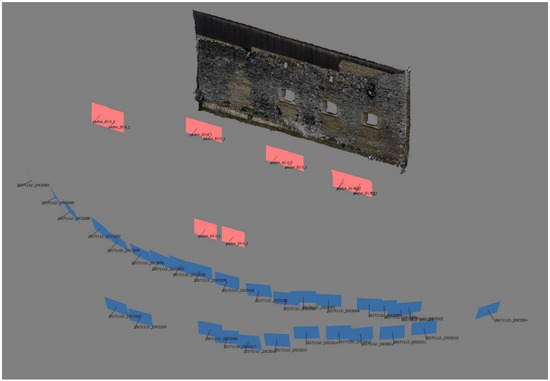
Figure 8.
Merged point clouds of the re-processing and the new survey. On the figure, it is possible to observe different capturing scenarios (the highlighted images belong to re-processing).
For comparison of different states of Padise Wall in 1991 and 2017, we generated a textured 3D model, point cloud, and orthophoto. The different states of the south wall are possible to examine and explore in these results. The easiest way to compare the state of the wall is orthophoto comparison. The orthophotos were overlayed on each other (Figure 9a) and the overlay was exported to .pdf format. This result is easily transportable, readable, and understandable for architects, conservators, restorators, and even for the wider public. On the overlay, it is easily possible to determine which stones of the wall are preserved after the renovation and which stones are the outcome of the renovation. From the overlay, it is possible to create manually a drawing of stones of the wall with semantic information (Figure 9b). The result could be a data for GIS and BIM systems [25].
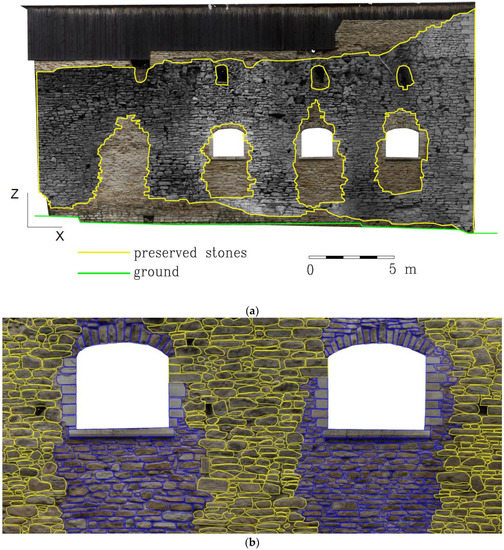
Figure 9.
Comparison between states in 1991 and 2017 of the south wall of Padise Abbey: (a) an overlay of cropped orthophoto generated by re-processing (grey colors) and by new survey; (b) a drawing of stones. Yellow color indicates preserved stones, blue color indicates new stones after renovation.
On the other hand, point cloud is not a result intended for general public. Even though tools like plas.io, HexaLab, Potree, and Sketchfab bring the point clouds closer to the wider audience, it is necessary to have certain knowledge and tools to operate and interpret point clouds. Despite that fact, point cloud can offer an interesting comparison with the potential of gathering the semantic data automatically and semi-automatically. The point clouds generated by re-processing and by new survey were compared to each other by Cloud/Cloud distance method in CloudCompare [26] software. According to [27], both point clouds had to be pre-processed before Cloud/Cloud comparison. Both point clouds were filtered using statistical outlier removal function (SOR filter in CloudCompare). After the filtering, the point cloud of the new survey had a resolution of 1 point per ca. 2 cm2 and the point cloud from re-processing had 1 point per ca. 0.6 cm2. To use the point cloud of the new survey as the reference, we had to subsample the point cloud of the re-processing to have lower resolution (final resolution was 1 point per 3 cm2). From the result of comparison, it is possible to easily examine the changes between the states in 1991 and 2017, not only by visible matter but also by determination of differences. The comparison showed that 76.2% of points have a lower difference than 0.05 m. In respect to the accuracy of georeferencing of the model of the new survey, we considered these points as points belonging to the preserved stones. The rest of the points were considered as points belonging to the outcome of the renovation. The points with a difference under the threshold 0.05 m were overlayed to the orthophoto and the position of points were compared to the manually created boundary from the orthophoto (see Figure 10).
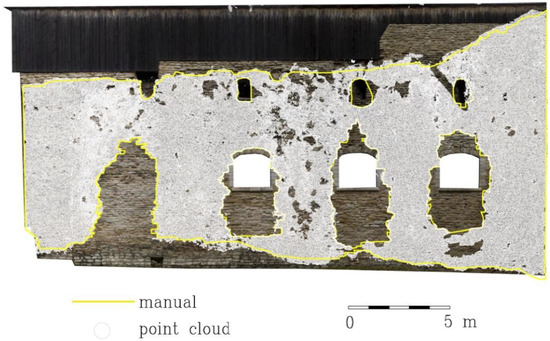
Figure 10.
Overlay of the point cloud where differences of Cloud/Cloud comparison were under chosen threshold of 0.05 m and of the orthophoto with the manually created boundary of preserved stones.
The final chosen resolution of the reference point cloud (new survey point cloud) after filtering can have an impact on the result of the Cloud/Cloud comparison. To avoid that, we also created a mesh from the point cloud of the new survey. The mesh was used as reference in Cloud/Mesh comparison with point cloud of re-processing. A figure of 76.5% of the differences were under the chosen threshold of 0.05 m and we considered them also as points belonging to the preserved stones. The overlay of the points with orthophoto and manually created boundary were carried out.
By eye, both overlays seem identical (for that reason, we present only overlay with Cloud/Cloud comparison in Figure 10). Both match with the boundary, which verifies the 0.05 m threshold (especially around the windows). The percentage of points under the threshold is very similar so we observed that even Cloud/Cloud comparison was relevant.
For distinction between preserved and new stones, it was sufficient to use presented method. The topic of finding the semantic information from multitemporal data and Cloud/Cloud and Cloud/Mesh comparison encourages future development of advanced semi-automatic methods. By [28] were presented methods of change detection on depth maps of orthophotos generated based on the images captured in different time stages. One of the methods was comparing histograms of the depth maps and another method was based on subtracting of depth maps of orthophotos between each other. Methods for structural changes on cultural heritage objects were presented by [29]. The point cloud of the cultural heritage object was by automatic methods enriched by the information about the difference to the laser scanning point cloud, difference to the plane generated by RANSAC algorithm, luminance, curvature, and roughness.
From the point clouds of the re-processing and the new survey, textured 3D models were created. The textured 3D model is possible to upload to one of the internet services or export to the .pdf format and present the results to the wider public. The main importance of textured 3D models we see with the development and expansion of virtual reality (VR) technologies [30].
6. Conclusions
Due to the photogrammetric surveys carried out in different time stages, it is possible to create 2D and 3D results which help to study, examine, and explore different states and different conditions of cultural heritage objects. Those multitemporal results are comparable and could be valuable for architects, restorators, and conservators.
Capturing of the images for photogrammetric processing during analogue era was a highly sophisticated work with a high-quality metric camera. Every capture of an image must be precisely planned. The number of the images was a topic. The storing medium was expensive, and the photogrammetric processing took much longer with higher number of images. On the other side, nowadays, using a (sometimes low-cost) non-metric digital camera, it is possible to capture many images without any additional cost. The preparation is thinner. Processing of the images is much faster using structure from motion method and it is possible to gain a variety of two-dimensional and three-dimensional results. Using modern structure from motion method, it is also possible to re-process digitized analogue images. Although the datasets are inherently different, to achieve respectable accuracy, the pipeline of processing could be similar for digital and analogue datasets. Even though it is possible to process the digitized analogue data using modern methods, which were designed originally by computer vision science, for analogue data restoration, digitization, and successful processing, it is essential to keep the knowledge about fundaments of the analogue photogrammetry.
In 1991, K. Pärtna carried out photogrammetric survey of the south wall of Padise Abbey. Using an analogue metric camera UMK 6.5/1318, he and his team captured 12 images in six stereo-pairs. After more than 25 years, the glass plate negatives and partial documentation were found, and the negatives were digitized and re-processed using SfM method. The relative orientation was computed, scaled, adjusted, and the accuracy was checked on measured distances between markers and measured distances between each image of each stereo-pair. Then, the textured 3D model, point cloud, and orthophoto were generated.
The new photogrammetric survey with a digital camera was carried out in 2017 after the renovation of the south wall of Padise Abbey. The images were processed using SfM method as well. The model was georeferenced to the model made by re-processing to obtain the same coordinate system. As control points and check points, we used markers carved into stones in 1991 and significant features of stones of the south wall. The RMSE of differences in coordinates in X axis was 0.004 m and in Z axis 0.009 m (XZ plane is parallel to the wall). The results of the processing were also a textured 3D model, point cloud, and orthophoto.
The different states of Padise Wall between 1991 and 2017 are possible to explore and present on comparison of results made by re-processing of images and new survey. In our opinion, an overlay of two orthophotos offers the easiest comparison of different states. The overlay is an easily understandable result, could be exported to the widely used formats, could be a source for CAD drawing, and could be a data for GIS and BIM systems. On the other hand, operating point cloud requires some knowledge and proper software. As was shown, using Cloud/Cloud and Cloud/Mesh comparison, it is possible to determine differences concerning which stones of the wall are preserved, and which stones of the wall are an outcome of renovation. Differences under chosen threshold (0.05 m) were considered as points belonging to the preserved stones and an overlay with orthophoto was carried out. The overlay showed that the points fit to the manually created boundary. The semi-automatic or automatic gathering of semantic data from Cloud/Cloud or Cloud/Mesh comparison is going to be a topic of the future research. From the point clouds were created textured 3D models. The textured 3D models are going to be a more and more important result with development of VR technologies.
The created results can be supported by other modern survey measurement methods like laser scanning, GNSS and total station measurement, ground penetrating radar measurements, etc. Additionally, further testing and comparing different open software tools can be additional work. All the methods offer different results with different backgrounds. By merging them and comparing them, we can get a variety of 2D and 3D results. From those results, it is possible to derive manually, semi-automatically, or automatically important semantic information, which can significantly help to better understand the cultural heritage objects.
Author Contributions
Conceptualization, K.V. and J.P.; methodology, A.D. and A.U.; technical advisory and supervision, K.V. and J.P.; data processing, A.D. and A.U.; investigation, K.V. and J.P.; writing—original draft preparation, A.D. and A.U.; writing—review and editing, A.D. and A.U.; visualization, A.D.; project administration, A.U. All authors have read and agreed to the published version of the manuscript.
Funding
This project was funded by Estonian Ministry of Culture (Project no. 7-8/79) and by a grant of the Grant Agency of the Czech Technical University in Prague, grant No. SGS20/053/OHK1/1T/11.
Acknowledgments
This research is partly research of EuroGV spol., s r. o., Archaeovision LLC, Estonian Academy of Arts and Department of Geomatics at the Czech Technical University in Prague.
Conflicts of Interest
The authors declare no conflict of interest. The funders had no role in the design of the study; in the collection, analyses, or interpretation of data; in the writing of the manuscript, or in the decision to publish the results.
References
- Yastikli, N. Documentation of cultural heritage using digital photogrammetry and laser scanning. J. Cult. Herit. 2007, 8.4, 423–427. [Google Scholar] [CrossRef]
- Barrile, V.; Bilotta, G.; Lamari, D.; Meduri, G.M. Comparison between techniques for generating 3D models of cultural heritage. Recent Adv. Mech. Mechatron. Civ. Chem. Ind. Eng. Math. Comput. Sci. Eng. Ser. 2015, 49, 140–145. [Google Scholar]
- Giuliano, M.G. Cultural Heritage: An example of graphical documentation with automated photogrammetric systems. Int. Arch. Photogramm. Remote Sens. Spatial Inf. Sci. 2014, XL-5, 251–255. [Google Scholar] [CrossRef]
- Ippoliti, E.; Meschini, A.; Sicuranza, F. Structure from motion systems for architectural heritage. A survey of the internal loggia courtyard of Palazzo del Capitani Ascoli Piceno, Italy. Int. Arch. Photogramm. Remote Sens. Spatial Inf. Sci. 2015, XL-5/W4, 53–60. [Google Scholar] [CrossRef]
- Faltýnová, M.; Raeva, P.; Poloprutský, Z.; Matoušková, E.; Housarová, E. Complex analysis and documentation of historical buildings using new geomatics methods. Civ. Eng. J. 2016, 4, 1–8. [Google Scholar]
- Kraus, K. Photogrammetry; Dümmler: Bonn, Germany, 1993; Volume 2. [Google Scholar]
- Albertz, J.; Wiedemann, A. From Analogue to Digital Close-Range Photogrammetry; First Turkish-German Joint Geodetic Days; Istanbul Technical University: Istanbul, Turkey, 1995; pp. 245–253. [Google Scholar]
- Hartley, R.I.; Mundy, J.L. Relationship between photogrammetry and computer vision. In Proceedings of the SPIE 1944, Integrating Photogrammetry Techniques with Scene Analysis and Machine Vision, Orlando, FL, USA, 11–16 April 1993; Volume 1944, pp. 92–105. [Google Scholar]
- Grussenmeyer, P.; Yasmine, J. Photogrammetry for the preparation of archaeological excavation. A 3D restitution according to modern and archive images of Beaufort Castle landscape (Lebanon). In Proceedings of the XXth Congress of the International Society for Photogrammetry and Remote Sensing (ISPRS), Istanbul, Turkey, 12–23 July 2004; pp. 809–814. [Google Scholar]
- Maiwald, F.; Vietze, T.; Schneider, D.; Henze, F.; Münster, S.; Niebling, F. Photogrammetric analysis of historical image repositories for virtual reconstruction in the field of digital humanities. Int. Arch. Photogramm. Remote Sens. Spatial Inf. Sci. 2017, XLII-2/W3, 447–452. [Google Scholar] [CrossRef]
- Pavelka, K.; Šedina, J.; Raeva, P.; Hůlková, M. Modern processing capabilities of analog data from documentation of the Great Omayyad Mosque in Aleppo, Syria, damaged in civil war. Int. Arch. Photogramm. Remote Sens. Spatial Inf. Sci. 2017, XLII-2/W5, 561–565. [Google Scholar] [CrossRef]
- Housarová, E.; Pavelka, K.; Šedina, J. Study of Erbil Al-Qala citadel time changes by comparison of historical and contemporary image data. Eur. J. Remote Sens. 2019, 52, 202–208. [Google Scholar] [CrossRef]
- Padise Muuseumi Sihtasutus. Available online: http://www.padiseklooster.ee (accessed on 15 May 2018).
- Visit Harju. Available online: http://www.visitharju.ee (accessed on 15 May 2018).
- Digital Archive, Estonian Churches. Available online: http://kirikud.muinas.ee/?page=1&subpage=1681b (accessed on 15 May 2018).
- Kultuurimälestiste Riiklik Register. Padise Kloostri Varemed Vallikraaviga. Available online: https://register.muinas.ee/public.php?menuID=monument&action=view&id=2921 (accessed on 15 May 2018).
- Padise Virtual Tour. Available online: http://www.loodeeesti.ee/padise/padiseklooster/padisekloosterh.html (accessed on 15 May 2018).
- Estonia 360, Padise Abbey Aeropanoram. Available online: http://www.estonia360.ee/padise_klooster/ (accessed on 15 May 2018).
- Eesti mõisaportaal. Padise klooster ja mõis. Available online: http://www.mois.ee/harju/padise.shtml (accessed on 15 May 2018).
- Luhmann, T.; Robson, S.; Kyle, S.; Harley, I. Close Range Photogrammetry; Principles, techniques and applications; Whittles Publishing: Scotland, UK, 2006; Chap. 3.3.1.3; pp. 140–141. [Google Scholar]
- Poloprutský, Z.; Fraštia, M.; Marčiš, M. 3D digital reconstruction based on archived terrestrial photographs from metric cameras. Acta Polytechnica 2019, 59.4, 384–398. [Google Scholar] [CrossRef]
- Agisoft Metashape User Manual. Available online: https://www.agisoft.com/pdf/metashape-pro_1_5_en.pdf (accessed on 18 October 2020).
- MicMac—A Free Open-Source Photogrammetric Suite. Available online: https://micmac.ensg.eu/index.php/Accueil (accessed on 3 November 2020).
- Dlesk, A.; Vach, K.; Pavelka, K., Jr. Structure from motion processing of analogue images captured by Rollei metric camera, digitized with various scanning resolution. Acta Polytechnica 2020, 60.4, 288–302. [Google Scholar] [CrossRef]
- Reina Ortiz, M.; Yang, C.; Weigert, A.; Dhanda, A.; Min, A.; Gyi, M.; Su, S.; Fai, S.; Santana Quintero, M. Integrating heterogeneous datasets in HBIM of decorated surfaces. Int. Arch. Photogramm. Remote Sens. Spatial Inf. Sci. 2019, XLII-2/W15, 981–988. [Google Scholar] [CrossRef]
- CloudCompare [GPL software]. Available online: http://www.cloudcompare.org/ (accessed on 3 November 2020).
- Antova, G. Application of areal change detection methods using point clouds data. IOP Conf. Ser. Earth Environ. Sci. 2019, 221, 1–8. [Google Scholar] [CrossRef]
- Peteler, F.; Gattet, E.; Bromblet, P.; Guillon, O.; Vallet, J.M.; De Luca, L. Analyzing the evolution of deterioration patterns: A first step of an image-based approach for comparing multitemporal data sets. Digit. Herit. 2015, 2, 113–116. [Google Scholar]
- Nespeca, R.; De Luca, L. Analysis, thematic maps and data mining from point cloud to ontology for software development. Int. Arch. Photogramm. Remote Sens. Spatial Inf. Sci. 2016, XLI-B5, 347–354. [Google Scholar] [CrossRef]
- Pavelka, K., Jr.; Raeva, P. Virtual museums—The future of historical monuments documentation and visualization. Int. Arch. Photogramm. Remote Sens. Spatial Inf. Sci. 2019, XLII-2/W15, 903–908. [Google Scholar] [CrossRef]
Publisher’s Note: MDPI stays neutral with regard to jurisdictional claims in published maps and institutional affiliations. |
© 2020 by the authors. Licensee MDPI, Basel, Switzerland. This article is an open access article distributed under the terms and conditions of the Creative Commons Attribution (CC BY) license (http://creativecommons.org/licenses/by/4.0/).