Review

Sensor Micro and Nanoparticles for Microfluidic Application

by
Raminta Mazetyte-Stasinskiene
and
Johann Michael Köhler
*
Department of Physical Chemistry and Microreaction Technologies, Institute for Chemistry and Biotechnologies, Technische Universität Ilmenau, 98693 Ilmenau, Germany
*
Author to whom correspondence should be addressed.
Appl. Sci. 2020, 10(23), 8353; https://doi.org/10.3390/app10238353
Submission received: 3 November 2020 / Revised: 20 November 2020 / Accepted: 22 November 2020 / Published: 24 November 2020
(This article belongs to the Special Issue Nanoparticles in Sensing and Labelling)

Abstract

:
Micro and nanoparticles are not only understood as components of materials but as small functional units too. Particles can be designed for the primary transduction of physical and chemical signals and, therefore, become a valuable component in sensing systems. Due to their small size, they are particularly interesting for sensing in microfluidic systems, in microarray arrangements and in miniaturized biotechnological systems and microreactors, in general. Here, an overview of the recent development in the preparation of micro and nanoparticles for sensing purposes in microfluidics and application of particles in various microfluidic devices is presented. The concept of sensor particles is particularly useful for combining a direct contact between cells, biomolecules and media with a contactless optical readout. In addition to the construction and synthesis of micro and nanoparticles with transducer functions, examples of chemical and biological applications are reported.

1. Introduction

The development of micro and nanoparticles is not only motivated by the desire for new materials, but mainly driven by particle-specific functional properties. Functional micro and nanoparticles are more than parts of a material but can be applied as miniaturized individual system components. These tiny objects can connect classical features of a new material with the ability to act like a miniaturized device. Thus, the receiving of signals, signal transduction and emission are tasks which can be carried out by particles with transducer properties [1]. Particularly interesting is the search for particles which are able to serve as localized sensors for conversion of chemical or biomolecular information into a physically readable signal for contactless transmission.
A special need for small-sized sensors arises from the development of microreaction technology and microfluidic systems for chemical and biological applications [2]. These devices work with the smallest volumes of liquids typically in the sub-microliter as well as the nanoliter range [3]. For local measurements in such fluidic systems, conventional chemical sensors and analytical devices are much too large and, therefore, not applicable. The analytical or sensing tasks in such systems demand for transducers in the dimensions between parts of a millimeter down to the micrometer or nanometer level.
At first sight, the miniaturization seems to be connected with difficulties which are associated with the shrinking of geometric dimensions. However, the introduction of particle-based transduction opens new possibilities, too. These are related to the special functional properties of the applied particles and the fact that specific physical effects can become usable for the conversion of signals in the lower micron and, in particular, in the nanometer range. This concerns, for example, size- and shape-dependences of optical properties of particles offering advantages for surface-enhanced Raman scattering (SERS) or so-called plasmonic sensing [4]. In addition to microchambers, microchannels and microreactors, the implementation of miniaturized sensors in microdroplets is particular challenging. During recent years, it could be shown that micro and nanosensor particles are well suited for the read-out of analytical information from tiny droplets [5] and microfluid segments [6].
This review provides an overview of the development of synthesis of micro and nanoparticles with transducer properties and application of these particles in microfluidic systems. Moreover, the principles of microchannel-based and capillary-based microfluidic devices and examples of their application in the synthesis of organic, inorganic particles or various composed nanoparticles are discussed.

2. Construction Principles of Sensor Particles

Many conventional large-scale synthesis methods suffer from low efficiency of reactant loading and deficiency of flexibility for tuning parameters of the fabrication. Moreover, due to poor control over mixing and nucleation conditions, it is difficult to form reproducible nanoparticles by conventional bulk synthesis. In recent decades, usage of microfluidic systems has created the ability to fabricate nanoparticles with better control of size distribution, improved reproducibility, high encapsulation efficiency, low sample/solution consumption, high surface to volume ratio, efficient mixing and better control of mass and heat transfer [7]. Generally, the microfluidic technique handles and controls liquid at the microscale; therefore, nanoliter or even smaller volumes [2] of fluids can be precisely mixed, and the chemical reactions take place in short time and space scales. A comparison of microfluidic and conventional bulk synthesis is presented in Table 1.
Microfluidic devices offer several advantages for the production of polymer, polymer composite and metal particles. By using them, the improvement of the particle size, its shape, morphology, composition and size distribution can be achieved. In order to prepare emulsion of a liquid monomer, two different strategies can be used (Figure 1). In the first strategy, fluids of continuous and dispersed phases flow inside microchannels and both are in direct contact with the device’s wall. Another strategy describes capillary-based devices, where continuous phase flows inside a tube around a dispersed phase, which is applied by a smaller capillary in the way that the diameter of the formed droplets is much smaller than the channel diameter [8]. In both cases, the device material (hydrophobic for hydrophilic droplets or vice versa) must be carefully selected or modified to reduce a desired wall contact or a phase inversion.
The most popular microfluidic geometries used for emulsification in microchannel-based devices include a T-junction and a flow-focusing unit. In the T-junction configuration, the dispersed phase reaches the continuous phase perpendicularity in the way that shear forces elongate the dispersed phase. Formed segment transforms into a sphere because of interfacial tension. The mechanism of breakup (dripping, jetting) and the droplet size depend on the aspect ratios of the widths and height of the channels or the nozzle, respectively; the flow rates of the two fluids; their viscosities; and the interfacial tension between them and the nozzle materials. Devices for flow-focusing are based on the hydrodynamic focusing technique, in which a stream of one fluid is focused using the flow of another, immiscible fluid by a high flow rate ratio. Generically, they consist of three parallel inlet channels: the continuous phase flow in two side channels and the middle microchannel is for the dispersed phase. A small orifice is placed in front of the middle channel where the thread of dispersed phase breaks up into small droplets. The mechanism of breakup depends on the geometry of the junction and the ratio of flow rate and properties of the fluids [3].
The most common capillary-based devices types are: the co-flow, the cross-flow and the flow-focusing capillary devices. In the co-flow configuration, two coaxially aligned fluids (the dispersed and continuous phases) flow in the same direction. The characteristic of the cross-flow device is that the fluid of dispersed phase flows perpendicularly to the continuous phase flow’s direction. In the flow focusing device, drops are created by hydrodynamic focusing, where the continuous phase pinches the stream of dispersed phase, which breaks into droplets [8].
According to the reacting phases, the microfluidic devices for synthesis are categorized as a single-phase, laminar flow or segmented flow microfluidic systems. Flow of single-phase laminar flow devices is characterized by the very low Reynolds numbers; therefore, the parabolic profile of fluid velocity vectors dominates. Due to the turbulence-free condition in continuous-flow microfluidic devices the mixing is slow and accomplished only through molecular diffusion, which is controlled in space and time. For this reason, it is possible to determine controlled reaction–diffusion (RD) experiments. In order to produce homogeneous mixtures and improve the mixing processes, so-called chaotic micromixers can be used for inducing complex flow pattern by consistently folding the laminated flow with split and recombine units [3,9].
Segmented flow microfluidic systems mix reagents via advection by a flow-induced segment-internal circular fluid motion, which can provide a fast homogenization process down to the sub-millisecond time scales. Typically, the mixing process is completed in the channel of capillary where the droplet travel length to channel width ratio is 20. Nevertheless, mixing in a segment can be increased by applying zig-zag channels, which enhance the mixing by sharp turns of the flow. Additionally, mixing can be programmed and multiple reactions can be synchronized in order to fabricate core-shell particles and crystals [10].
In addition to the variety of different conventional batch synthesis and microfluidic synthesis, the hole mask colloidal lithography method can be applied for fabricating uniform nanoparticle arrays. Additionally, for simple and rapid formation of metal structures, physical vapor deposition followed by a rapid thermal annealing (RTA) can be applied. Unfortunately, structures formed using RTA feature poor homogeneity and broad size distribution. A summary of the methods used for fabricating sensor particles is presented in Table 2.

2.1. Preparation of Sensor Particles in Microfluidic Systems

By using the microfluidic technique, various nanoparticles such as organic, metal, oxide nanoparticles and composites of organic–inorganic nanoparticles can be produced in reproducible and controllable manner. Additionally, during microfluidic synthesis, particles surface can be functionalized with different functional groups; hence, particles have unique physical and chemical properties [2].
With application of continuous single flow systems for multistep reactions, the agents for reaction can be easily added and precisely controlled. Santamaria’s group [11] presented a multistep continuous single-phase microfluidic system for synthesis and functionalization of gold nanorods. By using this platform, formation of seeds and different stages of nanorod growth were separately controlled. Due to this, the reproducibility and quality of the particles were improved. Additionally, the amount of poly-(ethylene glycol)-methyl ether thiol (SH-PEG) used for surface functionalization was reduced 100 times in comparison to batch process. In addition, the microfluidic system was used for tuning the concentration of halide (chloride and bromide) ions at various stages of synthesis. Variable ion concentrations influenced the final nanorods’ aspect ratio and accordingly the optical properties of nanorods.
By utilizing continuous-flow systems, nanoparticles can be synthesized with better reaction conditions control, fast heat and mass transfer as well as high reproducibility [9]. Knauer et al. [12] presented a segmented flow method for fabrication of noble metal core/shell and multishell nanoparticles in colloidal solutions. The particles were synthesized by reduction of HAuCl4 and AgNO3 salts at the surface of seed particles by ascorbic acid. An improvement of the particle quality was achieved due to the efficient reactants mixing in droplets because of internal convection. It led to a narrower size distribution and lower particle diameter in comparison to the particles produced by conventional batch synthesis. The average diameter and distribution half width size were 20 and 3.8 nm for Au/Ag core/shell as well as 45.6 and 7.4 nm for Au/Ag/Au multishell nanoparticles. It was demonstrated that plasmonic resonance shifted effectively due to the formation of core/shell structures. Therefore, prepared core/shell particles could be used for sensing and labelling applications.
Wacker et al. [13] presented droplet-based polydimethylsiloxane (PDMS) microfluidic chip for synthesis of silica nanoparticles, whose diameter was controlled via reaction time and reagent concentration. Silica nanoparticles were synthesized by the Stöber method and functionalized with fluorescein-isothiocyanate (FITC) fluorescent dye. When compared to a bulk process, it was shown that the growth speed of nanoparticle was higher in the droplet-based synthesis. For that reason, it was possible to control the size of the nanoparticles over a wider range and much faster. As a result, improvement of nanoparticle size uniformity was seen due to 3% relative standard deviation for 350 nm silica nanoparticles. Moreover, photobleaching of functionalized nanoparticles with FITC was slower in comparison to the photobleaching of pure fluorescein isothiocyanate in water. Despite high controllability of nanoparticle size, particle production rate was relatively low.
L. Zhang et al. [9] demonstrated a promising approach to synthesize silver nanocrystals with controlled size and shape in droplet-based microreactors. During a seed-mediated synthesis, the nanocrystals were formed from seeds in the way that every seed evolved into the nanocrystals. A gas–liquid droplet microreactor was used for droplet generation (Figure 2). The device consisted of three syringes, which were filled with air, seed solution (Ag seeds and polyvinylpyrrolidone (PVP) in ethylene glycol (EG) solution) and precursor solution (AgNO3 and PVP in EG). The air segments created by using a droplet microreactor were important not only for separating the reaction solution but also for providing O2, generating reducing agent. Due to this, homogeneous nucleation and unwanted merging of the single seeds were prevented. It was demonstrated that by varying the amount of seeds or the time of the reaction, or AgNO3 concentration in the segments, edge lengths of Ag nanocubes could be tuned from 30 to 100 nm. Additionally, Ag octahedras were synthesized by reducing the concentration of PVP in the segments. However, the limitation of the presented method was associated with limited syringe volume because continuous flow must be interrupted for reagent reloading.

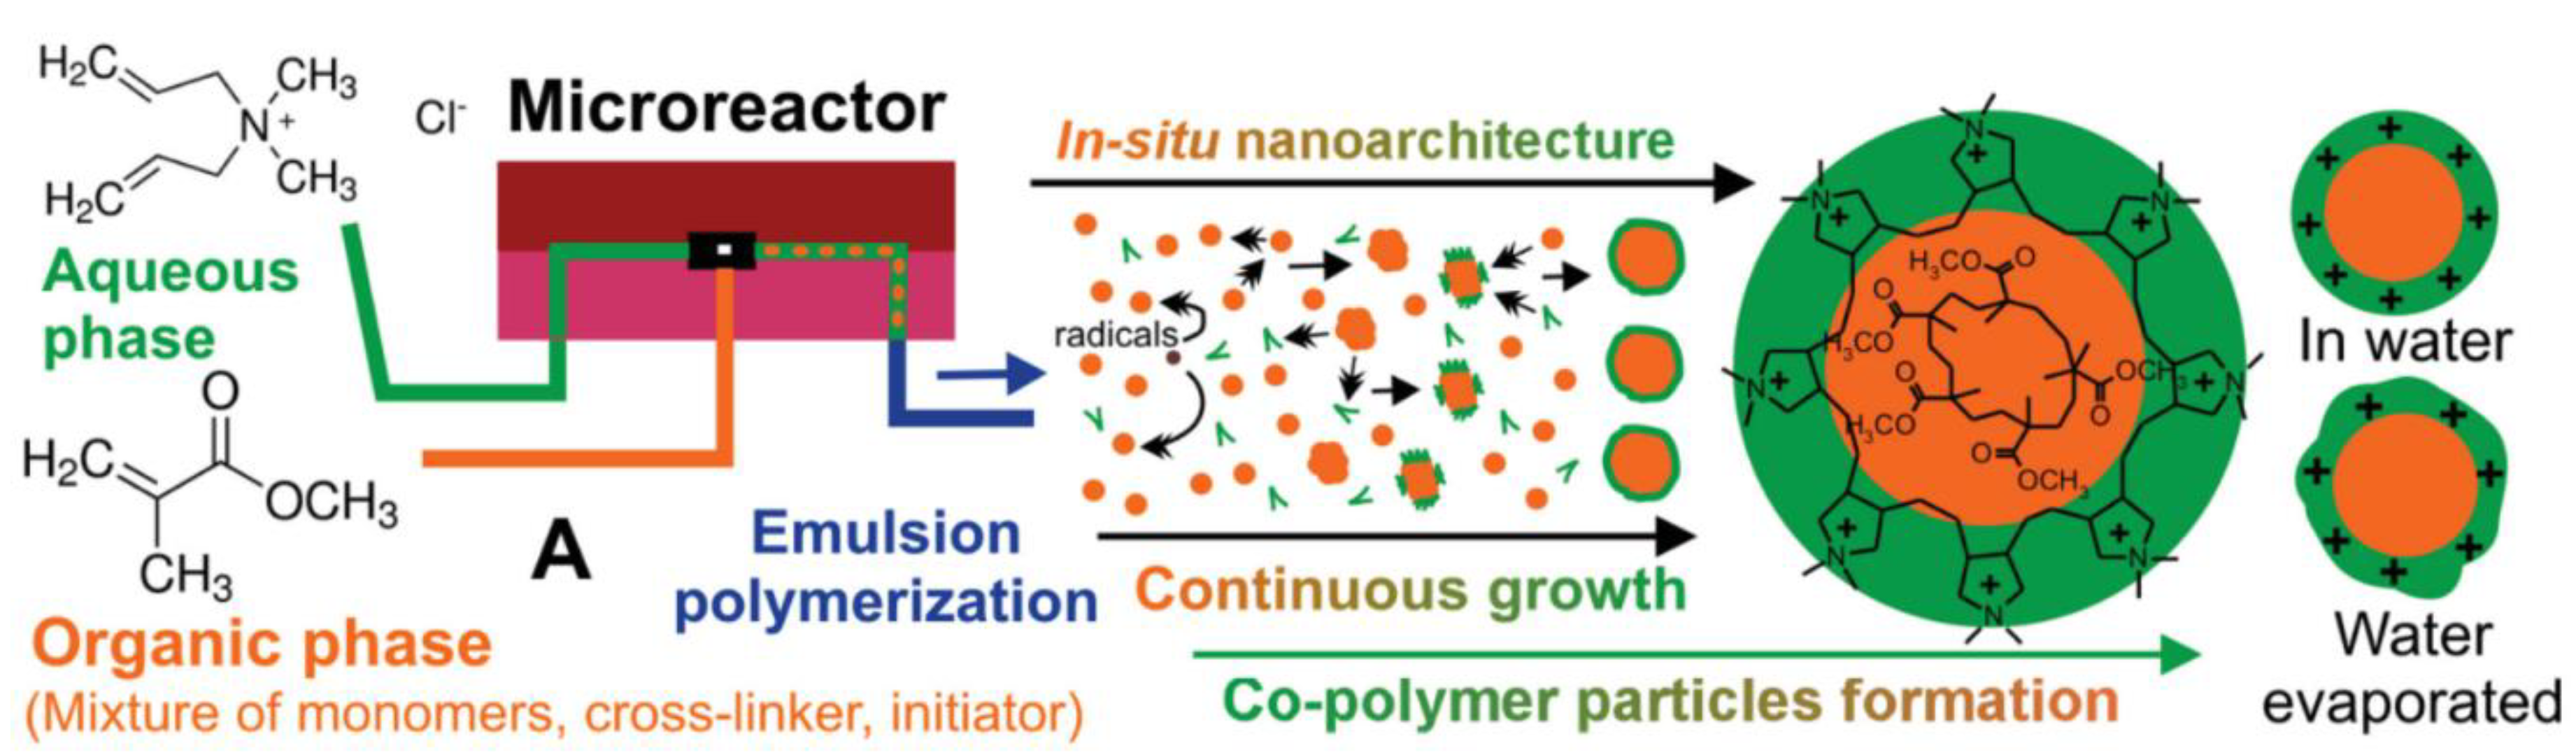
2.2. Polymer and Hydrogel Particles with Embedded Sensor Dyes

Fluorescent nanosized sensors are the most attractive for sensing purposes. Some materials (quantum dots and fluorescent proteins) show intrinsic fluorescence, but more often, NP fluorescence is created as a result of immobilization of fluorescent or phosphorescent dyes. In order to obtain extrinsic fluorescence, the particles need to incorporate one or more fluorophore dyes on its surface or inside the matrix by entrapping physically or via covalent attachment. Fluorescence sensing is based on changes in fluorescence signals due to fluorescence component interaction with an analyte molecule [1].
Generally, pH-sensor particles consist of two essential parts: a polymer matrix which has appropriate adhesive properties and a pH-indicator, which can be immobilized inside the particle matrix or on the particle surface. D. Aigner et al. [21] presented pH-sensors that consisted of 1,4-diketopyrrolo-[3,4-c]pyrroles (DPPs) as a pH-sensitive dye. As the immobilization matrices, different polymer hydrogels were used in order to achieve high sensitivity, brightness and wide operational range from pH 5 to 12. For the preparation of sensor nanoparticles, 100 mg of positively charged acrylate polymer Eudragit RL100 was dissolved in 50 mL of acetone. Later, indicator dye (DPP) and Macrolex Yellow (1.25 mg) were added with 300 mL of water. By rotary evaporator, acetone was removed from the solution and the particle suspension was prepared. Two fluorescence quenching mechanisms were associated with the ability of DPP indicators to change fluorescence properties in different pH media. Due to the deprotonation of phenolic group, the photoinduced electron transfer (PET) dominated from pH 5.9 to 9.3. The deprotonation of DPP core (lactam nitrogen) occurred at higher pH media (9.7–11.6). Unlike the static planar sensors, which were limited to short-time applications, it was possible to use sensor beads dispersed in the sample for applications in microfluidic systems, fluorescence imaging or microscopy.
Another example of fluorescent pH nanosensors was presented by S. M. Borisov et al. [22]. Sensors were prepared by staining the poly(styrene-block-vinylpyrrolidone) (PS-PVP) beads with pH dyes consisted of fluorescein and 1-hydroxypyrene-3,6,8-trisulfonate derivatives. By changing substituents on the pH indicator, it was possible to modify the pH-sensing properties. Lipophilic fluorescein derivatives were easily immobilized into the PS-PVP particles without any dyes leaching. This made various beads promising for application in biotechnology and many other fields.
For ratiometric pH imaging, M. P. Gashti et al. [14] reported silver core–silica shell (Ag@SiO2) nanoparticles covalently incorporated with fluorescein isothiocyanate (FiTC) fluorophore. The pH-sensitive sensor nanoparticles were made in two steps. First of all, the seed-growth method of reduction for silver nitrate by sodium citrate was applied for formation of metallic cores with an average size of 80 nm. Secondly, tetraethylorthosilicate (TEOS) was co-condensed with a silanized molecule of fluorescein isothiocyanate (FiTC-APS). In this study, fluorescein was used as a pH indicator because its spectroscopic properties (absorption spectra and fluorescence quantum yield) depend on the pH. By varying the pH value, fluorescein can be in protonated or negatively charged forms and, therefore, applied for quantitative pH measurements.
Oxygen sensitive dyes are usually embedded in the polymer matrix in order to form sensor particles or oxygen sensitive layers. Monodispersed fluorescent platinum octaethylporphyrin-polystyrene (PtOEP/PS) spheres for oxygen monitoring were presented by K. Zhang et al. [15]. Fluorescent PtOEP/PS particles, whose size varied about 251–384 nm, were prepared by a soap-free emulsion polymerization. It was shown that the fluorescence intensity significantly decreased with the increased dissolved oxygen concentration due to fact that PtOEP molecules fluorescence was quenched by dissolved oxygen, which could easily interact with dye because of porous PS particles structure. Moreover, PtOEP/PS sensors were stable, highly sensitive and showed a fast response time and linear dependence on dissolved oxygen concentration. After 3 months of the preparation of PtOEP/PS spheres, their photostability was investigated. PtOEP/PS particles were illuminated for 1 h under irradiation at 380 nm, and fluorescence intensity of PtOEP decreased only 2.2%. Photo-stability of PtOEP embedded in the PS spheres was much better in comparison to PtOEP in THF solution.
Oxygen nanosensor particles PS-PtTPTBP were used by J. Cao et al. [6] for non-invasive monitoring of oxygen during growth of bacteria. For the preparation of polystyrene (PS) nanoparticles doped with oxygen-sensitive dye PtTPTBP, first PS particles were synthesized from styrene/water mixture and K2S2O8 under temperature control. After the dialysis process, a suspension of nanoparticles was dispersed in methanol/water (2:1) solution and then PtTPTBP, dissolved in chloroform, was added. The mixture was shaken for 4 h and afterwards filtrated and dialyzed. Produced particles were 357 ± 53 nm in size.
Core−shell poly(styrene-block-vinylpyrrolidone) (PSPVP) particles were synthesized by J. Ehgartner et al. [23]. For simultaneous detection of O2 and pH, the oxygen indicator (PtTPTBPF) was embedded in the core and a pH sensitive BF2-chelated tetraarylazadi-pyrromethene dye (aza-BODIPY) and antenna dye (Zn-Schiff base), which was used for enhancement of brightness, were incorporated into the shell of the particle. Ideally, all dyes should be embedded into a single particle but due to interactions between dyes and their migration in the core and shell, it was not achieved. Therefore, nanoparticles embedded with oxygen and pH sensitive dyes were prepared separately and mixed together for m-DLR measurements.
In addition to pH, oxygen monitoring, the detection of organic molecules and inorganic ions are also very important for chemical analytics. Therefore, fluorescent micro and nanoparticles are widely used for local chemical sensing. For detection of chloride ions, K.P. Kronfeld et al. [16] synthesized polyacrylamide hydrogel particles loaded with lucigenin dye due to the fact that its fluorescence is quenched by chloride ions. The continuous flow synthesis of hydrogel sensor particles is shown in Figure 3. For droplets generation, a monomer and photoinitiator mixture was injected into the carrier phase (silicone oil). After the formation, droplets were irradiated under UV light, which initiated a free radical polymerization of hydrogel particles. Particles were produced with narrow size distribution and an average size of 800 μm. After washing and drying, the size of particles decreased by up to 480 μm. Dry particles were added to the aqueous solution of lucigenin for swelling. After the lucigenin was immobilized into the polyacrylamide matrix, particles were dried again and used for chloride ion detection. It was demonstrated that swelling of sensor particles inside a chloride-containing aqueous solution dramatically influenced the fluorescence quantum yield. Due to the chloride ions, fluorescence intensity decreased in the swollen part of the particle.
J.P.Lafleur et al. [17] reported a microfluidic sensor for the fast detection of environmental contaminants. The heavy metal Hg and the pesticides ziram were detected by using fluorescent gold nanoclusters and particles. First of all, AuNPs were synthesized by the Frens–Turkevich method [24]. Then AuNPs were embedded with Rhodamine 6G (R6G), whose fluorescence was quenched when dyes molecules were adsorbed on the surface of AuNPs. Additionally, a 180 mm long meandering channel ensured proper mixing conditions. In order to avoid aggregation of AuNP, the optimal quantity of R6G was found and used for preparation of sensor particles.

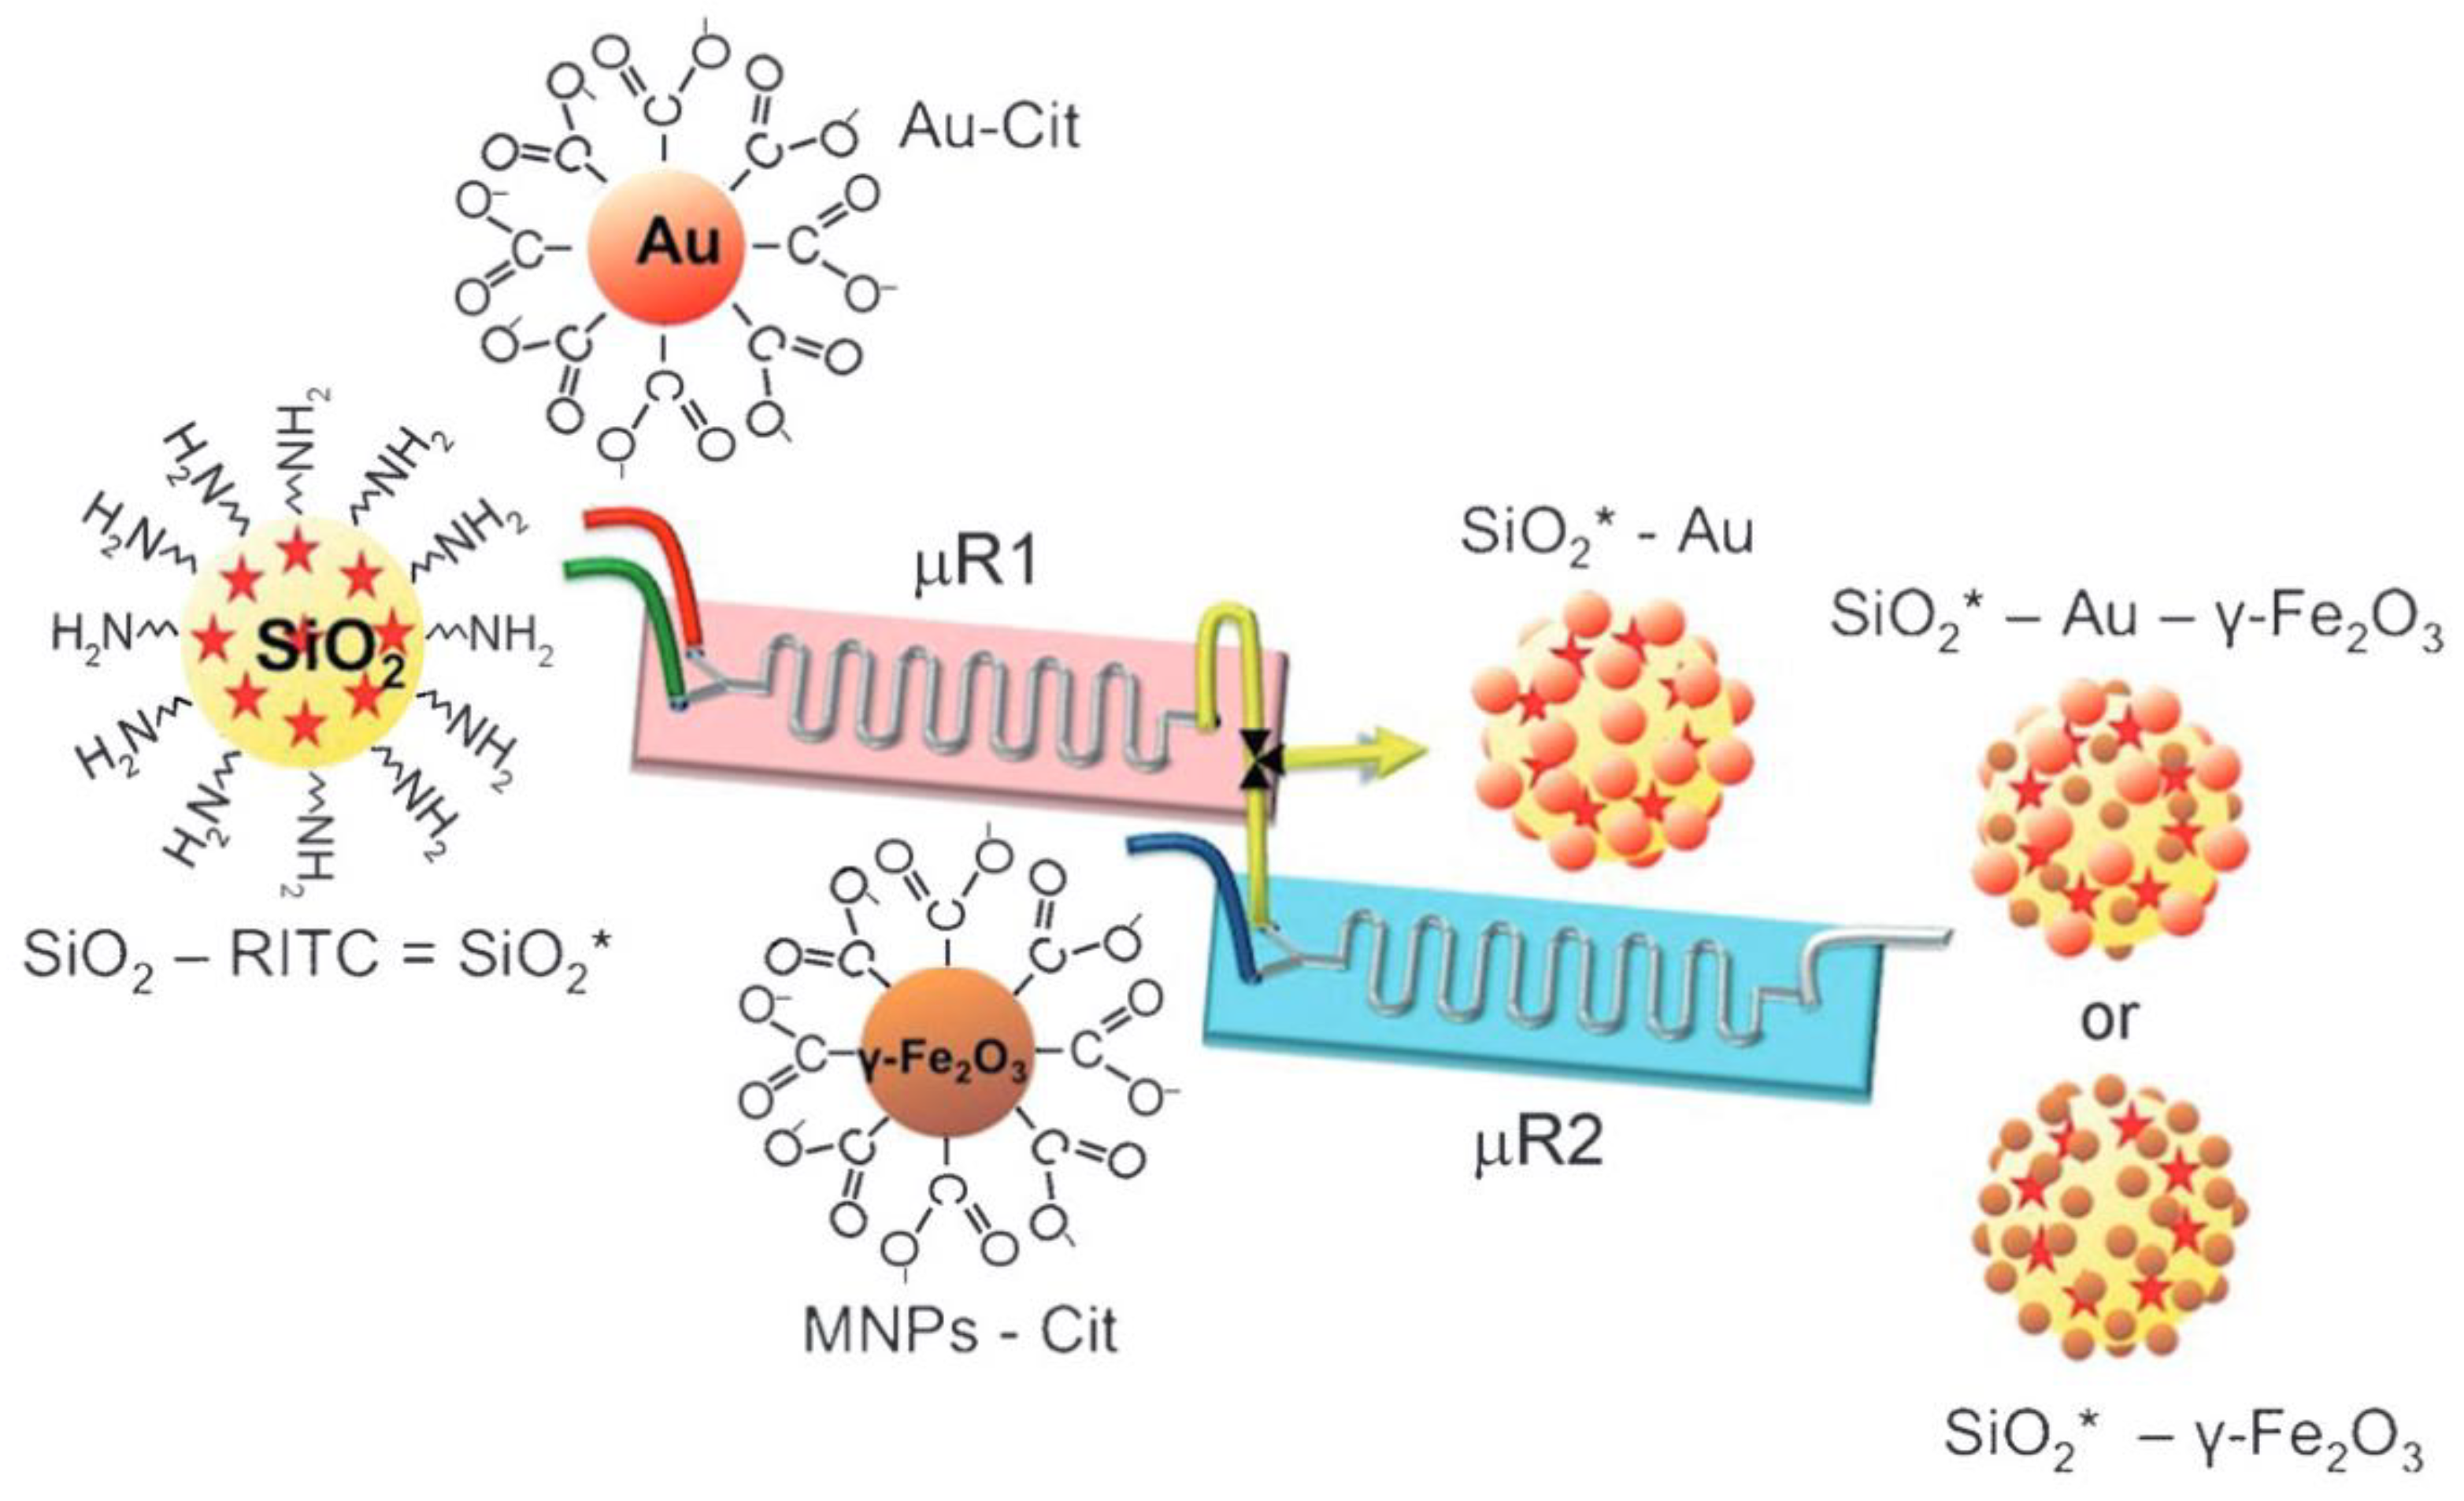
2.3. Preparation of Composite Particles

There are several motives for assembling particles for sensing. Sensor NPs can be densely packed into a swellable or nanoporous matrix by forming submicron- or micrometer-sized sensor particles. The preparation of metal/polymer micro and nanoparticles for SERS sensing gives a higher sensor signal because a large amount of small metal particles is incorporated in the composite [1].
J.M. Köhler et al. [25] applied a microcontinuous-flow process in order to prepare hydrogel and silver nanoparticle composites. First of all, silver seed particles were formed in microsegmented flow by reducing silver nitrate via sodium borohydride. Then, silver seeds were used to fabricate silver nanoprisms by using ascorbic acid and silver nitrate. Prepared silver nanoprisms were mixed with an acrylamide monomer, cross-linker and photoinitiator, and droplets were generated in micro co-flow arrangement when polydimethyl-siloxan was used as a viscous carrier phase. The composite particles were produced by a photopolymerization step under UV irradiation. By applying microfluidic synthesis, high reproducibility and narrow size distribution of particles were achieved. Furthermore, washed composite particles were mixed with silver nitrate and ascorbic acid solution for nanoparticle-catalyzed silver deposition on the particle surface in order to improve sensitivity for SERS sensing.
Visaveliya et al. [26] reported the microfluidic assisted formation of nanoassembly particles. In this robust approach, PMMA-polyDADMAC/gold (Au) nanoassemblies were formed under a flow condition. For formation of copolymer nanoparticles, the microflow-through platform was applied (Figure 4). Therefore, the particle size was tunable in the range of 200 nm–1 μm by varying the flow rate ratio and concentrations of monomer and carrier phases. The formation of nanoassemblies was based on electrostatic adsorption of negatively charged 30 nm size Au nanoparticles were attracted on the surface of the positively charged polymer particle. In order to improve SERS sensing properties, Ag deposition in the presence of silver precursor and reducing was initiated by the adsorbed AuNPs on the composite particle. Formed PMMA-polyDADMAC/Au/Ag composite was used for adenine sensing. Due to the small size, sensor particles could be applied for SERS sensing not only in the batch condition but also in the flow arrangement.
N. Hassan’s group [27] reported a two-step microfluidic assisted self-assembly formation of plasmonic, fluorescent and magnetic nanostructures. Rhodamine isothiocyanate (RITC) doped silica particles, superparamagnetic γ-Fe2O3 nanocrystals and gold NPs were self-assembled under continuous flow in the microfluidic system that consisted of two Y-shaped microreactors made from glass (Figure 5). Due to the fact that the assembly processes are dynamic, the desired structures can be obtained by varying flow rates of fluids and residence time. By comparing the assemblies prepared in microfluidic process and in bulk conditions, it was demonstrated that the lower density of Au NPs on silica nanoparticles surface was found in bulk. As a result, the high potential of microfluidics in nanoparticle synthesis for imaging purposes was achieved.
A second motivation for assembling can be given by combination of sensor signals. E. Scheucher et al. [28] prepared multifunctional composite particles that combined oxygen sensing, magnetic and luminescence properties. Luminescence-based composites for the oxygen sensing consisted of the matrix material (PPSQ), upconverting nanoparticles (UCLNPs), magnetic nanoparticles (EMG1300), mediator dye (MFR) and a dye with far-red emission (PtTPTBP). All components were swollen and dissolved in chloroform (Figure 6). After solvent evaporation, the mixture was heated for 4 h at 230 °C temperature. After, the bulk material was grinded in order to achieve the sensor particles. Formed composite particles had a characteristic luminescence upconversion feature. Under 980 nm laser excitation, particles emitted 545 nm light, which was absorbed by the mediator dye (MFR) and then non-radiatively transmitted to the PtTPTBP. The quenching of this indicator dye is strongly dependent on the oxygen concentration. Therefore, it was possible to apply sensor particles for quantitative oxygen detection in gaseous and dissolved form. Magnetic particles enabled another important feature—the ability to locate particles in a certain position and separate sensor particles from the sample by applying an external magnetic field.
The combination of different NPs inside a composite particle can also be useful for labelling purposes. S-P. Chen et al. [29] presented microfluidic immune assay, which was based on the shell/shell/core structured nanocomposite. For this purpose, super-paramagnetic iron oxide nanoparticles (“SPIONs”) were particularly interesting. The entire preparation procedure of Au/chitosan/Fe3O4 involved three crucial steps. Firstly, microwave-assisted solvothermal reaction was used for fabrication of magnetic microspheres. Secondly, magnetic microspheres were coated with the chitosan particles in order to design a shell–core structure. Thirdly, solutions of chitosan/Fe3O4 and Au colloid were mixed together under stirring, and the final shell/shell/core structure was formed. Due to the incorporated magnetic particles (Fe3O4), it was possible to handle and control composite sensor particles with external magnetic field. Additionally, assembled colloidal gold nanoparticles created an ability to immobilize a hemoglobin-A1c antibody (HbA1c mAb). Prepared composite nanoparticles with immobilized antibody were used in microfluidic systems for process controlled and low-volume detection of hemoglobin A1c.

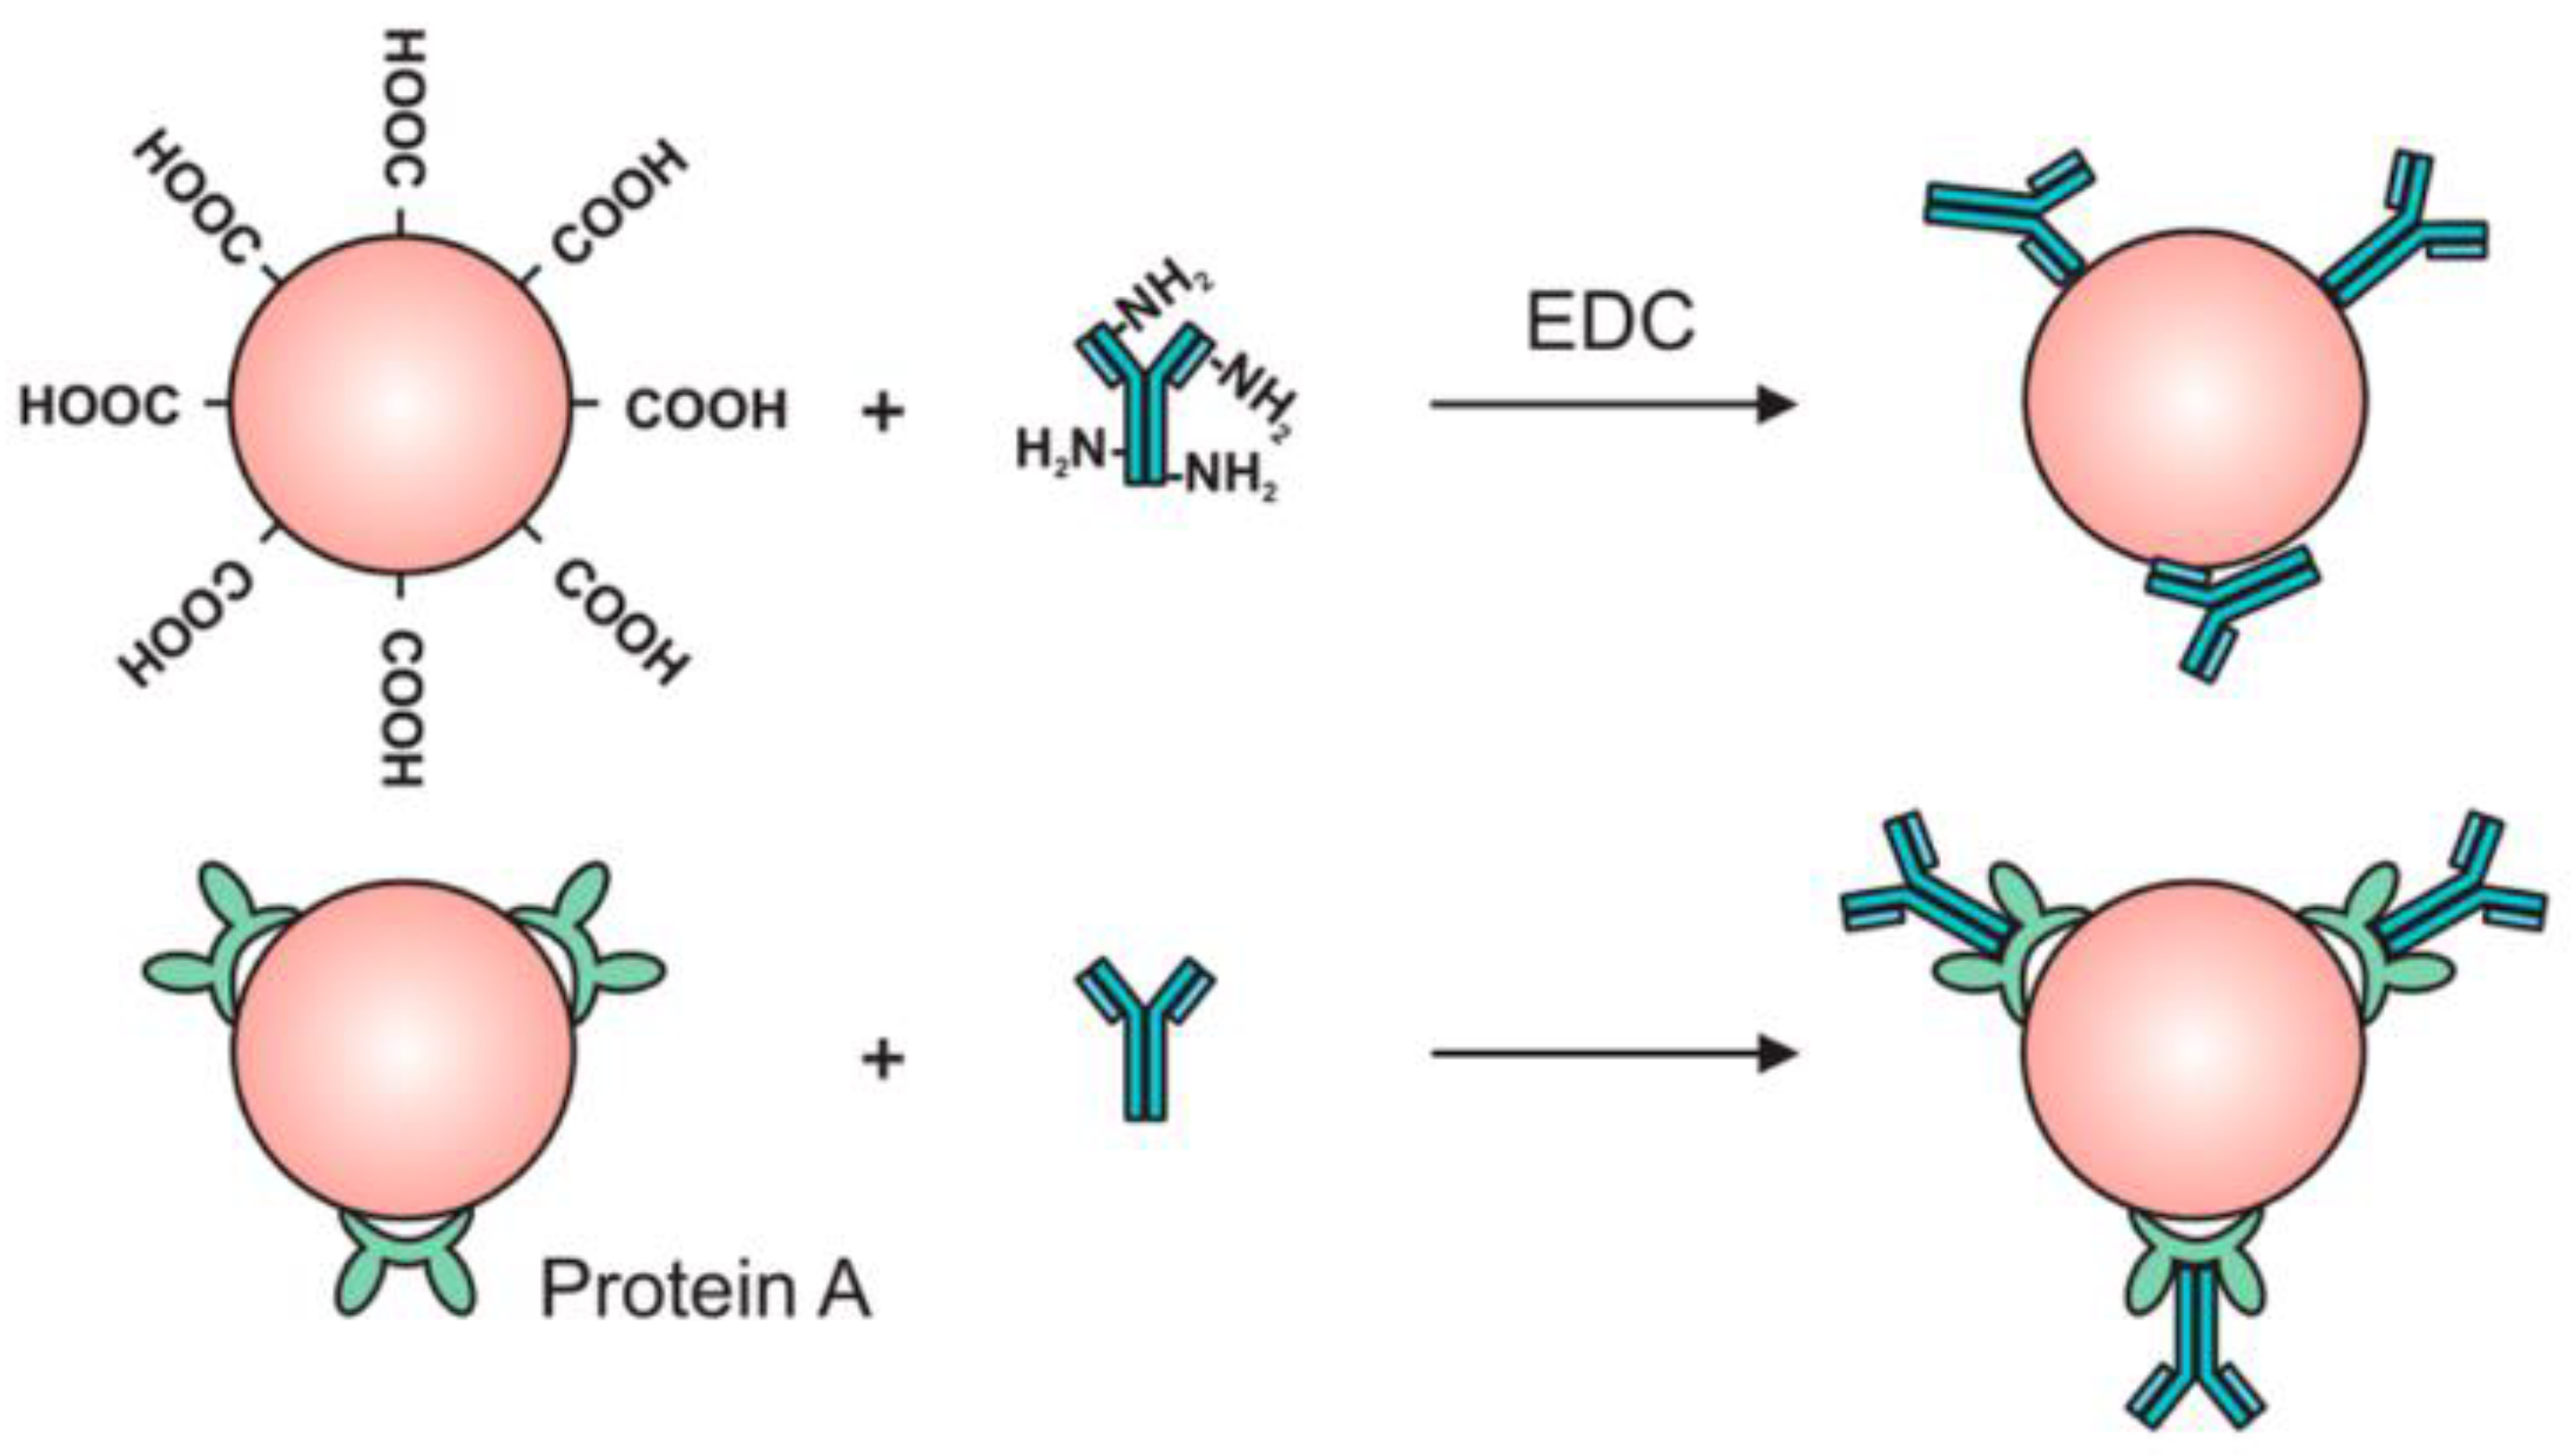
2.4. Preparation of Microcapsules

Multifunctionalized polymer microcapsules, which had a monitoring property of intracellular environments, were presented by G. B. Sukhorukov et al. [30]. Moreover, it was demonstrated that microcapsules can encapsulate a large variety of molecules such as enzymes, proteins and drugs and release encapsulated compounds in a controlled manner upon an external trigger. Functionalization of nano and microcapsules with luminescent cadmium telluride (CdTe) QDs quantum dots gave the ability to facilitate imaging and labelling of various capsules. For the formation of capsule-based pH sensor, pH indicator dye (SNARF-1) was encapsulated via covalent bonding. The knowledge of local pH values gave important information of cell activity for the reason that changes in the pH were associated with numerous enzymatic reactions and many metabolic processes. Additionally, capsules were targeted to desired cells by applying different surface coatings. Incorporation of magnetic Fe3O4 nanoparticles into capsule shells allowed the control of the microcapsules by applying external magnetic field. It was shown that microcapsules containing embedded magnetic nanoparticles can be transported with a magnet and be carried to a particular place inside a living cell. Then, the microcapsules were activated or opened to release encapsulated molecules by the laser-induced remote, which gave the possibility to deliver compounds into the cell with precise control.
In order to detect proteins and nucleic acids, S. K. Verma et al. [31] developed a microcapsule-based assay that featured simplicity, selectivity and sensitivity. Four layers of polyallyllamine hydrochloride (PAH) and polyacrylic acid (PAA) were sequential deposited by electrostatic forces on the 6 μm size CaCO3 particle to form the (PAH/PAA)2 microcapsules. 1-ethyl-3-(3-dimethyl-aminopropyl) carbodiimide (EDC) was used to covalently cross-link carboxylic groups of PAA to amine groups of PAHs. By coating the surface of microcapsules with protein A or streptavidin, it was possible to further attach a target biomolecule—for example antibodies, biotinylated oligonucleotides or MHC class I proteins. Prepared microcapsules were stable and did not aggregate under storage or experimental conditions. The detection was carried out on the surface of the microcapsule, when the analyte was squeezed in between a binder and a detector molecule. For evaluating the assay’s sensitivity and selectivity, biomarker protein (hβ2M) and oligonucleotide molecules were used as analytes. As a result, the assay was highly sensitive to hβ2M in the concentration range from picogram/L to nanogram/L, despite the presence of irrelevant proteins (streptavidin and conalbumin) in the sample. Moreover, it was shown that biotinylated ligands were strongly bound to the streptavidin-coated (PAH/PAA)2 capsules.
T. A. Kolesnikova et al. [32] reported a method for enhancing the targeting of cell surface receptors by applying biofunctionalization of polyelectrolyte (PAH/PAA)2 microcapsules. In this study, two antibody immobilization strategies on the (PAH/PAA)2 microcapsule surface were compared (Figure 7). In the first case, the specific cell-targeting antibodies were immobilized randomly due to direct covalent coupling of the amino groups of an antibody to the carboxyl groups of a microcapsule surface via EDC/sulfo-NHS reaction. In the second case, before antibody immobilization, microcapsules were coated with protein A, which formed a supporting layer for more effective and optimized coupling of antibodies. The cell surface MHC class I receptors were chosen for a selective binding to antibody-functionalized (PAH/PAA)2 microcapsules. It was found that the targeting efficiency of MHC class I receptors increased by 40–50%, when the antibodies were immobilized on the protein A-coated microcapsules. Moreover, used microcapsules revealed a low cytotoxicity and reduced non-specific binding.

2.5. Metal Particles for LSPR-Based Sensing

Surface plasmons resonance (SPR) is a resonant oscillation of the incident light wave with the oscillations of charge density at metal and dielectric media interface [4]. For metallic rough surfaces, nanoparticles and sharp tips surface plasmons are thought to be confined in the nanoscale location by forming so-called localized surface plasmons resonance (LSPR), whose characteristic absorption band depends on species, size as well as shape of nanoparticles or metallic structures [33].
LSPR-based particle sensorics are promising for the detection of changes in the refractive index (RI), which are caused by the analyte binding [1]. Non-labelling detection is the main advantage of the LSPR sensor compared with other techniques such as an isotope labelling or fluorescence [34]. Moreover, LSPR-based biosensors have unique properties allowing biomolecular analysis at real-time and detection of antigen–anti-body interaction or DNA hybridization even when the concentration of analyte is very low [35]. The binding of analytes on the surfaces of Au and Ag nanoparticles causes the changes in the surrounding environment’s refractive index, which affects the spectroscopic properties (spectral shift or change in intensity) of the particle [35]. However, the LSPR signals can be affected by non-specific binding of molecules. Therefore, a sample for LSPR sensing should be pure and contain as little impurities as possible [34].
For practical purposes, colloidal gold or silver nanoparticles are embedded on the surface of solid material, where the laser light is usually used for excitation the LSPR. Then, optical setup collects the light, which is scattered by the sample [36]. Due to the fact that the plasmonic effects can happen only near the metallic nanostructures, whose sizes are in nanometer range, LPSR-based sensing can be integrated in microfluidic systems [1]. Examples of particles used in microfluidic systems for LSPR-based sensing are given in Table 3.
H. Sadabadi et al. [37] proposed a sensitive LSPR-based biosensor, which was applied for polypeptide detection. Using the proposed sensing system, the antigen–antibody interaction of bovine growth hormone was detected with the detection limit of 3.7 ng/mL as low as 185 pM; therefore, it was possible to use the biosensor for clinical applications. For LSPR sensing, gold nanoparticles were synthesized in a PDMS chip during an in-situ reaction between a gold precursor and polymer cross-linking agent. Despite the fact that the synthesis of the particles in microfluidic system was slower, formed AuNPs demonstrated 8.3 times better polydiversity of the size distribution. Four steps of the biosensing protocol are shown in Figure 8. Before performing the experiment, the gold nanoparticles were functionalized with 11-mercaptoundecanoic acid. After attaching a linker, the activation of the carboxyl groups was carried out and after it, the antibody was attached to the surface of the functionalized gold nanoparticle. In the last step, the antigen was attached by introducing the solution of bovine growth hormone into the microfluidic channel. The immobilization of bovine growth hormone onto AuNPs resulted in increased refractive index and changes in the LSPR spectra. However, in order to improve and restore the proposed microfluidic biosensor for further measurement, the device can be integrated with a pump system and flow cells for channel rinsing purposes.
Another microfluidic system for effective refractive index sensing was reported by B. Doherty et al. [38]. An integrated optofluidic system, which required a low sample volume and allowed a real-time monitoring of analyte, could be applied for non-invasive analysis and molecular diagnostics. Specific binding of molecules was sensed via plasmonic resonance shift of gold nanoparticles, which strongly depended on the changes in the environment’s IR. The efficient RI sensing was performed with a nanoparticle-functionalized suspended core fiber (SCF). The surface of interior channel was modified with amino groups in order to create adhesive layers for self-assembled monolayers of Au nanospheres. The nanoparticle layer deposition (NLD) technique was used to coat Au nanoparticles along the entire fiber channel length. The RI sensitivity measurements of various RI oils showed that, in the presence of the oil, LSPR shifted towards a longer wavelength. It was determined that the refractive index sensitivity of sensor was 170 nm/RIU for an aqueous analyte. In comparison to the sensitivity of similar gold nanoparticles dispersed in water, the proposed nanoparticle-functionalized fiber was 1.5 times more sensitive.
H. Bhardwaj et al. [39] presented a AuNP-based biosensor chip for Aflatoxin B1 (AFB1) sensing. Colloidal AuNPs were synthesized using the seed-mediated method [40]. Surface functionalization of AuNPs was modified by the solvent extraction-based ligand exchange method. First of all, CTAB surfactant was partially removed from the aqueous phase of AuNPs to immiscible organic solvent of dichloromethane. Second, complete replacement of CTAB to lipoic acid was achieved through direct chemisorption. For chemical conjugation of AuNPs with cystamine self-assembly modified SPRi chips, carboxylic functional groups from lipoic acid were activated by using EDC-NHS crosslinkers. After the formation of a self-assembled monolayer (SAM), chemically modified AuNPs were grafted over a SAM Au chip surface for 12 h. Unreacted AuNPs were washed out, and further modifications of SPRi chip were performed directly within the flow cell. After the activation of surface carboxylic acid groups, anti-AFB1 antibodies were immobilized. AuNPs/SAM/Au chips were used for AFB1 detection from 0.01 to 50 nM with a limit of detection of 0.003 nM. Immunosensor responded linearly with various AFB1 antigen concentration due to the binding of AFB1 molecules to immobilized anti-AFB1 at the surface of the sensor. AuNPs acted as signal amplifier and provided a larger area for immobilization of anti-AFB1 antibodies. It was shown that the AuNP integrated sensor chip was three times more sensitive than the SAM/Au sensor chip (15.72 RU/nM).
Y. Zhang et al. [35] reported an integrated platform combining microfluidic chips and an LSPR method for multiplexed and label-free protein analysis. By using a specially designed optical bench, it was possible to measure the extinction spectrum of the sample in the various regions. The different concentrations of Anti-gp41 antibody, biomarker for HIV/AIDS diagnosis, were investigated in the microfluidic chip with immobilized gold nanoparticles. Nonspecific adsorption of biomolecules was prevented by AuNPs modification with PEG-thiol. It was found that with the increase in the target molecule concentration, the LSPR peak intensity also increased. When comparing results with standard enzyme-linked immunosorbent assay (ELISA), it was shown that detection limits of both methods were similar, but a label-free sensing technique was faster and simpler. In this LSPR-based immunoassay investigation, the importance and effect of linker molecule length were investigated. When linker molecules stand up on the surface, they create a certain distance between the investigated molecule and the surface. Glutaraldehyde was used as the linker between the gp41 antigen and the sensor surface. By applying different linkers, the different thicknesses can be produced. As a result, detection sensitivity was enhanced by using linker molecules with longer spacer arms the due to reduced steric hindrance.
J. He et al. [18] introduced a 7-channel microfluidic device, which contained nanoparticle arrays, for detection of streptavidin. Photolithography was combined with hole-mask colloidal lithography in order to form homogeneous nanoparticle arrays with particle diameters of 130 nm and a height of 30 nm. Among the biggest advantages for using these methods was increased sensitivity over colloidal particles by patterning nanoparticle arrays of more asymmetric dimensions. It was possible to fabricate microfluidic devices with many channels in comparison to commercial SPR devices. In the same study, glass and PDMS plates, which contained 96 spots of nanoparticle arrays, were fabricated for sensing of protein binding. By using the 96-spot plate, it was possible to simultaneously measure the binding curves of six different protein pairs. After specific antibodies were coupled to nanoparticle arrays, the plate was dried in the room temperature and the reference LSPR spectra were measured. Then, varying concentrations of investigated proteins were added into different plate spots. After drying, the LSPR spectrum was measured, and the shift in LSPR wavelength due to binding of protein was determined. As a result, binding curves were generated, and the limit of detection (LOD) values were calculated.
Integration of an LSPR-based sensor and microfluidic chip was presented by C. Huang et al. [41]. An antigen–antibody (biotin/anti-biotin) interaction system was used to demonstrate the biological sensing by continuously measuring the transmitted light through the surface of a gold nanoparticle-coated sensor. Gold particles with a diameter of 14–43 nm were synthesized by sodium citrate reduction of chloroauric acid (HAuCl4) [42]. After, silane layer was used as molecular glue for immobilization of gold nanoparticles on the substrates. Further modification with a self-assembled monolayer (SAM) of thiols was performed in order to carry out the biological experiments. After the immobilization of biotin on SAM, the binding of anti-biotin antibody was detected with a detection limit of 270 ng/mL.
J.S. Chen et al. [20] presented an LSPR-based biosensor for label-free detection of inflammation-related biomarkers (IgG and CRP). In order to produce Au nanostructures, a thin gold film was deposited on the glass slide using the metallic physical vapor evaporation (PVD) coating technique, which was followed by a rapid thermal annealing (RTA) process. After RTA treatment, the color of the fabricated Au nanostructures changed to dark purple as a result of the LSPR effect. Despite simple and rapid fabrication, formed structures featured poor homogeneity and broad size distribution. The biosensor was integrated into an automated four-channel microfluidic system. For detection of antigens, channels of microfluidic device were functionalized with specific antibodies. Various concentrations of pure IgG antigen or CRP antigen solution were introduced into a sensing device, and specific antibody–antigen binding was investigated by measuring the LSPR absorbance spectrum and monitoring LSPR wavelength shift. It was shown that by using presented sensors, it was possible to detect 10 ng/mL concentration of both IgG and CRP antigens only in 60 μL of sample and in 3.5 h assay time.
Gold nanostructures, particularly spherical nanoparticles, are the most commonly used for LSPR-based sensing despite the fact that silver nanoparticles would give a better sensing performance. Gold nanoparticles are characterized by high stability, and even though silver particles show higher scattering efficiency, their long-time stability is relatively low. However, by forming gold–silver core-shell particles, it is possible to improve sensors’ sensitivity and stability [31].
Sensing potential of core–shell nanostructures was reported by A. Steinbrück et al. [43]. In this research, five different compositions of core–shell nanoparticles were presented, and their sensitivities towards changes in refractive index were investigated. The experimental findings were compared to theoretical calculation and accordingly, experimental results were supported by calculation. For preparation of core–shell NPs, first of all, Au nanoparticles, whose average diameters were 13 and 16 nm, were synthesized according to the Turkevich method [44]. Later, silver was deposited on the gold nanoparticle surface via an electroless deposition process using the solutions of reducing agent and silver salt. Formation of the Ag shell was proven by color change of the solution (from red to yellow). By varying the concentration of silver salt and reducing agent in the system, the desired thickness of silver shell was formed. It was found that Au–Ag core–shell particles with 2–4 nm shell thicknesses showed higher sensitivity than monometallic gold or silver nanoparticles. Therefore, the LSPR-based sensor could be improved by forming Au–Ag core–shell particles with a specific shell thickness. Due to the fact that optimal shell thickness depends on the range in which the refractive index changes, for different media, core–shell nanoparticles must be designed separately. For the regime interesting for biological application, where changes in refractive index varied from 1.33 to 1.37, the optimal thickness of Ag shell should be 4–5 nm on the 13 nm size gold nanoparticle core.
Due to the fact that the shape of the nanostructures influences the refractive index (RI) sensitivity, rough corners, sharp tips and edges enhance the local electrical field and can strongly affect the sensitivity. M. Thiele et al. [45] reported the synthesis of Au nanocubes for LSPR sensing application by using a PDMS microfluidic chip. Gold nanocubes were formed from growing gold seeds during a metal-catalyzed deposition of gold atoms, which were reduced by sodium borohydride. Growth of nanocubes was stopped and prevention from overgrowing was achieved by using centrifugation. In comparison to batch synthesis, it was found that Au seed particles, prepared using a single-phase or segmented flow microfluidic methods, were more homogenous and smaller. When sensitivity of the 80 nm Au nanoparticles and 78 nm Au nanocubes was compared, the huge effect of edges and corners was shown. Au nanocubes were 2 times more sensitive (with 202 nm/ RIU) then the Au nanoparticles.
T. Wieduwilt et al. [46] presented an LSPR sensor based on silver–gold nanoprism immobilization on the optical fiber taper. For the investigation, silver nanoprisms with a size of 40 ± 20 nm and thickness of 9 ± 2 nm were formed by combining synthesis of seed particle and nanoprism growth. The silver nanoprisms were reinforced with a thin gold layer to protect the nanoprism edge against etching. In order to reach a higher sensitivity, fiber optical taper needed to be coated with a dense nanoprism monolayer. It was demonstrated, when density of particles was approximately 210 particle/μm2, that adjacent particles interacted with each other and boosted the sensitivity. By comparing sensitivities of a hybrid plasmonic–photonic system with bulk solution, it was found that by using tapers with densely immobilized gold-reinforced silver nanoprisms, sensor sensitivity up to 900 nm/RIU was achieved due to interparticle interactions. When interparticle distance between nanostructures increased, sensitivity of the sensor decreased to 385 nm/RIU, which was similar to the sensitivity of a bulk solution.
An economical method to produce metal nanoparticles in a microchannel of glass substrates was proposed by Y. Liu et al. [19]. In this research, lithography and mask deposition techniques were combined in order to fabricate and firmly placed triangular silver NP arrays in line-shape and cross-shape microgrooves. A sensitivity test of an NP embedded microfluidic chip demonstrated that the LSPR feature of the triangular silver NPs was well maintained. Results of the extinction spectrum of air and water showed that the extinction peak shifted from 706.7 to 783.1 nm by changing the medium from air to water. As a result, sensitivity of the sensor was calculated to be 230.8 nm/RIU.

3. Application of Sensor Particles for Temperature, pH and Oxygen Measurements in Microfluidic Systems

The applicability and usability of microfluidic systems and devices can be increased by integrating various functionalities. The combination of microfluidic systems and unique optical, thermal, magnetic and electrical properties of particle is promising for a wide variety of applications. A list of sensor particles applied for temperature, pH and O2 sensing is presented in Table 4.

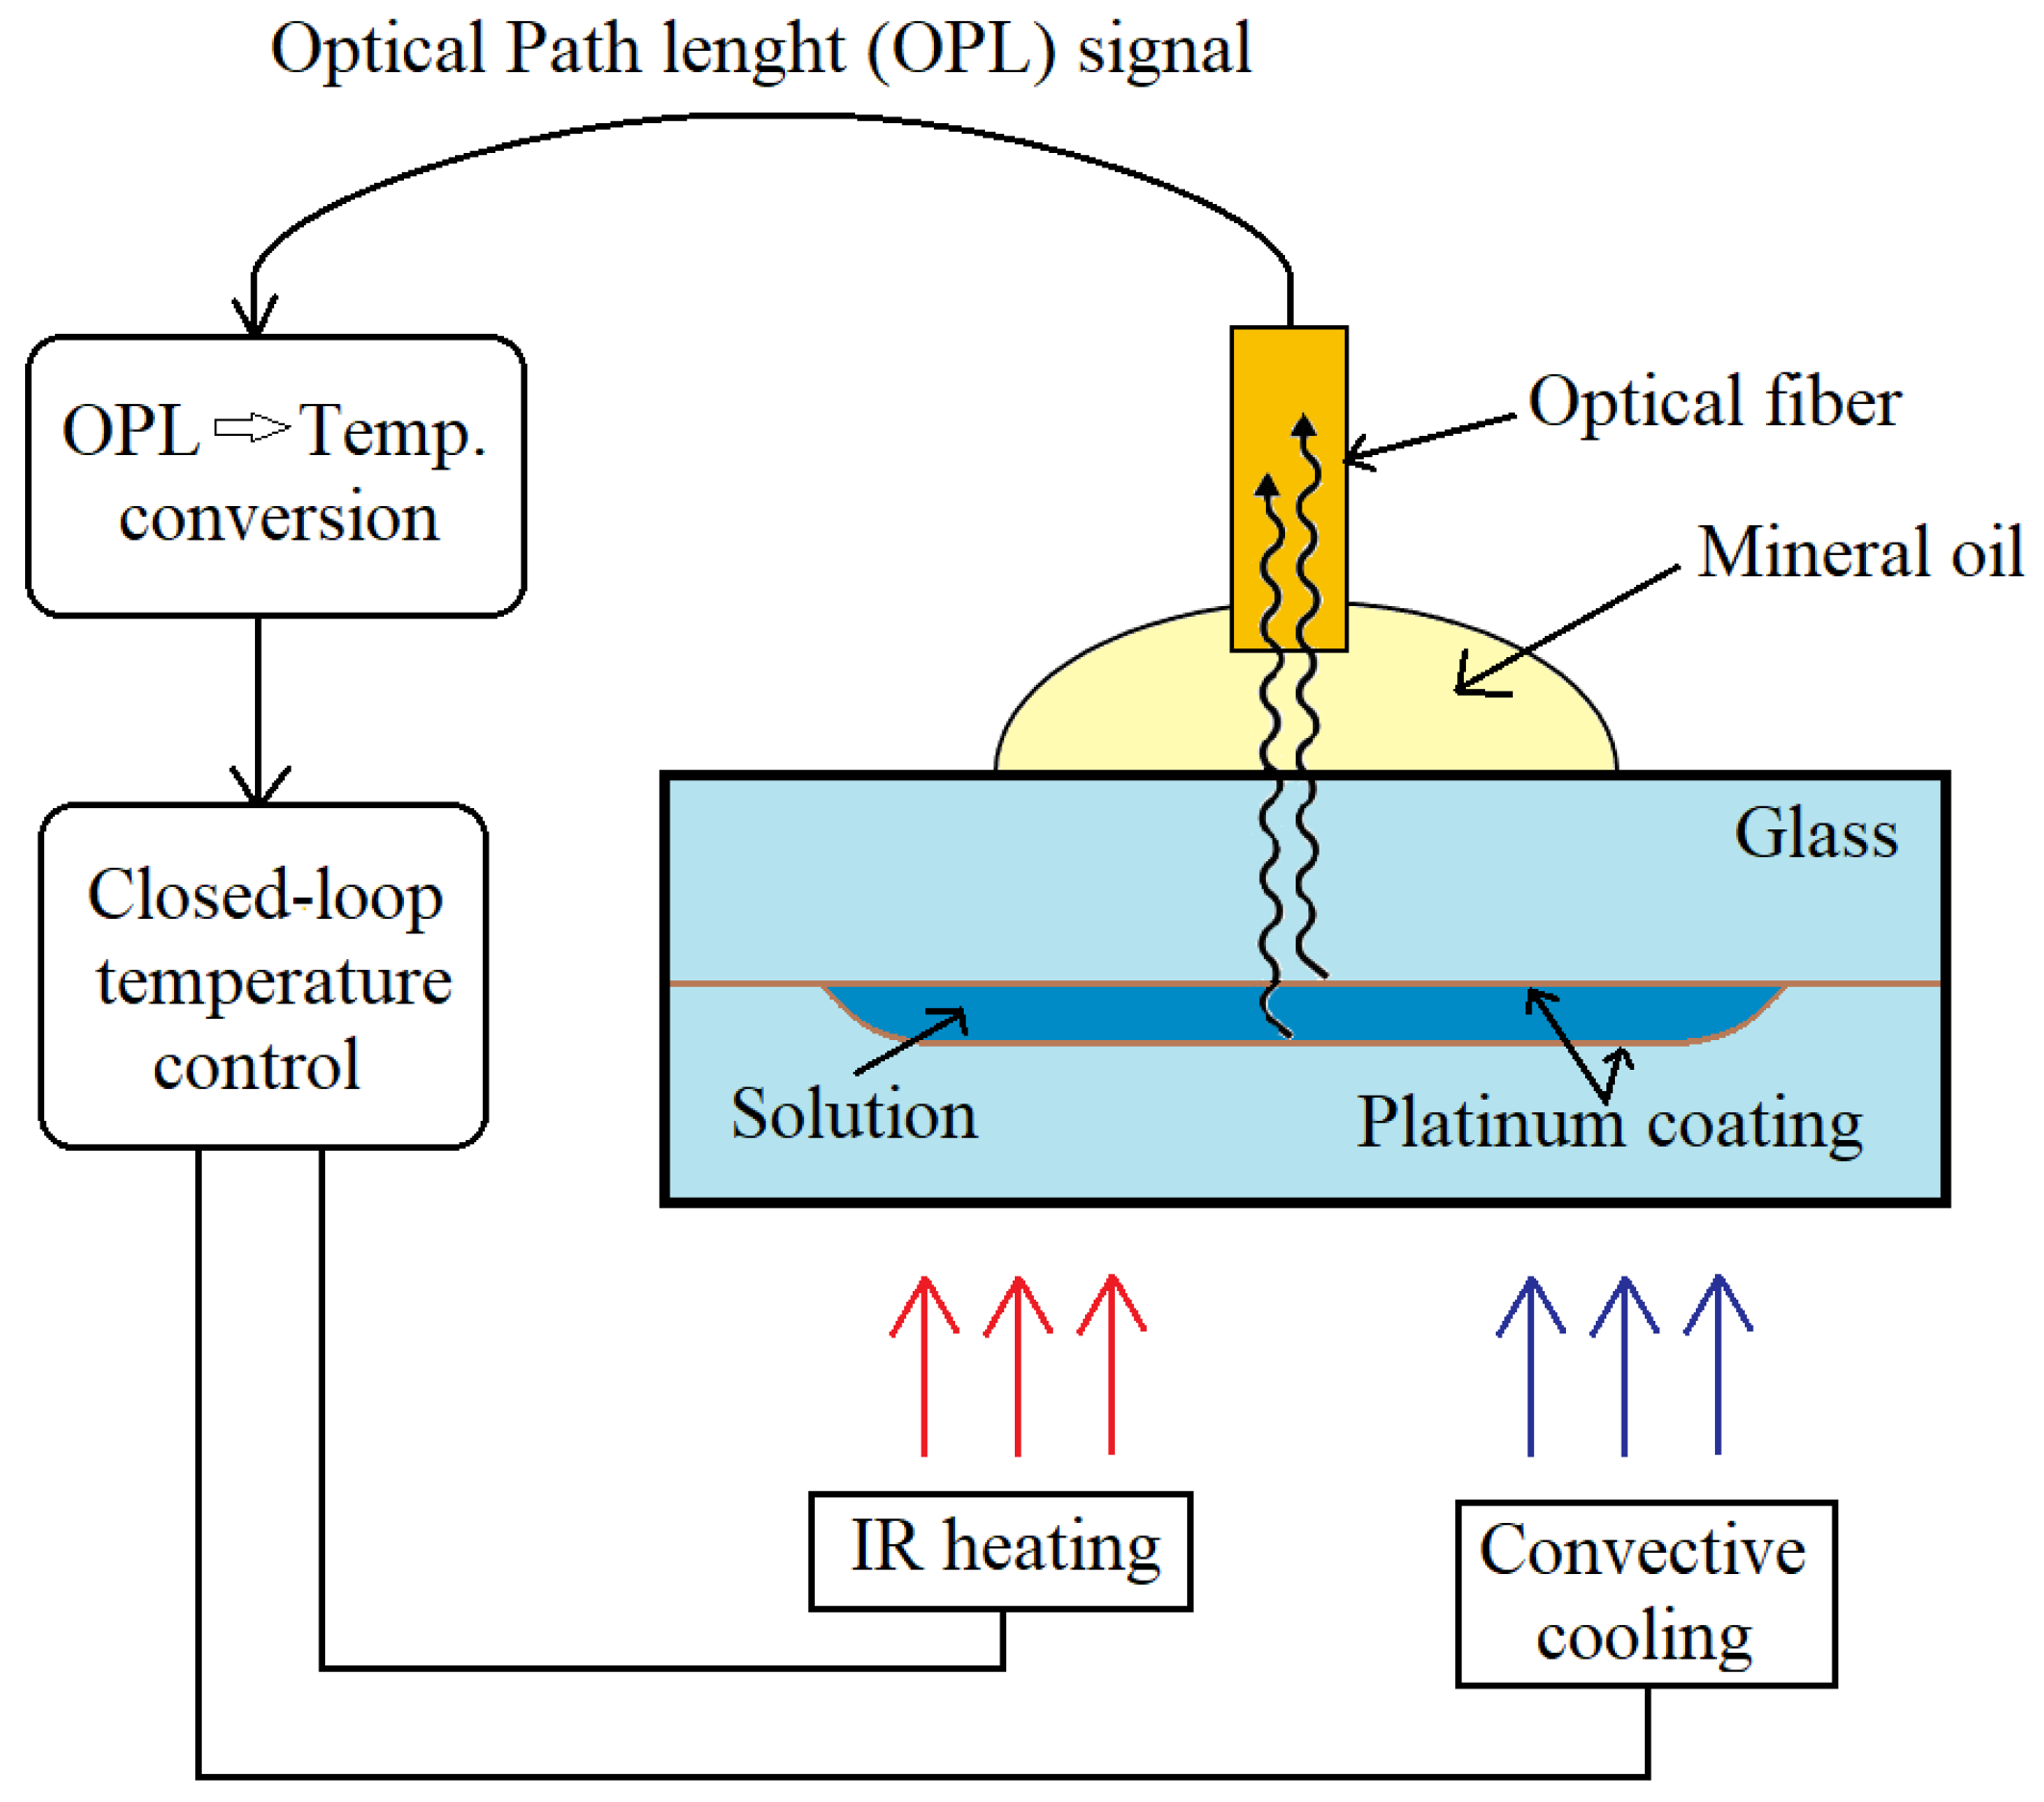
3.1. Temperature Sensing

Temperature control is among the important functionalities, which could be integrated in a microfluidic device. By applying non-invasive spectroscopic techniques, temperature can be monitored at multiple locations inside microfluidic devices [47].
In order to efficiently perform various chemical as well as biochemical reactions and assays, it is very important to control temperature properly and accurately. Polymerase chain reaction (PCR) is among the examples of a temperature-controlled process, which requires an accurate temperature measurement, and is widely used for DNA sequencing, pathogen detection and genetic analysis. D. C. Leslie et al. [48] presented an interferometric temperature control system with closed-loop temperature heating and cooling for direct temperature measurement in order to monitor PCR process. Non-contact temperature sensing was performed using Extrinsic Fabry–Perot interferometry (EFPI). A schematic representation of an interferometric temperature control system is shown in Figure 9. During the experiment, optical fiber emitted the NIR radiation (850 nm) into the to the microfluidic chamber, whose surfaces were modified with a platinum nanoparticle monolayer. Interference pattern was formed by reflected lights, which were collected from the upper and lower chamber surfaces, and was used for determining the optical path length. By monitoring the change in the optical path length, the temperature inside the chamber was determined because the refractive index of the medium decreased with increasing temperature. The presented interferometric temperature control system was applied in the PCR process for amplification of a portion λ-phage DNA and human genomic DNA. As a result, the temperature was monitored with detectable temperature change of 0.3 °C. This universal thermocyling system can be applied for a variety of disposable miniaturized platforms such as cell-based devices or sequencing tools.
Separate fluorescent dyes in solution can also be used as temperature indicators. Generally, not only quenching agents but also changes in pH can strongly affect spectroscopic properties of the dyes; therefore, it is challenging to measure temperature precisely. Another disadvantage of fluorescent dye application is that their fluorescence properties depend on the temperature linearly only in a narrow temperature range [47]. Moreover, the concentration of fluorescent dyes influences the final fluorescence intensity. Therefore, the ratiometric technique, which is based on the measurement of intensities at two or more peaks of an excitation or emission spectrum and does not depend of temperature probe concentration, can be applied for temperature monitoring.
R. G. Geitenbeek et al. [49] applied a ratiometric band shape luminescence thermometry in microfluidic systems by using NaYF4:Yb,Er nanoparticles, which convert near infrared radiation of emission into visible radiation, as an accurate temperature probe. In order to perform various temperature sensing experiments, temperature-dependent luminescence of NaYF4:Yb,Er was measured. Sensor NaYF4:Yb,Er particles were formed by doping NaYF4 NPs with 18% Yb3+ for efficient upconversion along with 2% of emitting ion Er3+. Efficient upconversion in Er3+–Yb3+ couple caused a green fluorescence emission from Er3+ ion under infrared (980 nm) excitation. To increase particle dispersibility in polar solvents and chemical stability, a protective SiO2 layer of approximately 10 nm thickness was grown and core/shell structure was formed. By comparing luminescence spectra of particles with and without a protective layer, it was shown that the SiO2 layer did not affect the temperature dependence of luminescence. It was demonstrated that by dispersing NaYF4:Yb,Er particles in the fluids, temperature could be monitored inside different microfluidic devices made of silicon/glass, glass/glass or PDMS/glass. Temperature was evaluated in systems with the temperature gradient, a constant temperature or variation of temperature caused by exothermic reaction. By using fiber optics, temperature was measured up to 120 °C with high accuracy (0.34 °C) and 1 mm spatial resolution. Moreover, it was demonstrated that spatial resolution of spot size could be improved up to 9 μm by applying confocal microscopy.

3.2. pH Sensing

In addition to the temperature control, the information about ion concentrations—for example, pH—is very important due to the fact that medium pH can strongly affect many metabolic processes and enzymatic reactions. Additionally, the intracellular pH is involved in cellular events such as cell growth, endocytosis, transport of ions, activity of enzymes and evolving of some diseases—for example, cancer [50]. O. Kreft et al. [51] presented a pH sensor system based on polymer capsules for monitoring pH changes in human breast cancer cells and fibroblast environments. Multifunctional capsules were formed by incorporating magnetite nanoparticles and pH-indicator dye into a polymer microcapsule shell. SNARF-1-dextran fluorophore was incorporated in spherical CaCO3 particles by a coprecipitation method [50]. Later, SNARF-1-loaded particles were embedded in the shells of polyelectrolytes. A multi-layered (onion-like) shell was formed by consecutively depositing 10 layers of polystyrene sulfonate (PSS) and polyallylamine hydrochloride (PAH). Therefore, SNARF-1-dextran fluorophore was retained in the microcapsule shell and was not dispersed throughout the sample. A pH-sensitive fluorophore exhibited a significant emission shift under different pH conditions: in acidic medium, dye showed a green emission and in basic medium, the fluorescence peak was at the red spectral region. Due to the incorporation of magnetite nanoparticles, it was possible to transport microcapsules to a specific location or easily separate them from the sample by applying magnetic field. In order to observe local pH changes under cell culture conditions, cancer cells and fibroblasts were incubated with sensor capsules. During endocytic uptake, capsules got inside the cells, and fluorescence measurements proved that inside the endosomal/lysosomal compartments medium was acidic and did not depend on the varied pH value outside the cells. Microcapsules, which were left outside the cells, corresponded well to the pH changes. However, the distribution of SNARF-dextran in microcapsules was inhomogeneous and the amount of dye varied in different capsules. Moreover, due to photobleaching, the absolute fluorescence intensity decreased.
Another microfluidic platform for pH monitoring was presented by M. P. Gashti et al. [14]. By applying a fluorescent nanoparticle-based sensor, ratiometric pH imaging of oral bacteria Streptococcus salivarius biofilms was performed in real-time. For this purpose, Ag@SiO2 + FiTC nanoparticles were covalently patterned on a planar glass slide and formed a thin sensing surface that featured good photostability and ability to preserve Ag@SiO2 + FiTC nanoparticles under flow conditions. Streptococcus salivarius bacteria were used for co-aggregation, surface attachment and formation of biofilm directly at the sensing surface inside a Y-channel microfluidic device due to hair-like protein-based appendages. In this study, fluorescein was used as a pH-sensitive fluorescent dye and was covalently attached inside the 15 nm silica layer for quantitative pH measurements. It was demonstrated that the glucose concentration changes in the nutrient solution stimulated pH changes at the attachment surface of a biofilm, which were monitored by ratiometric pH images. Due to good biocompatibility, it was possible to perform experiments, which lasted longer than one week. Additionally, density and porosity of biofilms were investigated by varying flow rates of the nutrient solution and monitoring the pH changes.
In order to monitor pH changes or determine the pH value more precisely, luminescence lifetime-based measurements offer this opportunity since the lifetime of a fluorophore does not depend on the fluorescence intensity or wave-length interferences. The integrated pH sensor microstructures for time-domain dual lifetime referencing (t-DLR) measurements in microfluidic channels were presented by E. Poehler et al. [52] and applied in miniaturized electrophoretic procedures (μFFIEF). For preparation of a luminescent sensor, pH indicator 5(6)-carboxyfluorescein N-hydroxy-succinimide ester (CF) was covalently bonded to the pHEMA copolymer and dissolved in ethanol. The mixture was added to aqueous solution that contained Ru(dpp)3 embedded PAN reference nanoparticles and the polymer ink was formed. The polymer ink was inkjet-printed on a glass slide rapidly with a low sample consumption. Then, the glass slide was integrated into a microfluidic chip. The sensor was used in order to separate and determine three different proteins (β-lactoglobulin A, conalbumin and myoglobin), which were labelled with red fluorescent dye P503 (Py1). The pH sensor worked in the pH range from 4 to 8 and showed fast response times. The microfluidic chip demonstrated very high stability during measurements under flow conditions with flow rate of 50 μL/min. In the t-DLR scheme, a signal, which was proportional to the pH value, was estimated from the ratio of the two images, which were taken in different time moments. The first image was made with 5 μs exposure time under LED irradiation. It provided information about the luminescence decay times of pH indicator and reference dye. After illumination was stopped and delay of 1 μs, another image was taken and collected the information only about the emission decay of reference dye. Due to the fact that lifetime-based ratiometric pH sensing was independent of background noises, it provided more accurate data. However, the pH sensor calibration was valid for a limited time due to the decreased intensity caused by applied constant LED illumination for 30 min.

3.3. Oxygen Sensing

The concept of oxygen sensing and imaging is preferably based on the quenching of oxygen-sensitive dye luminescence by molecular oxygen. Due to quenching, the intensity of luminescence decreases, and changes in decay time occur. Intensity-based phosphorescence or fluorescence measurements are widely used for their simplicity, low cost and easily accessible equipment. However, these measurements are sensitive to excitation intensity and efficiency of detection system. Moreover, many other factors such as photobleaching, uneven dye distributions, scattering of excitation or emission light can strongly affect luminescence intensity. Therefore, it is necessary to apply referenced detection schemes—for example, the ratiometric method. During ratiometric fluorescence measurement, the intensities at two or more emission peaks of an oxygen-sensitive indicator and a reference dye are measured in order to detect changes in oxygen concentration. By applying this method, environment variations are reduced. Nonetheless, signal varieties due to photobleaching, leaching of fluorescent dye or Rayleigh scattering still have an impact on precise analyte measurement [53].
Another widely applied technique is fluorescence lifetime imaging, which is based on determination of the spatial distribution of fluorescence lifetimes at every pixel of the image. As the fluorescence lifetime of a fluorophore does not depend on its concentration, in the first approximation, the thickness of the sample, excitation intensity or photobleaching do not disturb the measurement seriously. The lifetime-based measurements provide information about the molecular environment of the fluorophore such as pH, concentration of oxygen and molecular binding. Fluorescence lifetime imaging techniques can be classified into frequency-domain and time-domain techniques. In the time-domain techniques, analyte is excited by short light and the fluorescence emission is recorded as a function of time. In the frequency domain, modulated source of light excites the sample and the fluorescence emission becomes modulated and phase-shifted from the excitation curve; therefore, fluorescence lifetimes are calculated from the observed phase-shift and modulation [54].
By combining the oxygen imaging with microfluidics systems, it is possible to visualize concentration gradients of analyte, evaluate concentrations, monitor chemical reactions and perform single cell analysis [53]. In order to investigate metabolism and growth of aerobic bacteria in droplet bioreactor systems, it is critical to monitor the oxygen concentration inside the droplets.
Measurements of absolute oxygen concentration and optical density (OD) during incubation of Escherichia coli and M. smegmatis bacteria inside the droplets were performed and presented in the research of M. Horka et al. [55]. In order to form an oxygen sensor, phosphorescent indicator dye (PtTPTBPF) was immobilized in core−shell structured poly-(styrene-block vinylpyrrolidone) (PSPVP) nanobeads. Due to the core−shell structure, sensor particles were dispersed in aqueous phase and oxygen-sensitive dyes were immobilizes in the lipophilic core of the nanobead. For phosphorescence frequency-domain lifetime measurements, the nanoparticles were excited by red light and due to large Stokes shift, particles emitted near-infrared (NIR) light. Fluorescence emission in the NIR region offered the ability to use PSPVP-PtTPTBPF particles in biological samples because of minimized background fluorescence. The most significant effect was observed when a large quantity of oxygen was consumed during the exponential growth phase of bacterial colony, which resulted in the significantly decreased concentration of oxygen in the droplets. The absolute oxygen concentration was accurately determined with a resolution of 0.07–0.12 μM.
Non-invasive, optical monitoring of oxygen concentration during bacterial cultivation in microfluidic droplet-based system was presented by J. Cao et al. [6]. Dissolved oxygen concentration, cell density and endogenous autofluorescence intensity were simultaneously sensed in nl-sized droplets by utilizing a microflow-through fluorimeter and photometer. For that purpose, polystyrene beads (PS) doped with oxygen-sensitive dye PtTPTBP were mixed with culture liquid in microfluid segments. Two bacterial strains Streptomyces acidiscabies E13 and Psychrobacillus psychrodurans UrPLO1, which were resistant to heavy metal ions, were investigated. A model of the microfluidic experimental setup is shown schematically in Figure 10A. Microfluid droplets were generated through PEEK 7-port manifold. A syringe pump system controlled 5 syringes filled with the effector CuCl2, suspension of sensor beads, cultivation medium, cell suspension and carrier liquid PP9. By varying flow rates of the effector solution and the cultivation medium, reactants were dosed and, therefore, it was possible to tune the composition of the microfluid segments inside a large sequence. After generation of micro fluid segments, they were transported with a fixed 55 μL/min flow rate to the detection unit (Figure 10B). For determining a distance between two segments, droplet size and number, light scattering measurements were performed by using two diodes with peak wavelengths of 470 and 505 nm. For evaluation of the bacterial growth and the oxygen consumption, the sample was excited under visible light with wavelengths of 470 and 405 nm. The results showed that the phosphorescence intensity measurements were sufficient for monitoring oxygen concentration inside the droplets. During microtoxicological investigation on the effect of copper (II) chloride, it was proved that the investigated strain of Psychrobacillus psychrodurans UrPLO1 had a strong tolerance to Cu2+. However, uneven distribution of the dye-labelled sensor particles inside the droplet, photobleaching and also droplet geometry could have a relatively high impact on the accuracy of an intensity-based luminescence measurements.
Y. Yabuki et al. [56] proposed a non-toxic and contactless technique for estimating the absolute values of oxygen concentration in a cell culture microfluidic device. Pd-octaethylporphine (Pd-OEP) dye loaded polystyrene microparticles were embedded in dimethylpolysiloxane (PDMS) by creating a thin oxygen sensing film in order to avoid direct contact of the dyes with the living cells. After the oxygen-sensing film was installed into the microfluidic device, the 4T1 cells were cultured on it. Due to this, monitoring of oxygen consumption was performed stably and over long periods of time. It was determined that the response time of the oxygen concentration changes depended on microparticle size and oxygen-sensing film thickness. The smaller microparticles and thicker film led to the shorter response time. Due to the fact that phosphorescence lifetime depends on the oxygen concentration, pO2 changes were quantified from the lifetime/phosphorescence quantum yield, respectively, and the oxygen consumption quantity was estimated from pO2 shifts. It was shown that the oxygen gradient downshifted due to cellular respiration process. In addition, by transplanting tumor fragments, which were excised from the mouse, on the sensor film, oxygen consumption was screened at various oxygen concentrations. As a result, oxygen concentration decreased in the parts in which the tumor tissue fragments were placed.
L. C. Lasave et al. [57] presented a simple and low-priced method for integrating an oxygen-sensitive sensor particle into a glass microfluidic device. A sensing strategy relied on the formation of a sensing layer by physical adsorption of nanoparticles. The formed sensing layer produced good stability, very fast response time (less than 0.2 s) and optimum sensitivity. Conjugated polymeric nanoparticles had a hydrophobic polyfluorene poly(fluorene-co-benzothiadiazole) backbone that contained covalently attached Pt (II) (benzo)porphyrins. In this research, microfluidic chips channels were coated with sensor nanoparticles, which luminescence was modulated by oxygen concentration. For increasing roughness and enhancing adsorbent, the surface area of smooth microchannel, made from glass, was increased by in situ generation. Finally, the developed techniques were investigated for monitoring red-ox (oxidation of glucose) reaction using a packed-bed reactor (Figure 11). For this purpose, silica particles, which contained the immobilized glucose oxidase (GOx) enzyme, were added into the microfluidic chip with integrated oxygen sensors. By applying a strong water flow in the outlets, GOx -carrying silica particles were removed from the chip; therefore, the microfluidic device could be reused several times.

3.4. Particle-Base Imaging of Oxygen Distribution

Oxygen imaging using a fluorescence microscope was investigated by B. Ungerböck et al. [58] Oxygen measurements were carried out inside a Y-shaped microfluidic reactor by applying luminescent indicator dye doped nanoparticles. Sensor particles were prepared by staining poly(styrene-block-vinylpyrrolidone) (PSPVP) beads with oxygen-sensitive luminescent dye Ir(Cs)2(acac) according to the report of S. M. Borisov and I. Klimant [59]. Dissolved oxygen concentrations were measured during the glucose oxidation reaction in the presence of glucose oxidase. By comparing the obtained experimental results and predictions of model simulations, good agreement was found, which showed a high measurement accuracy. The accuracy of the presented oxygen-imaging technique was 0.03, and it was evaluated by comparing a calculated standard deviation to a curve fitted to experimental data.
Later on, B. Ungerböck et al. [60] presented magnetic optical sensor particles (MOSePs) for monitoring the enzymatic activity of glucose oxidase and cellular respiration. MOSePs were produced by an optimized nanoprecipitation method. In order to prepare sensor particles, PSMA nanoparticles were doped with magnetite nanoparticles and different luminescent dyes (PtTFPP, MFY or Ir(Cs)2(acac)). By using a magnet, the particles were collected and accumulated in one place inside a microfluidic channel in order to form sensor spots. In situ formed sensor spots featured good stability at flow rates typically applied in microfluidic systems. Among biggest advantages was an ability to easily change the location of sensor spot by moving the magnet outside a microfluidic channel. By forming sensor spots, enzymatic activity of glucose oxidase was monitored by detecting pO2 along the channel, during the glucose oxidation. Respiratory cell activity was investigated by using a suspension of MOSePs containing Ir(Cs)2(acac), when E. coli were incubated inside a microfluidic chip. As a result, the pO2 image showed the oxygen concentration was the lowest at places in the chip where cell aggregates were located.

3.5. Combination of Particle-Based Oxygen Sensing with Flow Velocimetry

H. D. Kim et al. [61] used a conventional microparticle image velocimetry method for performing simultaneous measurements of dissolved oxygen concentration (DOC) and velocity fields. DOC was determined by applying oxygen-sensitive particles, which were produced by the dispersion polymerization method. Polystyrene (PS) particles were doped with PtOEP dye, whose phosphorescence was quenched by oxygen molecules. Therefore, formed oxygen-sensitive particles were applied not only as tracer particles but also as oxygen sensors. In order to observe a diffusion of dissolved oxygen in a Y-shaped microchannel, oxygen-sensitive particle were dispersed in de-ionized water with DOC values of 0 or 100%. Particles were excited at 385 nm, and their phosphorescence intensity distribution was recorded. As a result, due to different dissolved oxygen concentrations in water, it was possible to observe a qualitative visualization of two different intensities of phosphorescence. It was found that the maximum velocity of the water streams was 3.5 mm/s, and a parabolic velocity profile was obtained. Additionally, it was determined that after 3 s exposure to excitation light, photobleaching of particles was less than 2%.

3.6. Combination of Oxygen and pH Sensing

Simultaneous determination of oxygen concentration and pH during the enzymatic reaction was presented by J. Ehgartner et al. [23] Contactless and inexpensive detection was enabled by using poly(styrene-block-vinylpyrrolidone) (PSPVP) core−shell nanoparticles, whose average diameter was 180 nm. Due to the core−shell structure, the oxygen-sensitive dye PtTPTBPF was incorporated into the particle’s core and a pH-sensitive dye (aza-BODIPY) was captured into the polyvinylpyrrolidone shell. Modified dual lifetime referencing (m-DLR) was used to sense pH and oxygen in microfluidic system. After the sinusoidally modulated light source excited the indicators, phase shift as well as luminescence emission were recorded. The detection method was based on the overall phase shift measurement of pH and oxygen sensitive luminescence dyes at two different modulation frequencies. It was necessary that luminescent lifetimes of indicators were in different time ranges. In this research, an oxygen-sensitive dye had a relatively long phosphorescence lifetime in the microsecond range when a pH indicator had a shorter fluorescence lifetime in the nanosecond range. The presented system offered the advantage that it used a red-light excitation at 620 nm, which caused decreased background fluorescence and scattering. Additionally, it possessed higher photostability and opens the possibility to use sensor nanoparticles in microfluidic devices without additional integration. In order to monitor pH changes in real-time, Penicillin G acylase catalyzed an enzymatic conversion of Penicillin G into 6-aminopenicillanic acid and phenyl acetic acid was investigated. By comparing results between the simulation and experiment, it was shown that experimental data were in great agreement with the expected simulation results. It was found that oxygen concentrations were determined at a resolution from approximately 0.02 to 0.32 mg/L. The resolution of pH value varied from 0.03 to 0.1 pH units.

4. Microfluidic Systems for Chemosensing

A chemosensor is a chemical system, which converts chemical stimuli (probe–analyte interaction) into a physically detectable response—for example by a color change, fluorescence or an electronic signal. Chemosensors display simple and sensitive detection properties to a wide range of analytes such as ions, neutral molecules and gases. Additionally, they are widely applied in chemistry, biology, pharmacology and environmental sciences [62]. Examples of sensor particles used for chemical sensing and biomedical application are given in Table 5.

4.1. Particle-Based Gas Sensing

Semiconducting metal oxide sensors are most commonly used for gas sensing due to the unique structure and physical/chemical properties of metal oxide semiconductors (MOS). The working principle of MOS-based gas sensors is based on changes in the electrical properties of a sensor material caused by the absorbed gas. Due to physical or chemical adsorption of the gas on the sensor surface, the changes in free charge carrier concentration appear, which are converted into electrical signals. In the presence of metallic nanoparticles on the sensor surface, chemical reactions of the gas are affected by gas activation on the nanoparticle surface [63].
G. Tofighi et al. [64] presented a one-step microfluidic synthesis of colloidal nanoparticles that were deposited onto the SnO2 surface for gas sensing. Monodisperse nanocolloids of gold (Au), palladium (Pd) and homogeneous AuPd nanoparticles in aqueous suspension were produced in a continuous flow microfluidic reactor by using aqueous solution of metal precursors (HAuCl4, K2PdCl4) with polyvinylpyrrolidone (PVP)) and NaBH4 with PVP solution as the reducing agent. The formed nanoparticles were deposited onto the metal oxide (SnO2) surface for detection of gases, which was performed using diffuse reflectance infrared Fourier transformed spectroscopy (DRIFTS). For testing produced sensors, four gas samples, which contained CO, CH4, ethanol or toluene were measured at humid and dry conditions. By comparing the measurement results obtained using SnO2 surfaces loaded with gold nanoparticles or AuPd composite to results obtained using Pd-loaded SnO2 surface, it was shown that the detection properties strongly depended on SnO2 surface doping with different nanoparticles. As a result, gold nanoparticle deposition on the SnO2 increased the sensor signals for all samples and reduced the water vapor interference. Moreover, Pd-loaded SnO2 demonstrated a low response to toluene, but on the other hand, it showed a high sensitivity for CO detection.

4.2. Detection of Hydrogenperoxide

M. Salve et al. [65] reported the incorporation of silver nanoparticles on the pencil graphite electrodes (PGEs) for electrochemical sensing of hydrogen peroxide (H2O2). The silver nanoparticles were formed by applying a green synthesis method using an extract of marigold flowers. For the synthesis, aqueous solution of silver nitrate was mixed with the flower extract, which consisted of 95% lutein. After storing at room temperature overnight in a dark place, color change of the mixture was observed due to the Ag+ ions reduction to Ag nanoparticles of 20–50 nm size. After, solution of washed AgNPs was drop-casted on PGE with chitosan (CS) matrix in order to form a hybrid PGE/AgNPs/CS electrode. Figure 12 shows a schematic illustration of the PGE/AgNPs/CS electrode for effective H2O2 sensing. Formed electrodes were integrated in a 3D microfluidics platform and provided a significant cathodic reduction peak for reduction of H2O2. The electron transfer activity was enhanced by AgNPs on the electrode and caused electrocatalysis of H2O2. A cyclic voltammograms (CV) technique in the range of −0.7 to 0.2 V was applied for quantitative analysis. Linear response of the current on the H2O2 concentration was found in the concentration range of 1–10 µM with limit of detection of 0.52 μM. As a result, the detection of H2O2 concentration was performed in medical and cosmetic samples accurately and with high selectivity.

4.3. Detection of Chloride Ions by Using Fluorescent Microparticles

K.P. Kronfeld et al. [16] presented a chemical sensing method for detection of chloride ions in aqueous solution by applying polyacrylamide hydrogel particles. Lucigenin dye was incorporated in hydrogel particles in order to form a chloride ion selective fluorescence probe. Chloride concentration-dependent fluorescence intensity signal was measured by a fluorimeter. When dried sensor particles were added in sodium chloride solutions, dynamic fluorescence quenching was observed. By varying chloride ion concentration from 0 to 130 mM, fluorescence intensity decreased linearly by following the Stern–Volmer equation. By applying presented sensor particles, it was possible to analyze samples with appropriate accuracy down to 10 μL volumes and up to 50 mM chloride concentration. Moreover, fast optical determination of chloride was performed in 5–7 min.

4.4. Sensor Particles for Detection of Environmental Pollution

Gold nanoparticle-based sensors for the fast determination of environmental contaminants were presented by J.P.Lafleur et al. [17]. Fluorescent gold nanoclusters functionalized with bovine serum albumin (BSA-AuNCs) and gold nanoparticle embedded with Rhodamine 6G (RB-AuNPs) were applied for the mercury and pesticide ziram detection. Measurements were performed with a limit of detection of 0.6 µg/L for mercury and 16 µg/L for ziram concentration. Figure 13 illustrates two detection schemes. In the “turn-off” method, highly fluorescent gold nanoclusters (BSA-AuNCs) were used. By adding Hg2+ ions, fluorescence of BSA-AuNC was quenched due to Hg2+–Au+ interactions or through Hg2+ interactions with BSA carboxyl and amino groups. In the “turn-on” method, fluorescence of rhodamine 6G was quenched regarding adsorption of dye molecules on the surface of gold nanoparticle by fluorescence energy transfer. In the presence of Hg2+, dye molecules were displaced and released from the particle surface resulting in the recovery of fluorescence intensity in the bulk solution. The results showed that the “turn-on” method was more sensitive for Hg2+ ion detection. Additionally, it was demonstrated that by applying RB-AuNPs, indirect detection of ziram pesticide was performed by the “turn-on” method. When ziram was added, rhodamine molecules were set free, and their fluorescence intensity was recreated.
For Hg (II) ion detection, Z.-X. Guo et al. [5] developed a valve-based microfluidic micromixer system, in which droplets were generated, manipulated and effectively mixed. By applying a valve-based micromixer, it was possible to encapsulate a tiny volume of Hg (II) ion or AuNPs-RB into individual nanoliter or picoliter size droplets, merge different droplets together and, finally, perform active mixing. Measured changes in fluorescence intensity provided information about the presence of Hg (II) ions. For preparation of the detection probe, gold nanoparticles were synthesized when trisodium citrate solution was added to boiling chloroauric acid solution and stirred for 15 min. After cooling down to room temperature, AuNPs were diluted to borate saline buffer with pH 9. Additionally, gold nanoparticles were functionalized with Rhodamine B (RB) dye, whose fluorescence was quenched by gold nanoparticles. However, when Hg (II) ion and AuNPs-RB droplets merged and mixed together, the fluorescence intensity increased due to fluorescence dye releasement from AuNPs-RB composite. However, this study showed the ability to detect Hg (II) ions without more detailed concentration determination.

5. Microfluidic Systems for Biomedical Applications

5.1. Colorimetric Particle Sensor for Microbiology and Biomedical Measurements

Colorimetric methods are simple, fast, inexpensive and are widely used for determining the concentration of analyte or identifying chemical compound in a solution through the color changes of the reagent. For biosensing purposes, colorimetric assays are often based on usage of gold and silver nanoparticles. Due to the fact that the surface plasmon resonance properties of noble metal particles are strongly influenced by the interparticle distance, the difference between aggregates and individual particles can be simply visualized by the color change in particle absorption spectra. The aggregation of AuNPs (normally 10–50 nm in size) causes a color change from red to blue, and for AgNPs—from yellow to brown due to the interparticle coupling effect. This recognizable change of color creates the ability to design colorimetric sensors for target analytes [33].
L. Zheng et al. [66] developed an innovative microfluidic and colorimetric sensor for determination of E. coli O157:H7. The presented biosensor was based on the aggregation of AuNPs and imaging by using a smart phone. Gold nanoparticles were synthesized by the hydrothermal reduction method when chloroauric acid was reduced with trisodium citrate in boiling water. The detection principle of the biosensor is shown in Figure 14. The biosensor microfluidic chip consisted of two mixing channels—the separation and detection chambers. In the beginning of the experiment, the sample containing the target E. coli was mixed in the first mixing channel with magnetic nanoparticles (MNPs) containing capture antibodies and the polystyrene microparticles (PSs) functionalized with the catalases as well as the detection antibodies against E. coli. After mixing, the formed complexes of MNP-bacteria-PS were localized in the separation chamber by applying A magnet. Then, H2O2 was introduced into the channel, it was catalyzed by catalases that were incorporated on MNP-bacteria-PS complexes, and therefore, broke down into oxygen and water. After injection of the crosslinking agents and gold nanoparticles into the mixing channel, all reactants were mixed, and the final mixture was collected in the detection chamber. In the presence of E. coli, aggregation of gold nanoparticles was prevented, and the solution color become red. In case of the sample without E. coli, MNP-bacteria-PS complexes were not formed; therefore, H2O2 was not catalyzed and the aggregation of the AuNPs took place resulting in the solution color change into blue. Color change was measured via smart phone imaging. The concentration of the E. coli in chicken samples was determined with good sensitivity and specificity. However, it was determined that the limit of detection was 50 CFU/mL and did not meet the criteria for practical applications, which was 1 CFU/mL. Moreover, the efficiency of the immune reaction was not satisfying enough. By applying the active micromixers or at least smaller-sized passive mixers, the detection system could be improved.
N. Nagatani et al. [67] applied a microfluidic continuous-flow reverse transcription PCR (RT-PCR) chip in order to amplify influenza virus RNA and used amplified DNA detection lateral flow immuno-assay (ADLFIA) for amplified DNA detection. FITC labelled and biotinylated primers were used for the amplification of Virus RNA. In the proposed colorimetric assay, gold nanoparticles were labelled with biotin antibodies by a physical adsorption process. PEG dissolved in the buffer and bovine serum albumin (BSA) were added in order to block non-coated gold nanoparticle surfaces. In order to perform the detection, the amplified DNA and biotin antibody-immobilized gold nanoparticles were mixed together and absorbed by a capillary effect for ADLFIA, in which FITC antibody was immobilized on the test line and mouse IgG antibody was immobilized on the control line. In the case of FITC antibody captured amplified DNA complex with biotin antibody-immobilized gold nanoparticles by antigen–antibody interaction, a reddish color appeared within 1 min due to the gold nanoparticle accumulation on the test line. By comparing the ADLFIA technique to agarose gel electrophoresis, it was found that sensitivity of both methods was similar but detection using ADLIFA was simpler and could be identified only with the naked eye.
Immunochromatographic strip (ICS) tests are widely applied for analysis of DNA and protein because of their simplicity, low cost, user-friendly format, rapid detection, requirement of small sample volume and good stability over different environmental conditions. Y. T. Kim et al. [68] presented an integrated microdevice for RT-PCR with colorimetric immunochromatographic detection of influenza virus (AH1N1). Au NPs, labelled with anti-hapten antibodies, were employed for colorimetric measurements that were identified by the naked eye. Figure 15 illustrates a fully integrated microdevice, which was made from five-layered glass–polydimethylsiloxane (PDMS), incorporating a micro-RT-PCR chamber with an ICS. By combining an RT-PCR with an ICS technology, genetic analysis of influenza virus was performed rapidly and simply. To demonstrate the colorimetric detection sensitivity, the signal intensities measured by ICS and the agarose gel electrophoresis methods were compared. During ICS analysis, a minimum needed amount of viral RNA sample was 17.2 fg in order to see violet color signal at the test line. Meanwhile, for gel electrophoresis, at least 1.72 pg of the RNA sample was needed to generate a dim band. As a result, it was demonstrated that the ICS analysis was 100 times more sensitive. Moreover, ICS analysis was performed within 10 min and without any specific analytical devices. However, the agarose gel electrophoresis analysis needed additional equipment (UV illumination) and took longer than 1 h. It was successfully demonstrated that genetic analysis of influenza AH1N1 virus could be completed within 2.5 h by using a portable microdevice incorporating RT-PCR with an ICS.
The color changes of AuNPs can be inhibited by adding aptamers. For this reason, complexes consisting of AuNPs, specific aptamer and aggregation reagent can be applied as biosensors in order to detect target analyte in a wide spectrum of applications. One of the examples was presented by L. Wang et al. [69] for the realization of a microfluidic micropaper-based analytical device (μPAD). In a four-channel microdevice, gold nanoparticles (from 20 to 40 nm size) were used as colorimetric nanosensors. Additionally, by applying specifically tailored aptamers, cocaine, codeine and methamphetamine drugs were captured and detected. The detection principle was based on salt-induced aggregation of gold nanoparticles, which produced a color change by indicating the presence of the target drug. During the experiment, lateral flow of MgCl2 and sucrose solution was created by capillary action. Due to the formed flow, small analyte molecules were moved up hydrophilic channels to the aptamer area. In the case that the target drugs molecules were in the sample, aptamers bound to them. After, complexes of the target drug and aptamer were transported to the area of gold nanoparticles, where nanoparticles aggregated due to presence of sucrose and MgCl2. As the result of aggregation, the color in the sample area visibly changed. In the absence of drug molecules, the unbound aptamers were carried by the flow of MgCl2 and sucrose to the gold particle area. Aptamers bound to gold nanoparticles; therefore, the aggregation was inhibited. One channel in the microfluidic device was without the aptamer area and was used as a control. Despite the fact that the flow of the solution was extremely slow and detection time was longer than 10 min, the limit of detection (LOD) was 4 μg for each drug.
An Ag nanoparticle-based sensor was presented by Y. Zhao et al. [70]. Easy and straightforward protein analysis was performed in a microfluidic chip via a colorimetric assay, which was based on the interaction of analytes with an aptamer–AgNPs complex. The aptamer Apt 29, which affected the silver SPR, was successfully immobilized onto the surface of AgNPs with morphology close to sphere and 35 nm in diameter on average. The produced complex of Apt 29-AgNPs was used for the subsequent reaction with thrombin. The surfaces of microfluidic channels were functionalized with streptavidin and later biotinylated Apt 15 was immobilized in order to form a capture probe for the targeted protein—thrombin. After the injection of thrombin and the aptamer–AgNPs mixture into the microfluidic device, thrombin was captured on the channel surface specifically. Due to thrombin and aptamer–AgNPs bonding, the color change in the channel appeared and could be analyzed by the naked eye or a flatbed scanner. By increasing the concentration of thrombin, the amount of bounded aptamer–AgNPs complex increased proportionally to the thrombin concentrations. It was demonstrated that this method had a good linear relationship with the detection limit of 20 pM thrombin. Additionally, the protein detection was operated simply, highly specific, showed a low detection limit and required a low sample volume.

5.2. Paper-Based Bioanalytical Systems Using Sensor Particles

Microfluidic paper-based analytical devices (µPADs) demonstrate numerous advantages for fluid handling and analysis because they are simple, affordable, portable, biodegradable, automated with capillary action, offer a low reagent and samples consumption and are capable of providing semiquantitative results for various analytes. E. Evans et al. [71] described a microfluidic µPAD modified with silica nanoparticles (SiO2) for analysis of three different enzymatic reactions. The color homogeneity and the intensity of signal were improved by trapping SiO2 nanoparticles modified with APTES within the cellulose structure in the paper device detection zone. Nanoparticle surface modification was necessary for enhancing the protein adsorption process and immobilization in the device. Trapped SiO2 particles provided a solid surface for adsorption of selected enzymes; therefore, they prevented the washing away effect, which created color gradient. For the semiquantitative detection of lactate, glucose and glutamate in an artificial urine sample, first of all, 1 µL of selected enzymes solution was dotted on the detection zone. After drying at room temperature for 15 min, a 1µL drop of specific chromogenic agent solution was spotted on the detection zone and dried again. Finally, 10µL solutions of lactate, glucose and glutamate were applied on the center channel by allowing the detection zones to be reached by capillarity forces. Analysis of analytes was performed in 30 min. As a result, the three analytes were detected with limits of detection (LODs) of 0.63 mM for lactate, 0.50 mM for glucose and 0.25 mM for glutamate.
T.-T. Tsai et al. [72] developed a colorimetric assay for the determination of targeted tuberculosis (TB) with a gold nanoparticle-containing paper-based device. By using the SPR effect, color changes of a gold nanoparticle were monitored by using a spectrophotometer. Unmodified gold particles with a diameter of 13 nm were prepared by the citrate reduction method. In this study, single-stranded oligonucleotide sequences (ssDNA) and targeted double-stranded TB DNA (dsDNA) were mixed together with AuNPs for 30 min. After adding NaCl solution to the mixture, gold nanoparticles started to aggregate by inducing a color change (color turned bluer) due to hybridization of single-stranded DNA probe molecules and targeted double-stranded TB DNA. The hybridization caused the changes of the surface charge density; therefore, nanoparticles aggregated to various degrees and the concentration of the targeted TB DNA was determined. On the contrary, in the TB negative case, the color of the mixture remained reddish even after NaCl adding. When a mixture of AuNPs-ssDNA/dsDNA complexes was spotted onto the paper device, the blue/red ratio of testing zone was measured using a smartphone. The blue/red ratio correlated with AuNP aggregation degrees, which depended on the TB concentration. As a result, the detection limit of the paper-based sensor was 1.95 × 10⁻² ng/mL. In comparison to traditional clinical molecular diagnostics, this sensing platform was performed rapidly, approximately in 1 h after DNA extraction. Moreover, the amount of solution needed in µPAD was only 200 μL. However, the amount of NaCl in the sample mixture could strongly influence the gold nanoparticle-based colorimetric results and increase the variance between samples because of low concentration of analyte and low sample volume.
Tseng et al. [73] presented a convenient, low cost and rapid method for producing nanoparticle-containing test papers. First, a thin gold film was deposited on the test paper. A laser-induced annealing method was applied in order to fabricate nanoparticles. Due to the illumination with excimer laser, gold film on the test paper surface became liquefied. During cooling, liquefied gold deformed into spheres because of surface tension and, therefore, nanoparticles were formed. Test paper with formed gold nanoparticles was used as a paper-based LSPR biosensor, which enabled the fast, colorimetric detection of cysteine molecules. For detection, the sensor paper was simply immersed into cysteine solution, and the color change was clearly and visibly seen by the naked eye. Additionally, biosensors based on paper substrates were eco-friendly and safe because they could be burned after the detection of biomolecules.

5.3. Plasmonic Nanoparticles in DNA Amplification Assays

C. Reuter et al. [74] introduced a low-cost, simple prototype device (2-LED-μSpectrophotometer) for performing colorimetric DNA-amplification assay. The colorimetric sensing principle was based on salt or pH-induced aggregation of AuNPs, functionalized with oligonucleotides, which led to plasmon shift in the spectrum and solution color change. For spherical gold nanoparticle preparation, chloroauric acid was added into sodium citrate at 100 °C. Then, the solution of AuNP was cooled down to room temperature. Later, thiol-modified oligonucleotides were loaded on the AuNP surface in order to form DNA-AuNP probes. In the presence of complementary DNA sequences, hybridization of complementary DNA and the DNA- AuNP probe occurred, which led to stabilization of solution and inhibition of aggregation. Despite the addition of MgCl2 salt or HCl, the DNA-AuNP probe did not aggregate and color of solution did not change. On the other hand, in the absence of complementary DNA sequences, the addition of MgCl2 salt induced an aggregation of DNA-AuNP probes and caused a solution color change from red to blue/purple. Using this specific and sensitive DNA-AuNP probe, the detection of the waterborne human pathogen Legionella pneumophilais was performed with a clearly visible detection limit of 0.5 pg/μL DNA.

5.4. Particle-Supported Electrochemical Detection Systems

J. Yang et al. [75] developed a portable electrochemical microfluidic system and presented a synthesis of nanocomposites onto a screen-printed electrode (SPE). Presented SPEs were functionalized by co-electrodeposition of self-assembled positively charged chitosan (CS), graphene oxide (GO), which was negatively charged, and nickel nanoparticle NiNPs with size of 31 nm. By using the prepared biosensor (CS-RGO–NiNPs), enzymeless detection of glucose (Glc) in human urine samples was performed in alkaline media. Cyclic voltammetry (CV) was applied for monitoring the electrocatalytic activity of CS-RGO–NiNP modified electrode towards glucose. Presence of 3 mM glucose caused an increase in anodic current and a decrease in cathodic current due to Glc oxidation. Nickel nanoparticle in CS-RGO–NiNPs nanocomposite acted as an enzyme mimicking catalyst for Glc oxidation into glucolactone by reduction into Ni (II) species. Due to this, Ni (II) concentration increased by creating an increase in anodic peak current. Highly sensitive and selective Glc sensing was possible in a wide linear range up to 9 mM with limit of detection of 4.1 mM.
The most common from electrochemical measurements is amperometric detection in which the controlled electrical potential applied between a reference and a working electrode causes the oxidation or reduction in the electroactive analytes, and the induced electrical current at the electrode surface is recorded as the analytical signal. S-P. Chen et al. [29] presented a novel low-volume microfluidic immune assay system, which employed Au/chitosan/Fe3O4 composite, for specific recognition and analysis of hemoglobin A1c in blood samples. Due to Fe3O4 particle incorporation, the composite was easily controlled and transported by external magnetic field. The formed composite was also suitable for antihuman hemoglobin-A1c antibody (HbA1c mAb) immobilization with fine efficiency and good biocompatibility. After the injection of Au/chitosan/Fe3O4 into the microfluidic device, HbA1c mAb was immobilized by forming HbA1c mAb /Au/chitosan/Fe3O4 composite. Later, HbA1c was introduced into the microchannel and incubated for 8 min. Unbound HbA1c was washed out and then hemoglobin antibodies (Hb mAb) were injected and incubated. Finally, secondary alkaline phosphatase (AP)-conjugated antibody was injected, and immunoassay was ready to use. In the presence of 1-naphthyl phosphate(1-NP), an enzymatic reaction between a secondary AP-conjugated antibody and 1-NP occurred by producing the electroactive 1-naphtol. It was demonstrated that the increase in anodic oxidation current of 1-naphtol on the gold microelectrode was proportional to the HbA1c concentration. By optimizing electrophoresis and detection conditions, linear response of HbA1c in the concentration range from 0.05 to 1.5 µg/mL was achieved with the detection limit of 0.025 µg/mL. By comparing chitosan/Fe3O4 composite to Au/chitosan/Fe3O4, it was shown that antibody adhesion abilities were better when the sensor with assembled gold nanoparticles (Au/chitosan/Fe3O4) was applied. Moreover, by using the presented microfluidic immune assay, the cost per assay decreased due to the reduction in the consumed reagent amount. Another advantage of the presented assay was short assay time. Less than 30 min were needed to perform the whole detection process.

6. Conclusions

Nanoparticles are widely investigated and attract a lot of attention due to their optical, thermal, magnetic and electrical properties and their potential to be utilized for a wide variety of applications including temperature control, pH sensing, oxygen imaging, detection of organic molecules or inorganic ions and biosensing. By using microfluidics devices, micro and nanoparticles and their composites can be synthesized in a controllable and reproducible manner. Moreover, by applying microfluidic technology, it is possible to handle microscale or nanoscale fluids for sensing purposes and reduce the amount of consumed reagent. Among the different methods, which are used for sensing, optical (fluorescence, surface plasmon resonance-based optical detection) and electrochemical methods are the most frequently applied for their selectivity and sensitivity.

Author Contributions

Conceptualization, R.M.-S. and J.M.K.; writing original draft, R.M.-S.; supervision, review and editing, J.M.K. All authors have read and agreed to the published version of the manuscript.

Funding

This research was funded by DFG, grant number KO 1403 39-3.

Conflicts of Interest

Authors declare no conflict of interest regarding the publication of this study.

References

  1. Kohler, M.A. Mobile Microspies: Particles for Sensing and Communication, 1st ed.; Jenny Stanford Publishing: Beijing, China, 2018. [Google Scholar]
  2. Ma, J.; Lee, S.M.-Y.; Yi, C.; Li, C.-W. Controllable synthesis of functional nanoparticles by microfluidic platforms for biomedical applications—A review. Lab Chip 2017, 17, 209–226. [Google Scholar] [CrossRef] [PubMed]
  3. Kumacheva, E.; Garstecki, P. Microfluidic Reactors for Polymer Particles; Wiley-Blackwell: Oxford, UK, 2011. [Google Scholar]
  4. Kim, J. Joining plasmonics with microfluidics: From convenience to inevitability. Lab Chip 2012, 12, 3611. [Google Scholar] [CrossRef] [PubMed]
  5. Guo, Z.-X.; Zeng, Q.; Zhang, M.; Hong, L.-Y.; Zhao, Y.-F.; Liu, W.; Guo, S.-S.; Zhao, X.-Z. Valve-based microfluidic droplet micromixer and mercury (II) ion detection. Sens. Actuators A Phys. 2011, 172, 546–551. [Google Scholar] [CrossRef]
  6. Cao, J.; Nagl, S.; Kothe, E.; Köhler, J.M. Oxygen sensor nanoparticles for monitoring bacterial growth and characterization of dose–response functions in microfluidic screenings. Microchim. Acta 2015, 182, 385–394. [Google Scholar] [CrossRef]
  7. Kung, C.-T.; Gao, H.; Lee, C.-Y.; Wang, Y.-N.; Dong, W.; Ko, C.-H.; Wang, G.; Fu, L.-M. Microfluidic synthesis control technology and its application in drug delivery, bioimaging, biosensing, environmental analysis and cell analysis. Chem. Eng. J. 2020, 399, 125748. [Google Scholar] [CrossRef]
  8. Serra, C.A.; Chang, Z. Microfluidic-Assisted Synthesis of Polymer Particles. Chem. Eng. Technol. 2008, 31, 1099–1115. [Google Scholar] [CrossRef]
  9. Zhang, L.; Wang, Y.; Tong, L.; Xia, Y. Seed-Mediated Synthesis of Silver Nanocrystals with Controlled Sizes and Shapes in Droplet Microreactors Separated by Air. Langmuir 2013, 29, 15719–15725. [Google Scholar] [CrossRef]
  10. Gonidec, M.; Puigmartí-Luis, J. Continuous- versus Segmented-Flow Microfluidic Synthesis in Materials Science. Crystals 2018, 9, 12. [Google Scholar] [CrossRef] [Green Version]
  11. Uson, L.; Sebastian, V.; Arruebo, M.; Santamaria, J. Continuous microfluidic synthesis and functionalization of gold nanorods. Chem. Eng. J. 2016, 285, 286–292. [Google Scholar] [CrossRef] [Green Version]
  12. Knauer, A.; Thete, A.; Li, S.; Romanus, H.; Csáki, A.; Fritzsche, W.; Köhler, J.M. Au/Ag/Au double shell nanoparticles with narrow size distribution obtained by continuous micro segmented flow synthesis. Chem. Eng. J. 2011, 166, 1164–1169. [Google Scholar] [CrossRef]
  13. Wacker, J.B.; Lignos, I.; Parashar, V.K.; Gijs, M.A.M. Controlled synthesis of fluorescent silica nanoparticles inside microfluidic droplets. Lab Chip 2012, 12, 3111. [Google Scholar] [CrossRef] [PubMed] [Green Version]
  14. Gashti, M.P.; Asselin, J.; Barbeau, J.; Boudreau, D.; Greener, J. A microfluidic platform with pH imaging for chemical and hydrodynamic stimulation of intact oral biofilms. Lab Chip 2016, 16, 1412–1419. [Google Scholar] [CrossRef] [PubMed]
  15. Zhang, K.; Zhang, H.; Li, W.; Tian, Y.; Li, S.; Zhao, J.; Li, Y. PtOEP/PS composite particles based on fluorescent sensor for dissolved oxygen detection. Mater. Lett. 2016, 172, 112–115. [Google Scholar] [CrossRef]
  16. Kronfeld, K.-P.; Ellinger, T.; Köhler, J.M. Microfluidically prepared sensor particles for determination of chloride by fluorescence quenching of matrix-embedded lucigenin. SN Appl. Sci. 2020, 2, 366. [Google Scholar] [CrossRef] [Green Version]
  17. Lafleur, J.P.; Senkbeil, S.; Jensen, T.G.; Kutter, J.P. Gold nanoparticle-based optical microfluidic sensors for analysis of environmental pollutants. Lab Chip 2012, 12, 4651. [Google Scholar] [CrossRef] [PubMed]
  18. He, J.; Boegli, M.; Bruzas, I.; Lum, W.; Sagle, L. Patterned Plasmonic Nanoparticle Arrays for Microfluidic and Multiplexed Biological Assays. Anal. Chem. 2015, 87, 11407–11414. [Google Scholar] [CrossRef]
  19. Liu, Y.; Xie, S.; Xiao, X.; Li, S.; Gao, F.; Zhang, Z.; Du, J. Fabricating metal nanoparticle arrays at specified and localized regions of microfluidic chip for LSPR sensing. Microelectron. Eng. 2016, 151, 7–11. [Google Scholar] [CrossRef]
  20. Chen, J.-S.; Chen, P.-F.; Lin, H.T.-H.; Huang, N.-T. A Localized Surface Plasmon Resonance (LSPR) sensor integrated automated microfluidics for multiplex inflammatory biomarker detection. Analyst 2020, 145, 7654–7661. [Google Scholar] [CrossRef]
  21. Aigner, D.; Ungerböck, B.; Mayr, T.; Saf, R.; Klimant, I.; Borisov, S.M. Fluorescent materials for pH sensing and imaging based on novel 1,4-diketopyrrolo-[3,4-c]pyrrole dyes. J. Mater. Chem. C 2013, 1, 5685. [Google Scholar] [CrossRef] [Green Version]
  22. Borisov, S.M.; Herrod, D.L.; Klimant, I. Fluorescent poly(styrene-block-vinylpyrrolidone) nanobeads for optical sensing of pH. Sens. Actuators B Chem. 2009, 139, 52–58. [Google Scholar] [CrossRef]
  23. Ehgartner, J.; Strobl, M.; Bolivar, J.M.; Rabl, D.; Rothbauer, M.; Ertl, P.; Borisov, S.M.; Mayr, T. Simultaneous Determination of Oxygen and pH Inside Microfluidic Devices Using Core–Shell Nanosensors. Anal. Chem. 2016, 88, 9796–9804. [Google Scholar] [CrossRef] [PubMed]
  24. Frens, G. Controlled Nucleation for the Regulation of the Particle Size in Monodisperse Gold Suspensions. Nat. Phys. Sci. 1973, 241, 20–22. [Google Scholar] [CrossRef]
  25. Köhler, J.M.; März, A.; Popp, J.; Knauer, A.; Kraus, I.; Faerber, J.; Serra, C. Polyacrylamid/Silver Composite Particles Produced via Microfluidic Photopolymerization for Single Particle-Based SERS Microsensorics. Anal. Chem. 2013, 85, 313–318. [Google Scholar] [CrossRef] [PubMed]
  26. Visaveliya, N.; Köhler, J.M. Microfluidic Assisted Synthesis of Multipurpose Polymer Nanoassembly Particles for Fluorescence, LSPR, and SERS Activities. Small 2015, 11, 6435–6443. [Google Scholar] [CrossRef]
  27. Hassan, N.; Cabuil, V.; Abou-Hassan, A. Continuous Multistep Microfluidic Assisted Assembly of Fluorescent, Plasmonic, and Magnetic Nanostructures. Angew. Chem. Int. Ed. 2013, 52, 1994–1997. [Google Scholar] [CrossRef]
  28. Scheucher, E.; Wilhelm, S.; Wolfbeis, O.S.; Hirsch, T.; Mayr, T. Composite particles with magnetic properties, near-infrared excitation, and far-red emission for luminescence-based oxygen sensing. Microsyst. Nanoeng. 2015, 1, 15026. [Google Scholar] [CrossRef] [Green Version]
  29. Chen, S.-P.; Yu, X.-D.; Xu, J.-J.; Chen, H.-Y. Gold nanoparticles-coated magnetic microspheres as affinity matrix for detection of hemoglobin A1c in blood by microfluidic immunoassay. Biosens. Bioelectron. 2011, 26, 4779–4784. [Google Scholar] [CrossRef]
  30. Sukhorukov, G.B.; Rogach, A.L.; Garstka, M.; Springer, S.; Parak, W.J.; Muñoz-Javier, A.; Kreft, O.; Skirtach, A.G.; Susha, A.S.; Ramaye, Y.; et al. Multifunctionalized Polymer Microcapsules: Novel Tools for Biological and Pharmacological Applications. Small 2007, 3, 944–955. [Google Scholar] [CrossRef] [PubMed]
  31. Verma, S.K.; Amoah, A.; Schellhaas, U.; Winterhalter, M.; Springer, S.; Kolesnikova, T.A. “To Catch or Not to Catch”: Microcapsule-Based Sandwich Assay for Detection of Proteins and Nucleic Acids. Adv. Funct. Mater. 2016, 26, 6015–6024. [Google Scholar] [CrossRef]
  32. Kolesnikova, T.A.; Kiragosyan, G.; Le, T.H.N.; Springer, S.; Winterhalter, M. Protein A Functionalized Polyelectrolyte Microcapsules as a Universal Platform for Enhanced Targeting of Cell Surface Receptors. ACS Appl. Mater. Interfaces 2017, 9, 11506–11517. [Google Scholar] [CrossRef]
  33. Sun, J.; Xianyu, Y.; Jiang, X. Point-of-care biochemical assays using gold nanoparticle-implemented microfluidics. Chem. Soc. Rev. 2014, 43, 6239–6253. [Google Scholar] [CrossRef] [PubMed]
  34. Wang, D.-S.; Fan, S.-K. Microfluidic Surface Plasmon Resonance Sensors: From Principles to Point-of-Care Applications. Sensors 2016, 16, 1175. [Google Scholar] [CrossRef] [PubMed] [Green Version]
  35. Zhang, Y.; Tang, Y.; Hsieh, Y.-H.; Hsu, C.-Y.; Xi, J.; Lin, K.-J.; Jiang, X. Towards a high-throughput label-free detection system combining localized-surface plasmon resonance and microfluidics. Lab Chip 2012, 12, 3012. [Google Scholar] [CrossRef] [PubMed] [Green Version]
  36. Csáki, A.; Stranik, O.; Fritzsche, W. Localized surface plasmon resonance based biosensing. Expert Rev. Mol. Diagn. 2018, 18, 279–296. [Google Scholar] [CrossRef] [PubMed]
  37. SadAbadi, H.; Badilescu, S.; Packirisamy, M.; Wüthrich, R. Integration of gold nanoparticles in PDMS microfluidics for lab-on-a-chip plasmonic biosensing of growth hormones. Biosens. Bioelectron. 2013, 44, 77–84. [Google Scholar] [CrossRef] [PubMed]
  38. Doherty, B.; Csáki, A.; Thiele, M.; Zeisberger, M.; Schwuchow, A.; Kobelke, J.; Fritzsche, W.; Schmidt, M.A. Nanoparticle functionalised small-core suspended-core fibre—a novel platform for efficient sensing. Biomed. Opt. Express 2017, 8, 790. [Google Scholar] [CrossRef] [PubMed]
  39. Bhardwaj, H.; Sumana, G.; Marquette, C.A. A label-free ultrasensitive microfluidic surface Plasmon resonance biosensor for Aflatoxin B1 detection using nanoparticles integrated gold chip. Food Chem. 2020, 307, 125530. [Google Scholar] [CrossRef] [PubMed]
  40. Fang, C.; Zhao, G.; Xiao, Y.; Zhao, J.; Zhang, Z.; Geng, B. Facile Growth of High-Yield Gold Nanobipyramids Induced by Chloroplatinic Acid for High Refractive Index Sensing Properties. Sci. Rep. 2016, 6, 36706. [Google Scholar] [CrossRef]
  41. Huang, C.; Bonroy, K.; Reekmans, G.; Laureyn, W.; Verhaegen, K.; De Vlaminck, I.; Lagae, L.; Borghs, G. Localized surface plasmon resonance biosensor integrated with microfluidic chip. Biomed. Microdevices 2009, 11, 893–901. [Google Scholar] [CrossRef]
  42. Frederix, F.; Friedt, J.-M.; Choi, K.-H.; Laureyn, W.; Campitelli, A.; Mondelaers, D.; Maes, G.; Borghs, G. Biosensing Based on Light Absorption of Nanoscaled Gold and Silver Particles. Anal. Chem. 2003, 75, 6894–6900. [Google Scholar] [CrossRef]
  43. Steinbrück, A.; Stranik, O.; Csaki, A.; Fritzsche, W. Sensoric potential of gold–silver core–shell nanoparticles. Anal. Bioanal. Chem. 2011, 401, 1241–1249. [Google Scholar] [CrossRef] [PubMed]
  44. Turkevich, J.; Stevenson, P.C.; Hillier, J. A study of the nucleation and growth processes in the synthesis of colloidal gold. Discuss. Faraday Soc. 1951, 11, 55. [Google Scholar] [CrossRef]
  45. Thiele, M.; Soh, J.Z.E.; Knauer, A.; Malsch, D.; Stranik, O.; Müller, R.; Csáki, A.; Henkel, T.; Köhler, J.M.; Fritzsche, W. Gold nanocubes—Direct comparison of synthesis approaches reveals the need for a microfluidic synthesis setup for a high reproducibility. Chem. Eng. J. 2016, 288, 432–440. [Google Scholar] [CrossRef]
  46. Wieduwilt, T.; Zeisberger, M.; Thiele, M.; Doherty, B.; Chemnitz, M.; Csaki, A.; Fritzsche, W.; Schmidt, M.A. Gold-reinforced silver nanoprisms on optical fiber tapers—A new base for high precision sensing. APL Photonics 2016, 1, 066102. [Google Scholar] [CrossRef] [Green Version]
  47. Ebert, S.; Travis, K.; Lincoln, B.; Guck, J. Fluorescence ratio thermometry in a microfluidic dual-beam laser trap. Opt. Express 2007, 15, 15493. [Google Scholar] [CrossRef]
  48. Leslie, D.C.; Seker, E.; Bazydlo, L.A.L.; Strachan, B.C.; Landers, J.P. Platinum nanoparticle-facilitated reflective surfaces for non-contact temperature control in microfluidic devices for PCR amplification. Lab Chip 2012, 12, 127–132. [Google Scholar] [CrossRef]
  49. Geitenbeek, R.G.; Vollenbroek, J.C.; Weijgertze, H.M.H.; Tregouet, C.B.M.; Nieuwelink, A.-E.; Kennedy, C.L.; Weckhuysen, B.M.; Lohse, D.; Van Blaaderen, A.; Van Den Berg, A.; et al. Luminescence thermometry for in situ temperature measurements in microfluidic devices. Lab Chip 2019, 19, 1236–1246. [Google Scholar] [CrossRef] [Green Version]
  50. Petrov, A.I.; Volodkin, D.V.; Sukhorukov, G.B. Protein-Calcium Carbonate Coprecipitation: A Tool for Protein Encapsulation. Biotechnol. Prog. 2008, 21, 918–925. [Google Scholar] [CrossRef]
  51. Kreft, O.; Javier, A.M.; Sukhorukov, G.B.; Parak, W.J. Polymer microcapsules as mobile local pH-sensors. J. Mater. Chem. 2007, 17, 4471. [Google Scholar] [CrossRef]
  52. Poehler, E.; Herzog, C.; Suendermann, M.; Pfeiffer, S.A.; Nagl, S. Development of microscopic time-domain dual lifetime referencing luminescence detection for pH monitoring in microfluidic free-flow isoelectric focusing. Eng. Life Sci. 2015, 15, 276–285. [Google Scholar] [CrossRef]
  53. Sun, S.; Ungerböck, B.; Mayr, T. Imaging of oxygen in microreactors and microfluidic systems. Methods Appl. Fluoresc 2015, 3, 034002. [Google Scholar] [CrossRef] [PubMed] [Green Version]
  54. Becker, W. Fluorescence lifetime imaging—techniques and applications. J. Microsc. 2012, 247, 119–136. [Google Scholar] [CrossRef] [PubMed]
  55. Horka, M.; Sun, S.; Ruszczak, A.; Garstecki, P.; Mayr, T. Lifetime of Phosphorescence from Nanoparticles Yields Accurate Measurement of Concentration of Oxygen in Microdroplets, Allowing One To Monitor the Metabolism of Bacteria. Anal. Chem. 2016, 88, 12006–12012. [Google Scholar] [CrossRef] [PubMed]
  56. Yabuki, Y.; Iwamoto, Y.; Tsukada, K. Micro/nano particle-based oxygen sensing film for monitoring respiration of cells cultured in a microfluidic device. Jpn. J. Appl. Phys. 2019, 58, SDDK03. [Google Scholar] [CrossRef]
  57. Lasave, L.C.; Borisov, S.M.; Ehgartner, J.; Mayr, T. Quick and simple integration of optical oxygen sensors into glass-based microfluidic devices. RSC Adv. 2015, 5, 70808–70816. [Google Scholar] [CrossRef]
  58. Ungerböck, B.; Pohar, A.; Mayr, T.; Plazl, I. Online oxygen measurements inside a microreactor with modeling of transport phenomena. Microfluid. Nanofluidics 2013, 14, 565–574. [Google Scholar] [CrossRef]
  59. Borisov, S.M.; Klimant, I. Luminescent nanobeads for optical sensing and imaging of dissolved oxygen. Microchim. Acta 2009, 164, 7–15. [Google Scholar] [CrossRef]
  60. Ungerböck, B.; Fellinger, S.; Sulzer, P.; Abel, T.; Mayr, T. Magnetic optical sensor particles: A flexible analytical tool for microfluidic devices. Analyst 2014, 139, 2551–2559. [Google Scholar] [CrossRef] [Green Version]
  61. Kim, H.D.; Yi, S.J.; Kim, K.C. Simultaneous measurement of dissolved oxygen concentration and velocity field in microfluidics using oxygen-sensitive particles. Microfluid. Nanofluidics 2013, 15, 139–149. [Google Scholar] [CrossRef]
  62. Zhou, X.; Lee, S.; Xu, Z.; Yoon, J. Recent Progress on the Development of Chemosensors for Gases. Chem. Rev. 2015, 115, 7944–8000. [Google Scholar] [CrossRef]
  63. Ji, H.; Zeng, W.; Li, Y. Gas sensing mechanisms of metal oxide semiconductors: A focus review. Nanoscale 2019, 11, 22664–22684. [Google Scholar] [CrossRef] [PubMed]
  64. Tofighi, G.; Degler, D.; Junker, B.; Müller, S.; Lichtenberg, H.; Wang, W.; Weimar, U.; Barsan, N.; Grunwaldt, J.-D. Microfluidically synthesized Au, Pd and AuPd nanoparticles supported on SnO2 for gas sensing applications. Sens. Actuators B Chem. 2019, 292, 48–56. [Google Scholar] [CrossRef] [Green Version]
  65. Salve, M.; Mandal, A.; Amreen, K.; Pattnaik, P.K.; Goel, S. Greenly synthesized silver nanoparticles for supercapacitor and electrochemical sensing applications in a 3D printed microfluidic platform. Microchem. J. 2020, 157, 104973. [Google Scholar] [CrossRef]
  66. Zheng, L.; Cai, G.; Wang, S.; Liao, M.; Li, Y.; Lin, J. A microfluidic colorimetric biosensor for rapid detection of Escherichia coli O157:H7 using gold nanoparticle aggregation and smart phone imaging. Biosens. Bioelectron. 2019, 124–125, 143–149. [Google Scholar] [CrossRef]
  67. Nagatani, N.; Yamanaka, K.; Ushijima, H.; Koketsu, R.; Sasaki, T.; Ikuta, K.; Saito, M.; Miyahara, T.; Tamiya, E. Detection of influenza virus using a lateral flow immunoassay for amplified DNA by a microfluidic RT-PCR chip. Analyst 2012, 137, 3422. [Google Scholar] [CrossRef] [PubMed]
  68. Kim, Y.T.; Chen, Y.; Choi, J.Y.; Kim, W.-J.; Dae, H.-M.; Jung, J.; Seo, T.S. Integrated microdevice of reverse transcription-polymerase chain reaction with colorimetric immunochromatographic detection for rapid gene expression analysis of influenza A H1N1 virus. Biosens. Bioelectron. 2012, 33, 88–94. [Google Scholar] [CrossRef] [PubMed]
  69. Wang, L.; McCord, B. A four-channel paper microfluidic device with gold nanoparticles and aptamers for seized drugs. Anal. Biochem. 2020, 595, 113619. [Google Scholar] [CrossRef]
  70. Zhao, Y.; Liu, X.; Li, J.; Qiang, W.; Sun, L.; Li, H.; Xu, D. Microfluidic chip-based silver nanoparticles aptasensor for colorimetric detection of thrombin. Talanta 2016, 150, 81–87. [Google Scholar] [CrossRef]
  71. Evans, E.; Moreira Gabriel, E.F.; Benavidez, T.E.; Tomazelli Coltro, W.K.; Garcia, C.D. Modification of microfluidic paper-based devices with silica nanoparticles. Analyst 2014, 139, 5560–5567. [Google Scholar] [CrossRef] [Green Version]
  72. Tsai, T.-T.; Huang, C.-Y.; Chen, C.-A.; Shen, S.-W.; Wang, M.-C.; Cheng, C.-M.; Chen, C.-F. Diagnosis of Tuberculosis Using Colorimetric Gold Nanoparticles on a Paper-Based Analytical Device. ACS Sens. 2017, 2, 1345–1354. [Google Scholar] [CrossRef]
  73. Tseng, S.-C.; Yu, C.-C.; Wan, D.; Chen, H.-L.; Wang, L.A.; Wu, M.-C.; Su, W.-F.; Han, H.-C.; Chen, L.-C. Eco-Friendly Plasmonic Sensors: Using the Photothermal Effect to Prepare Metal Nanoparticle-Containing Test Papers for Highly Sensitive Colorimetric Detection. Anal. Chem. 2012, 84, 5140–5145. [Google Scholar] [CrossRef] [PubMed]
  74. Reuter, C.; Urban, M.; Arnold, M.; Stranik, O.; Csáki, A.; Fritzsche, W. 2-LED-µSpectrophotometer for Rapid On-Site Detection of Pathogens Using Noble-Metal Nanoparticle-Based Colorimetric Assays. Appl. Sci. 2020, 10, 2658. [Google Scholar] [CrossRef] [Green Version]
  75. Yang, J.; Yu, J.-H.; Rudi Strickler, J.; Chang, W.-J.; Gunasekaran, S. Nickel nanoparticle–chitosan-reduced graphene oxide-modified screen-printed electrodes for enzyme-free glucose sensing in portable microfluidic devices. Biosens. Bioelectron. 2013, 47, 530–538. [Google Scholar] [CrossRef] [PubMed]
Figure 1. Examples of microfluidic devices, which are used for the emulsification of a monomer. Microchannel-based devices: (A) terrace-like device, (B) T-junction device, (C) flow focusing device. Capillary-based devices: (D) co-flow device, (E) cross-flow device, (F) flow focusing device. CP—continuous phase, DP—dispersed phase. Reproduced from [8]. Copyright (2008) Wiley-VCH GmbH. Reproduced with permission.
Applsci 10 08353 g001
Figure 2. Schematic illustration of the generation of droplets of ethylene glycol (EG) solutions, which were separated by air. Adapted from [9]. Copyright © 2013 American Chemical Society.
Applsci 10 08353 g002
Figure 3. Experimental set-up for microfluidic generation of hydrogel sensor particles. Adapted from [16]. Copyright © 2020 Springer Nature.
Applsci 10 08353 g003
Figure 4. Schematic representation of emulsion polymerization of the copolymer nanoparticles [26]. Copyright Wiley-VCH GmbH. Reproduced with permission.
Applsci 10 08353 g004
Figure 5. A two-step microfluidic process for the formation of multifunctional nanoparticles/fluorescent silica sphere assemblies [27]. Copyright Wiley-VCH GmbH. Reproduced with permission.
Applsci 10 08353 g005
Figure 6. (A) Schematic illustration of composition of sensor microparticles. (B) Scheme showing the light cascade inside a sensor particle. Adapted from [28]. Copyright © 2015, Springer Nature.
Applsci 10 08353 g006
Figure 7. Schematic illustration of microcapsule functionalization with targeting antibodies: random antibody immobilization via EDC/sulfo-NHS reaction and optimized immobilization via protein A. Reprinted with permission from [32]. Copyright © 2017, American Chemical Society.
Applsci 10 08353 g007
Figure 8. Schematic model of biosensing protocol. Adapted from [37]. Copyright © 2013 Elsevier.
Applsci 10 08353 g008
Figure 9. Schematic representation of interferometric temperature control system. Adapted from [48]. Copyright 2012 © The Royal Society of Chemistry.
Applsci 10 08353 g009
Figure 10. (A) Model of the microfluidic experimental set-up. (B) Schematic illustration of the optical detector units that consisted of channel microflow-through photometry and fluorimetry. Reprinted from [6] with permission from Springer-Verlag Wien 2014.
Applsci 10 08353 g010
Figure 11. Schematic representation of the experimental setup for monitoring an enzymatic activity in microfluidic reactors with oxygen sensing layer. Adapted from [46]. Copyright © 2015 The Royal Society of Chemistry.
Applsci 10 08353 g011
Figure 12. Schematic illustration of the PGE/AgNPs/CS electrode for effective H2O2 sensing. Adapted from [65]. Copyright © 2020 Elsevier.
Applsci 10 08353 g012
Figure 13. Representation of the two detections methods (“Turn-off” and “Turn-on”) applied for Hg sensing. Adapted from [17]. Copyright © 2012 The Royal Society of Chemistry.
Applsci 10 08353 g013
Figure 14. Schematic illustration of colorimetric biosensor working principle for rapid determination of Escherichia coli O157:H7 by using gold nanoparticle aggregation and smart phone imaging. Reprinted from [66] with permission from Elsevier.
Applsci 10 08353 g014
Figure 15. Fully integrated sensor for visual determination of influenza AH1N1 virus that incorporated a micro-RT-PCR with an immunochromatographic strip (ICS). Reprinted from [68] with permission from Elsevier.
Applsci 10 08353 g015
Table 1. Advantages and challenges of microfluidic synthesis and conventional bulk synthesis of nanoparticles.
Synthesis TypeAdvantagesChallenges
Microfluidic synthesis
  • high reproducibility
  • high encapsulation efficiency
  • large surface to volume ratio
  • low sample consumption
  • efficient mixing
  • narrow particle size distribution
  • control of mass and heat transfer
  • channel clogging
  • preparation costs
  • compatibility of fluid (solvent) and devise surface properties
  • limitations for heating
Conventional bulk synthesis
  • relatively basic setup
  • wide usage in applications
  • easier preparation
  • low efficiency
  • low reproducibility
  • poor control over mixing and nucleation conditions
Table 2. Various methods for sensor particle fabrication with examples of special particle types.
Fabrication MethodParticle TypeMain AdvantageRef.
Continuous single-phase microfluidic synthesisGold nanorodsImproved reproducibility and quality, 100 times reduced consumption of SH-PEG, ability to tune halide concentration at various stages of synthesis.[11]
Continuous micro segmented flow synthesisAu/Ag core/shellEfficient reactants mixing in droplets, high homogeneity, narrow size distribution, smaller particle diameter.[12]
Microdroplet-based synthesisSilica nanoparticlesImprovement of nanoparticle size uniformity (down to 3% relative standard deviation), ability to tune particle size by adjusting reaction time or reagent concentrations[13]
Gas–liquid droplet- based synthesisSilver nanocrystalstunable edge lengths of Ag nanocubes from 30 to 100 nm[9]
Batch synthesisSilver core–silica shell nanoparticlesUsed as the immobilization matrix for pH-sensitive dyes[14]
Surfactant-free emulsion polymerizationPolystyrene particlesGood size distribution, used as the immobilization matrix for oxygen-sensitive dyes[6,15]
Continuous flow synthesisPolyacrylamide hydrogel particlesNarrow size distribution (standard deviation 2–3%), used as the immobilization matrix for lucigenin [16]
Frens–Turkevich methodGold nanoparticles17 nm size particles were functionalized with Rhodamine 6G[17]
Hole mask colloidal lithographynanoparticle arraysScalable and inexpensive fabrication of uniform nanoparticle arrays, ability to tune size of nanoparticles[18,19]
Physical vapor deposition followed by a rapid thermal annealing (RTA)Gold nanostructuresSimple and rapid fabrication[20]
Table 3. Examples of particles for localized surface plasmons resonance (LSPR)-based sensing.
Application (Analyte)Particle TypeSizeFluidic SystemMain AdvantageRef.
Anti-gp41 antibodyAuNPs-Microfluidic chipFast and simple label-free sensing [35]
Bovine growth hormoneAuNPs125 nmPDMS microfluidic chipLow limit of detection (185 pM)[37]
Detecting small quantities of specific target moleculesAuNPs34 nmNanoparticle-functionalized suspended-core fiberLow sample volume and a real-time monitoring of analyte[38]
Aflatoxin B1AuNPs 20 nm-Incorporation of AuNPs on Au chip caused 3-times higher sensitivity and 6-times reduced limit of the detection.[39]
StreptavidinAuNPs130 nm7-channel microfluidic devicesSimultaneous measurements of 6 different protein pairs[18]
BiotinAuNPs14–43 nmMicrofluidic chipDecreased reaction time and lower reagent consumption.[41]
IgG or CRP antibodyAu nanostuctures108 nmFour-channel microfluidic deviceReduced assay time, only 60 μL of sample consumption, limit of a detection of IgG or CRP antibody was 10 ng/mL[20]
Detecting small quantities of specific target moleculesAu nanocubes55–80 nmMicrofluidic DFM-reactorProduced more homogenous and smaller Au seeds used for formation of Au nanocubes, whose sensitivity was twice better than AuNP[45]
Lab-on-a-chip systemsAg nanoprism50 nm Cross-shape microchannel deviceLow cost, high-efficient fabrication of localized silver NP array in a line-shape and a cross-shape microchannels.[19]
Table 4. Application of sensor particles for temperature, pH and O2 sensing.
AnalyteDetection MethodParticle TypeSizeApplicationFluidic SystemMain AdvantageRef.
Temp.Extrinsic Fabry-Perot interferometryPt NPs10–100 nmPolymerase chain reaction Microfluidic deviceUniversal and non-contact temperature sensing with high resolution[48]
Temp.Luminescence thermometryNaYF4:Yb,Er25–35 nmPolymerase chain reactionPDMS/glass chipMeasurements of temperature up to 120 °C with high accuracy (0.34 °C) and improved spatial resolution (up to 9 μm)[49]
pHFluorescenceAg@SiO2 + FiTC NPs110 nmStreptococus salivarius biofilmsY-channel microfluidic deviceGood biocompatibility and photostability led to carrying out the experiment longer than one week[14]
pHFluorescenceSNARF-1 dextran-loaded CaCO34–6 µmbreast cancer cells and fibroblastsMicrofluidic devicepH monitoring in living cells, rapid and efficient microparticles separation from the sample by applying a magnetic field[51]
pHTime-domain dual lifetime referencing (t-DLR)Ru(dpp)3PAN-conalbumin, myoglobin and β-Lactoglobulin A,Microfluidic free-flow isoelectric focusing chipWorking range from pH 4 to 8, rapid response times in the millisecond range[52]
O2PhosphorescencePS-PtTPTBP350 nmbacterial cultivationSegmented flowSimultaneous, real-time and non-invasive measurement of dissolved oxygen, cellular autofluorescence, and cell density in nl-sized droplets[6]
O2Frequency-domain lifetime imagingPSPVP- PtTPTBPF180 nm monitoring the growth of E. coli and M. smegmatis.Microfluidic Cell Culturing DeviceAccurate determination of the absolute oxygen concentration in inside microdroplets with resolution of 0.07–0.12 μM [55]
O2Phosphorescence lifetime imagingPS-(Pd-OEP)0.6–1.6 µm4T1 cellsMicrofluidic deviceGood stability over a long period of time due to formed sensing film, which prevented oxygen-sensitive dye direct contact with living cells. [56]
O2Phosphorescence lifetime imagingPt (II) benzoporphyrin grafted conjugated polymer NPs 30–100 nmGlucose oxidase enzymatic activityMicrofluidic glass chipsLess than 0.2 s response time, optimum sensitivity, excellent stability, possibility to reuse reactor multiple times [57]
O2Epifluorescence microscopyPSPVP- Ir(Cs)2(acac)245 nmGlucose oxidation reactionY-channel microfluidic deviceHigh measurement accuracy (0.03)[58]
O2ratiometric luminescence imagingMOSePs- Ir(Cs)2(acac)160 nmE. coli respiratory activitymicrofluidic deviceAbility to easily form and move sensor spots along the microfluidic channel by applying magnet[60]
O2Time-resolved particle image velocimetry (µ-PIV)PS- PtOEP2.5 µmDI waterY-channel microfluidic deviceSimultaneous determination of velocity and dissolved oxygen concentration, low photobleaching, high accuracy with 0.5% random error.[61]
pH/oxygenFrequency-domain lifetime measurementPSPVP- PtTPTBPF, PSPVP- Aza-BODIP180 nmPenicillin GY-channel microfluidic deviceSimultaneous detection of oxygen and pH, high stability in aqueous media, pH resolution was 0.03–0.1 pH units, resolution of oxygen was 0.02–0.32 mg/l[23]
Table 5. Application of sensor particles for chemical sensing.
ApplicationDetection MethodParticle TypeSizeFluidic SystemMain AdvantageRef.
Gas sensingDiffuse reflectance infrared Fourier-transformed spectroscopy (DRIFTS)Au, Pd, AuPd NPs6–9 nmMicrofluidic chipInvestigated four gas samples, high sensitivity for CO detection[64]
H2O2Cyclic voltammetry (CV)AgNPs-3D Microfluidic channelGreen synthesis of AgNPs using marigold flowers extract, disposable, low-cost device for H2O2 detection in cosmetic and medical samples with limit of the detection of 0.52 µM [65]
Chloride ion FluorescencePAM- Lucigenin800 μmMicrofluidic generation of hydrogel particlesDetermination of chloride concentrations up to 50 mM, only 10 μL of sample consumption [16]
Hg/ZiramFluorescenceAuNPs17–23 nmMicrofluidic chipAutomated sample preparation step, limit of detection was 0.6 µg/L for mercury and 16 µg/L for ziram, wide and linear detection range from 4 µg/L to 200 µg/L[17]
Mercury (II) ionFluorescenceAuNPs-RB-Valve-based microfluidic deviceSample encapsulation into nl or pl droplets, automated and effective mixing of reagents, application for clinical diagnosis or environmental test[5]
E. coli O157:H7Colorimetric assayAuNPs19 nmMicrofluidic deviceLimit of detection was 50 CFU/mL, good sensitivity and specificity for E. coli in chicken samples[66]
Influenza virusColorimetric assayAuNPs40 nmMicrofluidic RT-PCR chipReplication of influenza virus RNA by a continuous-flow RT-PCR chip within 15–20 min, rapid sample measurement within 1 min, naked-eye detection[67]
Influenza virusColorimetric assayAuNPs72 nmRT-PCR-ICS microdeviceIdentification by the naked eye, rapid and simple analysis within 2.5 h, 100 times improved sensitivity in comparison to gel electrophoresis[68]
Cocaine, codeine, methamphetamineColorimetric assayAuNPs20–40 nmfour-channel paper microfluidic deviceSimultaneous, sensitive and specific detection with limit of detection of 4 μg for cocaine, codeine and methamphetamine drugs.[69]
ThrombinColorimetric assayAgNPs35 nmPDMS microfluidic deviceSimple, straightforward and highly specific protein analysis by the naked eye and a flatbed scanner, low sample cost, good linear relationship with the detection limit of 20 pM[70]
Enzymatic reactionsColorimetric assaySiO2 NPs-microfluidic paper-based deviceImproved color intensity and color uniformity by applying SiO2 nanoparticles, semiquantitative detection of lactate, glucose, and glutamate in artificial urine samples within 30 min.[71]
TuberculosisColorimetric assayAuNPs13 nmpaper-based analytical deviceAccurate, simple, low-cost and rapid analysis within 1 h, only 200 μL sample consumption, limit of detection was 0.0195 ng/mL [72]
CysteineColorimetric assayAu, Ag NPs-paper-based microfluidic sensorRapid fabrication time, identification by the naked eye, eco-friendly, low cost, portable test paper can be burned after usage[73]
Legionella pneumophilaColorimetric assayAuNPs13 nm2-LED- μSpectrophotometerlow-cost, easy to use and specific assay, detection limit of 0.5 pg/μL DNA[74]
GlucoseCyclic voltammetryCS-RGO–NiNPs32 nmPDMS microfluidic deviceLinear detection range up to 9 mM with limit of detection of 4.1 µM glucose [75]
Hemoglobin A1cElectrophoresisAu/chitosan/Fe3O4 NP80 nmMicrofluidic deviceRapid detection within 30 min, low reagent consumption, good accuracy with limit of detection of 0.025 µg/mL[29]
Publisher’s Note: MDPI stays neutral with regard to jurisdictional claims in published maps and institutional affiliations.

