Article

Study on Aided Optical Alignment by Programmable Spots Array Generated by Off-Axis Parabolic Phase Based on LCoS-SLM

State Key Laboratory of Precision Measuring Technology & Instruments, Centre of MicroNano Manufacturing Technology—MNMT, Tianjin University, Tianjin 300072, China
*
Author to whom correspondence should be addressed.
Appl. Sci. 2020, 10(23), 8382; https://doi.org/10.3390/app10238382
Submission received: 12 October 2020 / Revised: 20 November 2020 / Accepted: 22 November 2020 / Published: 25 November 2020
(This article belongs to the Section Optics and Lasers)

Abstract

:
We present an aided optical alignment method using the liquid crystal on silicon spatial light modulator (LCoS-SLM). An optical system composed of an interferometer and an LCoS-SLM was established to verify the effectiveness of the method. The system was also calibrated to solve the phase modulation nonlinear and nonuniformity problem for better performance of LCoS-SLM as an easily programmable phase compensator. The LCoS-SLM could modulate the phase of incident light precisely to generate an accurate phase desired to achieve a virtual off-axis parabolic phase to generate light spots array. Finally, the 2 × 2 light spots array generated by the optical system was used to verify its potential in optical alignment.

1. Introduction

Optical instruments based on off-axis interferometry can find many applications in metrology and industrial applications for measuring different parameters in optics metrology, such as refractive index, lens parameters, etc., as reported [1,2,3]. However, it is a difficult and time-consuming work [4] to align optical elements of interferometers, especially in off-axis measurement optical systems [5,6,7,8].
Sometimes, the optical alignment needs expensive additional assistance of wavefront sensor, laser tracker or photoelectric auto-collimator to achieve high alignment accuracy. An array of speckles or diffraction light spots can also be used for aided optical system adjustment. Generally, such controllable focus optical function requires that the optical systems be implied by moving optical components mechanically, and some by the internal liquid [9] or outer driven force to generate the surface deformation of the zoom components. However, those mechanical systems responses slow, and it is not easy to realize miniaturization design. Burge [10] from Arizona optical center used the computer-generated hologram (CGH) to project optical array marks in the measurement of the astronomical telescope primary mirror. The CGH could produce focus spots and crossing speckles with designed focal length and space coordinates so the astronomical telescope primary mirror could be positioned precisely after adjustment.
To find a new cost-effective approach to overcome the difficulty in off-axis optical alignment and measurement, we conduct a study on using a programmable optical system to generate a space position controllable focus light spots array to aid the alignment process. The idea is to use the liquid crystal on silicon spatial light modulator (LCoS-SLM) to generate an off-axis light spots array.
Compared with the deformable micro-mirror [11], the LCoS-SLM could be digitally controlled at the pixel level to realize more flexible functions such as the generation of optical arrays. For example, Huang et al. [12] studied the method to produce high-quality optical vortex arrays. Ge et al. [13] worked on the generation of diffraction light spots array for optical scanning and tracking with the SLM. The LCoS-SLM could be calibrated [14] and compensated for making its phase response character better in optical applications [15], and the nonlinearity phase response has been researched as well [16,17,18,19] to find methods to achieve correct phase modulation performance in its applications. The compensation phase modulation calculation is also a key technique [19]. Based on these studies, the LCoS-SLM could be employed to generate light spot arrays to help the optical alignment.
In principle, an optical alignment procedure could be done in optical surface measurement in an off-axis optical measurement system using the LCoS-SLM as an optical compensator between the incident light and outgoing light. With the proposed optical setup, the off-axis system could generate a focus spots array, which could be employed to adjust the alignment according to some predesigned physical marks (Figure 1a) near the tested optical surface first, shown as Figure 1b. After rotation and translation adjustment, the sample surface could be aligned and positioned precisely. Moreover, then the LCoS-SLM could be used to generate the measurement wavefront and project it to the sample surface to get surface data.

2. Virtual OAP Mirror Based on LCoS-SLM

To satisfy the optical function to control the spatial position of the light spots array, an optical model using the LCoS-SLM to virtual off-axis parabolic mirror (OAP) is built and researched. The general scheme and simulation process are illustrated as follows.

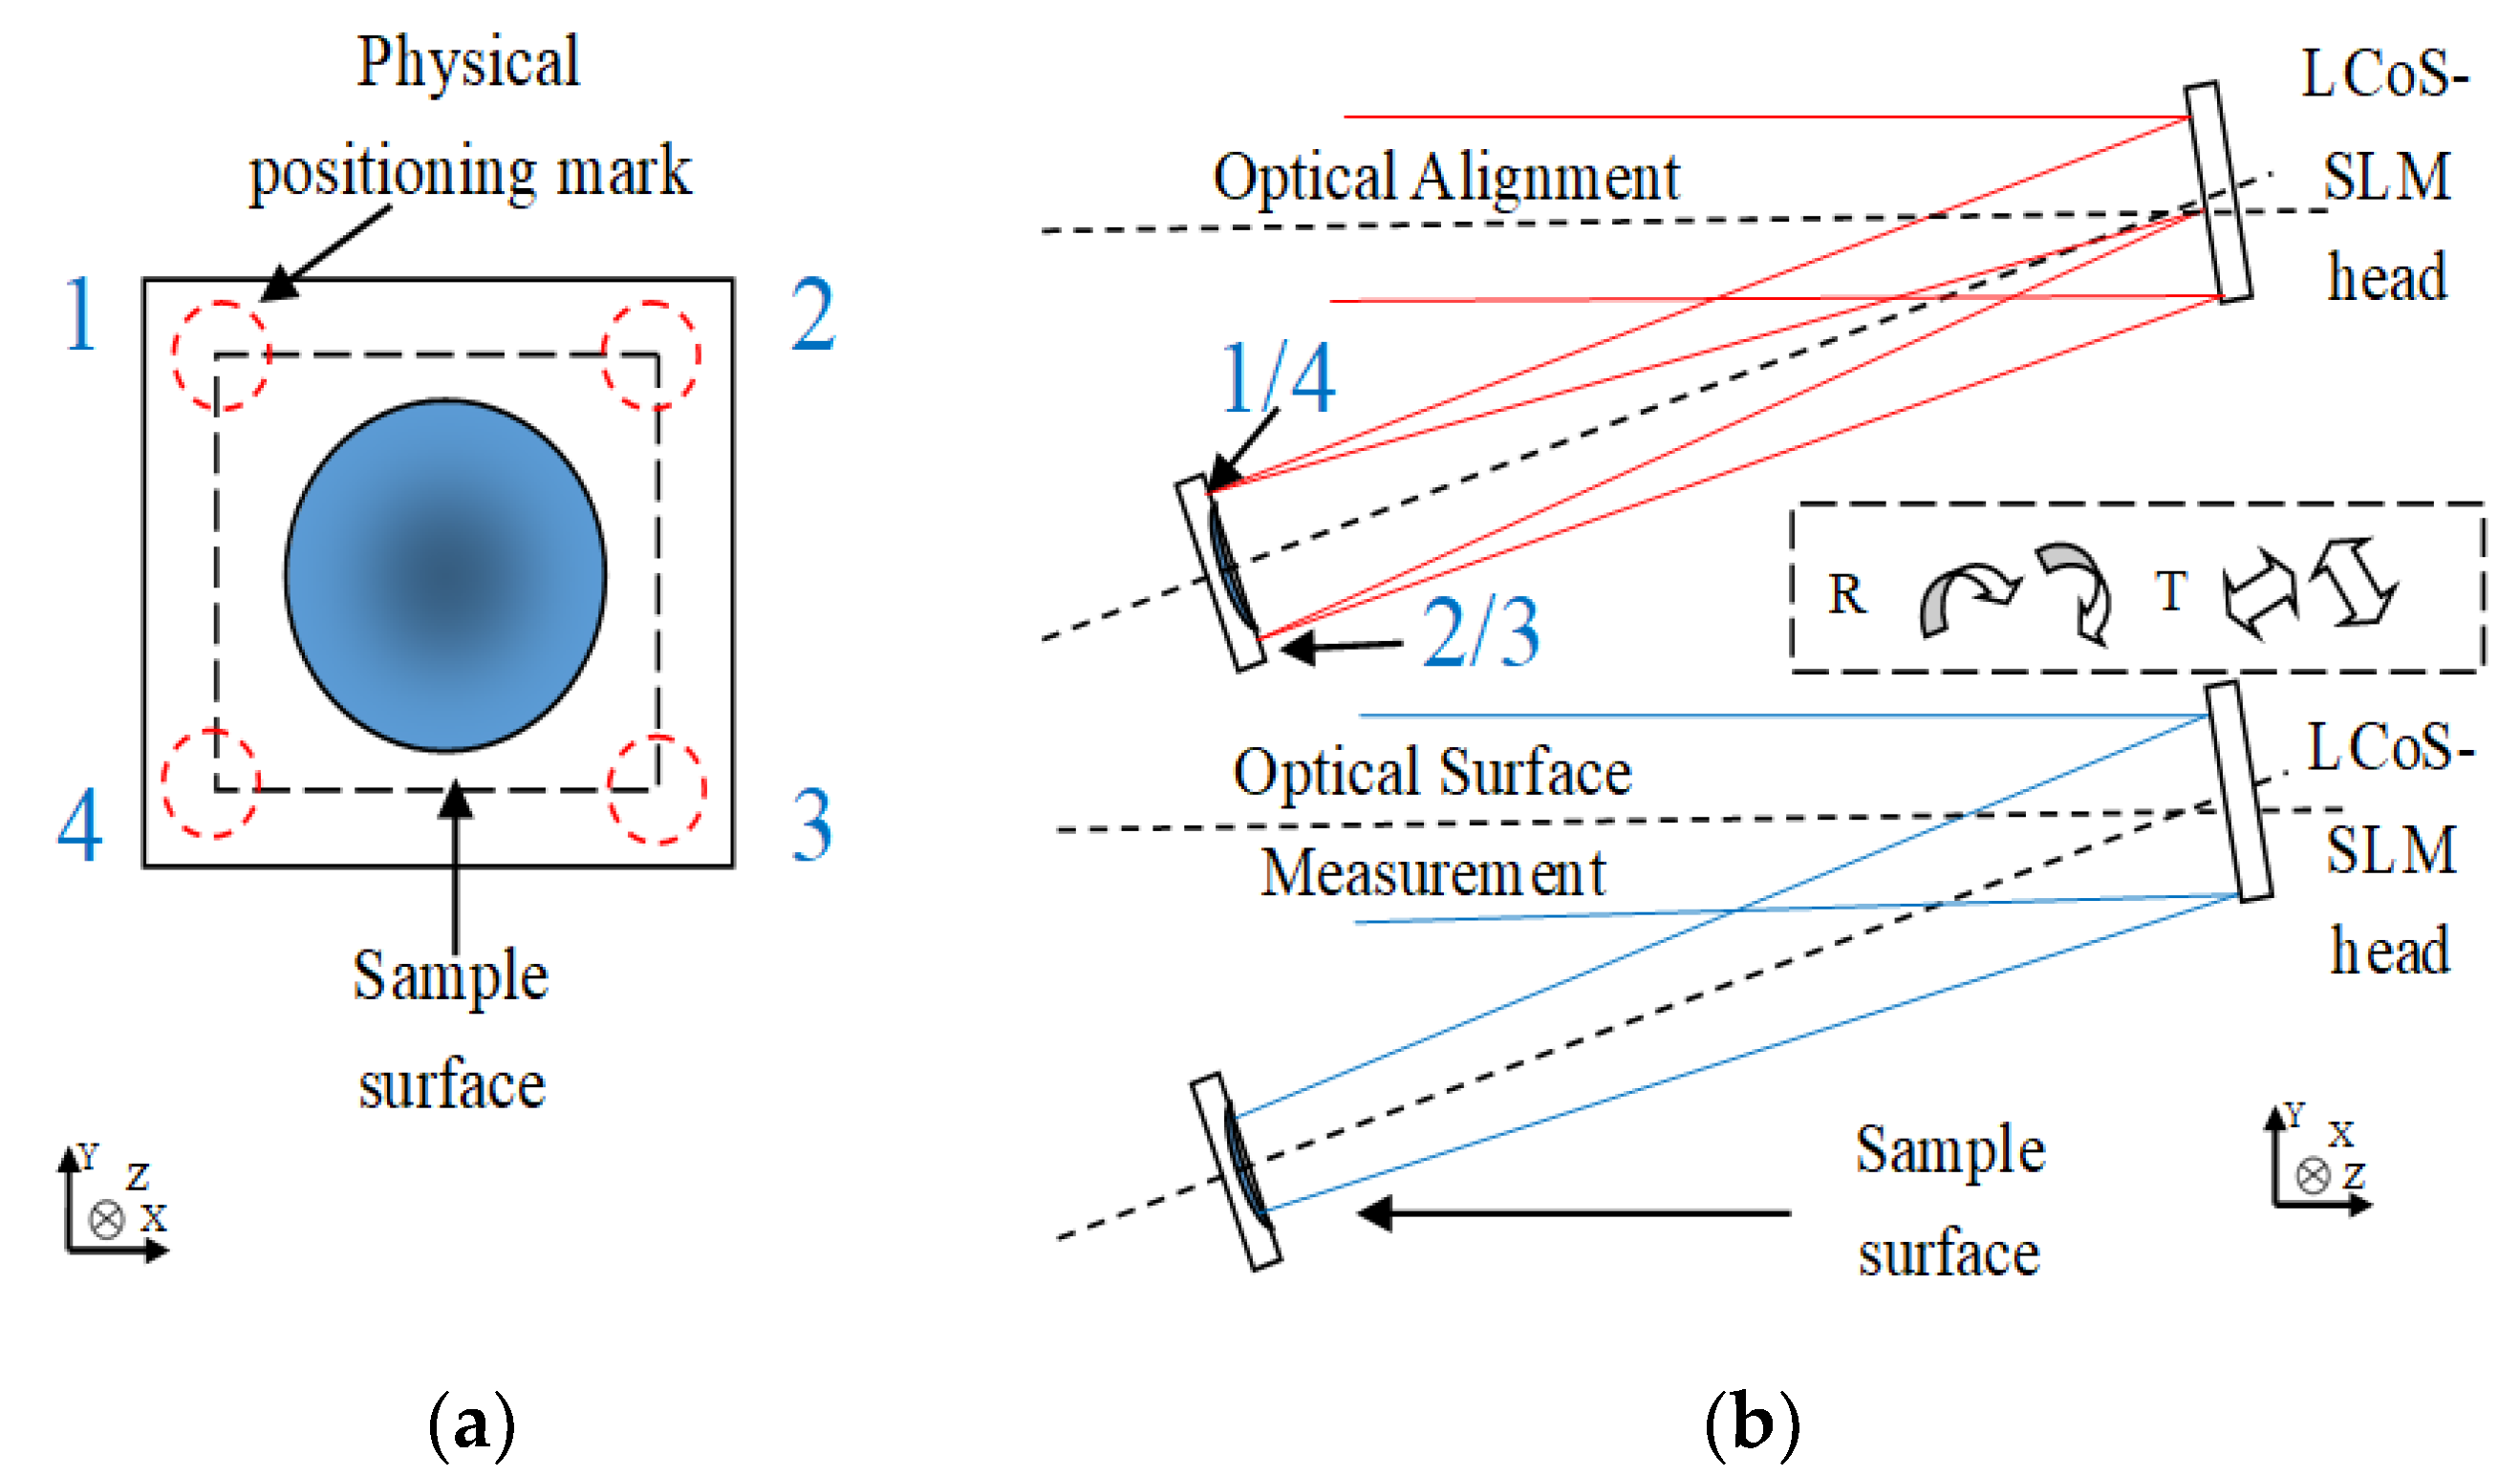
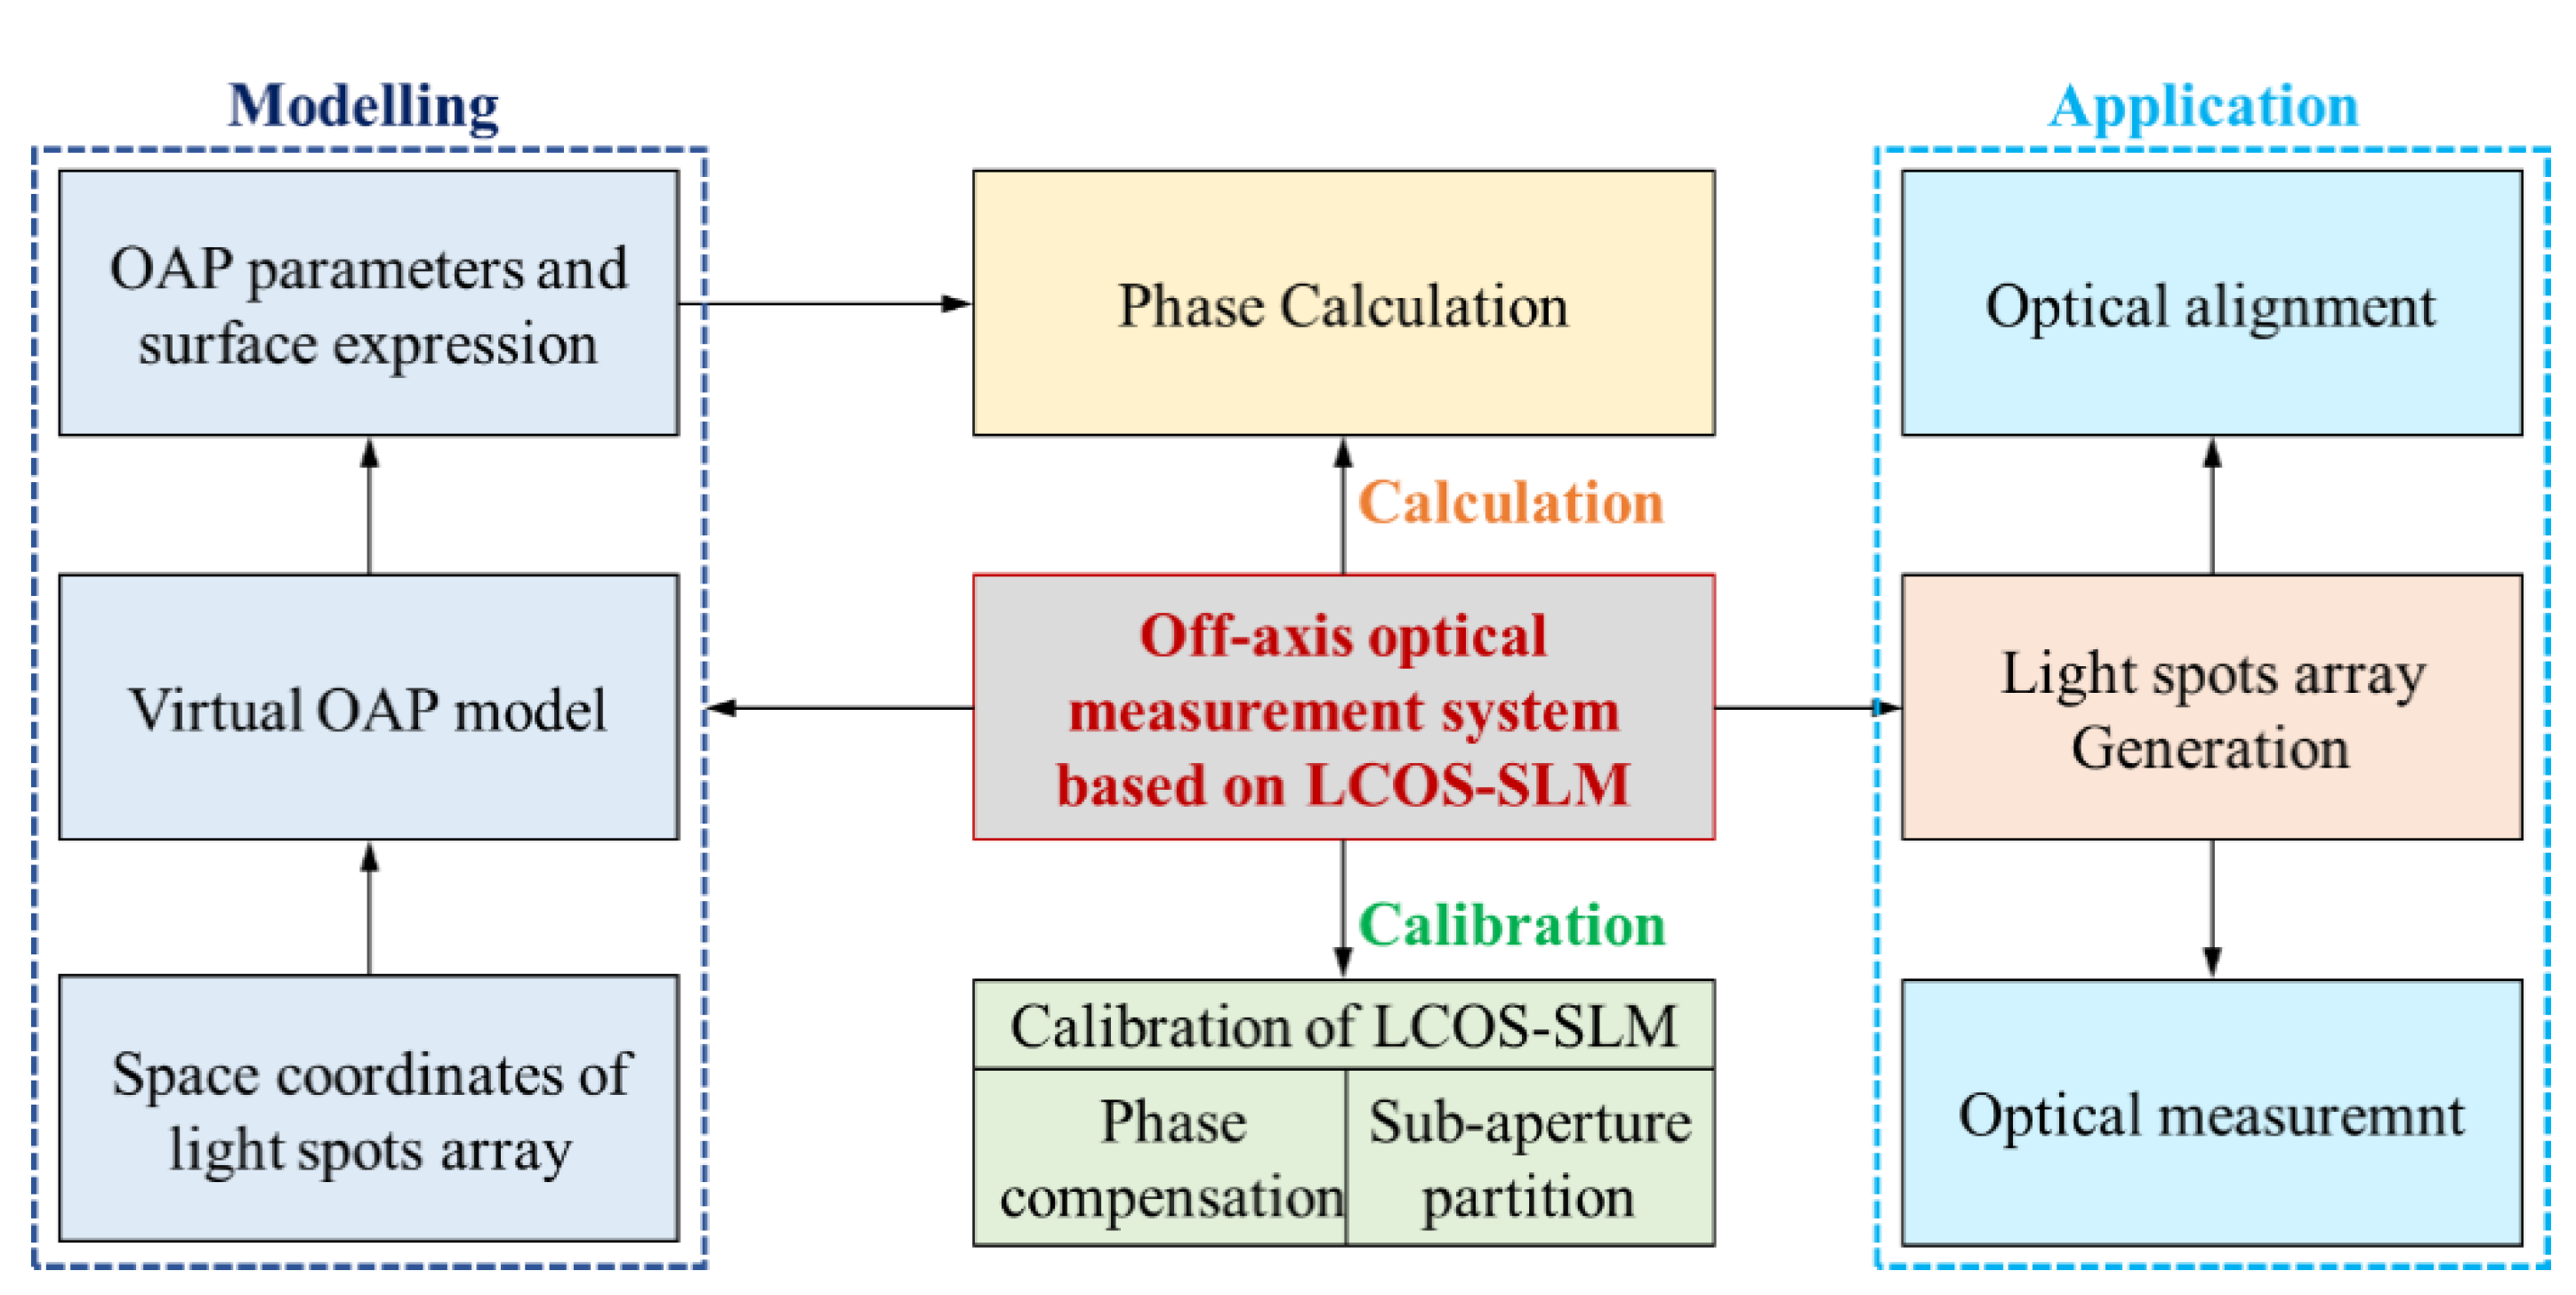
2.1. The General Scheme

The scheme to make the LCoS-SLM work in an optical alignment and measurement is shown in Figure 2. The idea is to replace the role of optical compensators in the interferometry of aspheric surface and free-form surface by using LCoS-SLM with compensating phase modulation. Before that, the LCoS-SLM is designed to generate a light spots array for optical alignment.
After the basic configuration of the off-axis optical interferometry system is set according to the modeling part, the space coordinates of the light spots array are applied to a virtual off-axis parabolic model to compute its geometric-optical parameters and surface expression. Then in the application part, after the LCoS-SLM is calibrated and compensated, the light spots array could be generated for optical alignment. These spots array could be used to adjust the measured surface to a predesigned space position as calculated. The LCoS-SLM is a key optical component to generate the lights spots array in the optical alignment step, and it is also an optical compensator to compensate for the phase difference of the input plane wavefront and the output wavefront in the measurement step for the optical surface.

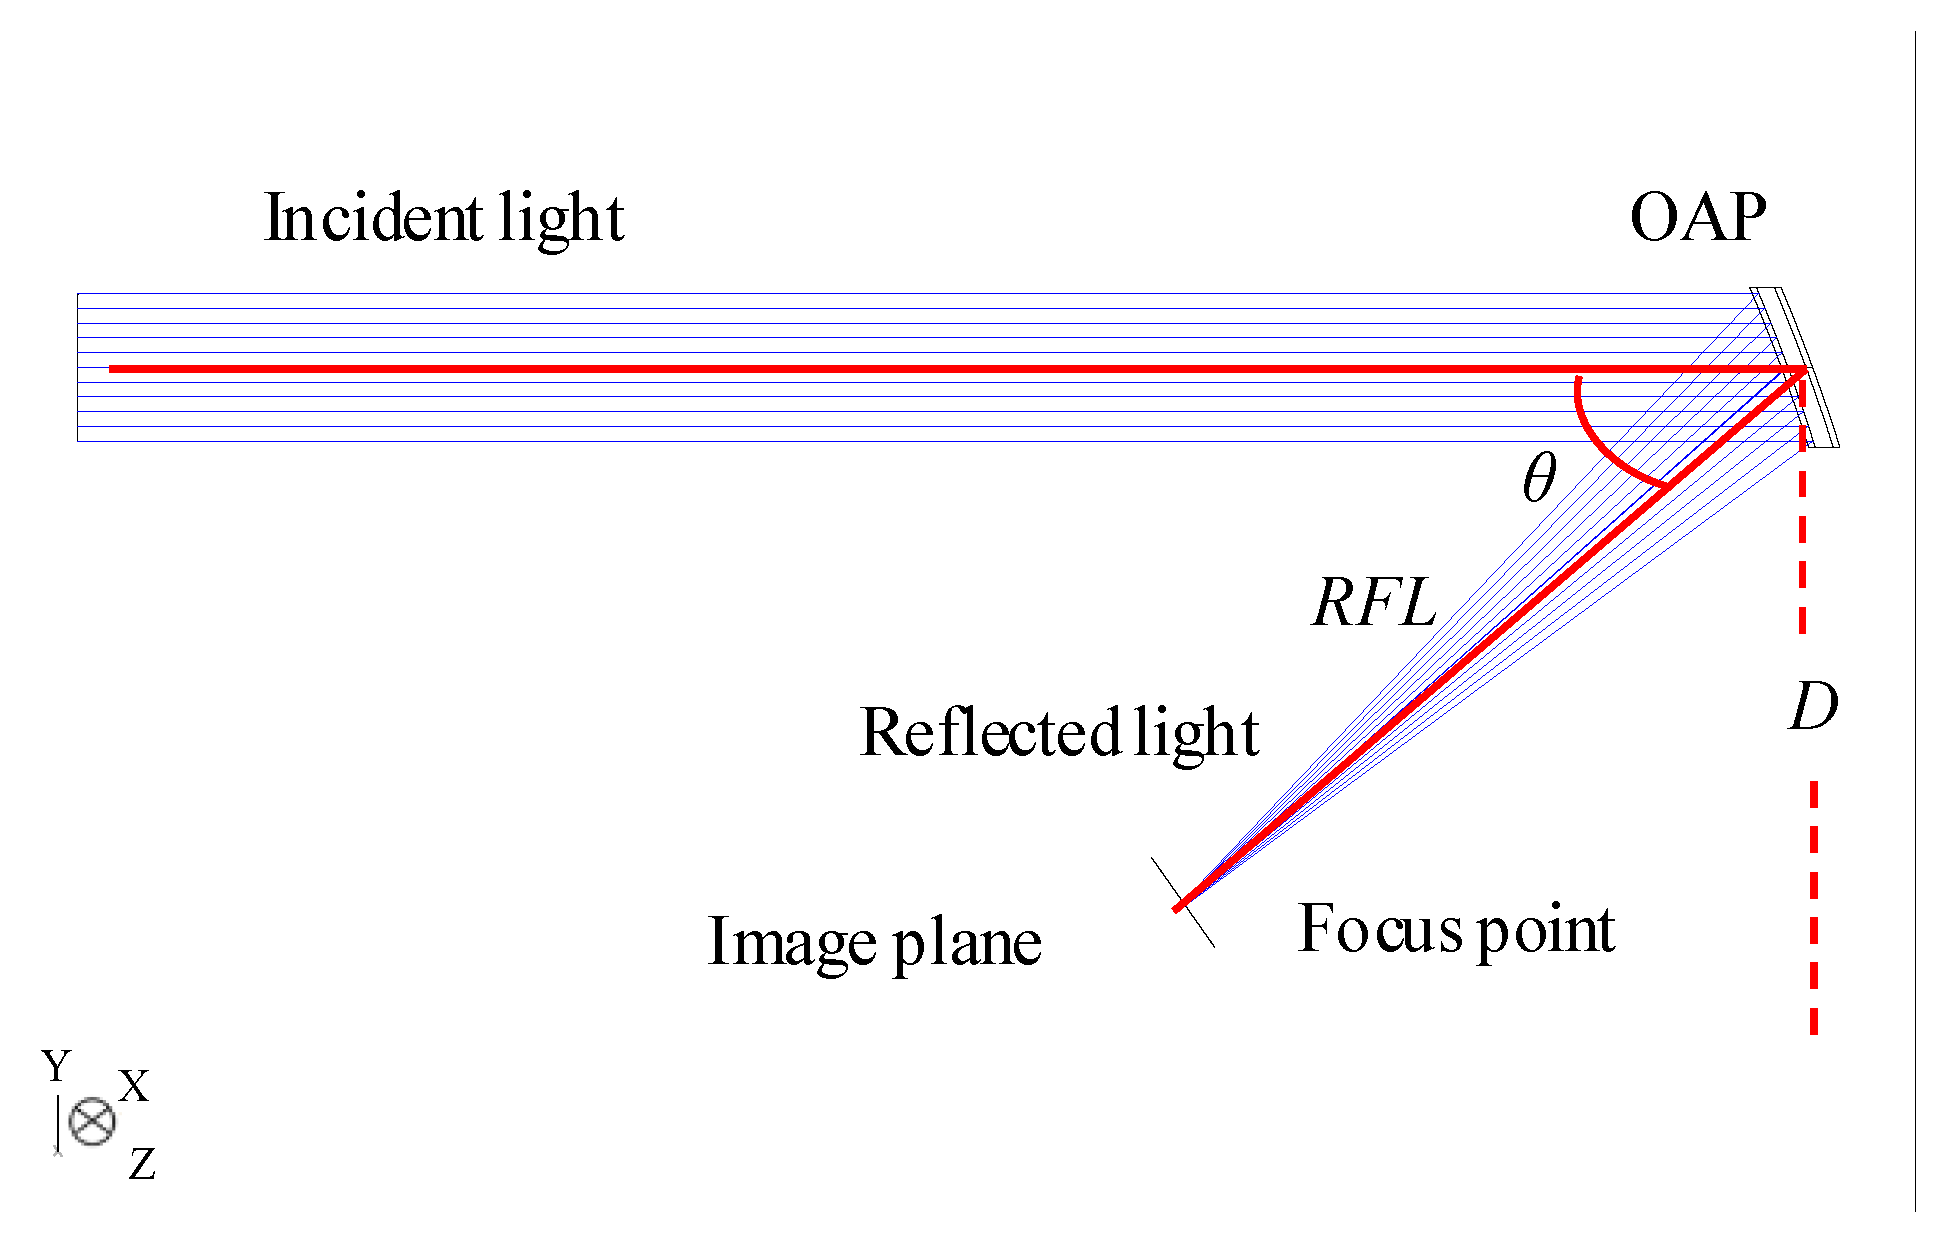
2.2. Modeling and Simulation

The LCoS-SLM is an ideal phase-only modulation component. It can only change the phase of input light without changing its amplitude. With this important feature, LCoS-SLM can be used as an optical compensator, and it could achieve equivalent optical surface function with a specially designed phase loaded.
The optical design of the light path needs to convert the parallel input beam into a focused beam with the help of LCoS-SLM. This function is the same as an off-axis parabolic mirror (Figure 3). In this model, the LCoS-SLM worked as a virtual off-axis parabolic surface, and its role is to compensate for the optical path difference (OPD) between the input plane wavefront and output spherical wavefront. Therefore, the problem is to calculate the compensation phase.
Assuming that the LCoS-SLM is placed directly facing the input light, according to the off-axis angle and the focal length of the OAP model, the calculation of the compensation phase is done by ray tracing. However, the calculated frequency would exceed the limit of the LCoS-SLM spatial frequency and lead to poor optical performance. According to the Nyquist-Shannon sampling theorem, the phase sampling interval should be less than the reciprocal of the largest space-frequency sampling function of LCoS-SLM. The pixel size of LCoS-SLM determines the maximum of its spatial frequency of the phase map, and it affects the system’s ability to project the focus light spot, but its size could not be shrunk. If the calculated phase-frequency overcomes the LCoS-SLM, the focus spot could not be generated properly. Therefore, the LCoS-SLM needs to be rotated by a precision rotation stage in advance to the design off-axis angle and recalculate the OPD and phase.
The entire process is shown in Figure 4. According to the OAP model in Figure 3, the reflected focal length (RFL) of the OAP is defined as L, the off-axis angle as θ, the parent focal length as F and the off-axis magnitude as D. The value of parameters L and θ can be assigned from the wanted focus spot position and the rotation angle of LCoS-SLM. The off-axis magnitude can be calculated as:
D = L sin θ
With these parameters, the parent focal length of the OAP could be calculated by:
F = 0.5 ( 1 + 1 / cos θ ) D
and the mathematical expression of the OAP model is:
Z OAP = C [ ( X + D ) 2 + Y 2 ]
where C = ¼ F. According to Equation (3), the phase of virtual OAP1 could be got. The calculated phase map has over dense phase fringe on the left part. Obviously, the virtual OAP1 model is not suitable for optical experiments.
The coordinates of the virtual OAP2 is obtained from the virtual OAP1 model with the following RT transformation [20]:
( x 2 , y 2 , z 2 ) T = R ( x 1 , y 1 , z 1 ) T + T
where R and T mean the rotational matrix and translation matrix, respectively, with rotational and translation calculations of the coordinate system of the virtual parabolic surface, the phase map of LCoS-SLM can find a suitable solution within the spatial frequency limit.
Moreover, the phase map could be calculated, as well. The density of the phase fringe has been greatly reduced, which is be beneficial to the better performance of the LCoS-SLM. According to the above model, the LCoS-SLM can work as a virtual OAP, and its reflective focus length can be redesigned easily and quickly by programming.

2.3. Optical System Configuration

The optical system configuration is established in Figure 5. The output light of a Fizeau interferometer with a wavelength of 632.8 nm is used directly as a parallel light source. The LCoS-SLM used in the study is produced by HOLOEYE Photonics AG Company (Berlin, Germany), with a pixel size of 8 microns and a normal resolution of 1920 × 1080 LCoS-SLM. Its diffraction efficiency could reach 60%. A polarizer is used to change the input circularly polarized light into linearly polarized light and adjust the direction to the polarization direction of LCoS-SLM. The LCoS-SLM head is installed on a two-axis precision adjustable optical mount and a rotation stage, and it is adjusted at the center of the input light axis and then rotated to the OAP off-axis angle. The LCoS-SLM is connected to a computer to load the phase pattern. A Charge Coupled Device (CCD) camera is placed at the designed focus length to receive the focus light spot.

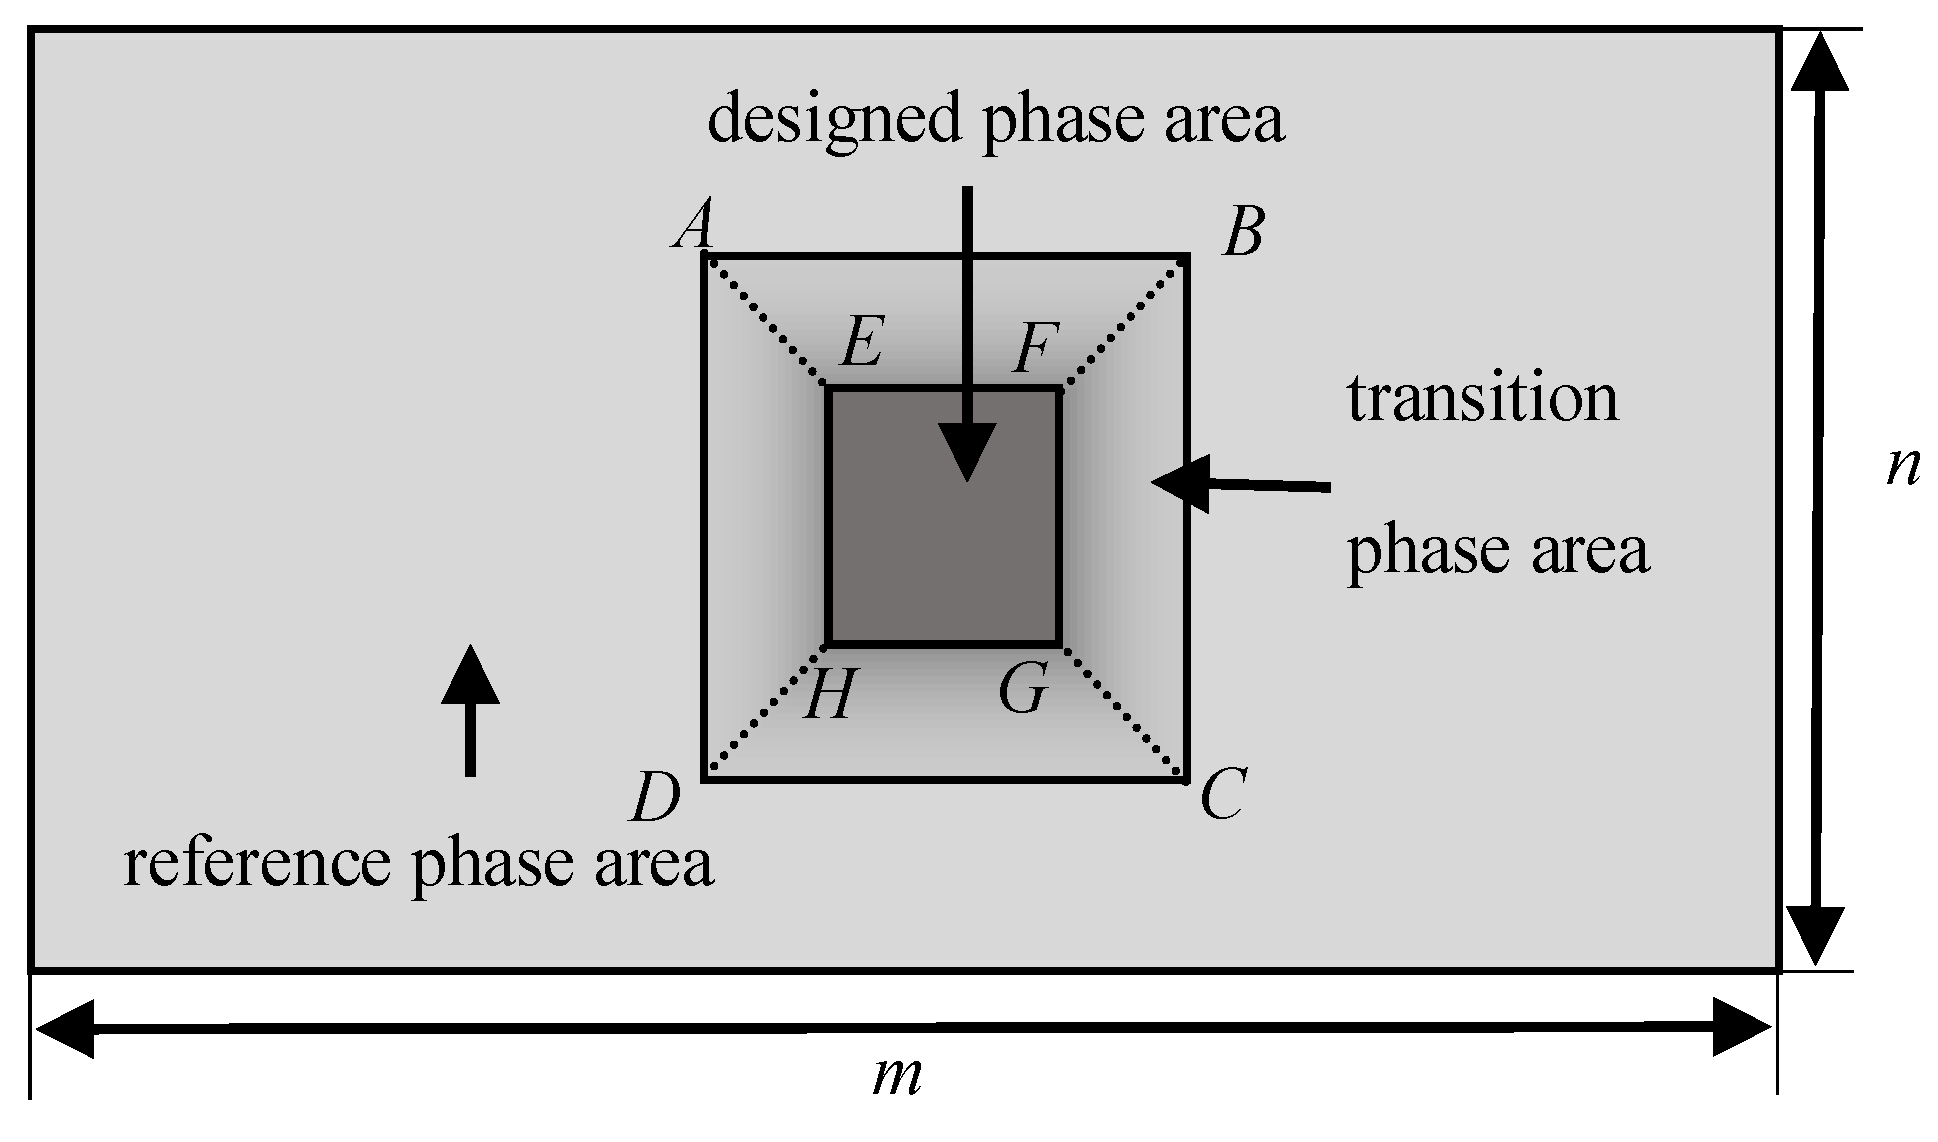
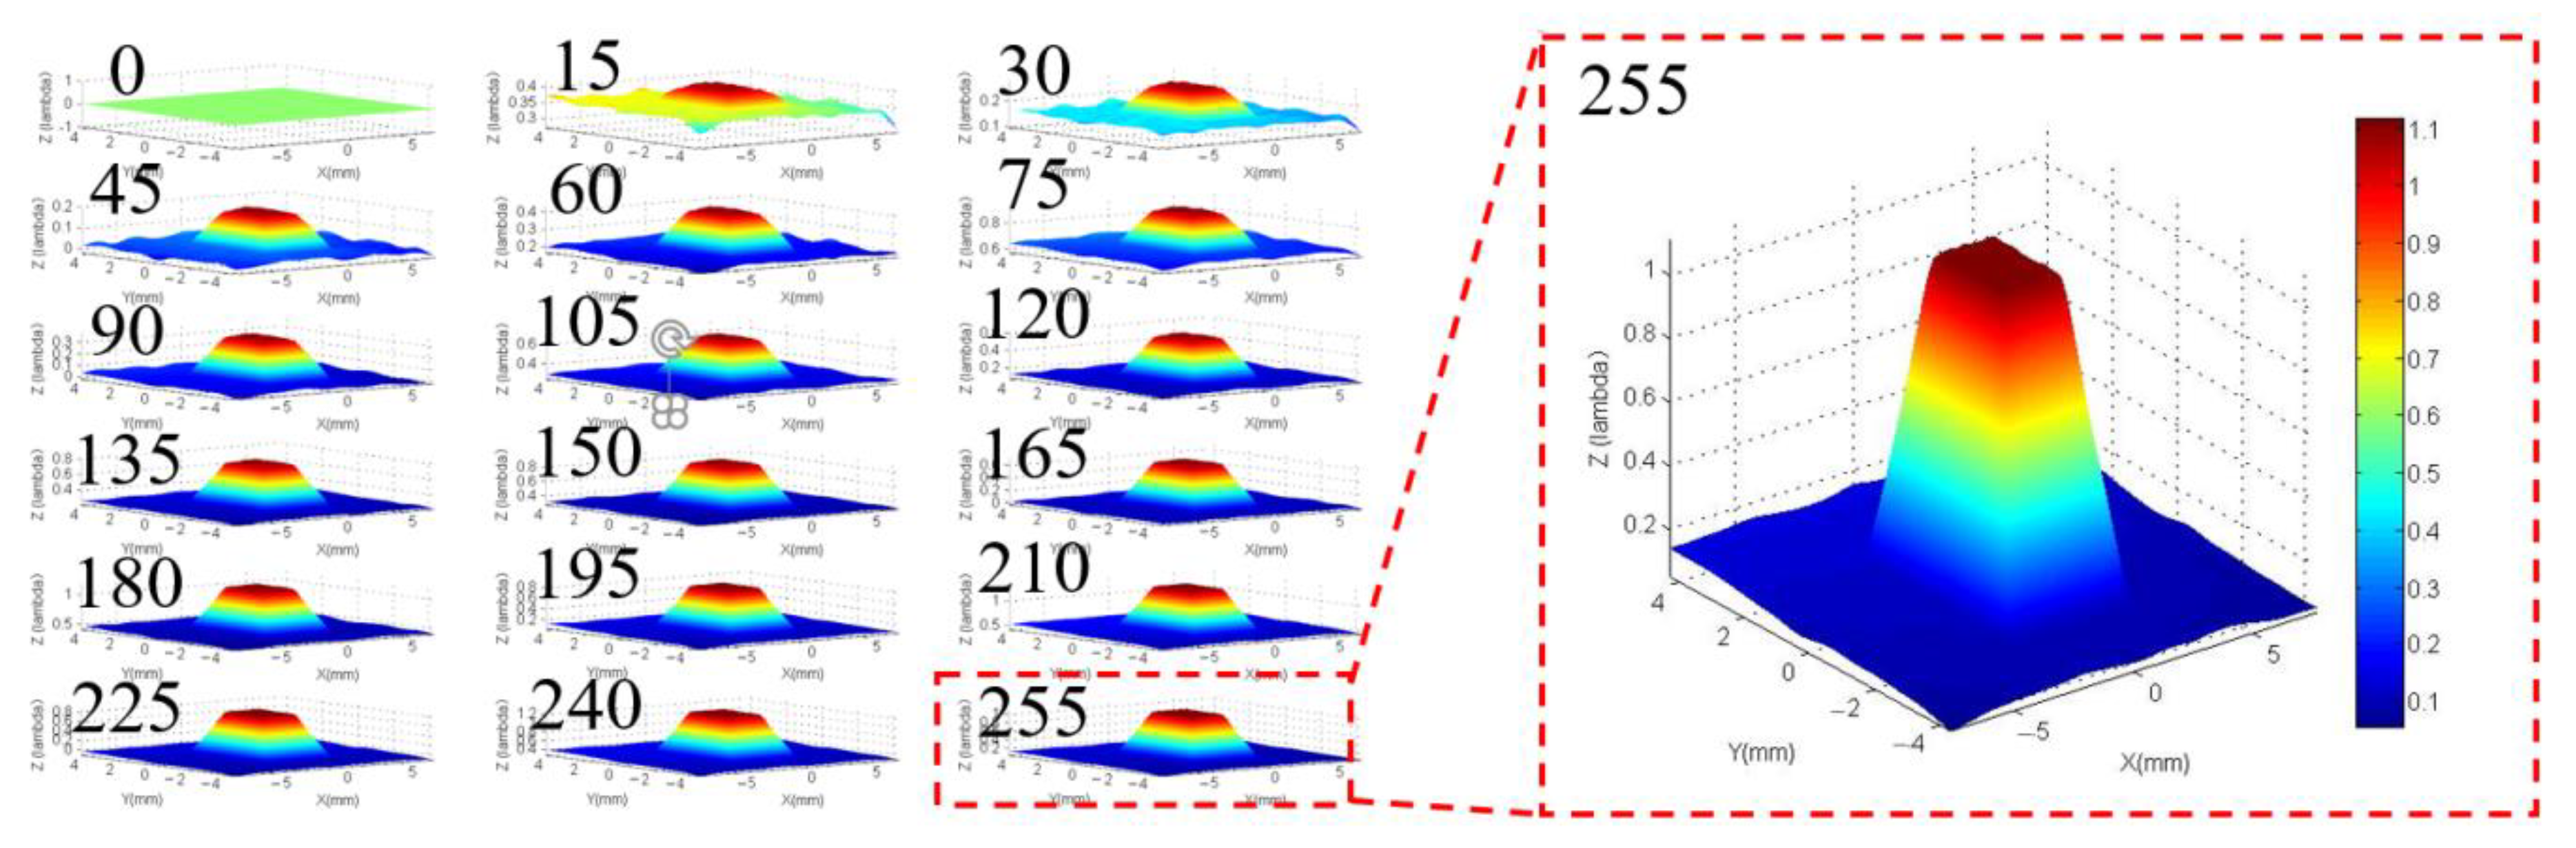
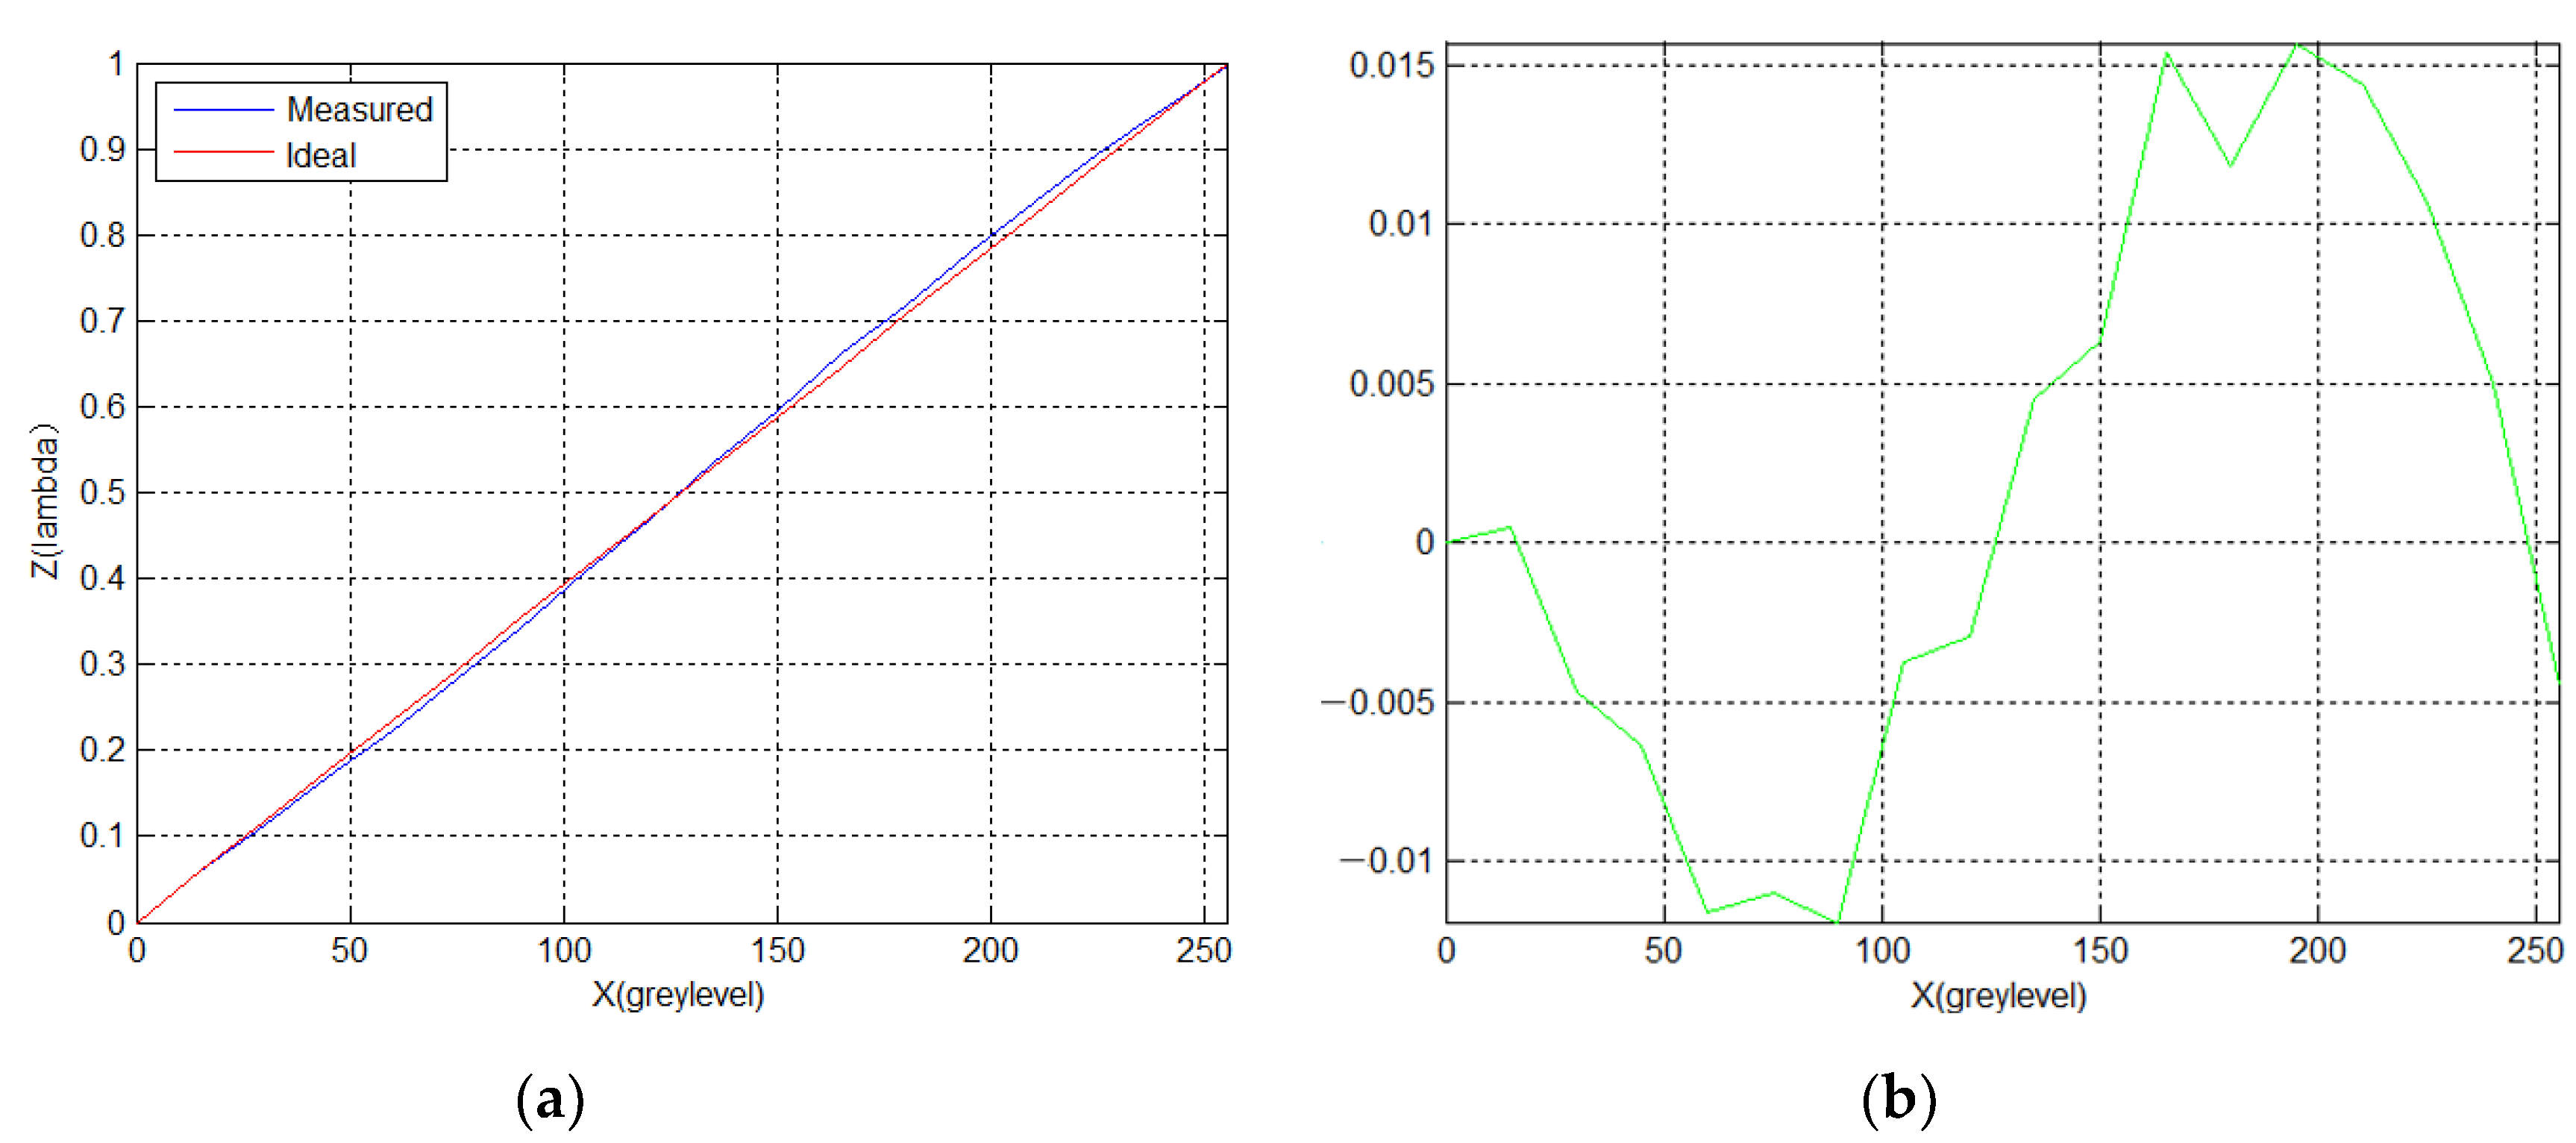
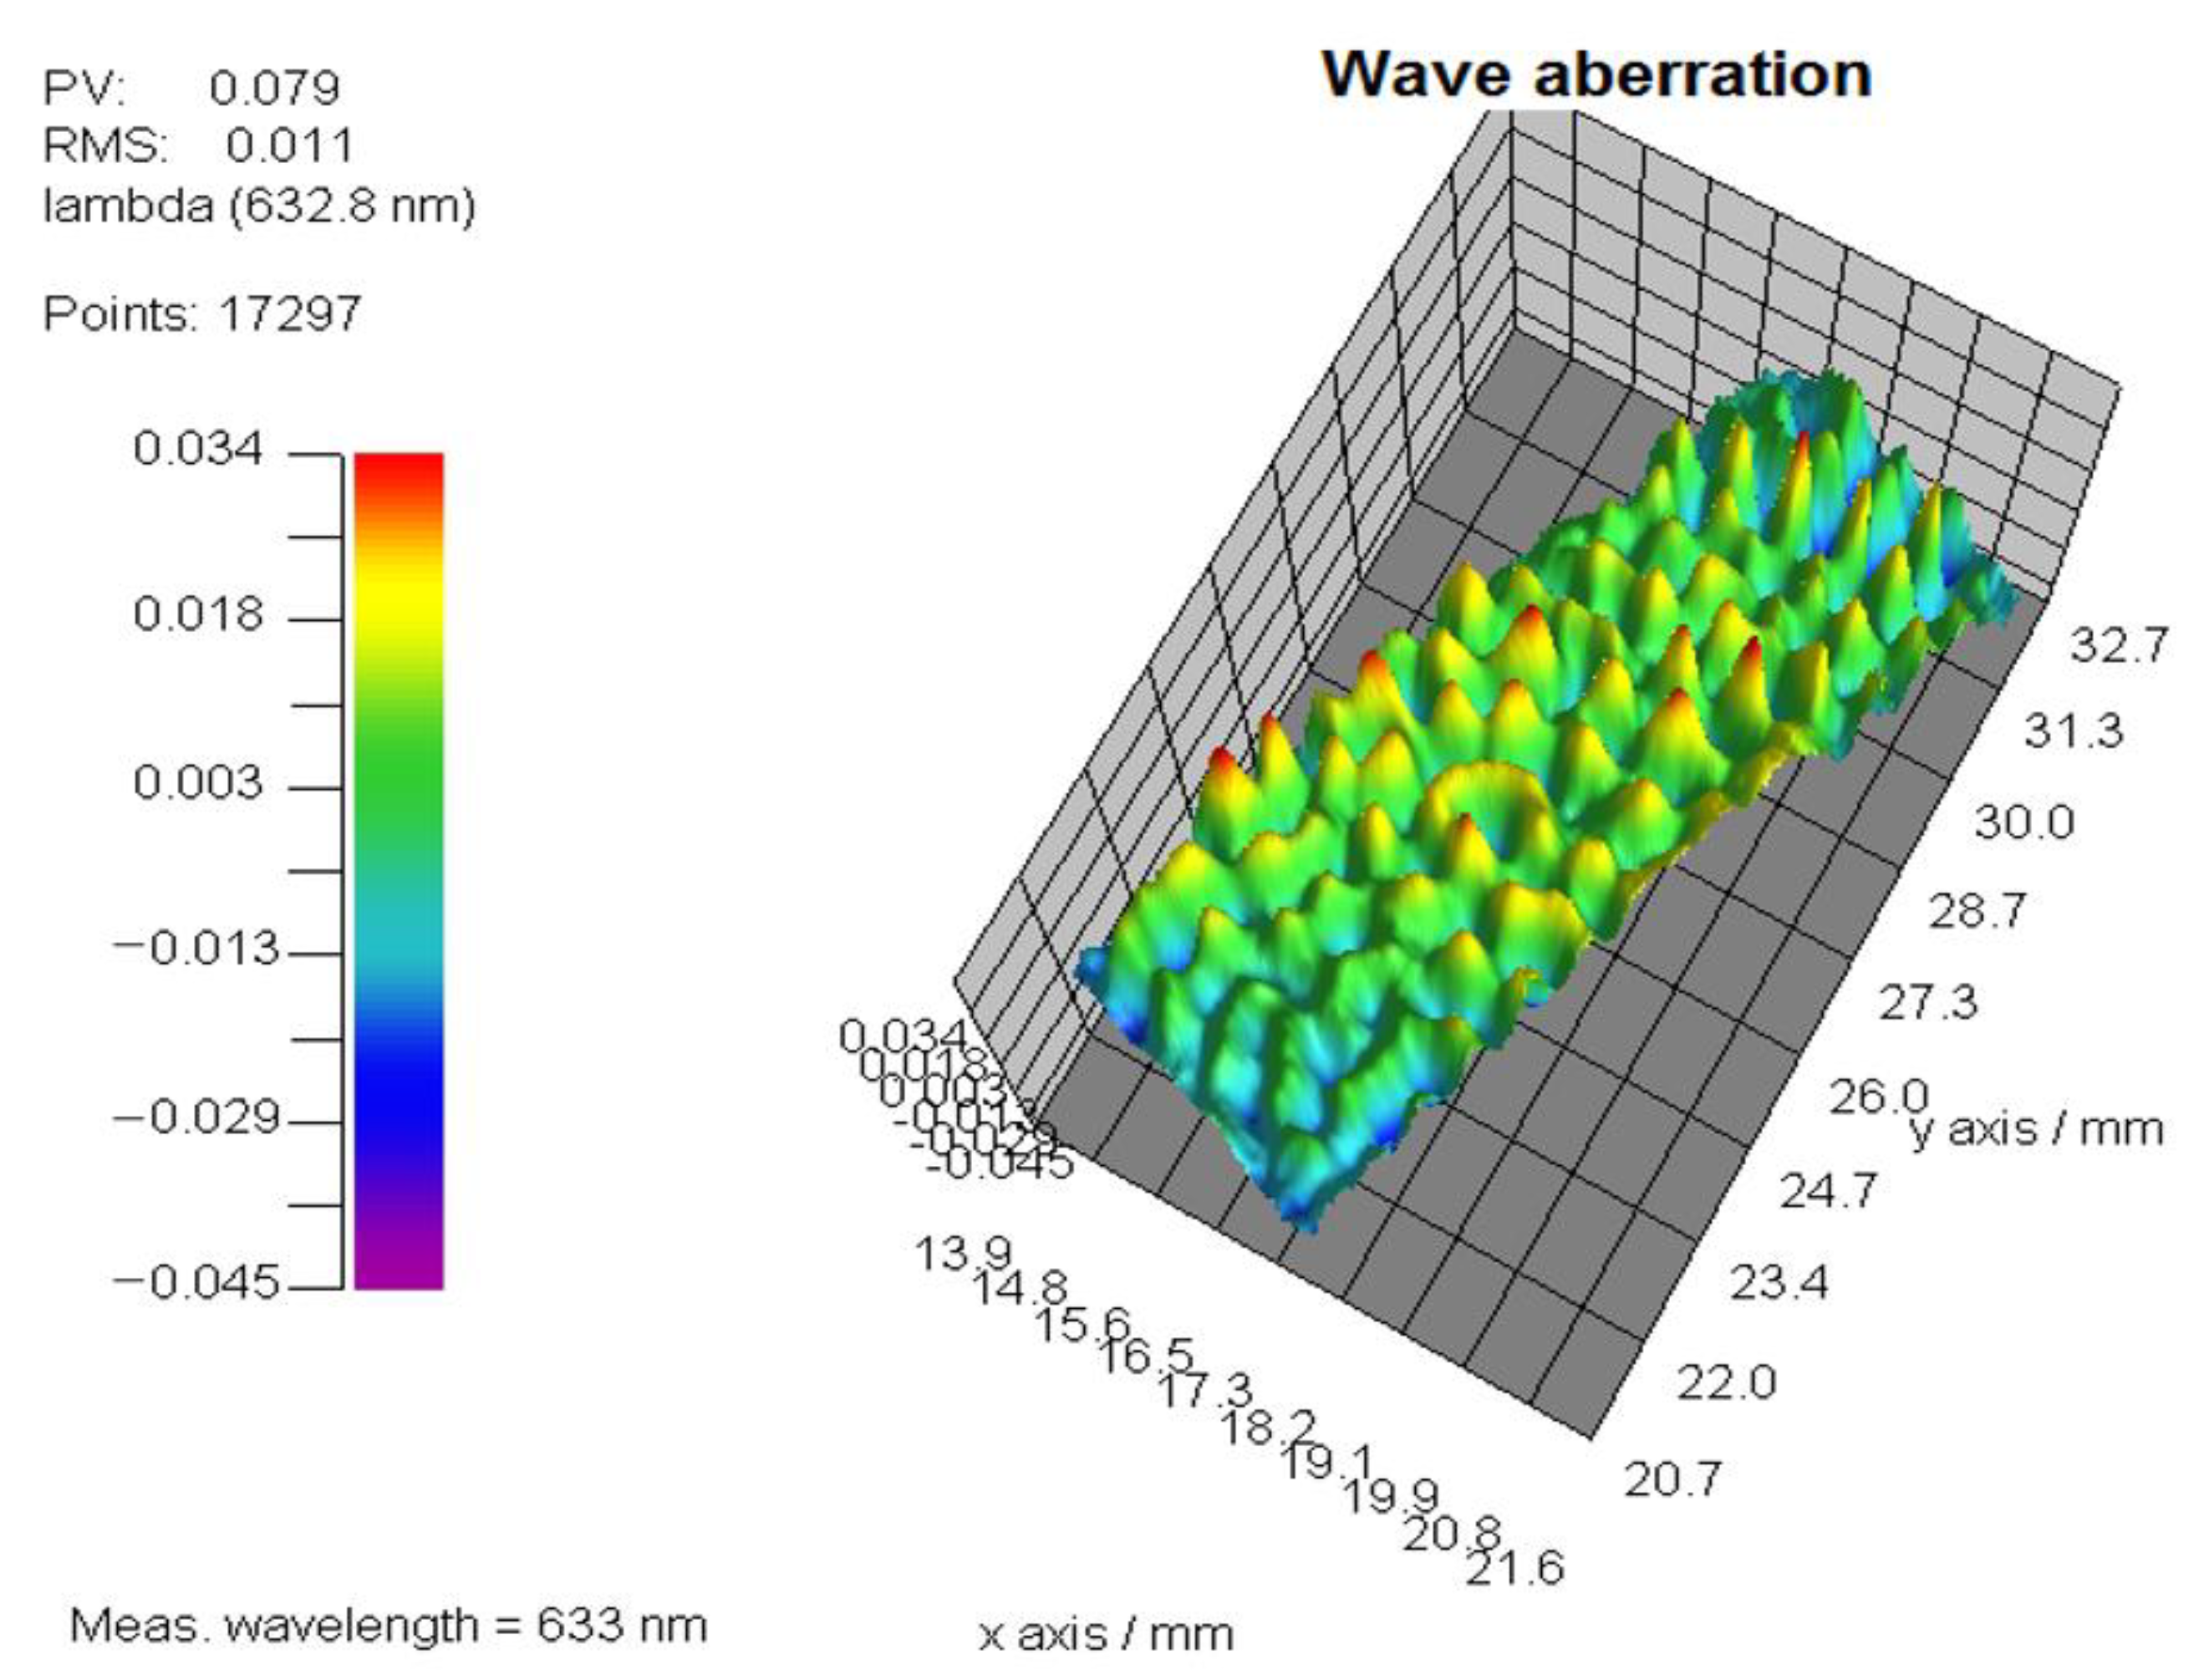
3. Phase Modulation Characteristic Calibration and Compensation of LCoS-SLM

In the model of Section 2.2, the LCoS-SLM is seen as an ideal phase compensator. However, due to the cutting and polishing operation in the LCoS-SLM manufacture procedure, some deformation remains on its backplane, which could affect the configuration of liquid crystal molecules and bring in an initial wavefront residual error. Moreover, the environment would also impact phase modulation effectiveness. Hence the LCoS-SLM have certain nonlinear and nonuniform phase modulation character. It is necessary to calibrate the character and compensate for the initial wavefront error.
There have been some methods to measure the nonlinear modulation character of LCoS-SLM. For example, to calculate the relative displacement of the interference fringes on the LCoS-SLM or the intensity contrast of diffraction methods and find the curve of “grayscale-phase” of an LCoS-SLM, so that a global lookup table for the nonlinear character of LCoS-SLM can be established. On the other hand, LCoS-SLM is an array device, which leads to a nonuniform phase modulation problem, which has been reported in the research literature [21,22].
For the proposed optical system of Figure 5, the phase of LCoS-SLM can be directly measured by the interferometer. The electrical addressing sequence of SLM [23,24] has been set to ‘‘5–5′’ to get a proper phase fluctuation stability performance. “5–5” means the duty cycle of the LCoS-SLM driving voltage, which makes the liquid crystal molecules tilted to modify the phase of the extraordinary light. A special phase pattern to measure the phase modulation character is shown in Figure 6. There are three areas on the phase pattern. Its central rectangle with four corners E, F, G and H (called rectangle EFGH) is given as the designed phase value, and the area outside the rectangle of ABCD is set as the reference phase of zero. Between these two areas are the transition area. The dimensions in LCoS pixels are 1920 × 1080, with a pixel size of 8 μm. The inner EFGH area is used to set a change phase value from 0 to 2π, and the other area of the LCoS-SLM is set to zero as the reference to measure the phase response of the LCoS-SLM. Figure 7 presents the LCoS-SLM configuration of calibration, which contains an interferometer, a polarizer, the LCoS-SLM and adjustment mounts; the wavelength is λ = 632.8 nm. It is true that the phase modulation ability of the LCoS-SLM would be changed under oblique incidence [25,26]. Moreover, the phase modulation change between normal incidence and oblique incidence has been measured. The modulation difference is small, with an oblique angle within 5 degrees. Moreover, this has also been measured by other researchers such as Ye et al. [27] and Cao et al. [28]. The angle’s influence is very small within 5 degrees, and in the proposed optical configuration, the angle is 3 degrees. With the consideration of the incidence angle, we use a cosine function in the phase calculation to compensate for the phase modulation difference, and this method is a common method when using an interferometer to measure the phase in an off axis optical configuration.
In the calibration experiment, a series of phase patterns with 18 grayscale intervals (total gray range of 0–255, and every single gray step is 15) are loaded on the LCoS-SLM, and the phase response is measured sequentially. Each measured phase data is subtracted with the first phase with the grayscale of zero to remove the tilt of phase data. The value in the designed phase area of EFGH is calculated and subtracted with the phase value of the reference area. The phase steps are presented in Figure 8. Figure 9a shows the curve of the measured value with the given grayscale image on the LCoS-SLM, and the straight line is the theoretical value. Figure 9b shows the error of them. The measured curve is the blue one, and the red linear curve is the ideal one, which is very close. The max error is about 0.025 λ (1/40 λ). It can also be thought of as a functional phase modulator to generate the designed phase and wavefront.
On the other hand, the initial phase residual error can also be compensated by the calibration system. In this study, an iterative compensation method is used. After three-time of measuring and compensation iterative procedure, the final measured wavefront could achieve a Peak-Valley (PV) value of 0.079 λ (~1/13 λ) and an Root-Mean-Square (RMS) value of 0.011 λ (~1/90 λ), as shown in Figure 10, and the residual periodic wavefront error is the result of the three iteration compensation. An example of a virtual OAP phase with a focal length of 500 mm is shown in Figure 11. If no initial phase error compensation work is done before the experiment, the focused light spot will deviate from the design position to generate a defocus light spot, as shown in Figure 11b. The compensated one is shown in Figure 11a. To get the uncompensated light spot focused, the CCD must be moved about 20 mm along the optical axis direction from the design position.

4. Multi-Beam Array Generation and Optical Alignment Experiment

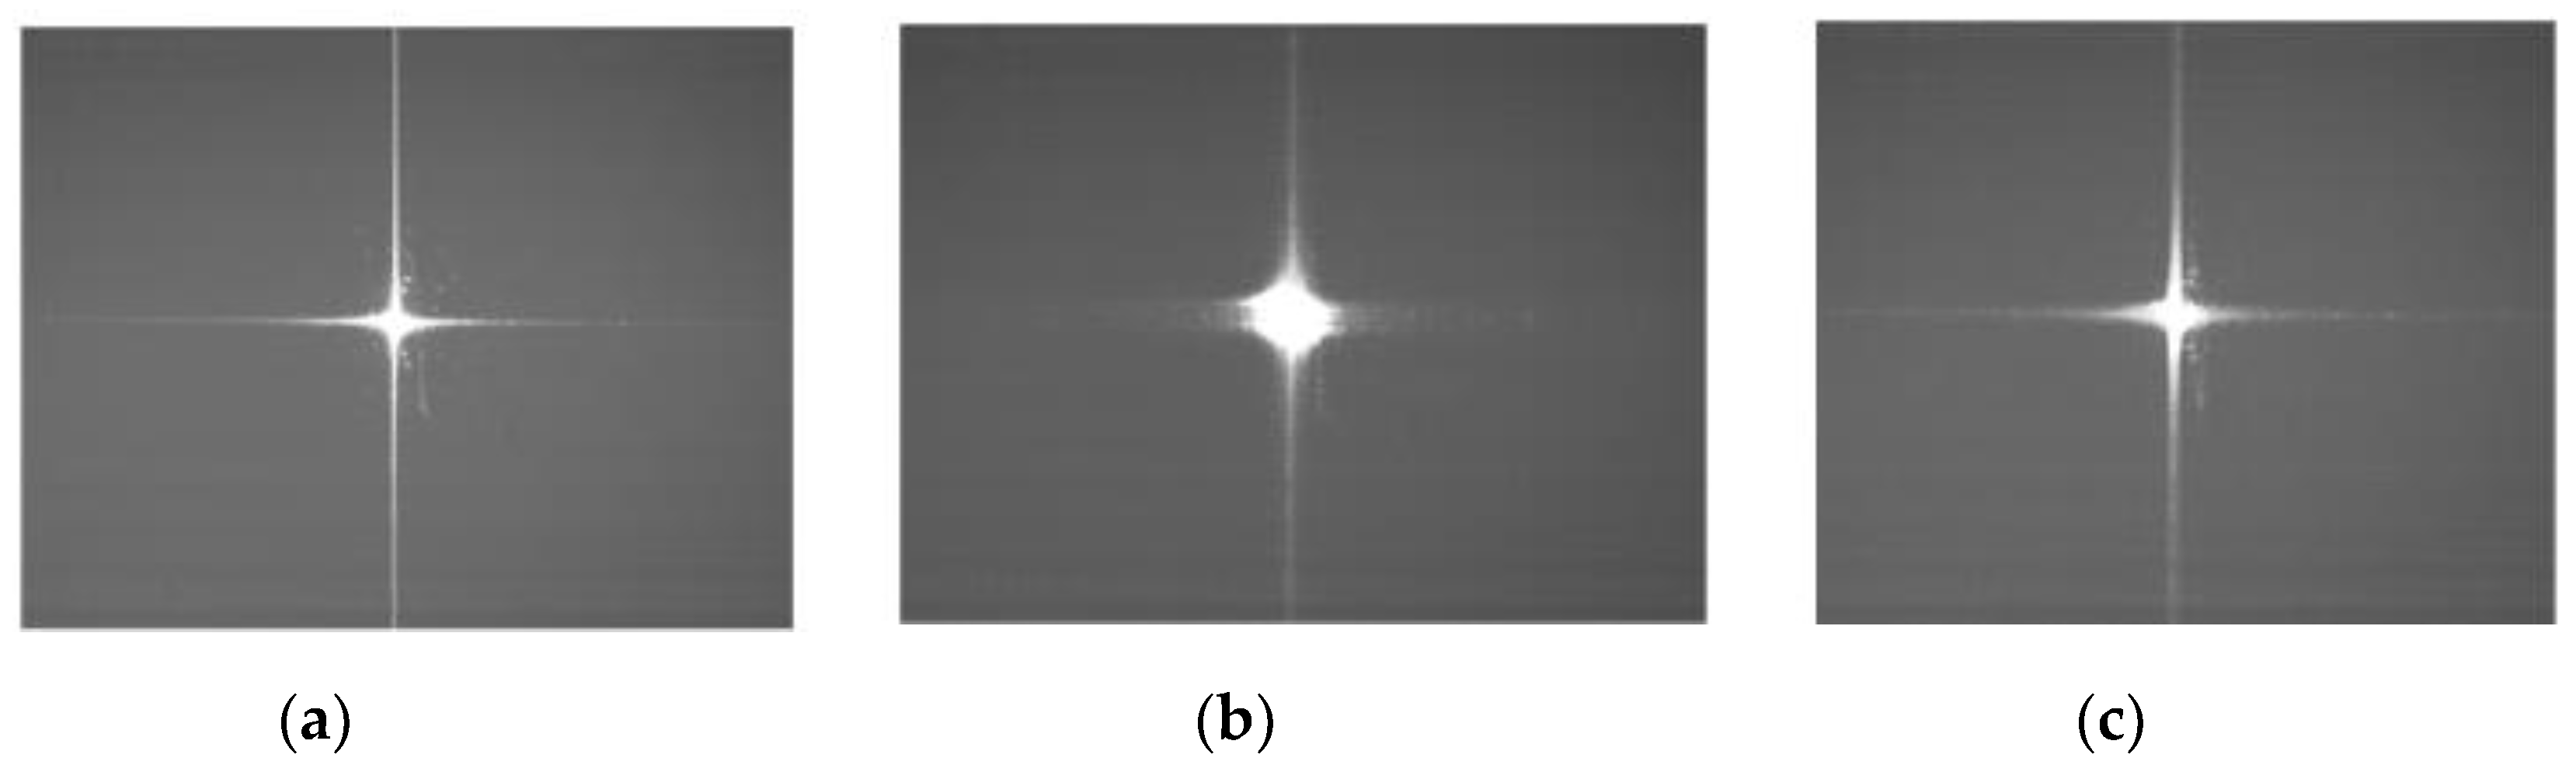
4.1. Multi-Beam Array Generation

On the base of the single virtual OAP phase, the area of LCoS-SLM could be divided into sub-apertures. For each sub-aperture, the position and the focal length of the focus spot of the virtual OAP phase could be designed separately to get the whole phase pattern. Moreover, space three-dimensional position controllable light spots array could be got. The multi-beam array generation optical system configuration is shown in Figure 12.
With the parameter of a tilt angle of 6° and a focal length of 500 mm, a 2 × 2 array phase loaded on LCoS-SLM is designed, and the image is captured by the CCD. Compared with a copper off-axis parabolic array specimen’s focus spots image (1-inch diameter, manufactured by an ultra-precision machine tool, with eight effective light spots in a 3 × 3 array, the central one is defocused due to surface error [19]) in Figure 13a, the light spots (Figure 13b) generated by the LCoS-SLM could also achieve good quality and uniformity.
Figure 14 shows an example of 2 × 2 OAP array with different focal length f1 = 500 mm and f2 = f1 + Δf, where Δf = 25 mm, respectively. The phase and light spots marked No. 1 and 3 are set with the focal length of f1, while No. 2 and 4 are set with f2.

4.2. Optical Alignment

As it is discussed in Section 3, the captured image is sensitive to the position of the CCD camera. After loading a single OAP phase, the in-focus image (Figure 15a) and defocus image Figure 15b of the light spot could be observed as well as that with coma Figure 15c. This means the position and orientation of the CCD could be adjusted according to the captured image in the optical system to align it to the optical axis.
The accuracy of the spots array in the horizontal direction is at the pixel level, depending on the CCD pixel size. In the experiment, the CCD is produced by AVT Company (Advanced Video Technology, Alabama, USA) at 2448 × 2050 resolution with a pixel size of 3.45 µm. Its accuracy in the vertical direction (optical axis direction) is at the sub-millimeter level, which is enough for primary optical alignment. In particular, if the focus spot is projected to a plane mirror surface, an interference pattern could be observed by the interferometer camera, which would offer extra adjustment reference by nulling the interference pattern, and this would improve the alignment accuracy.
In the multi-beam array system, the focus light spots produced by LCoS-SLM can be used to implement the alignment of the optical device to the optical axis at the designed position and orientation as well. The rotation adjustment is an important part of optical alignment. An example is shown in Figure 16. A 2 × 2 array of light spots array with the same focal length of 500 mm is generated to aid the alignment. Figure 16a shows the misalignment image, and Figure 16b presents the in-focus image after the adjustment. The CCD camera is rotated by 17° relative to the optical axis. No. 2 and 3 light spots change from the defocus state to the in-focus state, and all four light spots reach nearly the same intensity and shape. The light spots array captured by the CCD show more reference and information than an OAP light spot, and the adjustment of rotation angle is much accurate. Otherwise, the defocused image or coma image could only offer a simple adjustment tendency. In the meantime, the adjustment in the horizontal direction is made, which can be easier to be achieved by moving the four light spots to the preset position in the CCD image. Other optical components could be aligned to the optical axis as well as the CCD camera used in the experiment. The experiment verifies the multiple-beam OAP array can be used to aid the optical alignment procedure. On the other side, with the help of the interferometer, the alignment job could be done precisely in the actual measurement process. When the spots array is projected to the reference plan part of the measured sample, the reflected light and interference pattern should be observed by the interferometer camera. By nulling the interference pattern array synchronously, the misalignment could be removed. Figure 17a presents the left two light spots of the 2 × 2 array that are defocused; thus, their interference pattern shows an obvious spherical aberration fringe. After nulling that fringe, all spots are focused in Figure 17b, which means that the measured sample was aligned with the optical path, and it is proper to do the next surface measurement process. It is very useful to observe the image of the spot array with an interferometer and to align the light path. If there is a shift or tilt in the path, the shift of the spot and the change in the spot shape on one side will be observed. At the same time, using the phase measurement function, the phase of the light spots array can be obtained. In the defocused state, a phase pattern similar to a spherical wave could be observed. Moreover, the other group of phase patterns could be observed with fewer phase data due to less reflection of light.

5. Conclusions

In this paper, an optical alignment method using the LCoS-SLM to achieve the function of an off-axis OAP array is proposed. The configuration of the experimental optical system is realized by the combination of LCoS-SLM, the interferometer and the polarizer. Results verify the feasibility and effectiveness, where the phase nonlinear and nonuniformity of the LCoS-SLM has been calibrated and compensated to achieve better quality and precision focus spot. The LCoS-SLM generated light spots array could be well contrast with the actual OAP array specimen’s focus spots image. The controllable light spots array generated by the method could be used in optical alignment and measurement. The utilization of LCoS-SLM can further provide an alternative approach to optical alignment for complex optics and systems.

Author Contributions

Z.Z. contributed to the conceptualization and writing of the original draft of the manuscript. Z.L. contributed significantly to visualization, review and validation. F.F. mainly performed project administration and supervision. X.Z. helped perform conceptualization discussion, supervision and review. All authors have read and agreed to the published version of the manuscript.

Funding

This research received no external funding.

Acknowledgments

This research was funded by [National Key Research and Development Program of China] grant number [2017YFA070120], [Science Challenge Program] grant number [TZ2018006-0203-01], [National Natural Science Foundation of China] grant number [61635008] and [Postdoctoral Innovative Talent Support Program of China] grant number [BX20190230].

Conflicts of Interest

The authors declare no conflict of interest.

References

  1. Gao, H.; Xu, F.; Liu, J.; Dai, Z.; Zhou, W.; Li, S.; Yu, Y.; Zheng, H. Holographic three-dimensional virtual reality and augmented reality display based on 4k-spatial light modulators. Appl. Sci. 2019, 9, 1182. [Google Scholar] [CrossRef] [Green Version]
  2. Yang, Q.; Zou, J.; Li, Y.; Wu, S.-T. Fast-response liquid crystal phase modulators with an excellent photostability. Crystals 2020, 10, 765. [Google Scholar] [CrossRef]
  3. Shimizu, Y.; Matsuno, Y.; Chen, Y.-L.; Matsukuma, H.; Gao, W. Design and testing of a micro-thermal sensor probe for nondestructive detection of defects on a flat surface. Nanomanuf. Metrol. 2018, 1, 45–57. [Google Scholar] [CrossRef]
  4. Gao, W.; Haitjema, H.; Fang, F.Z.; Leach, R.; Cheung, C.; Savio, E.; Linares, J.-M. On-machine and in-process surface metrology for precision manufacturing. CIRP Ann. 2019, 68, 843–866. [Google Scholar] [CrossRef] [Green Version]
  5. Wei, Z.; Jianfeng, L.; Funian, L. Study on Compensation Relationships Among the Elements in Off-axis Three-mirror System. Acta Photonica Sin. 2005, 34, 1160. [Google Scholar] [CrossRef]
  6. Huang, Y.; Li, L.; Cao, Y. Computer-Aided Alignment for Space Telescope Optical System. In Proceedings of the 2nd International Symposium on Advanced Optical Manufacturing and Testing Technologies: Advanced Optical Manufacturing Technologies, Xi’an, China, 9 June 2006. [Google Scholar]
  7. Kim, Y.; Yang, H.S.; Kim, S.W.; Lee, Y.W. Alignment of off-axis optical system with multi mirrors using derivative of zernike polynomial coefficient. Proc. SPIE- Int. Soc. Opt. Eng. 2009, 7433, 74330C. [Google Scholar] [CrossRef]
  8. Li, S.; Zhang, J.; Liu, W.; Liang, H.; Xie, Y.; Li, X. The methods and experiments of shape measurement for off-axis conic aspheric surface. Materials 2020, 13, 2101. [Google Scholar] [CrossRef]
  9. Batchko, R.G.; Szilagyi, A. Fluidic Lens with Manually-Adjustable Focus. U.S. Patent No. 7,697,214, 13 April 2010. [Google Scholar]
  10. Zhao, C.; Zehnder, R.; Burge, J.H.; Martin, H.M. Testing an off-axis parabola with a cgh and a spherical mirror as null lens. In Optics & Photonics; International Society for Optics and Photonics: Bellingham, WA, USA, 2005; Volume 5869, pp. 586911–586912. [Google Scholar]
  11. Gao, Y.; Chen, X.; Chen, G.; Tan, Z.; Chen, Q.; Dai, D.; Zhang, Q.; Yu, C. Programmable spectral filter in c-band based on digital micromirror device. Micromachines 2019, 10, 163. [Google Scholar] [CrossRef] [Green Version]
  12. Huang, S.-J.; Wang, S.-Z.; Yu, Y.-J. Computer Generated Holography Based on Fourier Transform Using Conjugate Symmetric Extension. 2009. Available online: iphy.ac.cn (accessed on 21 July 2008).
  13. Ge, L.; Duelli, M.; Cohn, R.W. Enumeration of illumination and scanning modes from real-time spatial light modulators. Opt. Express 2000, 7, 403–416. [Google Scholar] [CrossRef] [Green Version]
  14. Li, R.; Cao, L. Progress in phase calibration for liquid crystal spatial light modulators. Appl. Sci. 2019, 9, 2012. [Google Scholar] [CrossRef] [Green Version]
  15. Otón, J.; Ambs, P.; Millán, M.S.; Pérez-Cabré, E. Multipoint phase calibration for improved compensation of inherent wavefront distortion in parallel aligned liquid crystal on silicon displays. Appl. Opt. 2007, 46, 5667–5679. [Google Scholar] [CrossRef] [PubMed]
  16. Villalobos-Mendoza, B.; Granados-Agustín, F.S.; Aguirre-Aguirre, D.; Cornejo-Rodríguez, A. Obtaining the curve “phase shift vs gray level” of a spatial light modulator holoeye lc2012. J. Phys. Conf. Ser. 2015, 605, 012016. [Google Scholar] [CrossRef]
  17. Nie, Y.; Yang, L.; Liu, J. Ultrafast Optical Signal Pulse Descending Time Controlling with Deformable Mirror and Spatial Light Modulators. J. Phys. Conf. Ser. 2016, 679, 012046. [Google Scholar]
  18. Xia, J.; Chang, C.; Chen, Z.; Zhu, Z.; Zeng, T.; Liang, P.Y.; Ding, J.; Xia, J.; Chang, C.; Chen, Z. Pixel-addressable phase calibration of spatial light modulators: A common-path phase-shifting interferometric microscopy approach. J. Opt. 2017, 19, 125701. [Google Scholar] [CrossRef]
  19. Pei, L.; Huang, D.; Fan, W.; Cheng, H.; Li, X. Phase-only optically addressable spatial-light modulator and on-line phase-modulation detection system. Appl. Sci. 2018, 8, 1812. [Google Scholar] [CrossRef] [Green Version]
  20. Zhang, X.; Fang, F.Z.; Wu, Q.; Liu, X.; Gao, H. Coordinate transformation machining of off-axis aspheric mirrors. Int. J. Adv. Manuf. Technol. 2013, 67, 2217–2224. [Google Scholar] [CrossRef]
  21. Engström, D.; Persson, M.; Bengtsson, J.; Goksör, M. Calibration of spatial light modulators suffering from spatially varying phase response. Opt. Express 2013, 21, 16086. [Google Scholar]
  22. Lu, Q.; Sheng, L.; Zeng, F.; Gao, S.; Qiao, Y. Improved method to fully compensate the spatial phase nonuniformity of lcos devices with a fizeau interferometer. Appl. Opt. 2016, 55, 7796. [Google Scholar] [CrossRef]
  23. Hermerschmidt, A.; Osten, S.; Krüger, S.; Blümel, T. Wave Front Generation Using a Phase-Only Modulating Liquid-Crystal-Based Micro-Display With Hdtv Resolution. In Adaptive Optics for Laser Systems and Other Applications; International Society for Optics and Photonics: Bellingham, WA, USA, 2007; p. 65840E. [Google Scholar]
  24. Martínez, F.J.; Márquez, A.; Gallego, S.; Ortuño, M.; Francés, J.; Beléndez, A.; Pascual, I. Electrical dependencies of optical modulation capabilities in digitally addressed parallel aligned liquid crystal on silicon devices. Opt. Eng. 2014, 53, 067104. [Google Scholar] [CrossRef] [Green Version]
  25. Lizana, A.; Martín, N.; Estapé, M.; Fernández, E.; Moreno, I.; Márquez, A.; Iemmi, C.; Campos, J.; Yzuel, M.J. Influence of the incident angle in the performance of liquid crystal on silicon displays. Opt. Express 2009, 17, 8491. [Google Scholar] [CrossRef] [Green Version]
  26. Márquez, A.; Martínez-Guardiola, F.J.; Francés, J.; Gallego, S.; Pascual, I.; Beléndez, A. Combining average molecular tilt and flicker for management of depolarized light in parallel-aligned liquid crystal devices for broadband and wide-angle illumination. Opt. Express 2019, 27, 5238–5252. [Google Scholar] [CrossRef] [PubMed]
  27. Fukuchi, N.; Ye, B.; Igasaki, Y.; Yoshida, N.; Kobayashi, Y.; Hara, T. Oblique-incidence characteristics of a parallel-aligned nematic-liquid-crystal spatial light modulator. Opt. Rev. 2005, 12, 372–377. [Google Scholar] [CrossRef]
  28. Cao, Z.; Mu, Q.; Hu, L.; Liu, Y.; Peng, Z.; Xuan, L. Reflective liquid crystal wavefront corrector used with tilt incidence. Appl. Opt. 2008, 47, 1785–1789. [Google Scholar] [CrossRef] [PubMed]
Figure 1. The strategy using liquid crystal on silicon spatial light modulator (LCoS-SLM)-generated light spots array in optical alignment and measurement. (a) The sample surface and the physical positioning marks, (b) the optical alignment step and optical surface measurement step.
Applsci 10 08382 g001
Figure 2. The scheme to apply the light spots array generated by LCoS-SLM in an off-axis optical alignment.
Applsci 10 08382 g002
Figure 3. Off-axis parabolic mirror (OAP) model as an off-axis parabolic mirror.
Applsci 10 08382 g003
Figure 4. OAP phase recalculation model generated by coordinate transformation.
Applsci 10 08382 g004
Figure 5. Optical system configuration based on LCoS-SLM.
Applsci 10 08382 g005
Figure 6. LCoS-SLM calibration phase pattern.
Applsci 10 08382 g006
Figure 7. LCoS-SLM phase modulation characteristics of measuring light path.
Applsci 10 08382 g007
Figure 8. Phase steps measurements and results.
Applsci 10 08382 g008
Figure 9. (a)The phase modulation character curve and (b)the error of between the masured phase and the ideal phase.
Applsci 10 08382 g009
Figure 10. Wavefront after the iterative compensation.
Applsci 10 08382 g010
Figure 11. The focus spots produced by the (a) compensated phase and (b) uncompensated phase, and (c) light spot after moving Charge Coupled Device (CCD) cameara.
Applsci 10 08382 g011
Figure 12. Multi-beam array generation optical system configuration.
Applsci 10 08382 g012
Figure 13. The light spots array from (a) OAP array specimen and (b) OAP array phase on the LCoS-SLM.
Applsci 10 08382 g013
Figure 14. (a) OAP array phase and (b) its light spots with different focal lengths. No. 1 and 3 are set with the focal length of f1, while No. 2 and 4 are set with f2.
Applsci 10 08382 g014
Figure 15. A single OAP phase focusing spot (a) in-focus, (b) defocus and (c) coma image.
Applsci 10 08382 g015
Figure 16. Optical alignment experiment with 2 × 2 light spots (a) image in the misalignment and (b) in-focus image after adjustments.
Applsci 10 08382 g016
Figure 17. Focused 2 × 2 light array and the interferograms. (a) Left 2 spots defocused and (b) all spots focused.
Applsci 10 08382 g017
Publisher’s Note: MDPI stays neutral with regard to jurisdictional claims in published maps and institutional affiliations.

