Analysis of the Real Energy Consumption of Energy Saving Lamps

 ,
,  , and
, and
Abstract
:1. Introduction
2. Materials and Methods
3. Results and Discussion
- The harmonic currents shall not exceed the limits established in the standard (3.4 mA/W for the third harmonic, 1.9 for the fifth, 1.0 for the seventh and 0.5 for the ninth).
- The third and fifth harmonic currents, expressed as a percentage of the fundamental current, shall not exceed the values of 86% and 61%, respectively.
- The THD shall not exceed 70%, and the harmonic currents, expressed as a percentage of the fundamental current, shall not exceed the values stablished in the standard (35%, 25%, 30% and 20% for the third, fifth, seventh and ninth, respectively).
4. Conclusions
Author Contributions
Funding
Conflicts of Interest
References
- DIRECTIVE 2009/125/EC of the European Parliament and of the Council of 21 October 2009 Establishing a Framework for the Setting of Ecodesign Requirements for Energy-Related Products. Available online: https://eur-lex.europa.eu/eli/dir/2009/125/oj (accessed on 22 October 2020).
- COMMISSION REGULATION (EC) No 244/2009 of 18 March 2009 Implementing Directive 2005/32/EC of the European Parliament and of the Council with Regard to Ecodesign Requirements for Non-Directional Household Lamps. Available online: https://eur-lex.europa.eu/legal-content/EN/TXT/PDF/?uri=CELEX:32009R0244&from=en (accessed on 22 October 2020).
- Ganandran, G.S.B.; Mahlia, T.M.I.; Ong, H.C.; Rismanchi, B.; Chong, W. Cost-Benefit Analysis and Emission Reduction of Energy Efficient Lighting at the Universiti Tenaga Nasional. Sci. World J. 2014, 2014, 1–11. [Google Scholar] [CrossRef] [PubMed] [Green Version]
- Khorasanizadeh, H.; Parkkinen, J.; Parthiban, R.; Moore, J.D. Energy and economic benefits of LED adoption in Malaysia. Renew. Sustain. Energy Rev. 2015, 49, 629–637. [Google Scholar] [CrossRef]
- Houri, A.; El Khoury, P. Financial and energy impacts of compact fluorescent light bulbs in a rural setting. Energy Build. 2010, 42, 658–666. [Google Scholar] [CrossRef]
- Islam, G.; Darbayeva, E.; Rymbayev, Z.; Dikhanbayeva, D.; Rojas-Solórzano, L.R. Switching-off conventional lighting system and turning-on LED lamps in Kazakhstan: A techno-economic assessment. Sustain. Cities Soc. 2019, 51, 101790. [Google Scholar] [CrossRef]
- Iimi, A.; Elahi, R.; Kitchlu, R.; Costolanski, P. Energy-Saving Effects of Progressive Pricing and Free CFL Bulb Distribution Program: Evidence from Ethiopia. World Bank Econ. Rev. 2019, 33, 461–478. [Google Scholar] [CrossRef]
- Dwyer, R.; Khan, A.; McGranaghan, M.; Tang, L.; McCluskey, R.; Sung, R.; Houy, T. Evaluation of harmonic impacts from compact fluorescent lights on distribution systems. IEEE Trans. Power Syst. 1995, 10, 1772–1779. [Google Scholar] [CrossRef]
- Koch, A.S.; Myrzik, J.M.A.; Wiesner, T.; Jendernalik, L. Harmonics and resonances in the low voltage grid caused by compact fluorescent lamps. In Proceedings of the 14th International Conference on Harmonics and Quality of Power—ICHQP 2010, Bergamo, Italy, 26–29 September 2010; pp. 1–6. [Google Scholar] [CrossRef]
- Gil-De-Castro, A.; Rönnberg, S.K.; Bollen, M.H.J. Light intensity variation (flicker) and harmonic emission related to LED lamps. Electr. Power Syst. Res. 2017, 146, 107–114. [Google Scholar] [CrossRef]
- Frater, L.P.; Watson, N.R. Light flicker sensitivity of high efficiency compact fluorescent lamps. In Proceedings of the 2007 Australasian Universities Power Engineering Conference, Perth, WA, Australia, 9–12 December 2007; pp. 1–6. [Google Scholar] [CrossRef]
- Lodetti, S.; Azcarate, I.; Gutierrez, J.J.; Leturiondo, L.A.; Redondo, K.; Saiz, P.; Melero, J.J.; Bruna, J. Flicker of Modern Lighting Technologies Due to Rapid Voltage Changes. Energies 2019, 12, 865. [Google Scholar] [CrossRef] [Green Version]
- Wilkins, A.; Veitch, J.; Lehman, B. LED lighting flicker and potential health concerns: IEEE standard PAR1789 update. In Proceedings of the 2010 IEEE Energy Conversion Congress and Exposition, Atlanta, GA, USA, 12–16 September 2010; pp. 171–178. [Google Scholar] [CrossRef]
- Wang, Z.; Yong, J. Investigation on the capacitive characteristics of single-phase diode-bridge converter based loads. In Proceedings of the 2013 IEEE PES Asia-Pacific Power and Energy Engineering Conference (APPEEC), Kowloon, Hong Kong, 8–11 December 2013; pp. 1–4. [Google Scholar] [CrossRef]
- Ćuk, V.; Cobben, J.F.G.; Kling, W.L.; Timens, R.B. An analysis of diversity factors applied to harmonic emission limits for energy saving lamps. In Proceedings of the 14th International Conference on Harmonics and Quality of Power—ICHQP 2010, Bergamo, Italy, 26–29 September 2010; pp. 1–6. [Google Scholar] [CrossRef] [Green Version]
- Matvoz, D.; Maksić, M. Comparison of LED and CFL lamps and their impact on electric power network. In Proceedings of the 2012 IEEE 15th International Conference on Harmonics and Quality of Power, Hong Kong, China, 17–20 June 2012; pp. 320–327. [Google Scholar] [CrossRef]
- Ngoffe, S.P.; Essiane, S.N.; Offole, F.; Mengounou, G.M.; Imano, A.M.; Onambele, O. Harmonic Investigation of Compact Fluorescent Lamps Low Energy Consumption Lamps of Cameroonian Market. OALib J. 2019, 6, 1–11. [Google Scholar] [CrossRef]
- De Paula Campos, A.; Fragoso, A.; Fortes, M.; Ferreira, V.H.; Pereira, A. Harmonic analysis of lighting technology application—Case study in distribution network: Smart city buzios. In Proceedings of the 24th International Conference and Exhibition on Electricity Distribution—CIRED 2017, Glasgow, UK, 12–15 June 2017. [Google Scholar]
- Nohra, F.H.; Kanaan, H.Y.; Al-Haddad, K. A study on the impact of a massive integration of compact fluorescent lamps on power quality in distribution power systems. In Proceedings of the 2012 International Conference on Renewable Energies for Developing Countries (REDEC), Beirut, Lebanon, 28–29 November 2012; pp. 1–6. [Google Scholar] [CrossRef]
- Gil-de-Castro, S.; Rönnberg, M.H.J.; Bollen, A.; Moreno-Muñoz, A.; Pallares-Lopez, V. Harmonics from a domestic customer with different lamp technologies. In Proceedings of the 2012 IEEE 15th International Conference on Harmonics and Quality of Power, Hong Kong, China, 17–20 June 2012; pp. 585–590. [Google Scholar] [CrossRef]
- Dolara, A.; Leva, S. Power Quality and Harmonic Analysis of End User Devices. Energies 2012, 5, 5453–5466. [Google Scholar] [CrossRef]
- Código Técnico de la Edificación (CTE), R.D. 314/2006 de 17 de marzo. Documento básico: Exigencias básicas de ahorro de energía (HE). Exigencia básica HE3: Condiciones de las instalaciones de iluminación. Available online: https://www.idae.es/ (accessed on 22 October 2020).
- UNE-EN 50160:2011/A2:2020. Voltage Characteristics of Electricity Supplied by Public Electricity Networks; Asociación Española de Normalización (UNE): Madrid, Spain, 2020. [Google Scholar]
- Czarnecki, L. Currents’ physical components (CPC) in circuits with nonsinusoidal voltages and currents. Part 1, Single-phase linear circuits. Electr. Power Qual. Util. J. 2005, 11, 3–14. [Google Scholar]
- Czarnecki, L.S. From Steinmetz to currents’ physical components (CPC): History of power theory development. In Proceedings of the 2016 International Conference on Applied and Theoretical Electricity (ICATE), Craiova, Romania, 6–8 October 2016; pp. 1–10. [Google Scholar] [CrossRef]
- Emanuel, A.E. Summary of IEEE Standard 1459: Definitions for the Measurement of Electric Power Quantities Under Sinusoidal, Nonsinusoidal, Balanced, or Unbalanced Conditions. IEEE Trans. Ind. Appl. 2004, 40, 869–876. [Google Scholar] [CrossRef]
- León, V.; Giner, J.; Montañana, J.; Cazorla, A. Ineficiencias de Los Sistemas Eléctricos. In Efectos, Cuantificación Y Dispositivos De Mejora De La Eficiencia; Polytechnical University of Valencia: Valencia, Spain, 2001. [Google Scholar]
- UNE-EN 61000-2-2:2003. Electromagnetic Compatibility (EMC)—Part 2-2: Environment—Compatibility Levels for Low-Frequency Conducted Disturbances and Signalling in Public Low-Voltage Power Supply Systems; International Electrotechnical Commission (IEC): Geneva, Switzerland, 2003. [Google Scholar]
- Nassif, A.B.; Xu, W. Characterizing the Harmonic Attenuation Effect of Compact Fluorescent Lamps. IEEE Trans. Power Deliv. 2009, 24, 1748–1749. [Google Scholar] [CrossRef]
- Mansoor, A.; Grady, W.M. Analysis of compensation factors influencing the net harmonic current produced by single-phase nonlinear loads. In Proceedings of the 8th International Conference on Harmonics and Quality of Power, Athens, Greece, 14–16 October 1998; pp. 883–889. [Google Scholar] [CrossRef]
- Mok, Y.K.; Tse, C.F.N.; Lau, W.H. A study on the effects of voltage distortion on current harmonics generated by modern SMPS driven home appliances in Smart Grid network. In Proceedings of the 9th IET International Conference on Advances in Power System Control, Operation and Management (APSCOM 2012), Hong Kong, China, 18–21 November 2012; pp. 1–6. [Google Scholar] [CrossRef]
- UNE-EN IEC 61000-3-2:2019. Electromagnetic compatibility (EMC)—Part 3-2: Limits—Limits for Harmonic Current Emissions (Equipment Input Current ≤16 A Per Phase); International Electrotechnical Commission (IEC): Geneva, Switzerland.
- Mansoor, A.; Grady, W.M.; Chowdhury, A.H.; Samotyi, M.J. An investigation of harmonics attenuation and diversity among distributed single-phase power electronic loads. IEEE Trans. Power Deliv. 1995, 10, 467–473. [Google Scholar] [CrossRef]
- Silva, R.P.B.; Quadros, R.; Shaker, H.R.; Da Silva, L.C.P. Analysis of the Electrical Quantities Measured by Revenue Meters Under Different Voltage Distortions and the Influences on the Electrical Energy Billing. Energies 2019, 12, 4757. [Google Scholar] [CrossRef] [Green Version]


| Key | Type | Brand | P (W) | Light Efficiency (lm/w) | Luminous Flux (lm) | Color (K) | Cost (€) |
|---|---|---|---|---|---|---|---|
| L1 | LED/E27 | Lexman | 12 | 88 | 1055 | 3000 | 15.99 |
| L2 | LED/E27 | H2V | 9 | 89 | 806 | 3000 | 21.45 |
| L3 | LED/E27 | Mega | 6 | 100 | 600 | 2700 | 12.45 |
| L4 | LED/E27 | Adeo | 6 | 67 | 400 | 3000 | 28.95 |
| L5 | LED/E27 | Philips | 11 | 96 | 1055 | 6000 | 10.99 |
| C1 | CFL/E27 | Lexman | 23 | 61 | 1398 | 6500 | 6.95 |
| C2 | CFL/E27 | Lexman | 22 | 58 | 1279 | 6500 | 6.45 |
| C3 | CFL/E27 | Lexman | 15 | 53 | 800 | 4000 | 5.95 |
| C4 | CFL/E27 | Xavax | 15 | 53 | 798 | 2700 | 13.33 |
| C5 | CFL/E27 | Osram | 14 | 55 | 770 | 2700 | 4.25 |
| C6 | CFL/E27 | Froiz | 11 | 55 | 600 | 2700 | 3.95 |
| C7 | CFL/E27 | Froiz | 9 | 50 | 450 | 2700 | 3.45 |
| Key | Type | Goup | Lamps |
|---|---|---|---|
| G-L | Only LED | 4 LED | L1, L2, L4, L5 |
| G-C | Only CFL | 4 CFL | C2, C3, C4, C5 |
| G-M-1 | Mixed | 2 LED+2 CFL | L1, L5, C2, C3 |
| G-M-2 | Mixed | 2 LED+6 CFL | L1, L5, C1, C2, C3, C4, C5, C6 |
| Lamp | THDi (%) | P (W) | Q (Var) | D (VAd) | S (VA) |
|---|---|---|---|---|---|
| L1 | 104.54 | 12.2 | −3 | 15.6 | 21.4 |
| L2 | 149.06 | 9.5 | −3 | 15 | 18 |
| L3 | 126.65 | 5.8 | −3.6 | 8.6 | 11 |
| L4 | 124.04 | 6.1 | −4.1 | 9.2 | 11.7 |
| L5 | 137.96 | 10.7 | −4 | 15.9 | 19.6 |
| C1 | 112.32 | 21.2 | −8.9 | 27.1 | 35.1 |
| C2 | 120.85 | 21.8 | −10 | 29.2 | 37.8 |
| C3 | 107.86 | 14.8 | −7.5 | 17.9 | 24.4 |
| C4 | 119.82 | 13.4 | −6.4 | 17.9 | 23.3 |
| C5 | 106.05 | 15.3 | −8 | 18.4 | 25.2 |
| C6 | 105.35 | 10.8 | −5.6 | 12.9 | 17.7 |
| C7 | 106.01 | 8.9 | −4.6 | 10.7 | 14.7 |
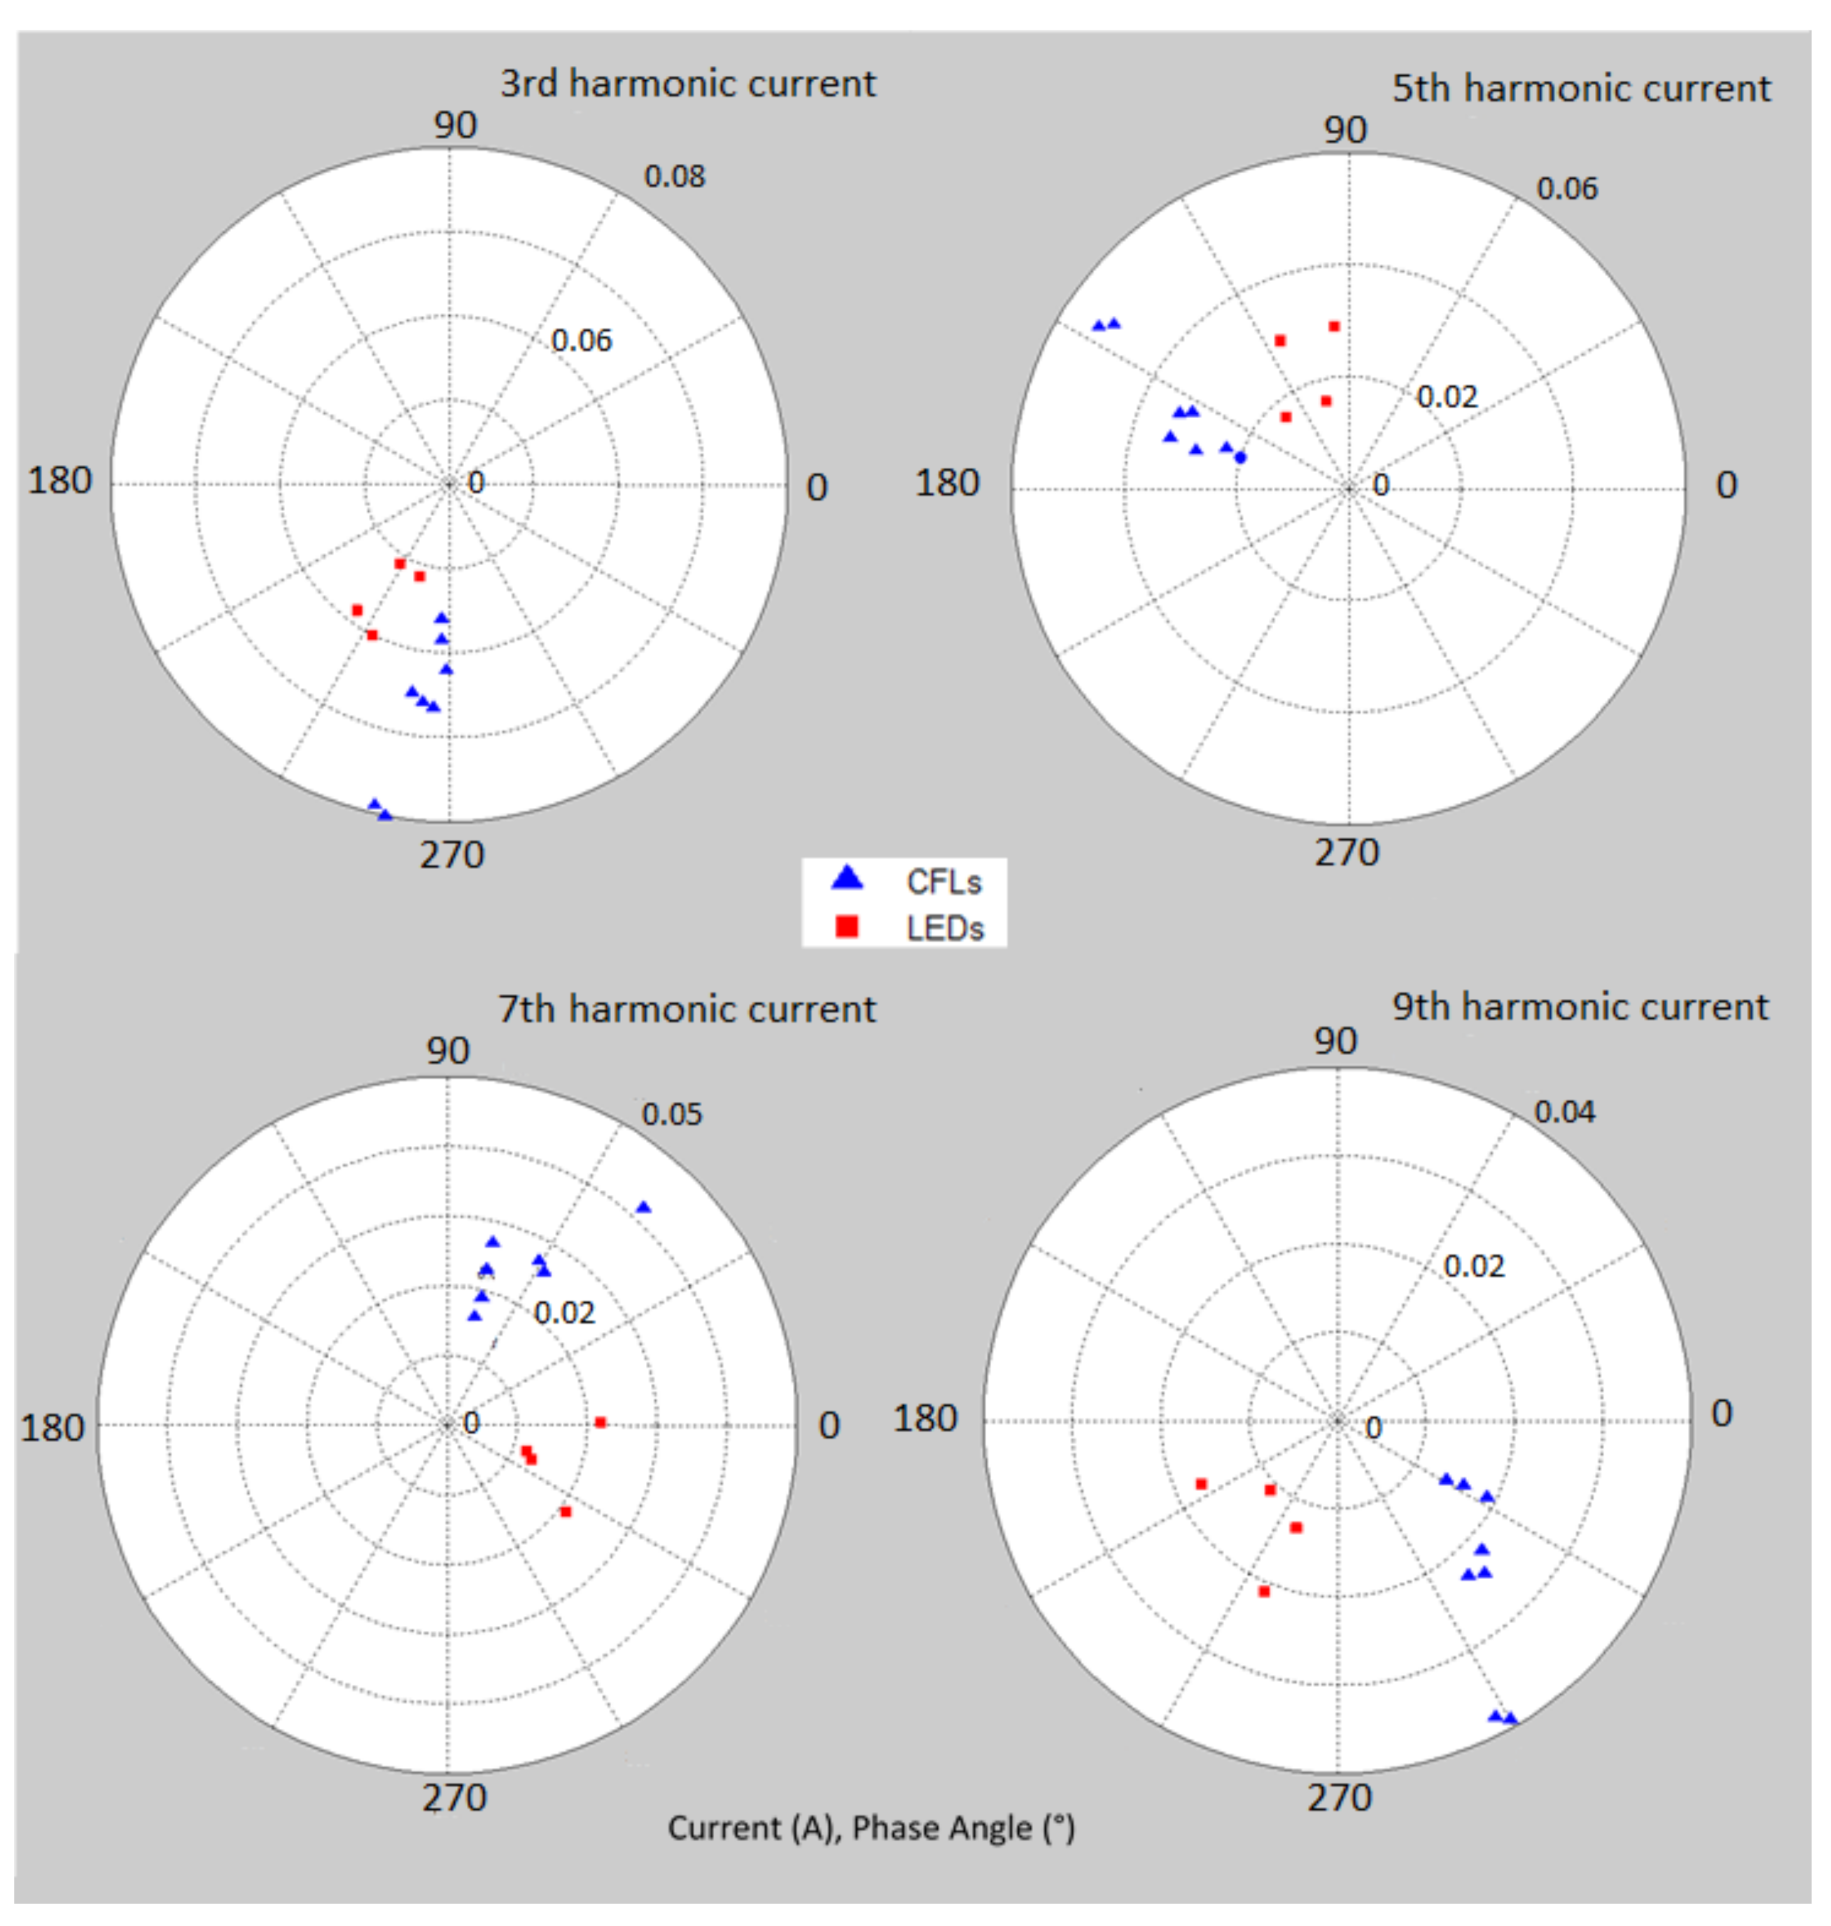
| Lamp | I1 (A) | I3 (A) | I5 (A) | I7 (A) | I9 (A) |
|---|---|---|---|---|---|
| L1 | 0.062∠34° | 0.044∠−91° | 0.028∠166° | 0.023∠76° | 0.019∠−27° |
| L2 | 0.044∠18° | 0.037∠−126° | 0.029∠95° | 0.021∠−36° | 0.017∠−155° |
| L3 | 0.029∠32° | 0.022∠−122° | 0.016∠105° | 0.012∠−18° | 0.011∠−134° |
| L4 | 0.032∠34° | 0.023∠−108° | 0.017∠131° | 0.013∠22° | 0.013∠−91° |
| L5 | 0.049∠21° | 0.04∠−117° | 0.029∠115° | 0.022∠1° | 0.021∠−113° |
| C1 | 0.101∠25° | 0.08∠−101° | 0.053∠147° | 0.042∠48° | 0.039∠−60° |
| C2 | 0.102∠25° | 0.078∠−103° | 0.051∠145° | 0.042∠48° | 0.038∠−62° |
| C3 | 0.069∠27° | 0.052∠−97° | 0.033∠156° | 0.027∠61° | 0.024∠−46° |
| C4 | 0.068∠26° | 0.05∠−100° | 0.031∠54° | 0.026∠58° | 0.023∠−50° |
| C5 | 0.074∠28° | 0.053∠−94° | 0.033∠164° | 0.027∠76° | 0.022∠−42° |
| C6 | 0.054∠28° | 0.037∠−93° | 0.023∠162° | 0.019∠75° | 0.016∠−27° |
| C7 | 0.043∠28° | 0.032∠−93° | 0.02∠164° | 0.016∠76° | 0.014∠−29° |
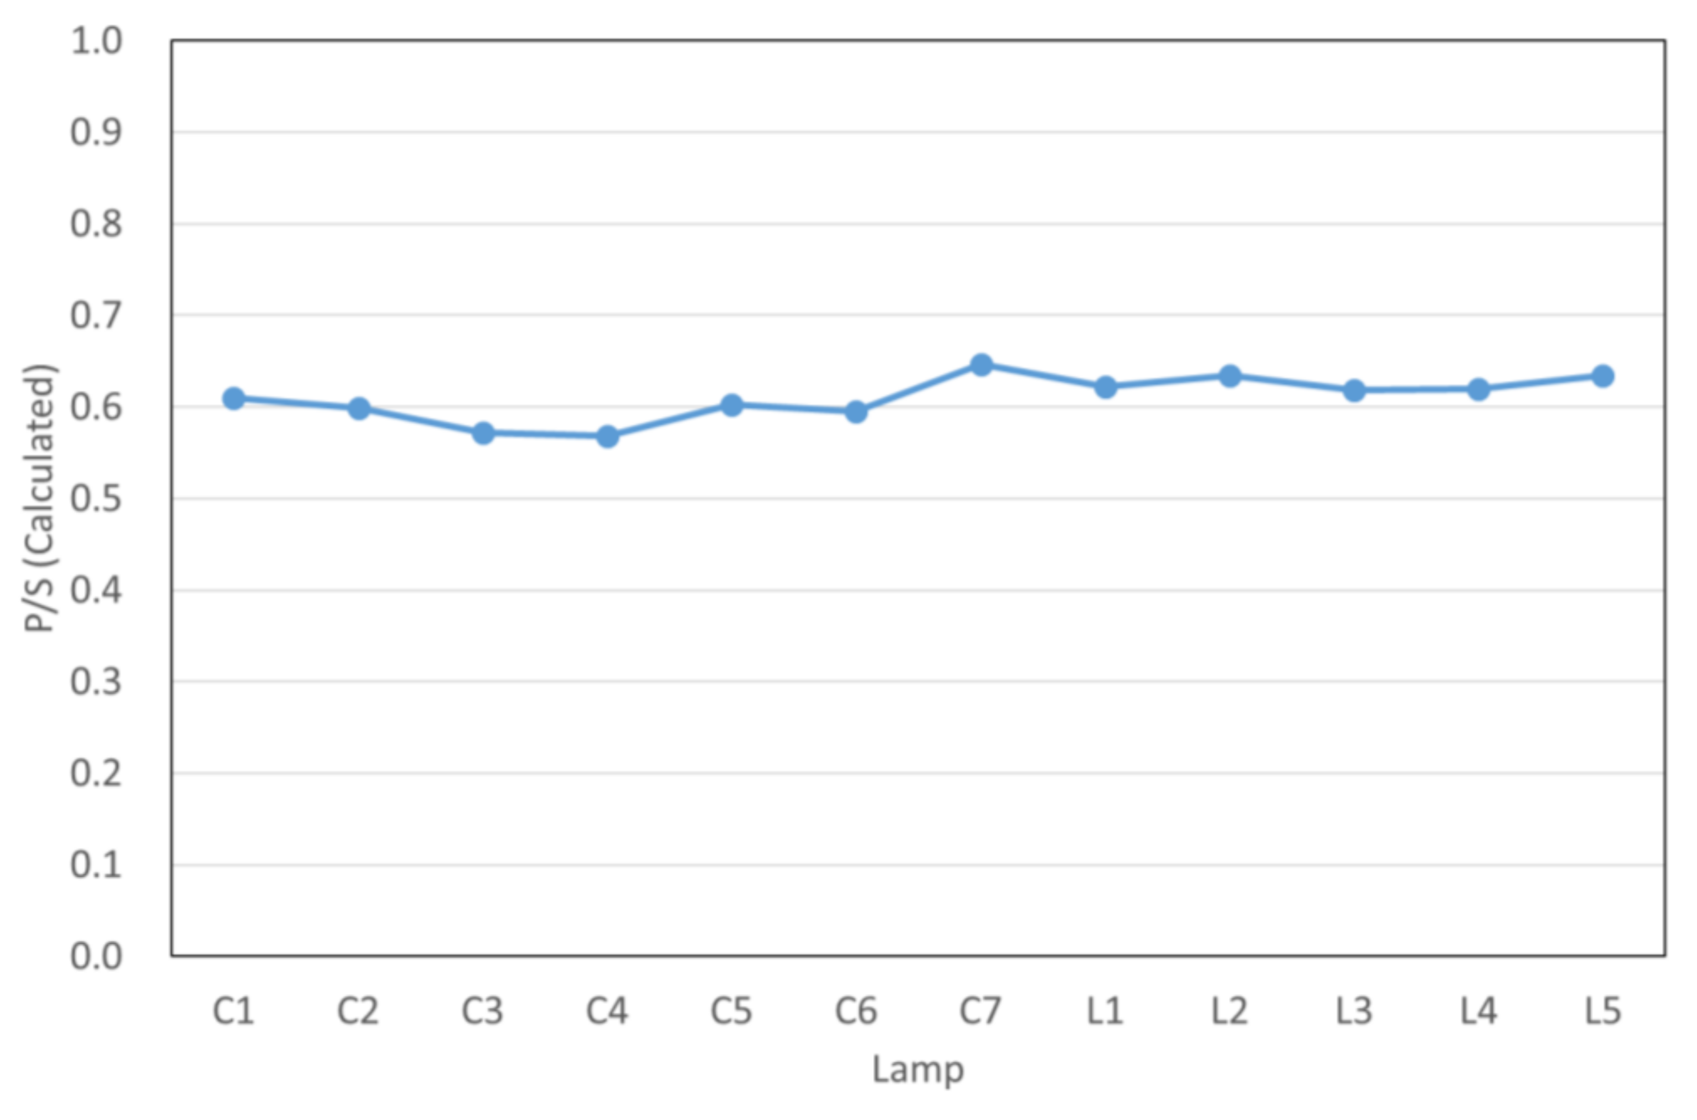
| Lamp | THDi (%) | P (W) | Q (Var) | D (VAd) | S (VA) | ε |
|---|---|---|---|---|---|---|
| L1 | 96.91 | 11.89 | −8.02 | 13.89 | 19.97 | 0.60 |
| L2 | 123.23 | 9.73 | −3.16 | 12.61 | 16.24 | 0.60 |
| L3 | 109.32 | 5.72 | −3.58 | 7.38 | 10.00 | 0.57 |
| L4 | 106.25 | 6.17 | −4.16 | 7.90 | 10.85 | 0.57 |
| L5 | 118.40 | 10.65 | −4.09 | 13.51 | 17.69 | 0.60 |
| C1 | 110.67 | 21.27 | −9.92 | 25.98 | 35.01 | 0.61 |
| C2 | 100.92 | 21.59 | −10.07 | 25.47 | 34.87 | 0.62 |
| C3 | 103.48 | 14.21 | −7.24 | 16.50 | 22.95 | 0.62 |
| C4 | 100.45 | 14.34 | −7.00 | 16.03 | 22.62 | 0.63 |
| C5 | 96.61 | 15.37 | −8.17 | 16.82 | 24.21 | 0.64 |
| C6 | 82.87 | 11.08 | −5.89 | 11.65 | 17.12 | 0.65 |
| C7 | 100.73 | 8.78 | −4.67 | 10.01 | 14.11 | 0.62 |
| Lamp | I1/I3 (%) | I1/I5 (%) | I1/I7 (%) | I1/I9 (%) |
|---|---|---|---|---|
| L1 | 70.97 | 45.16 | 37.10 | 30.65 |
| L2 | 84.09 | 65.91 | 47.73 | 38.64 |
| L3 | 75.86 | 55.17 | 41.38 | 37.93 |
| L4 | 71.88 | 53.13 | 40.63 | 40.63 |
| L5 | 81.63 | 59.18 | 44.90 | 42.86 |
| C1 | 79.21 | 52.48 | 41.58 | 38.61 |
| C2 | 76.47 | 50.00 | 41.18 | 37.25 |
| C3 | 75.36 | 47.83 | 39.13 | 34.78 |
| C4 | 73.53 | 45.59 | 38.24 | 33.82 |
| C5 | 71.62 | 44.59 | 36.49 | 29.73 |
| C6 | 68.52 | 42.59 | 35.19 | 29.63 |
| C7 | 74.42 | 46.51 | 37.21 | 32.56 |
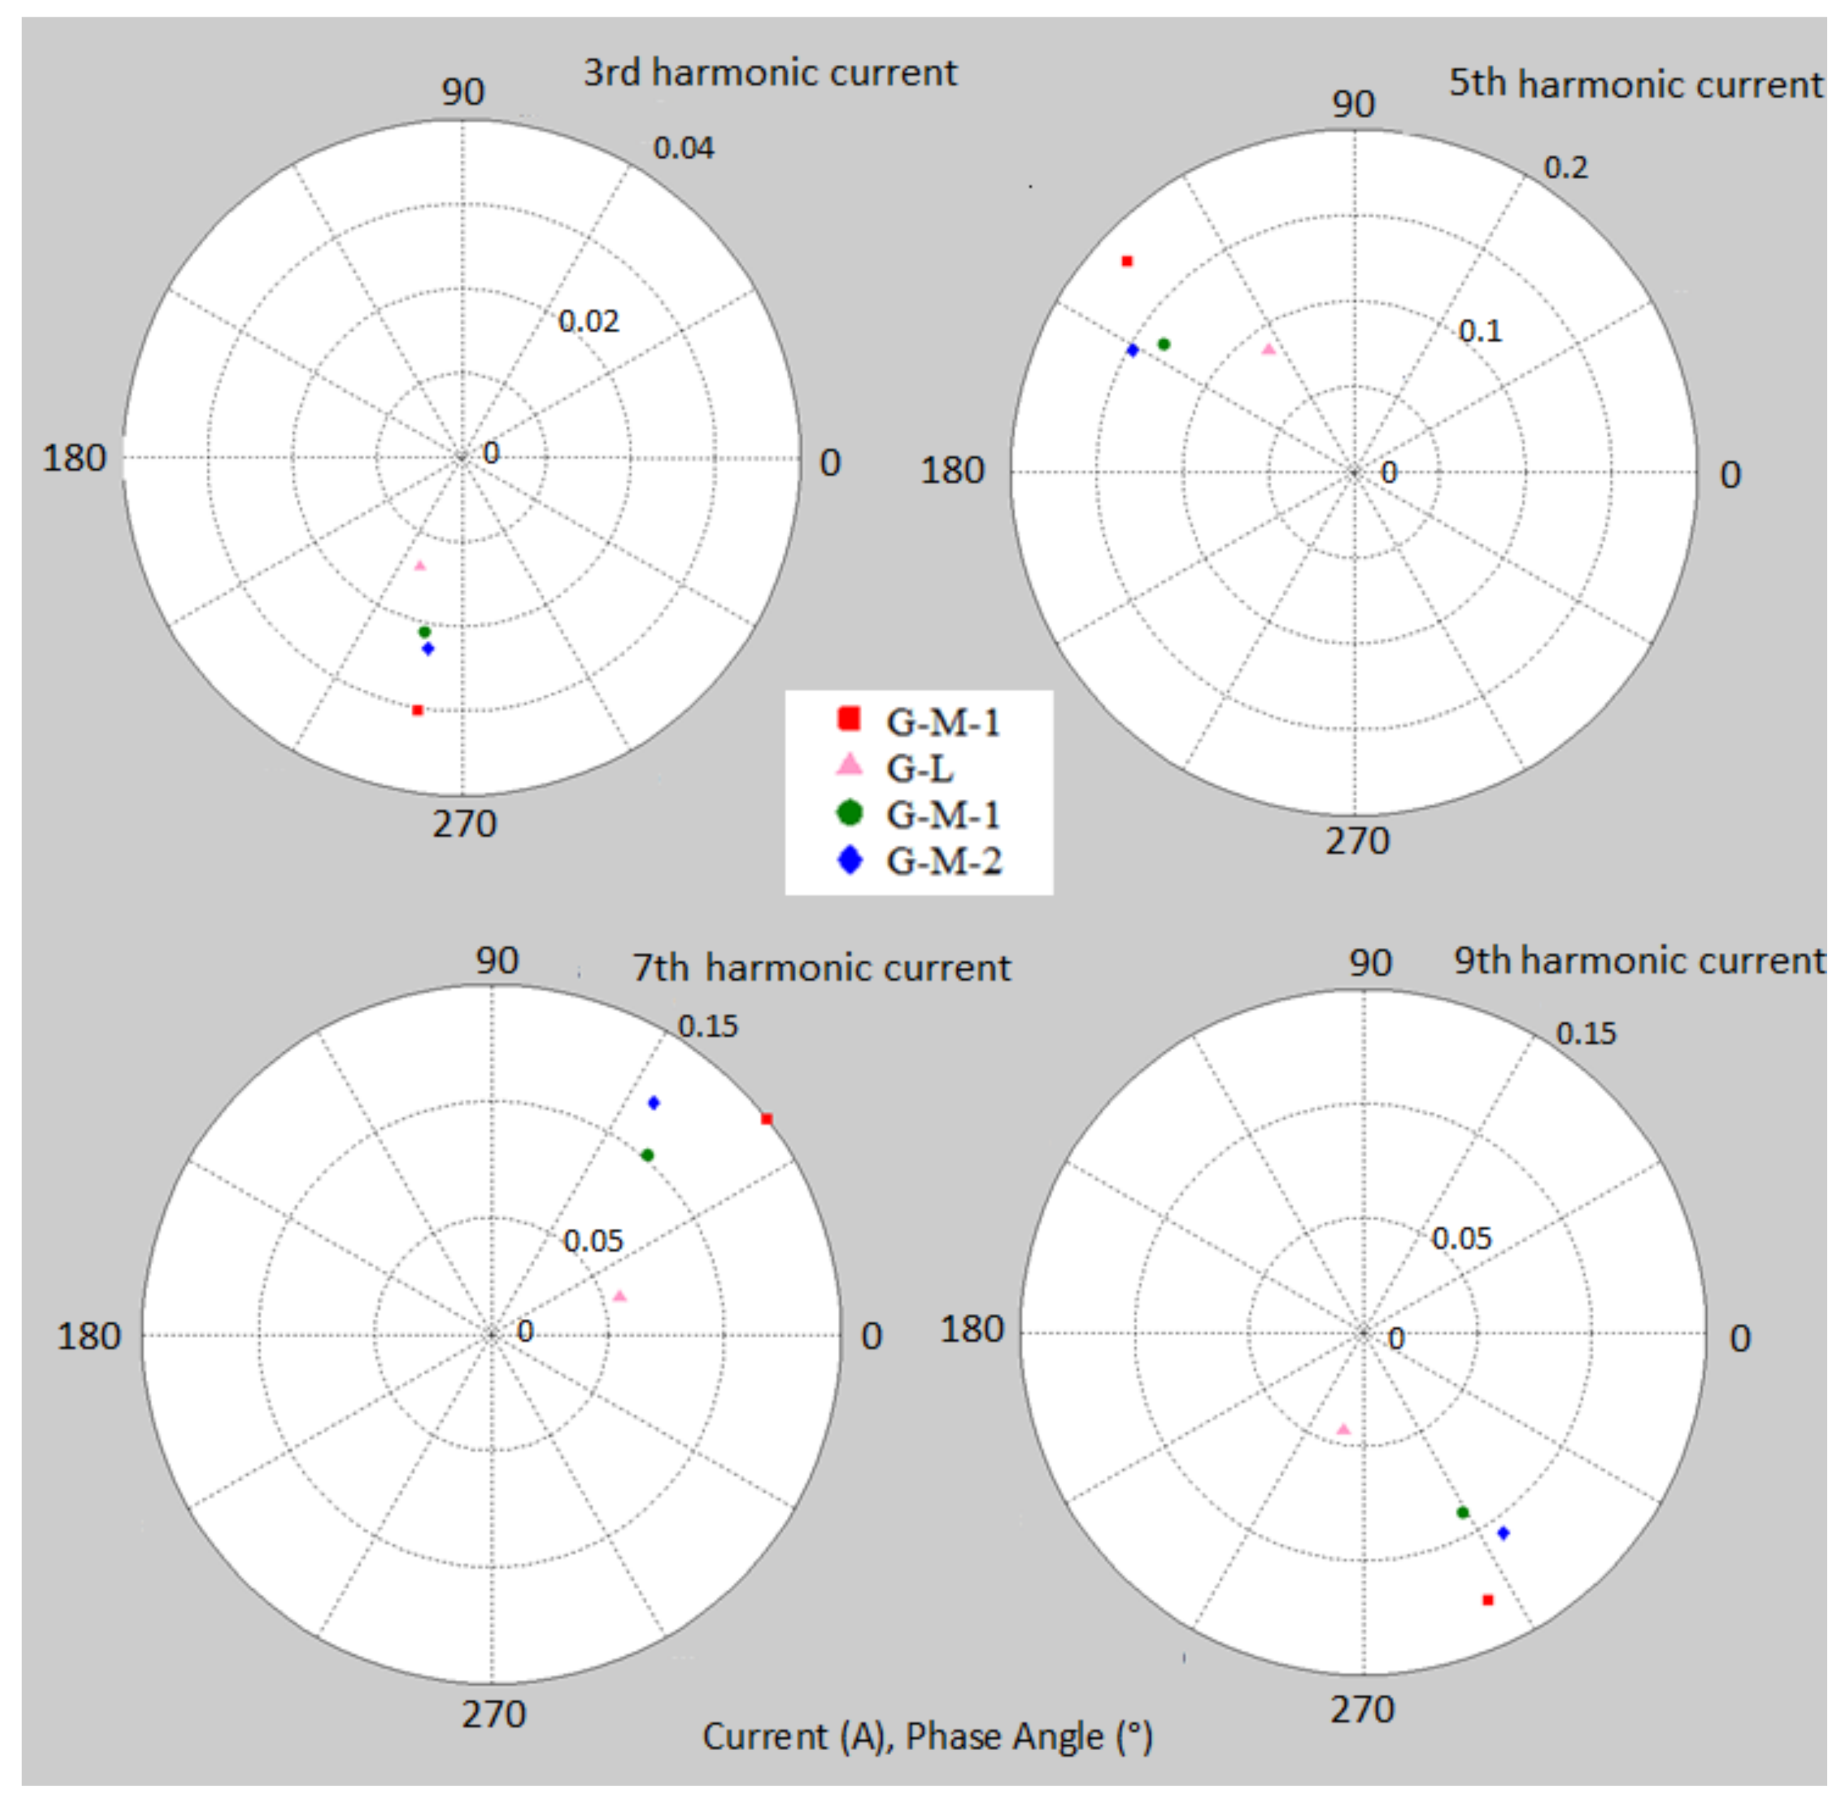
| Lamp | THDi (%) | P (W) | Q (Var) | D (VAd) | S (VA) |
|---|---|---|---|---|---|
| G-L | 104.16 | 38.3 | −19.5 | 44.9 | 62.1 |
| G-C | 53.32 | 62.1 | −29.2 | 79.2 | 104.9 |
| G-M-1 | 104.78 | 59.5 | −30 | 70.2 | 96.8 |
| G-M-2 | 64.97 | 104.2 | −40.9 | 98.9 | 149.4 |
| Lamp | THDi (%) | P (W) | Q (Var) | D (VAd) | S (VA) | ε |
|---|---|---|---|---|---|---|
| G-L | 97.44 | 38.28 | −18.67 | 41.50 | 59.46 | 0.64 |
| G-C | 104.78 | 63.42 | −30.93 | 73.93 | 102.20 | 0.62 |
| G-M-1 | 100.91 | 59.33 | −28.94 | 66.61 | 93.78 | 0.63 |
| G-M-2 | 84.10 | 104.32 | −42.15 | 94.62 | 147.01 | 0.71 |
Publisher’s Note: MDPI stays neutral with regard to jurisdictional claims in published maps and institutional affiliations. |
© 2020 by the authors. Licensee MDPI, Basel, Switzerland. This article is an open access article distributed under the terms and conditions of the Creative Commons Attribution (CC BY) license (http://creativecommons.org/licenses/by/4.0/).
Share and Cite
Graña-López, M.Á.; Filgueira-Vizoso, A.; Castro-Santos, L.; García-Diez, A.I. Analysis of the Real Energy Consumption of Energy Saving Lamps. Appl. Sci. 2020, 10, 8446. https://doi.org/10.3390/app10238446
Graña-López MÁ, Filgueira-Vizoso A, Castro-Santos L, García-Diez AI. Analysis of the Real Energy Consumption of Energy Saving Lamps. Applied Sciences. 2020; 10(23):8446. https://doi.org/10.3390/app10238446
Chicago/Turabian StyleGraña-López, Manuel Ángel, Almudena Filgueira-Vizoso, Laura Castro-Santos, and Ana Isabel García-Diez. 2020. "Analysis of the Real Energy Consumption of Energy Saving Lamps" Applied Sciences 10, no. 23: 8446. https://doi.org/10.3390/app10238446