Techno-Economic Analysis of Grid-Connected PV and Fuel Cell Hybrid System Using Different PV Tracking Techniques


Abstract
:1. Introduction
1.1. Studies Related to the Hybrid Energy Systems
1.2. Studies Related to Photovoltaic (PV) Tracking Techniques
1.3. Contributions of Our Study
- (1)
- Based on the authors’ understanding, the influence of PV tracking technology on the technical and economic performance of grid connected hybrid energy system (PV-FC) is studied for the first time. The research of a hybrid energy system (PV-FC) is more meaningful in a real application.
- (2)
- In our study, many technical and economic factors, such as PV power generation, excess energy, renewable energy penetration, GHG emissions, power purchased from the grid, power sold to the grid, lifetime project cost and LCOE and so on, are considered. Unlike other studies in [14,61,62,63], decision variables considered in their model are less so that the feasibility in other applications is poor.
- (3)
2. Hybrid System and Techno-Economic Analysis Method
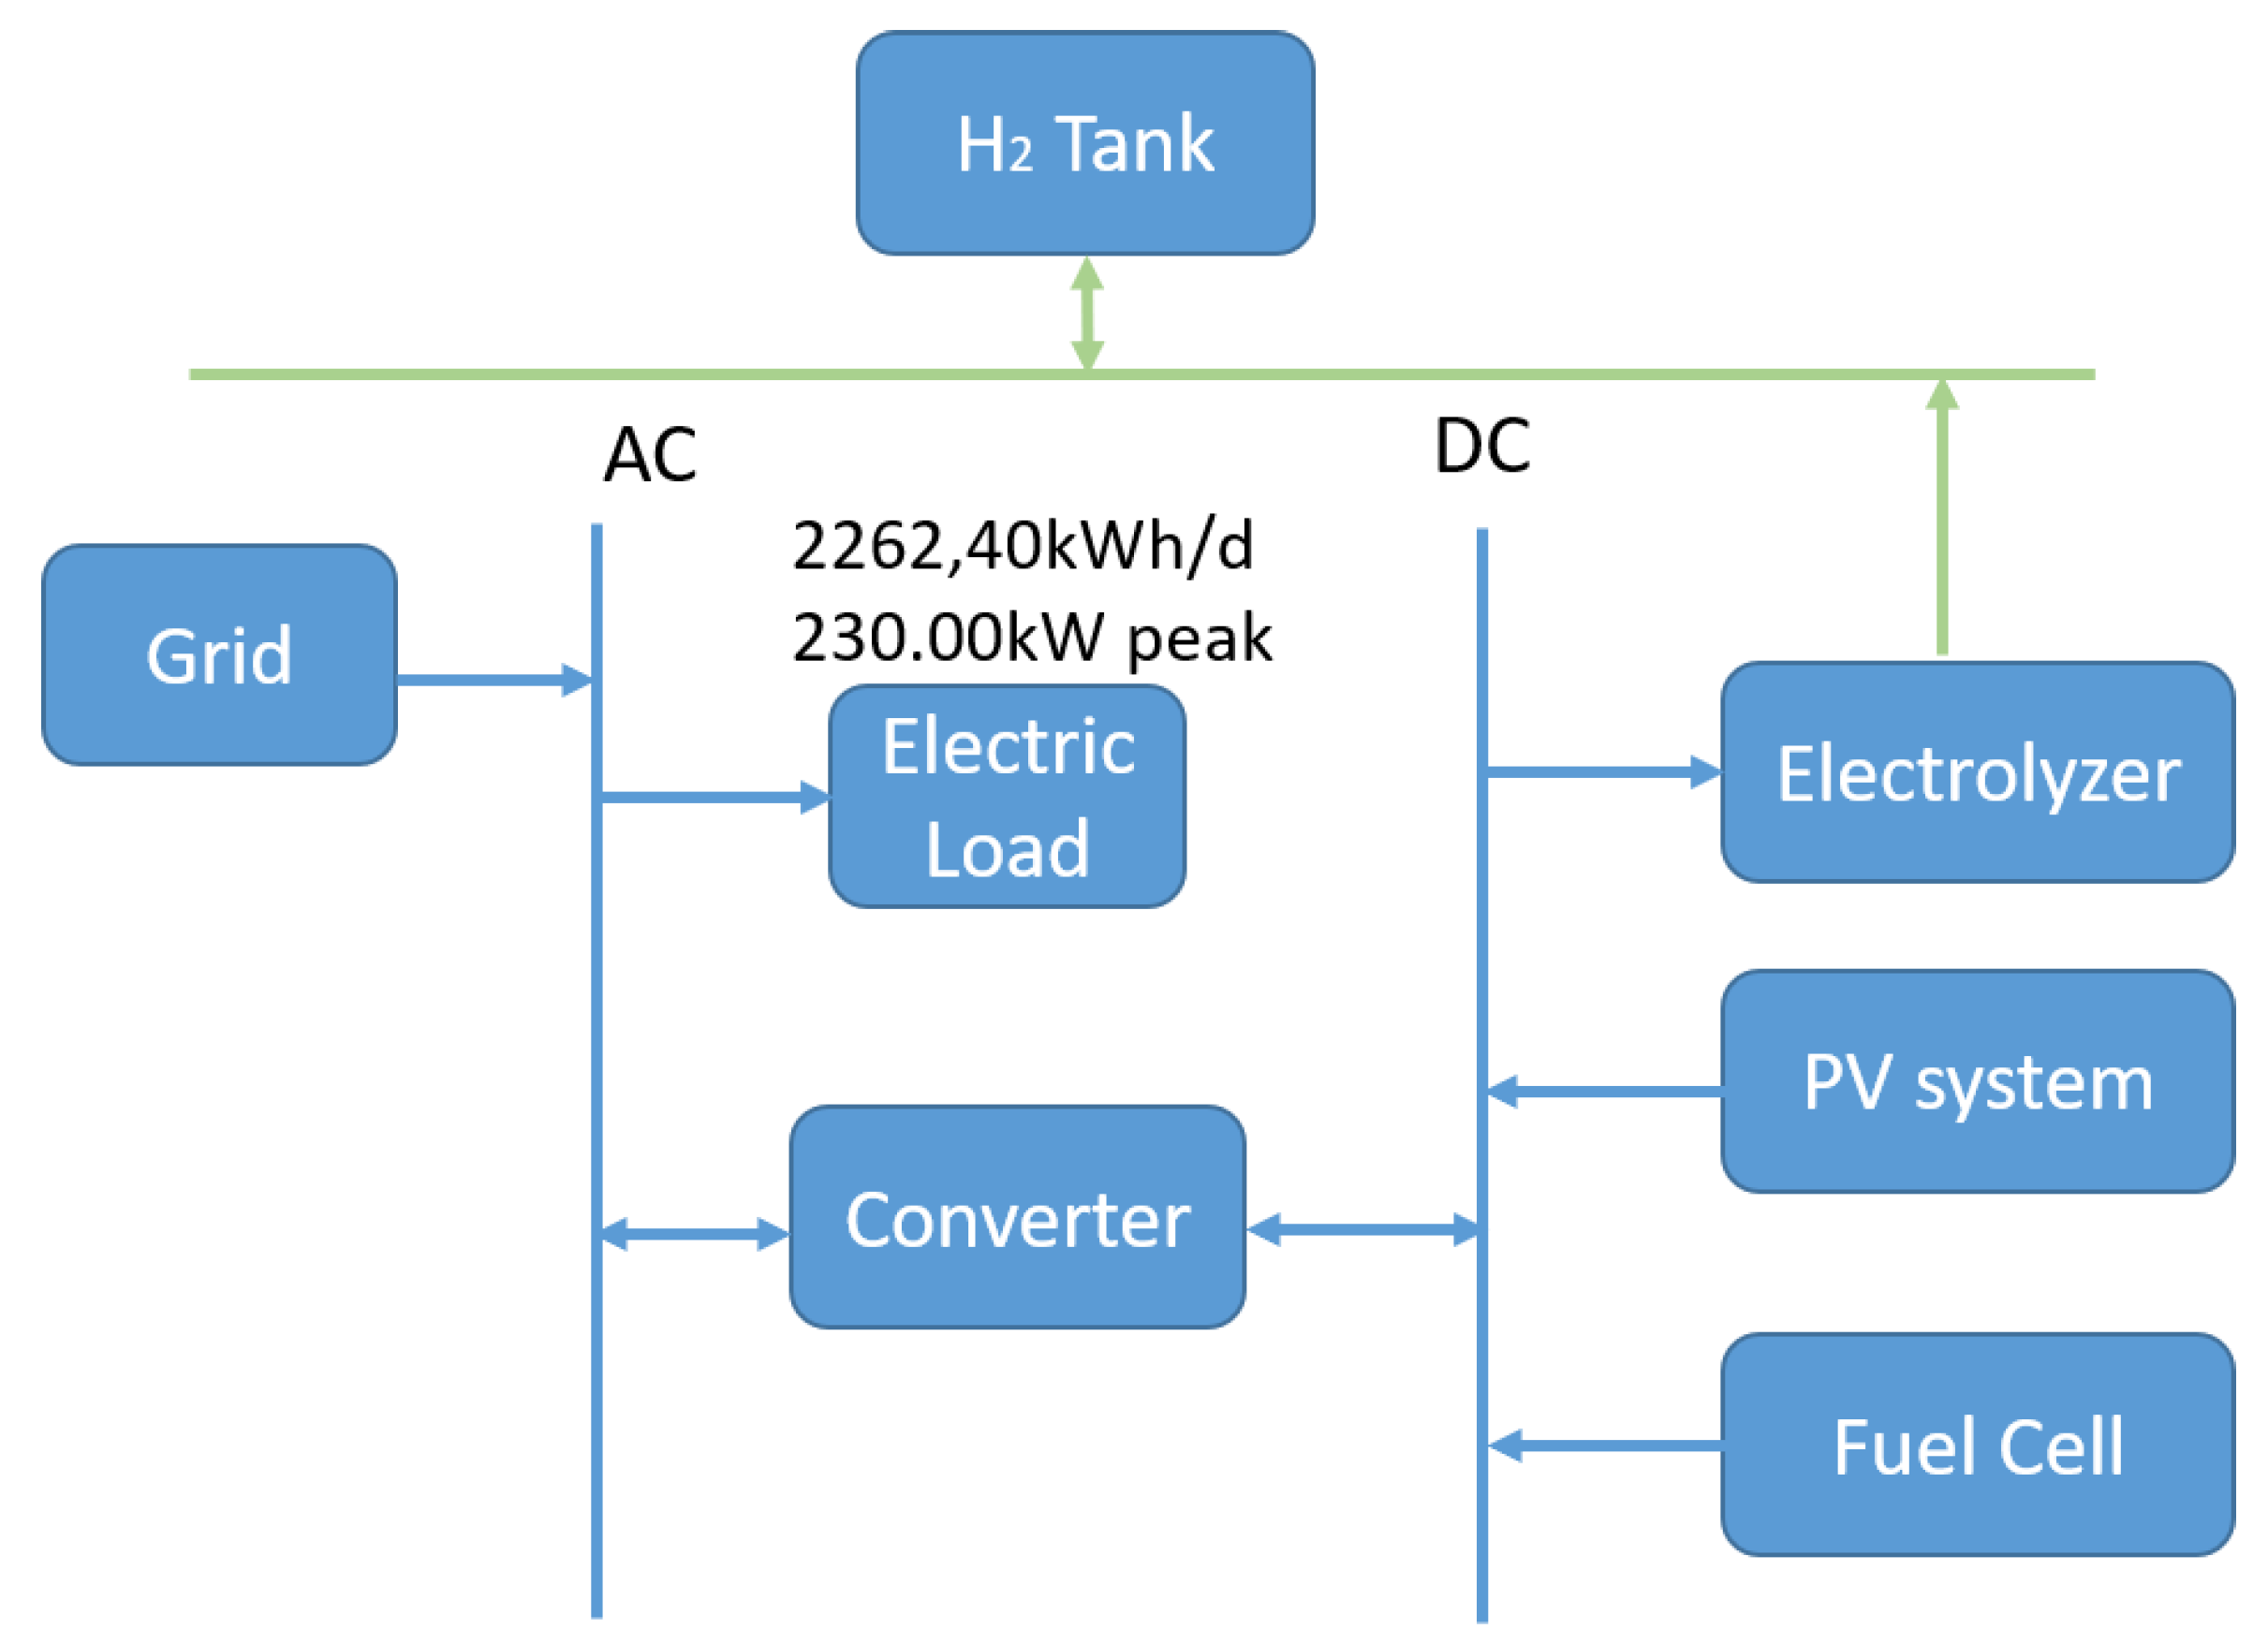
2.1. Topology and Design Principle of Grid-Connected PV and Fuel Cell (FC) Hybrid System
2.2. The Design of Hybrid System Components
2.2.1. Solar PV Models
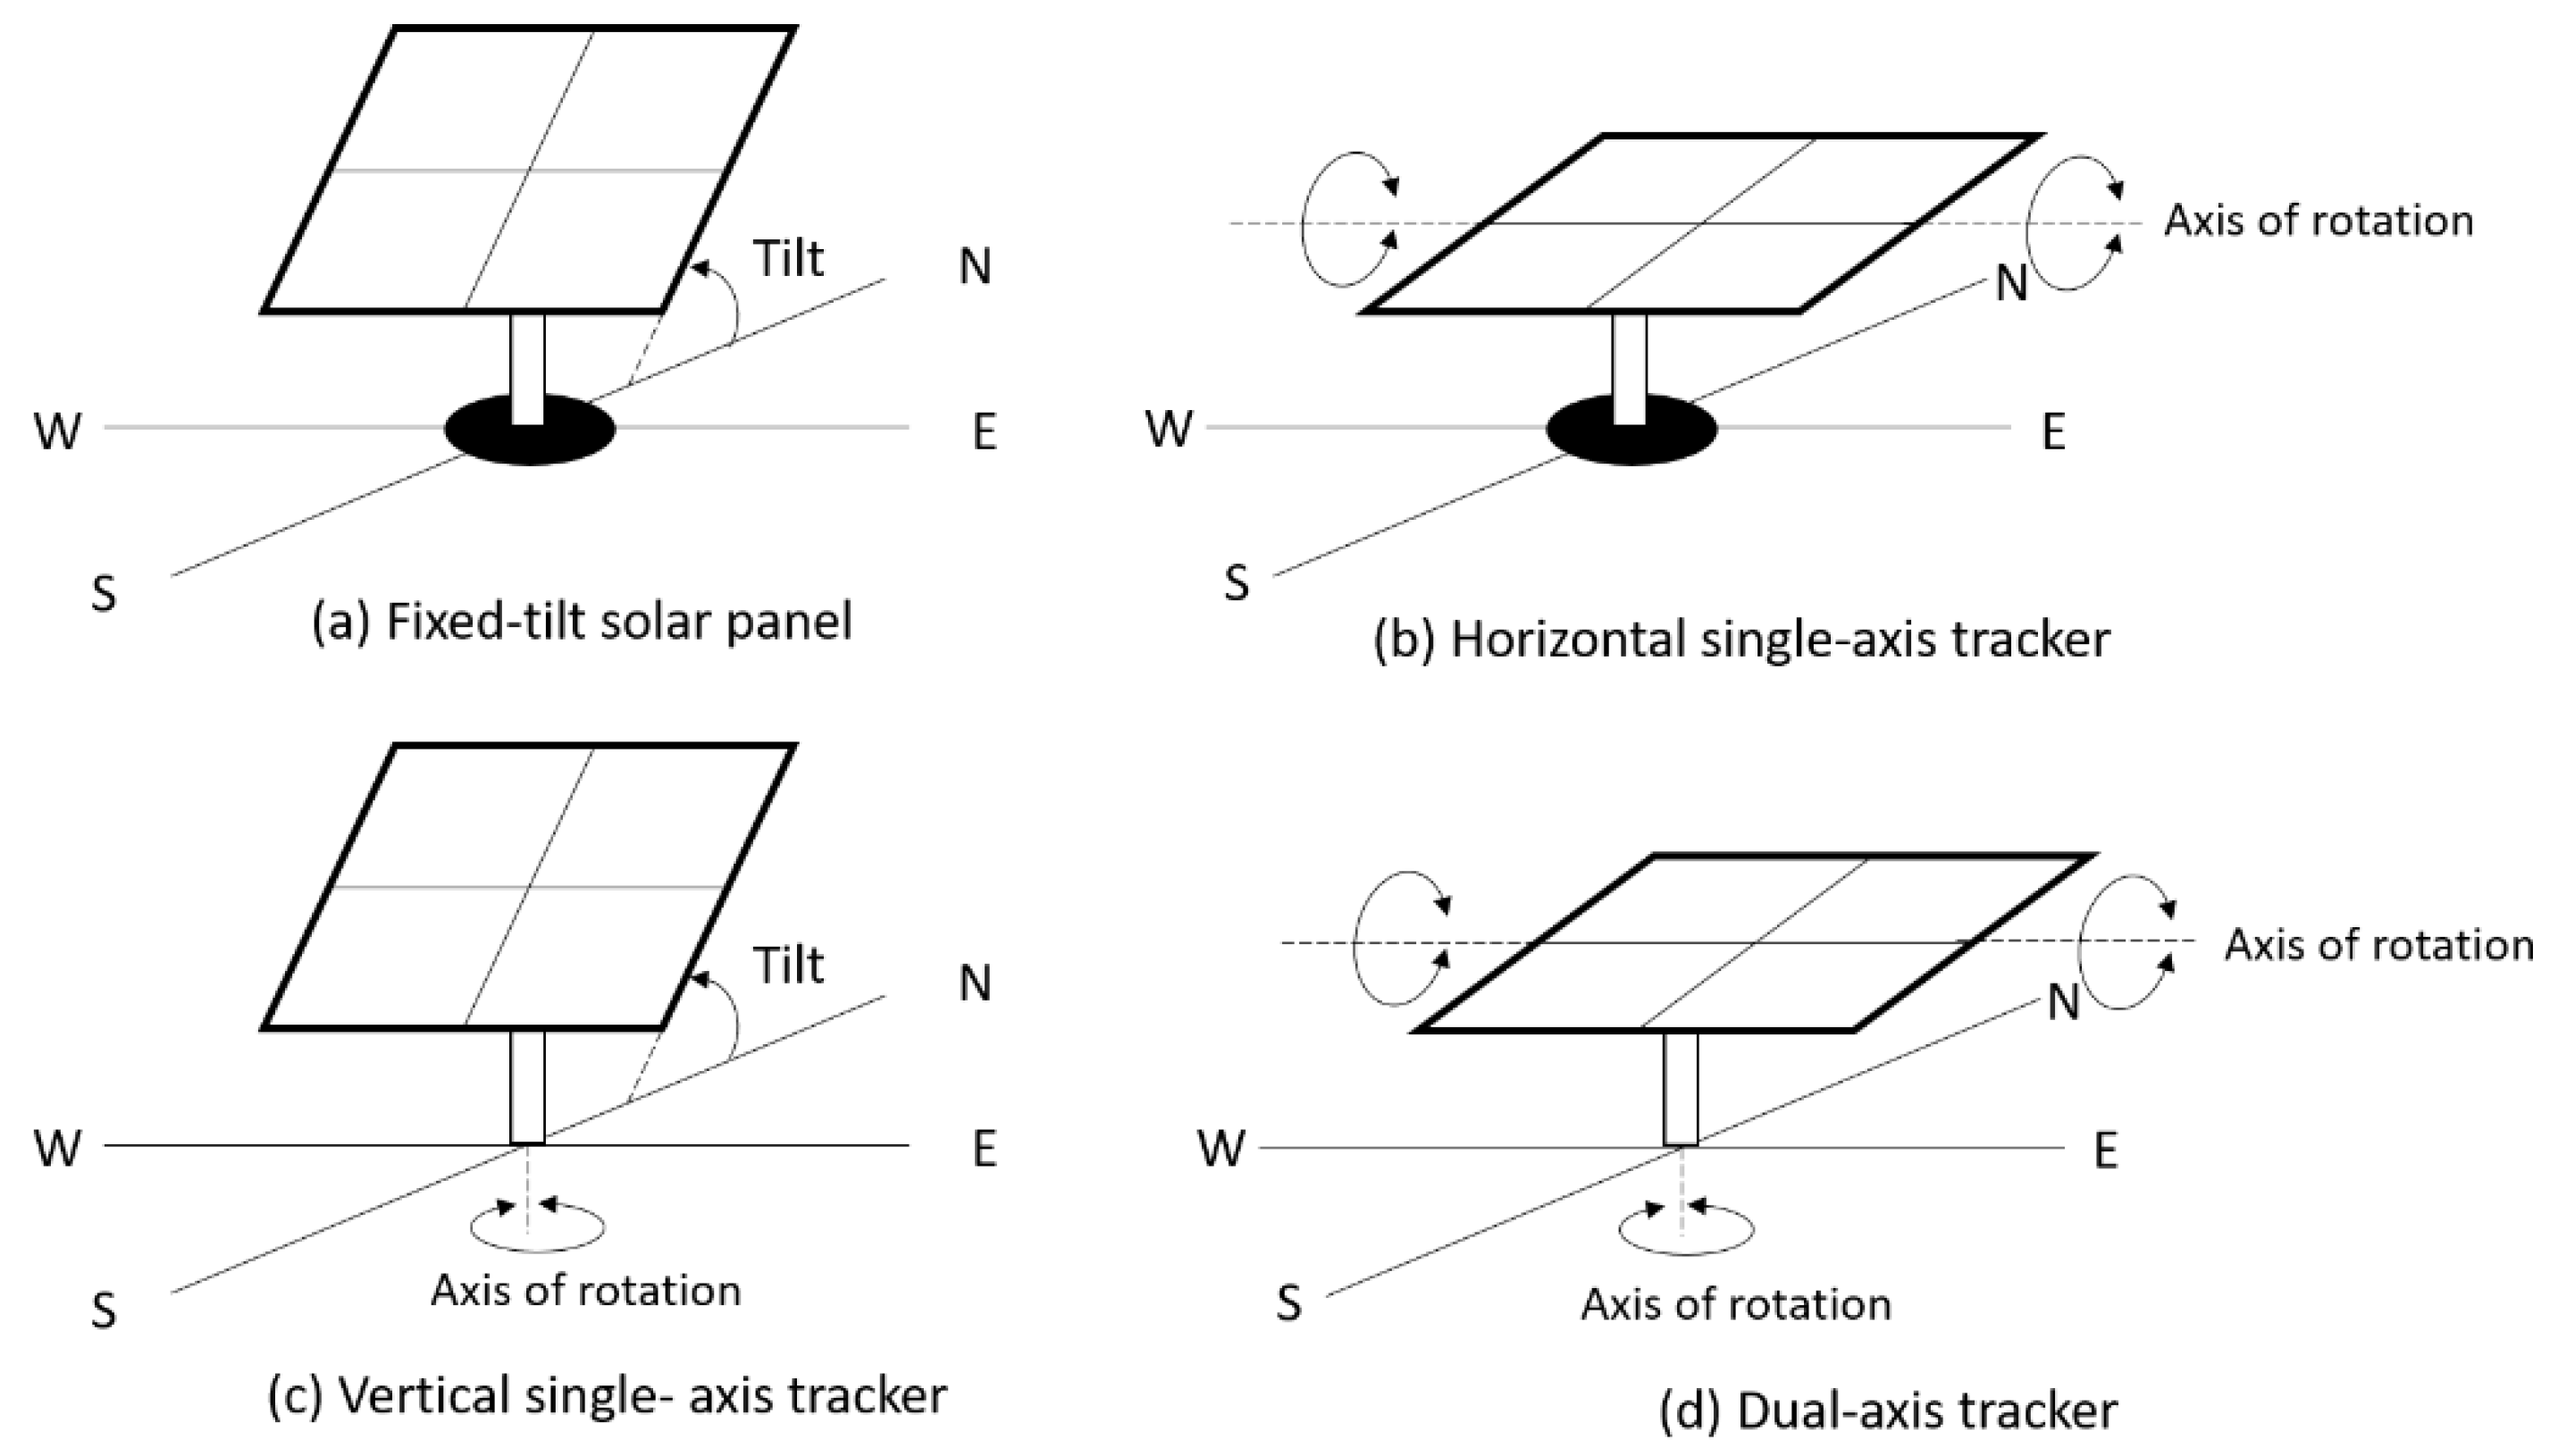
2.2.2. PV Tracking Techniques
- Fixed-tilt solar panel (FTSP).
- PV array is set fixed-tilt angle and azimuth. This is the commonest and simplest technique.
- Horizontal single-axis tracker (HSAT).
- The PV array is installed to rotate around the horizontal (east-west) axis. The tilt angle adjusts continuously for matching the angle of incidence, while azimuth is fixed.
- Vertical single-axis tracker (VSAT).
- PV array is installed to rotate around the vertical (north-south) axis. The tilt angle is fixed, while azimuth is adjusted simultaneously for matching the angle of incidence.
- Dual-axis tracker (DAT).
2.2.3. Electrolyzer
2.2.4. Hydrogen Tank
2.2.5. Fuel Cell
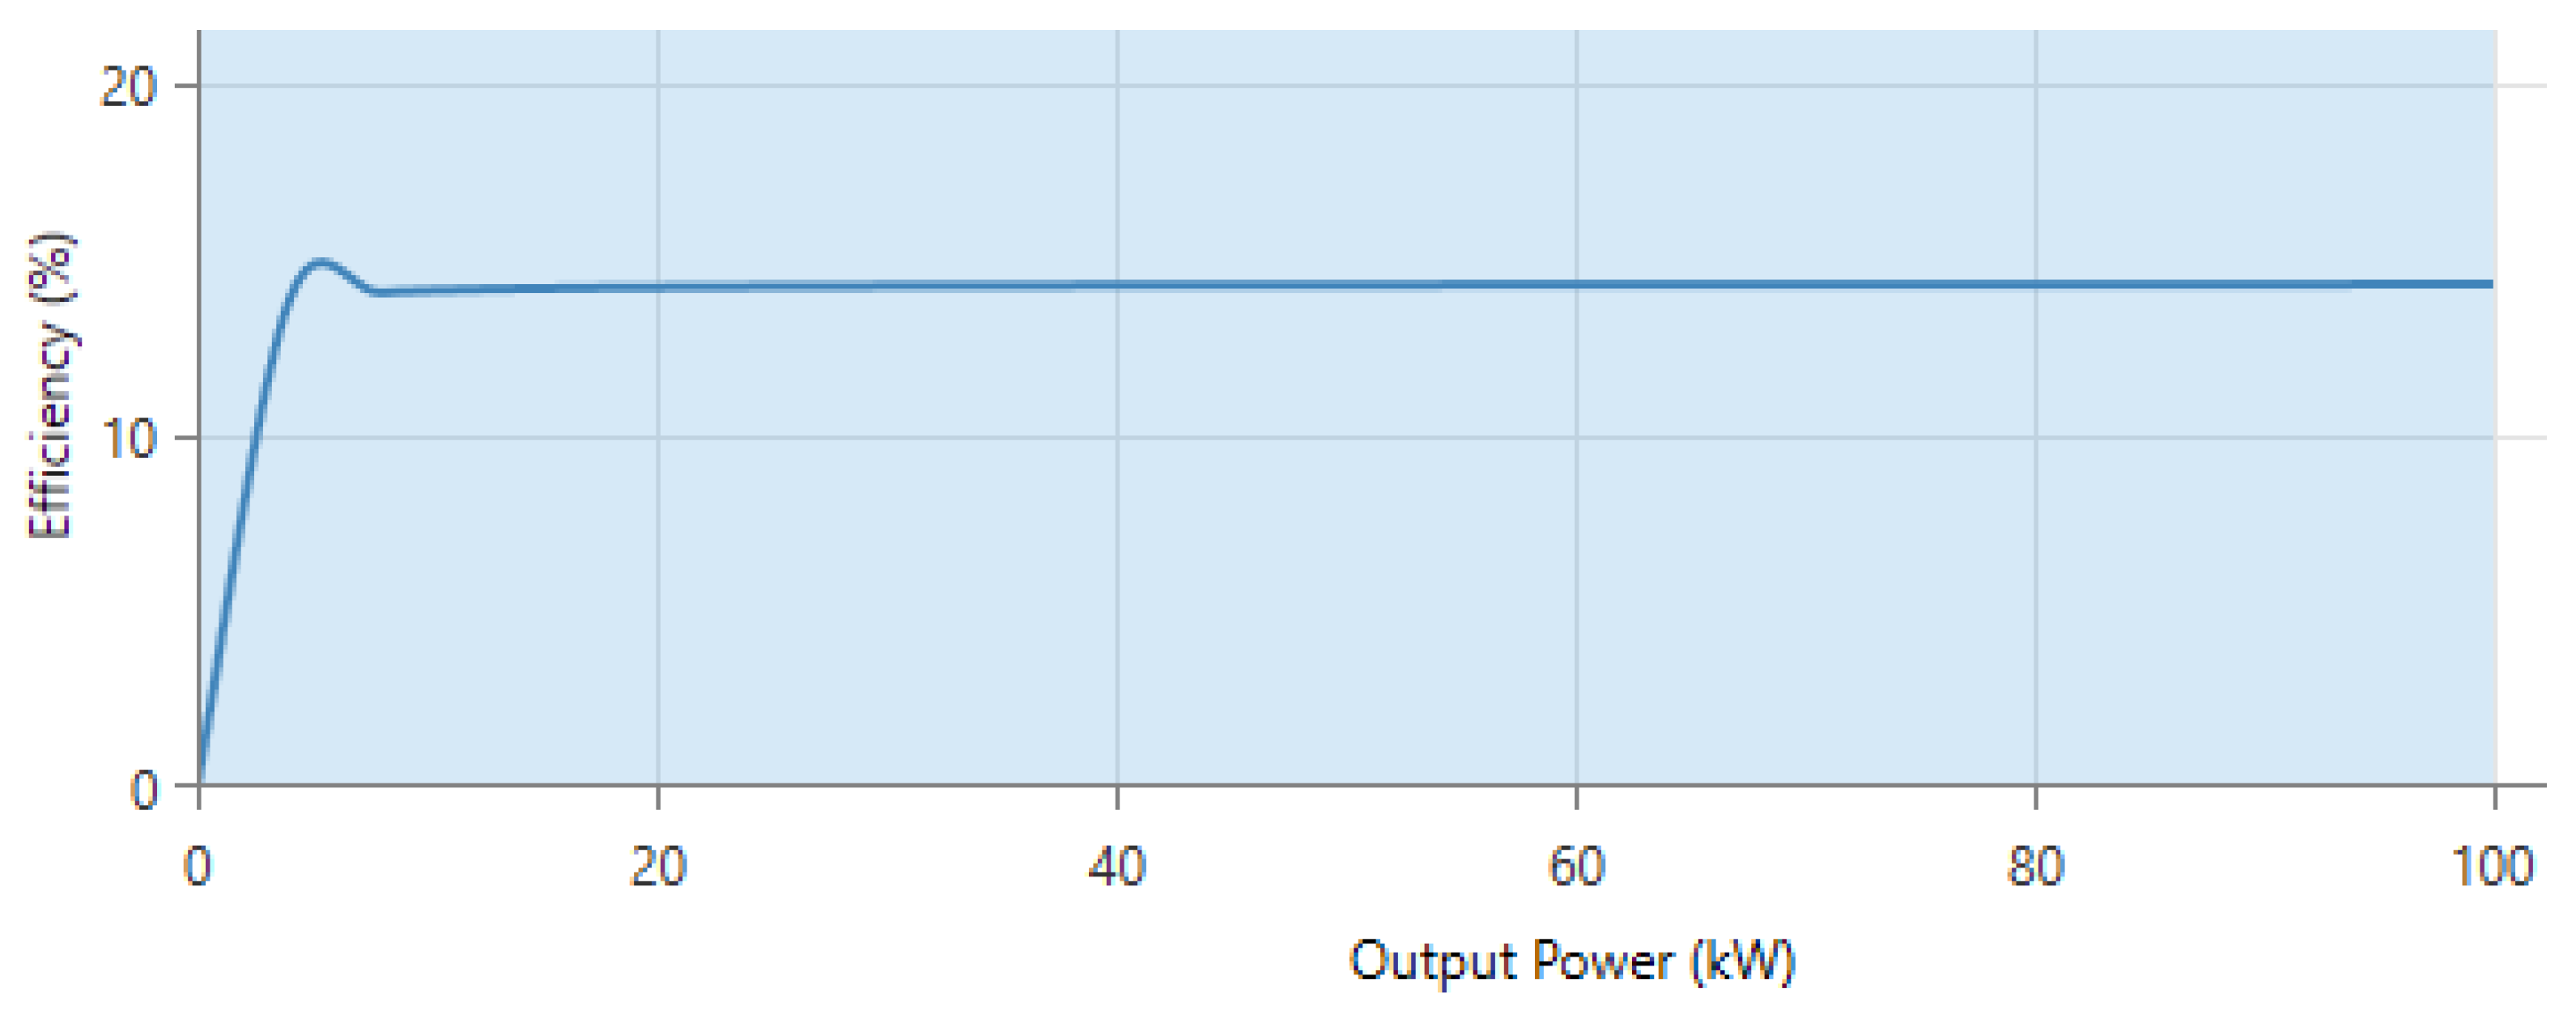
2.2.6. Inverter
2.2.7. Grid
2.3. Economic Analysis Criteria
2.4. Energy Dispatch Principle of the Hybrid System
3. Introduction of Input Data and Software
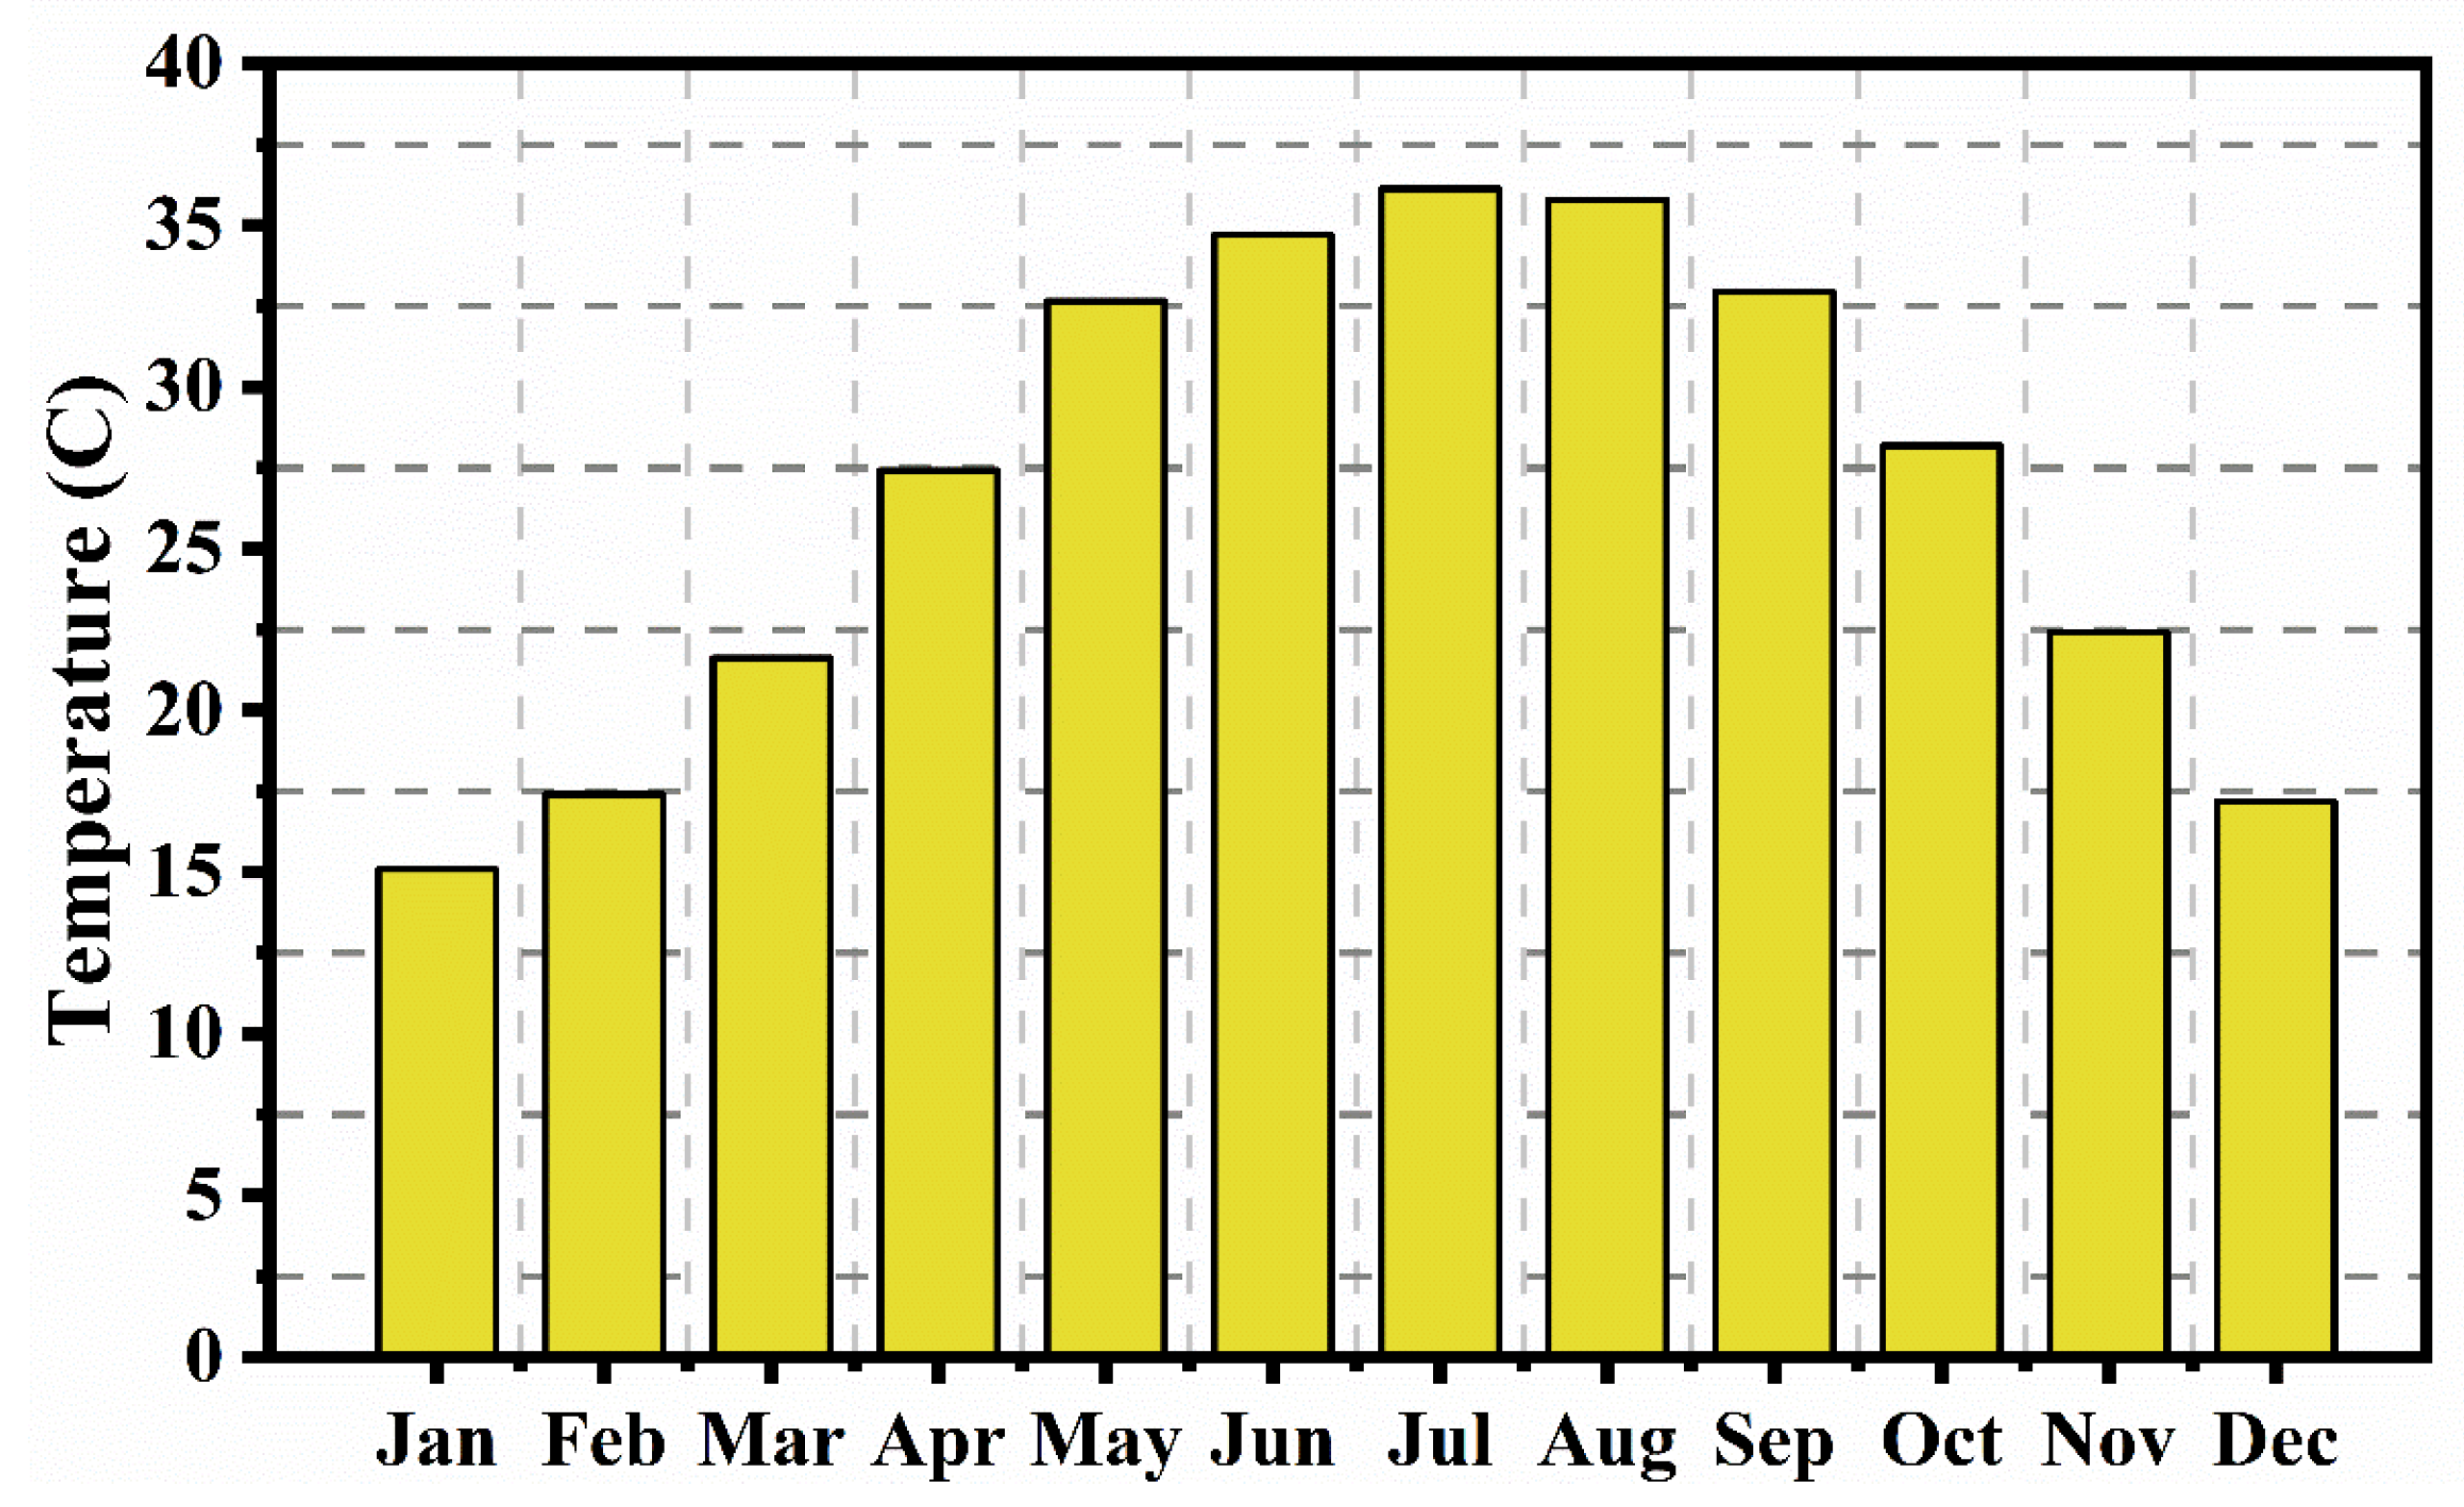
3.1. Geographic Characteristic
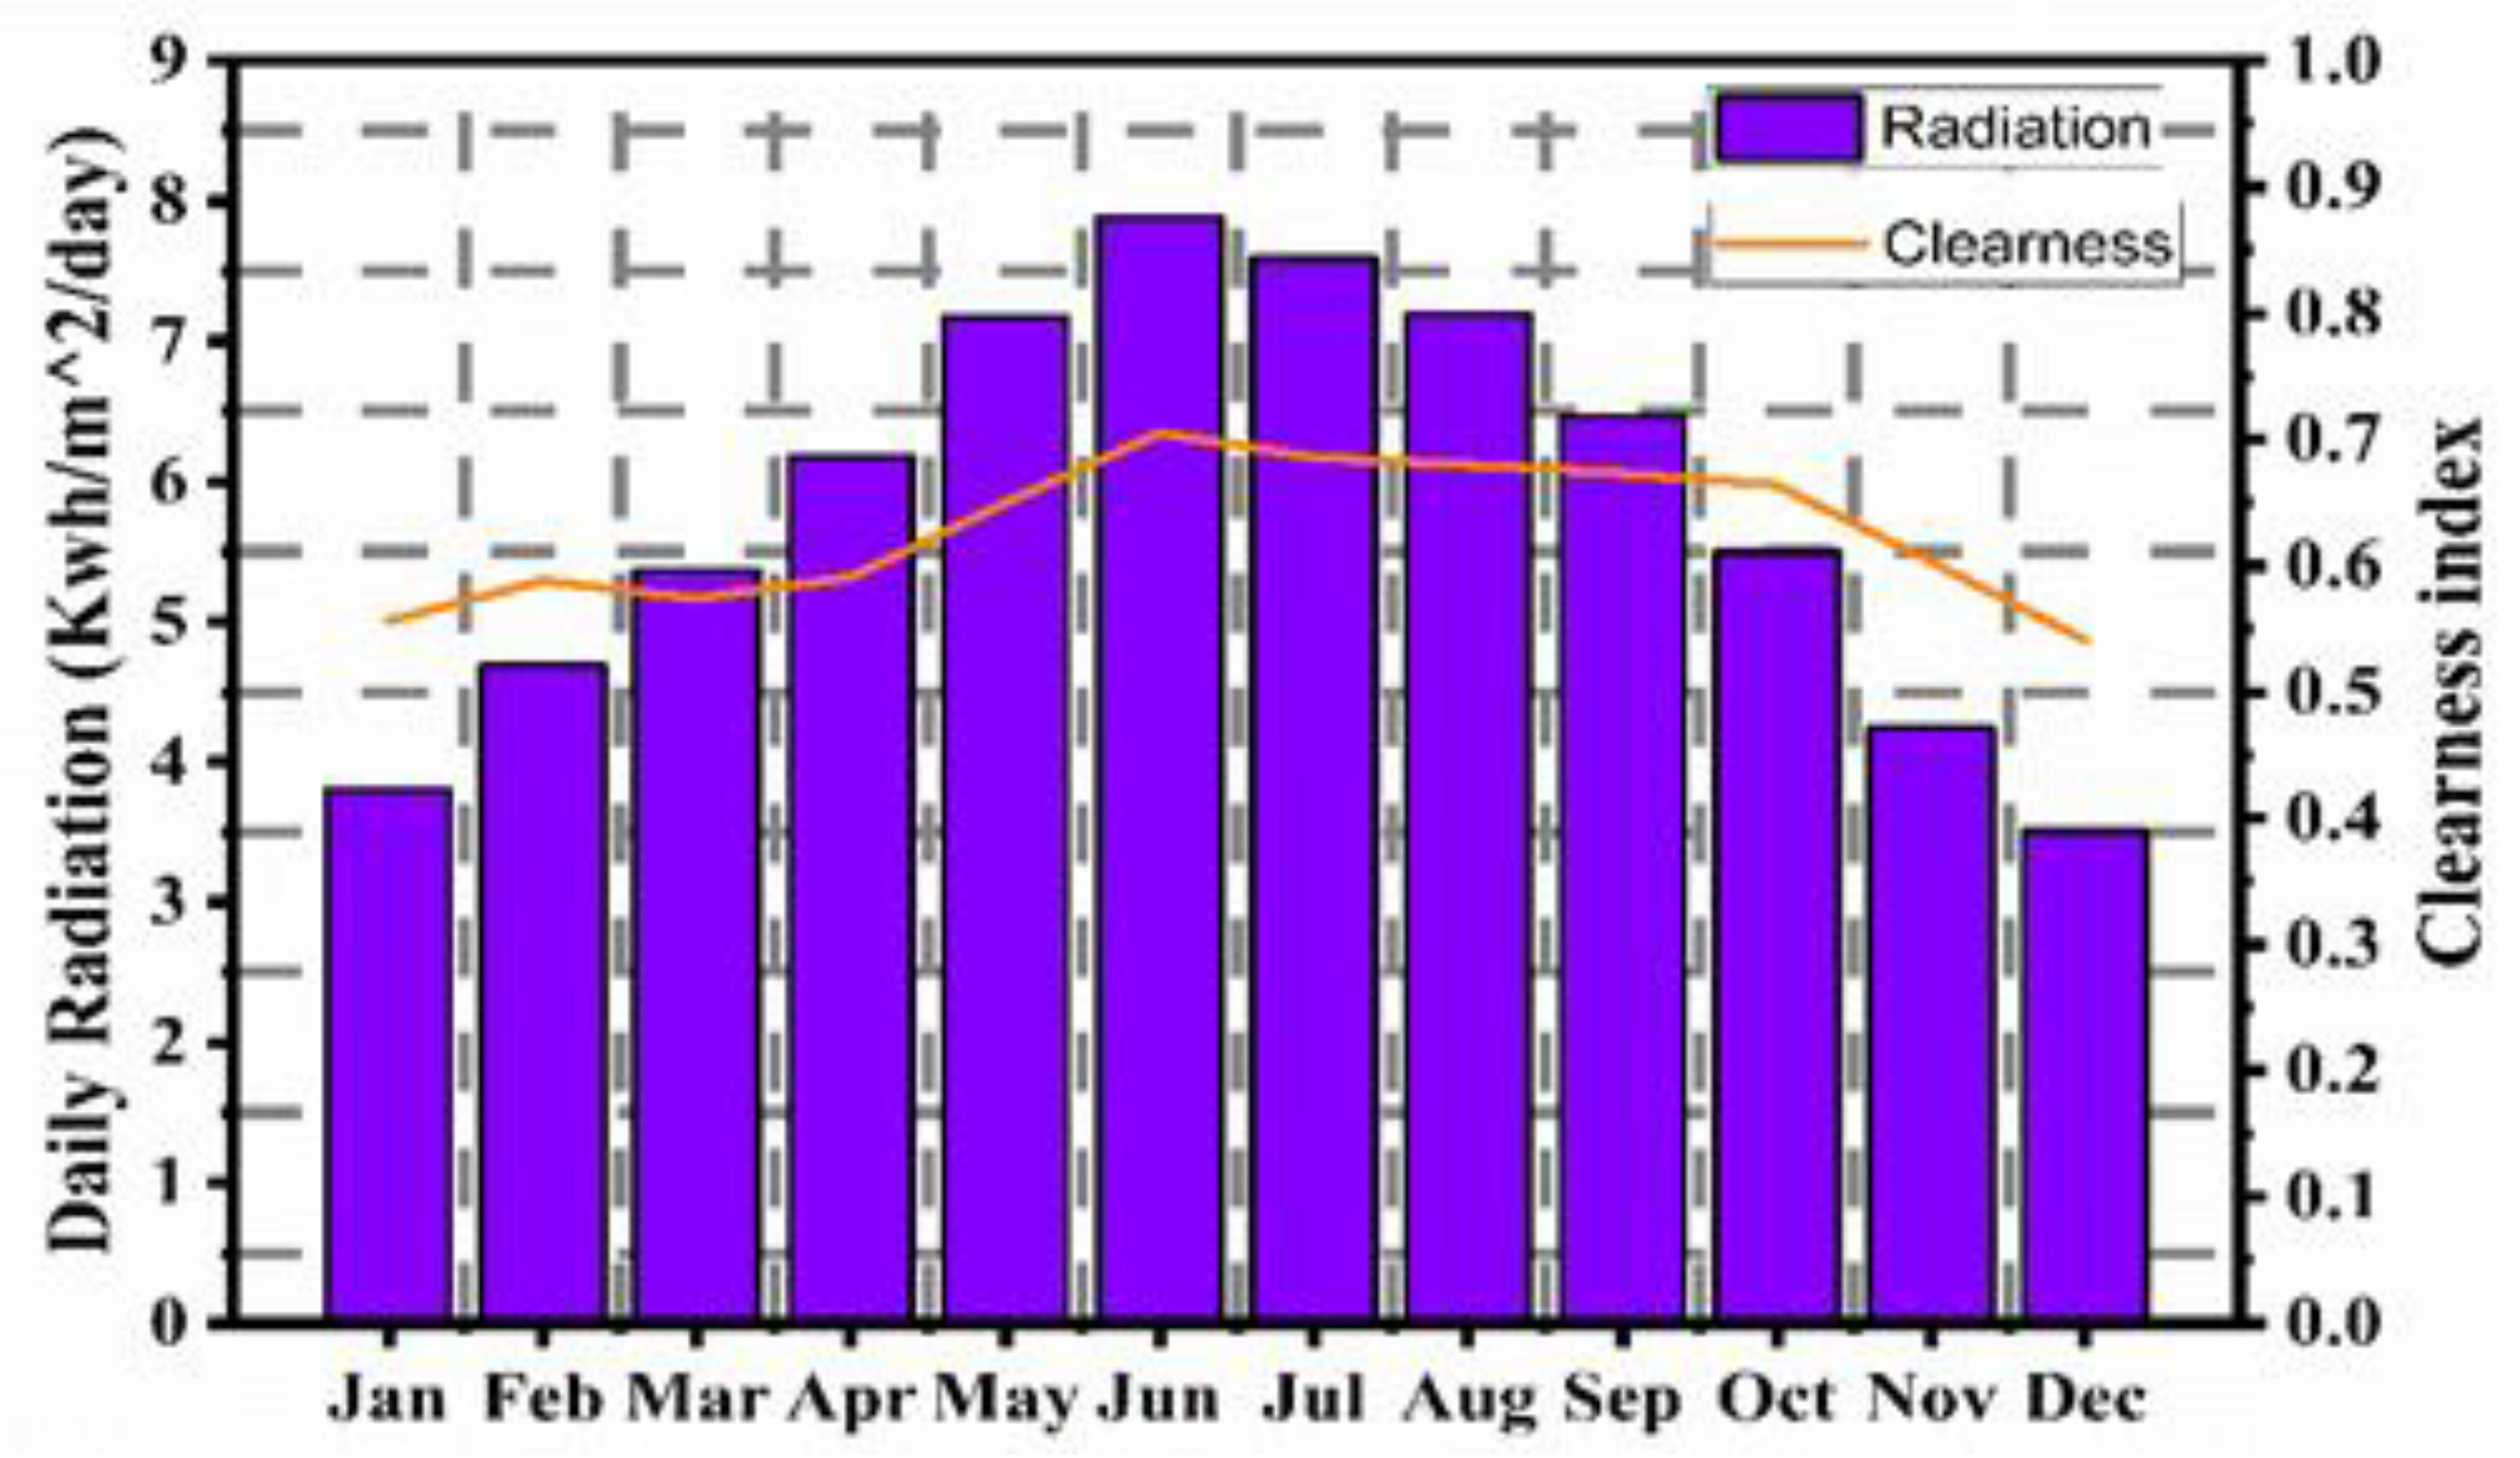
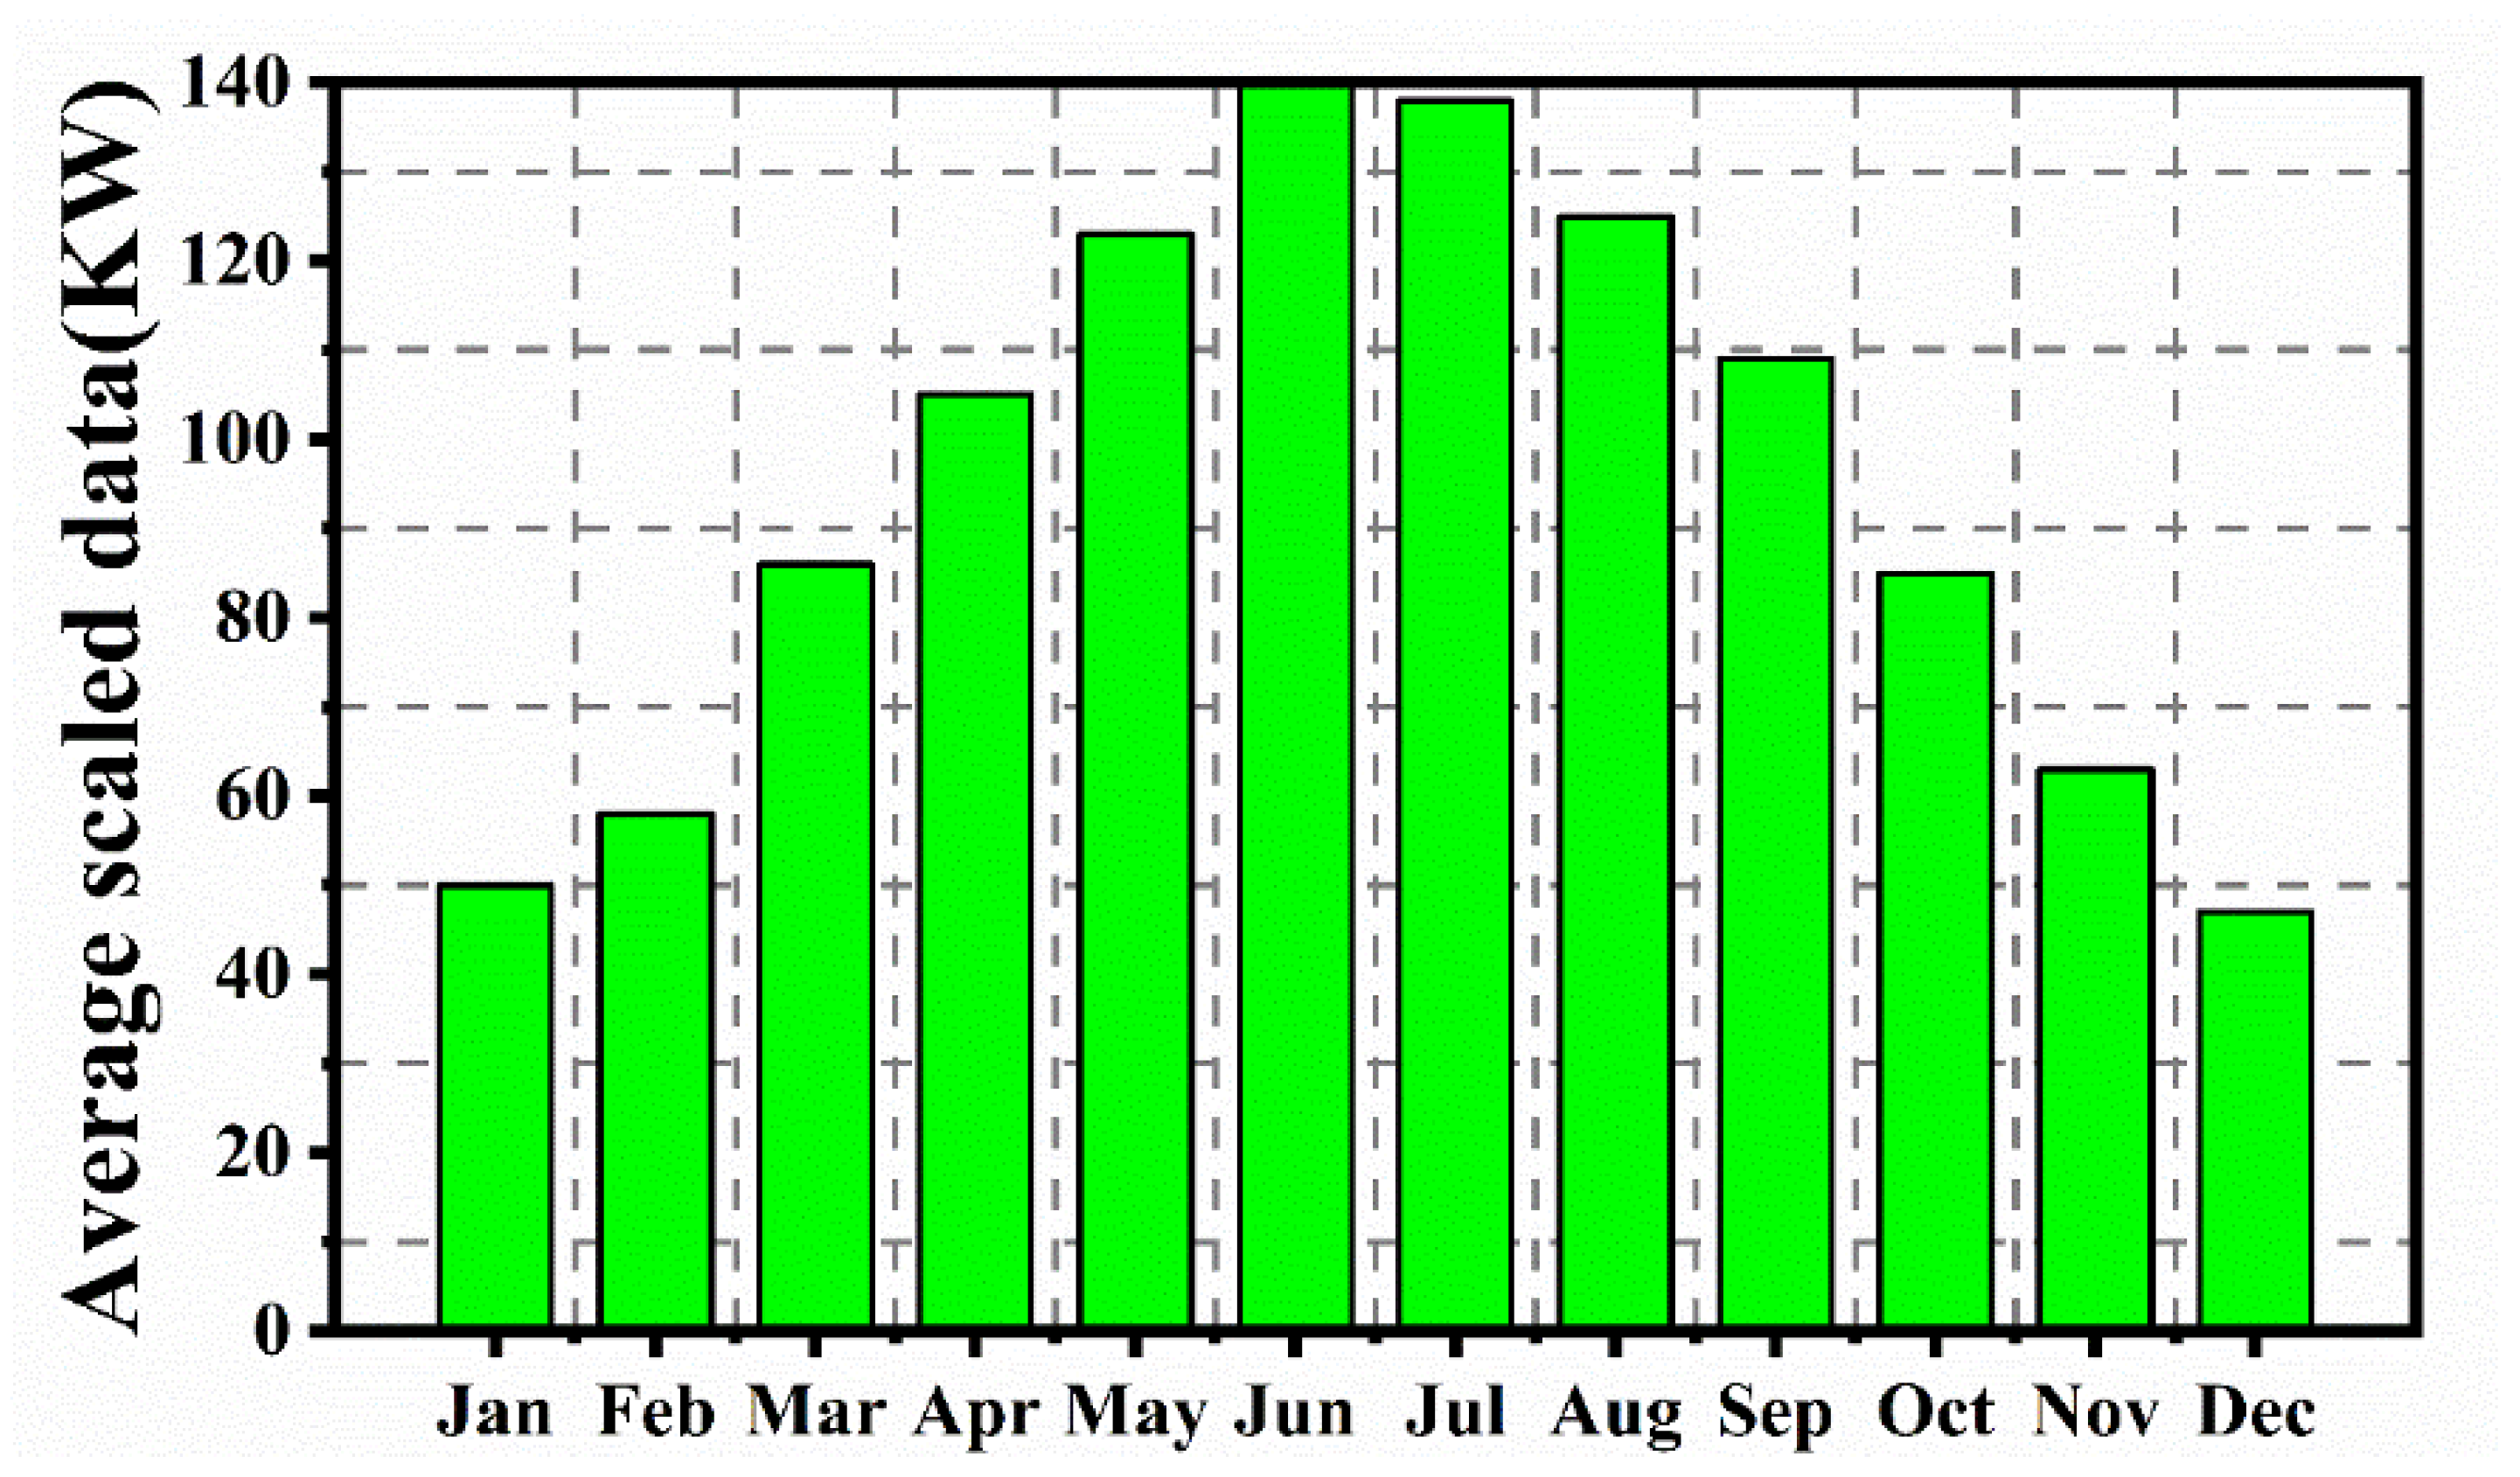
3.2. Renewable Sources Assessment
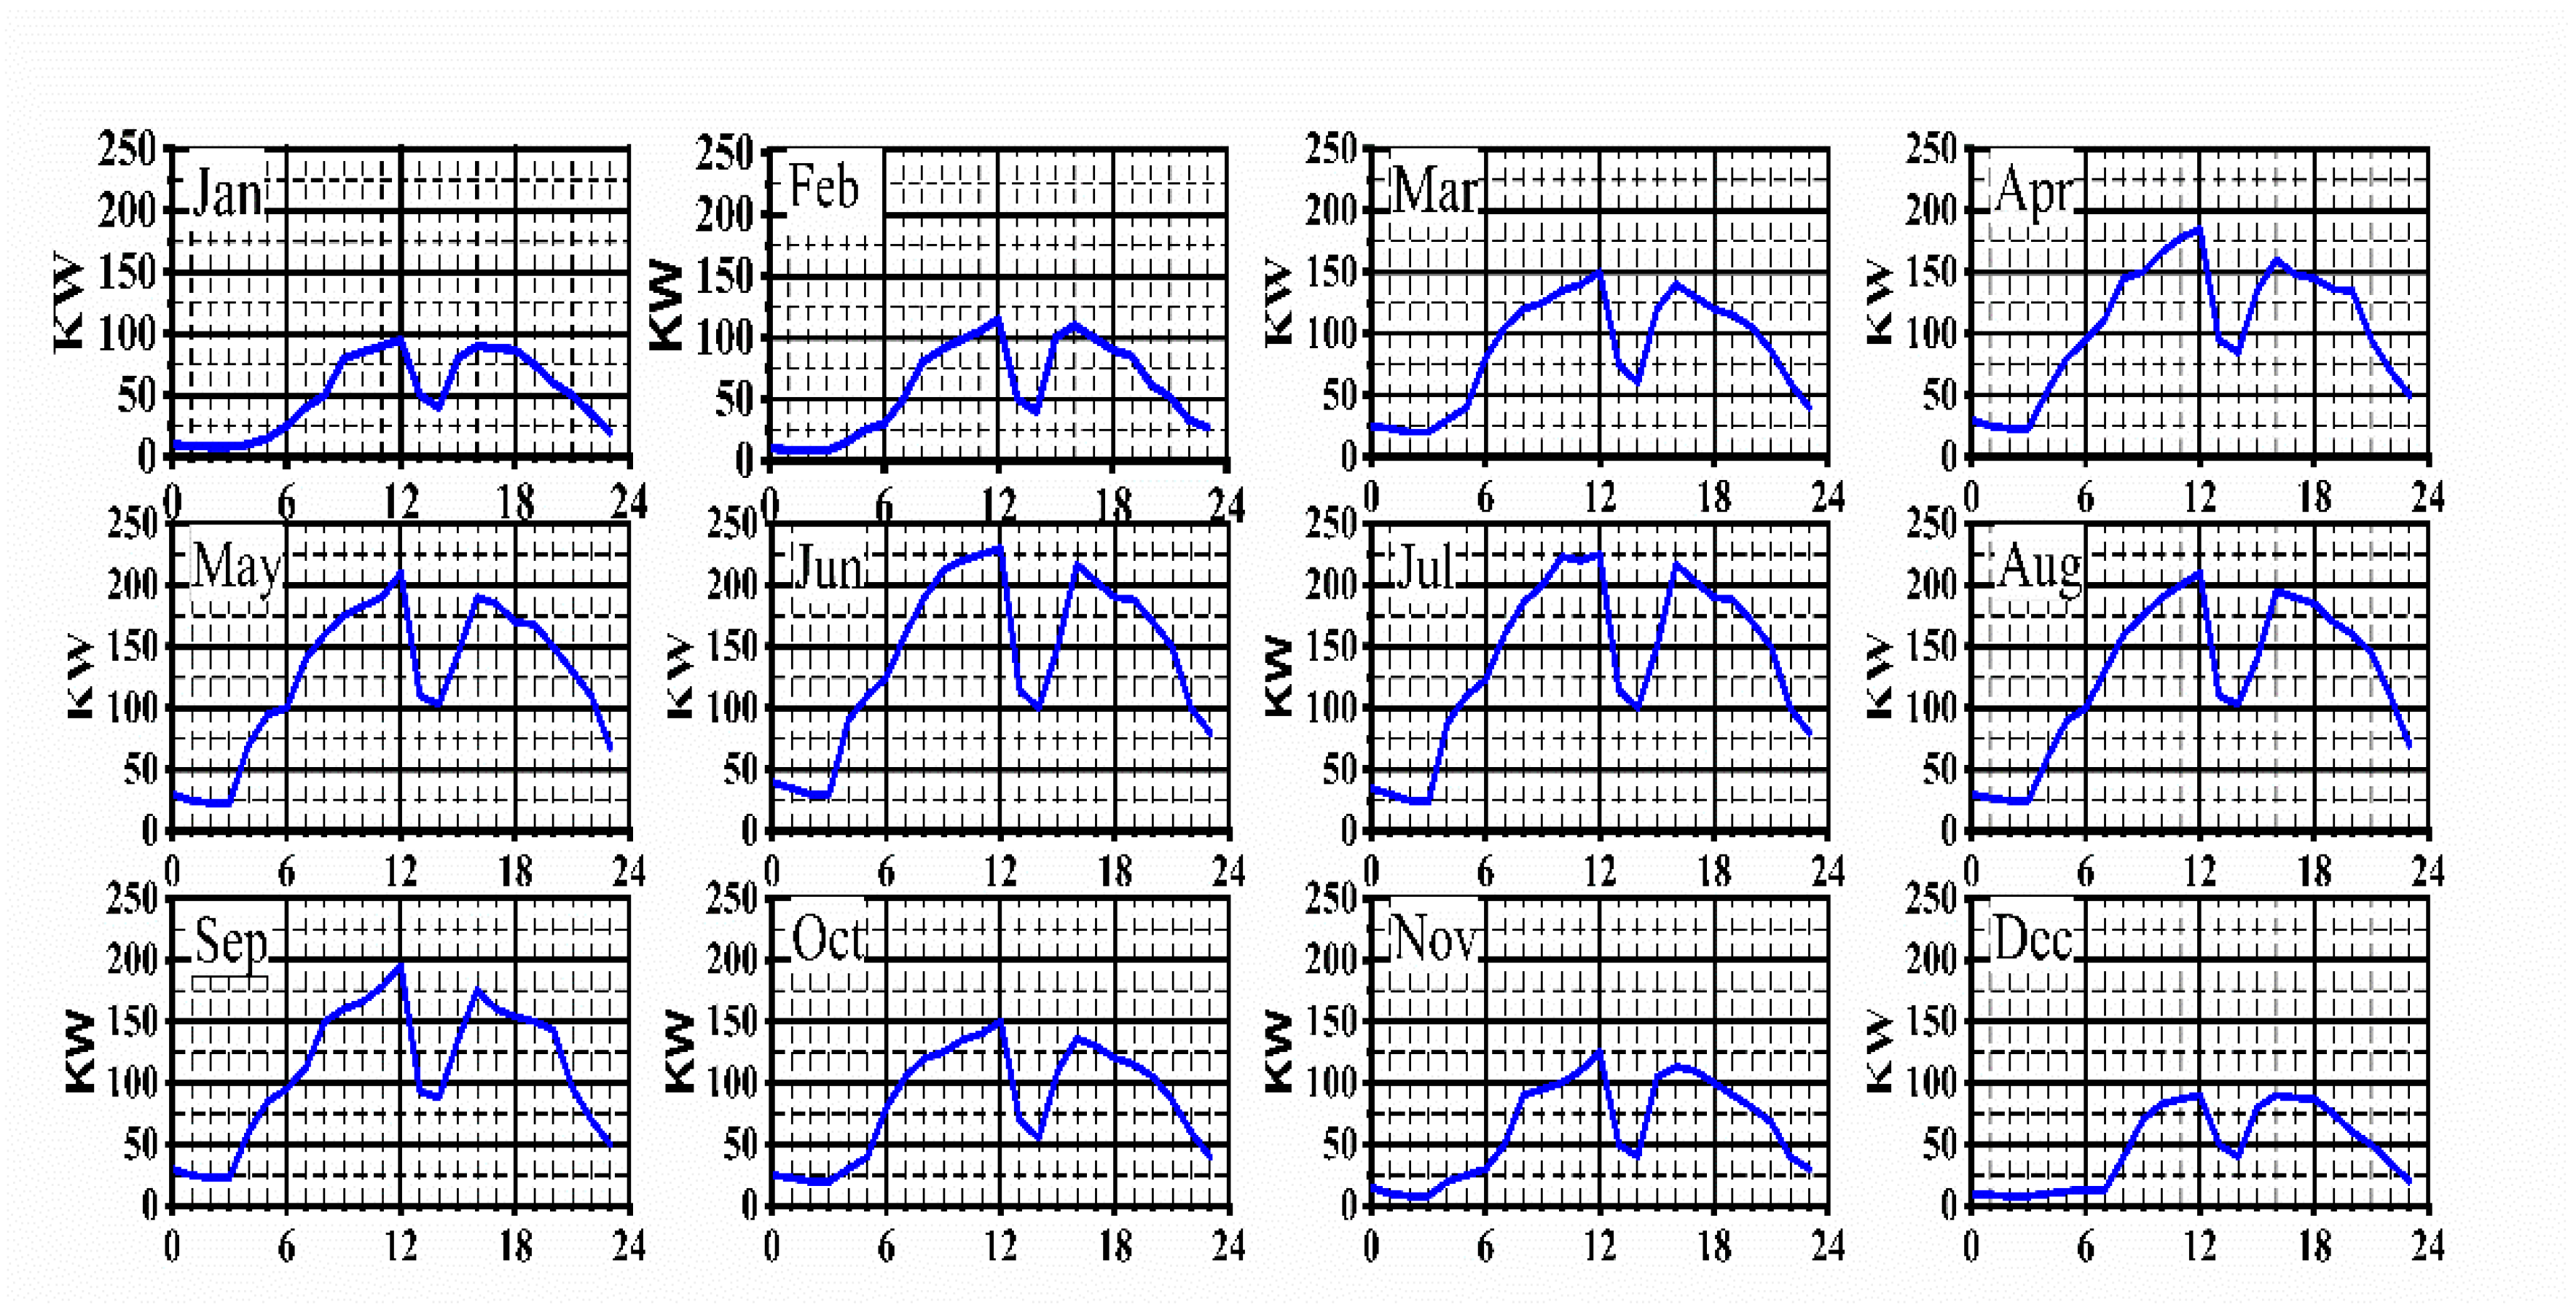
3.3. Load Data
3.4. Homer Pro Software
4. Results and Discussion
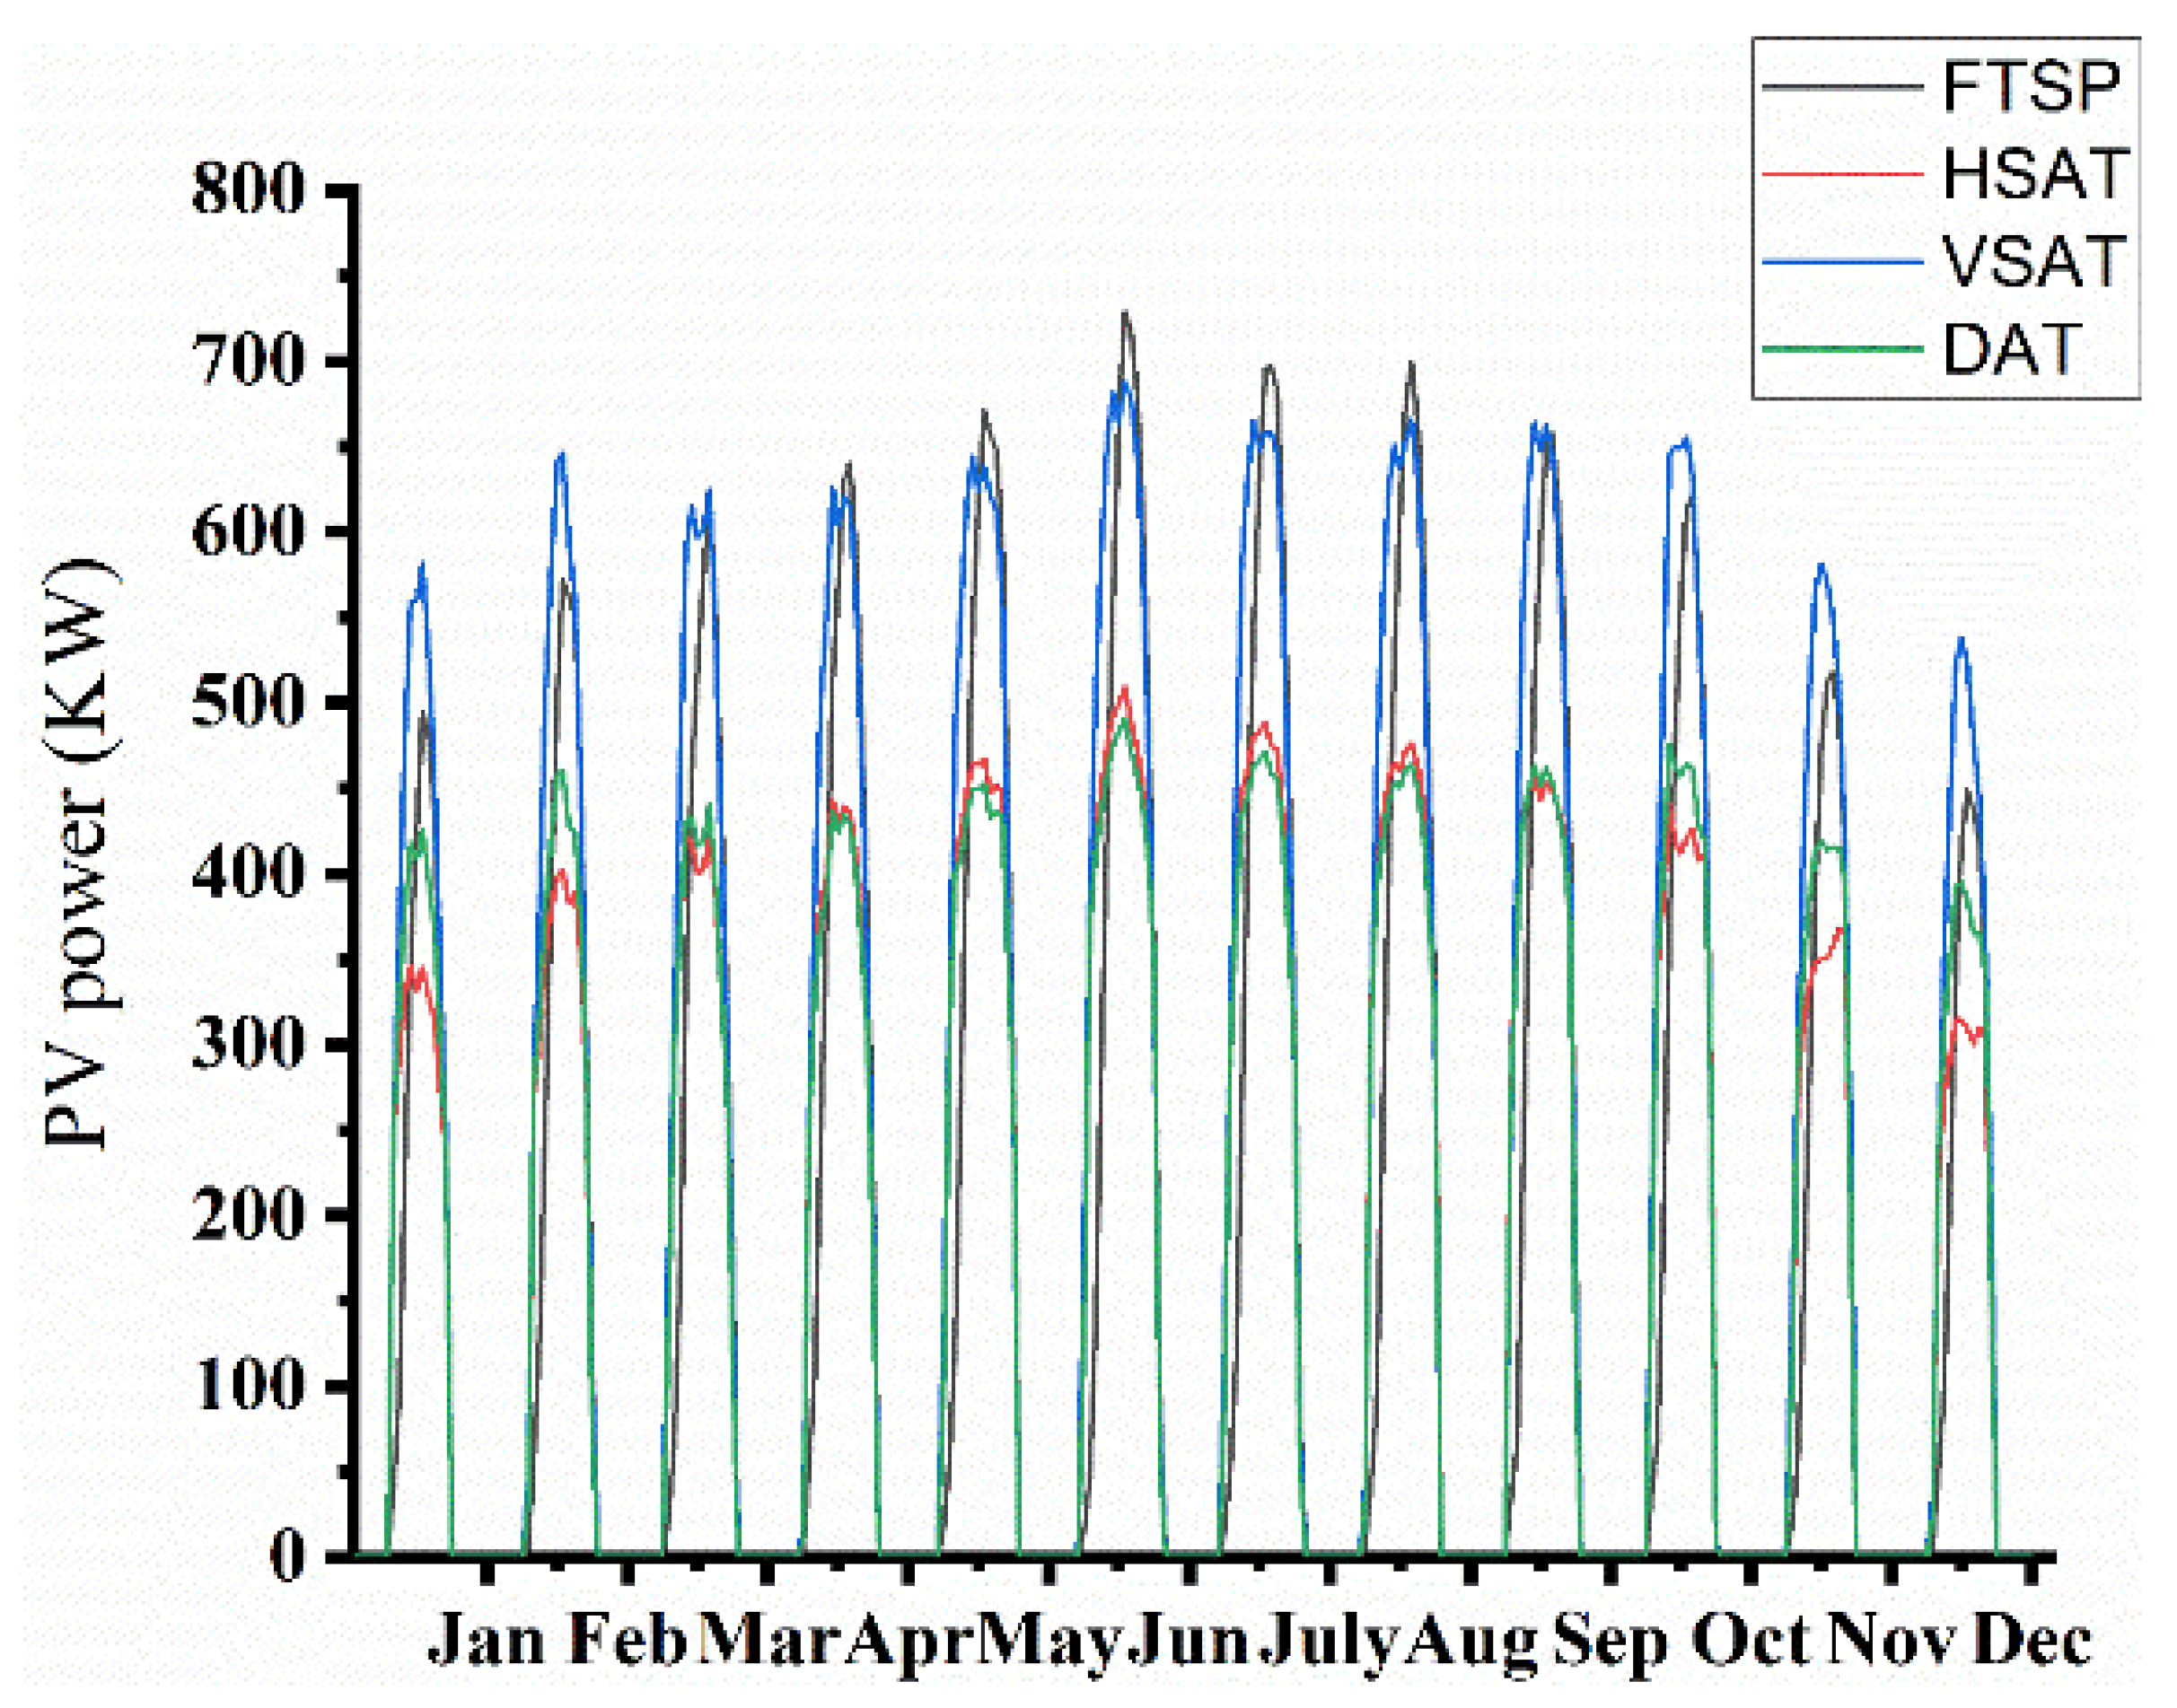
4.1. Comparison of Various PV Tracking Techniques on the Technical Aspect
4.2. Comparison of Various PV Tracking Techniques on the Economic Aspect
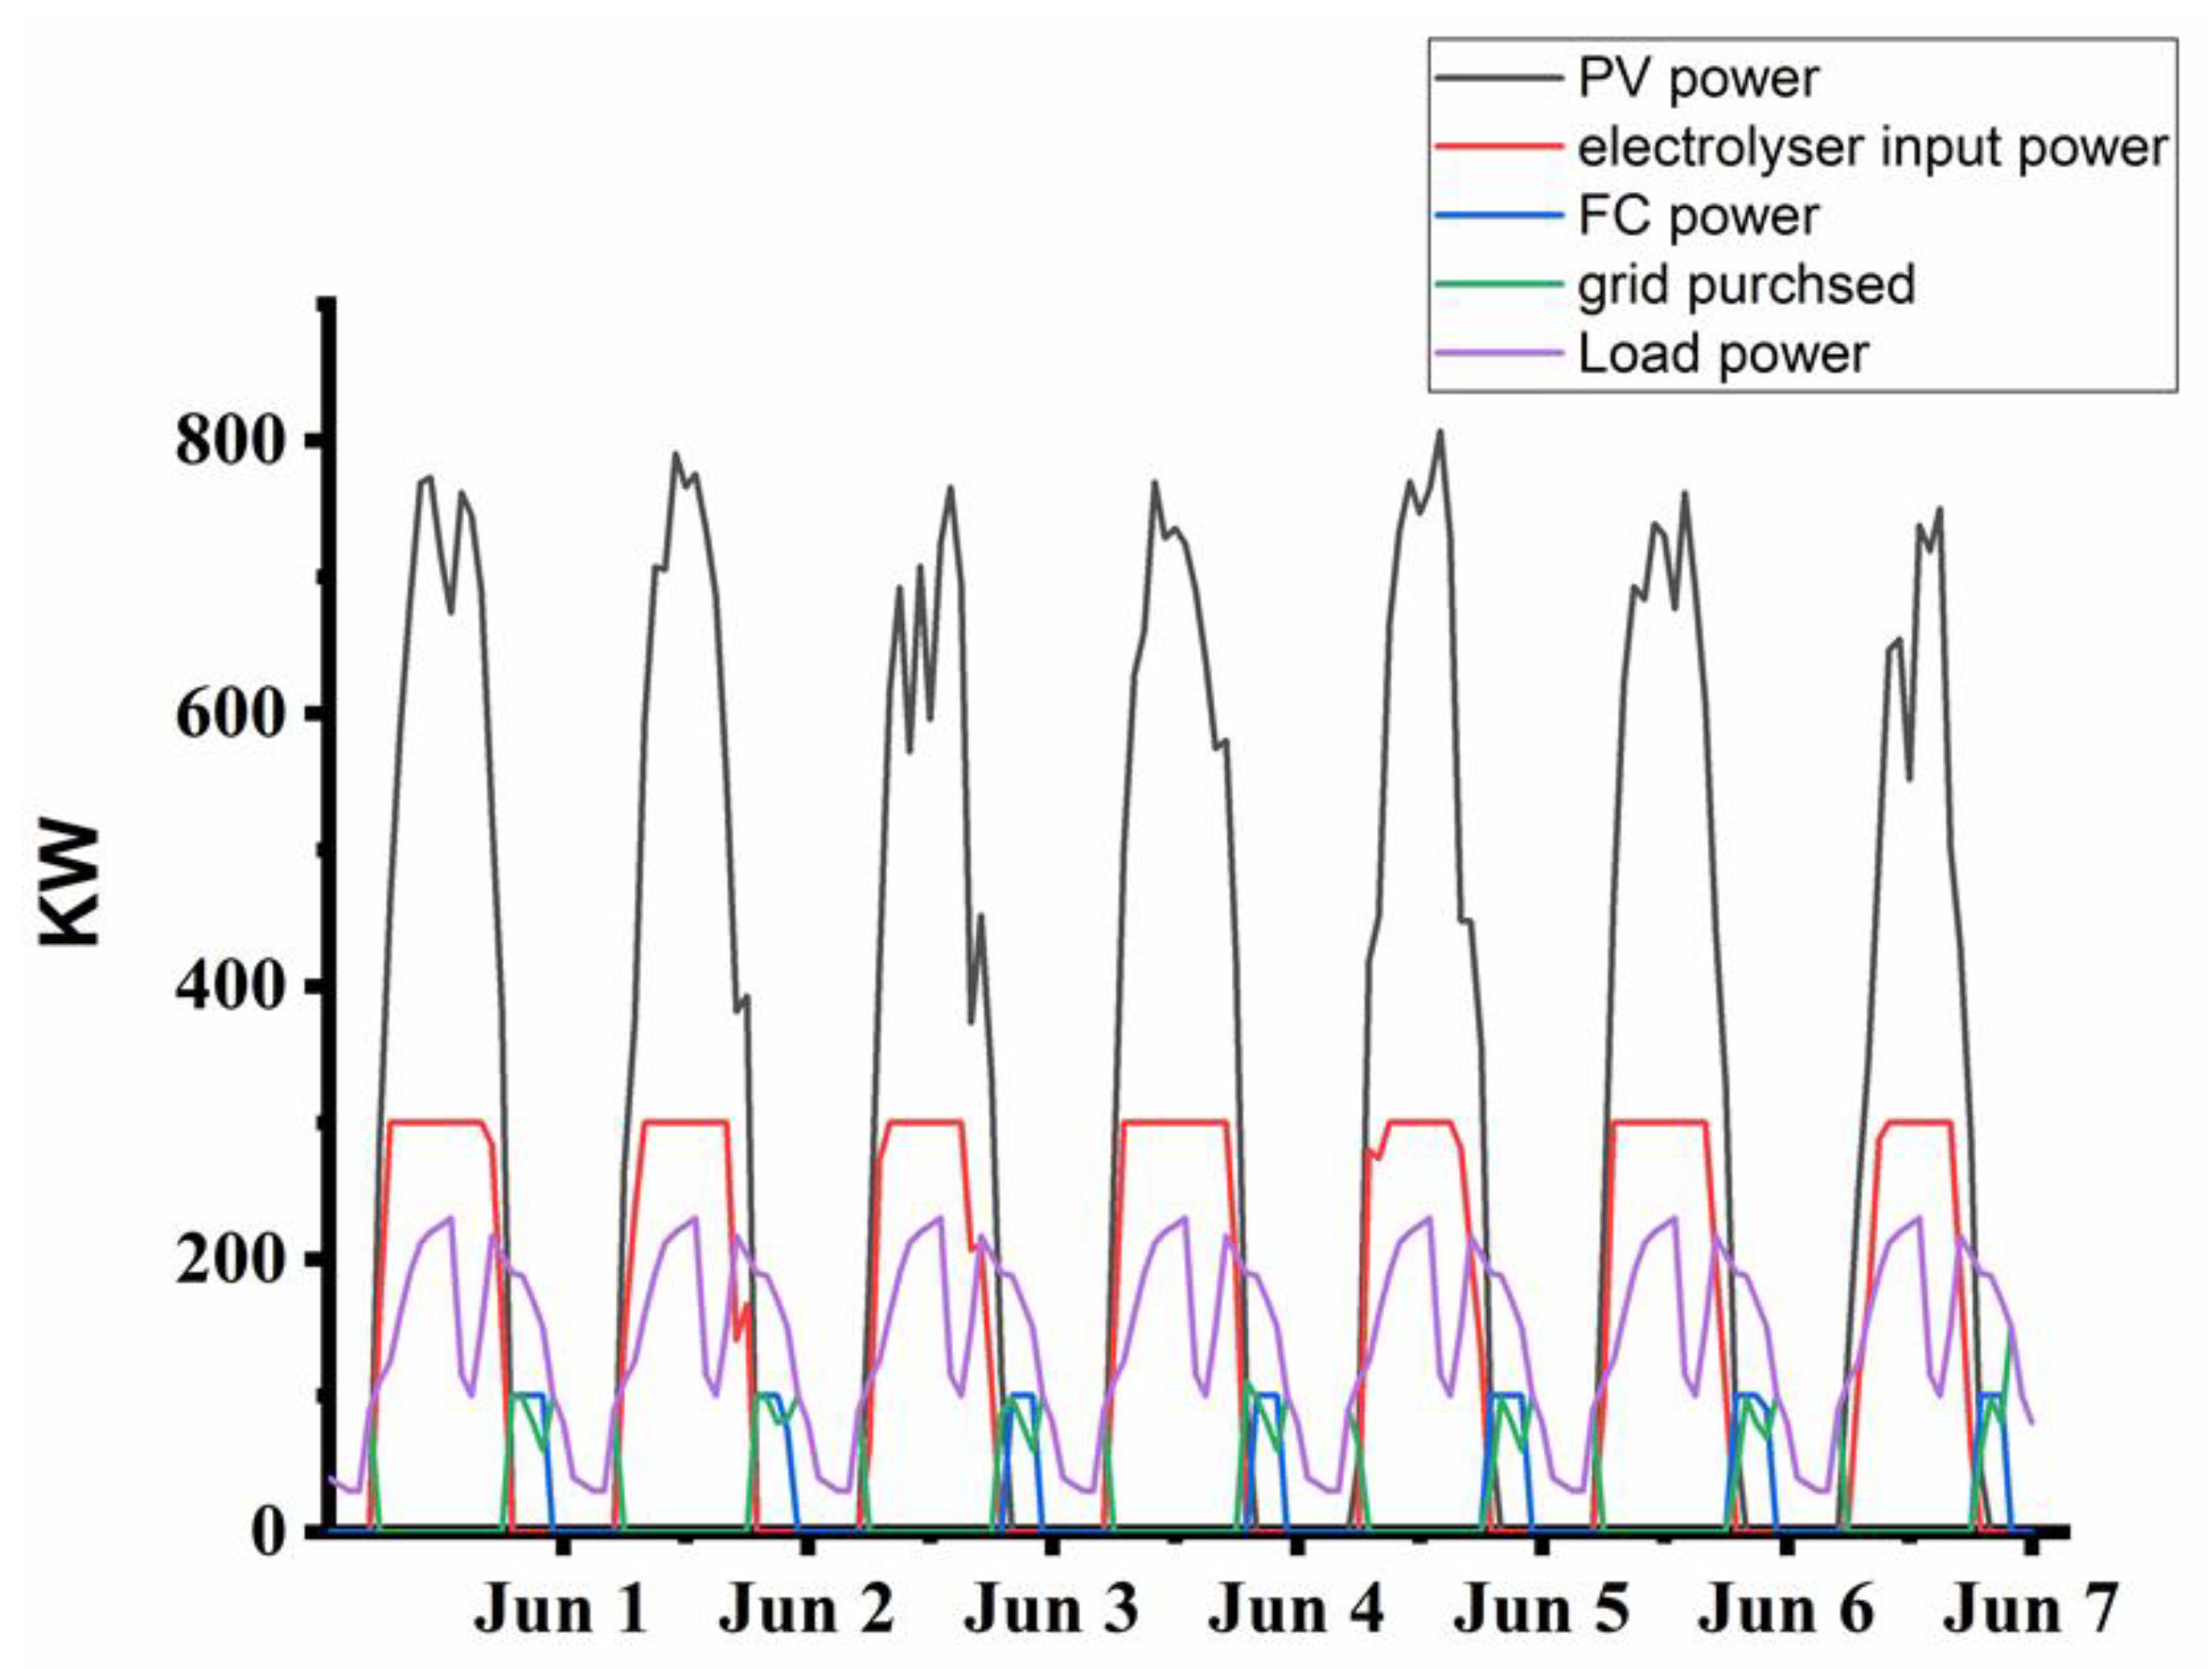
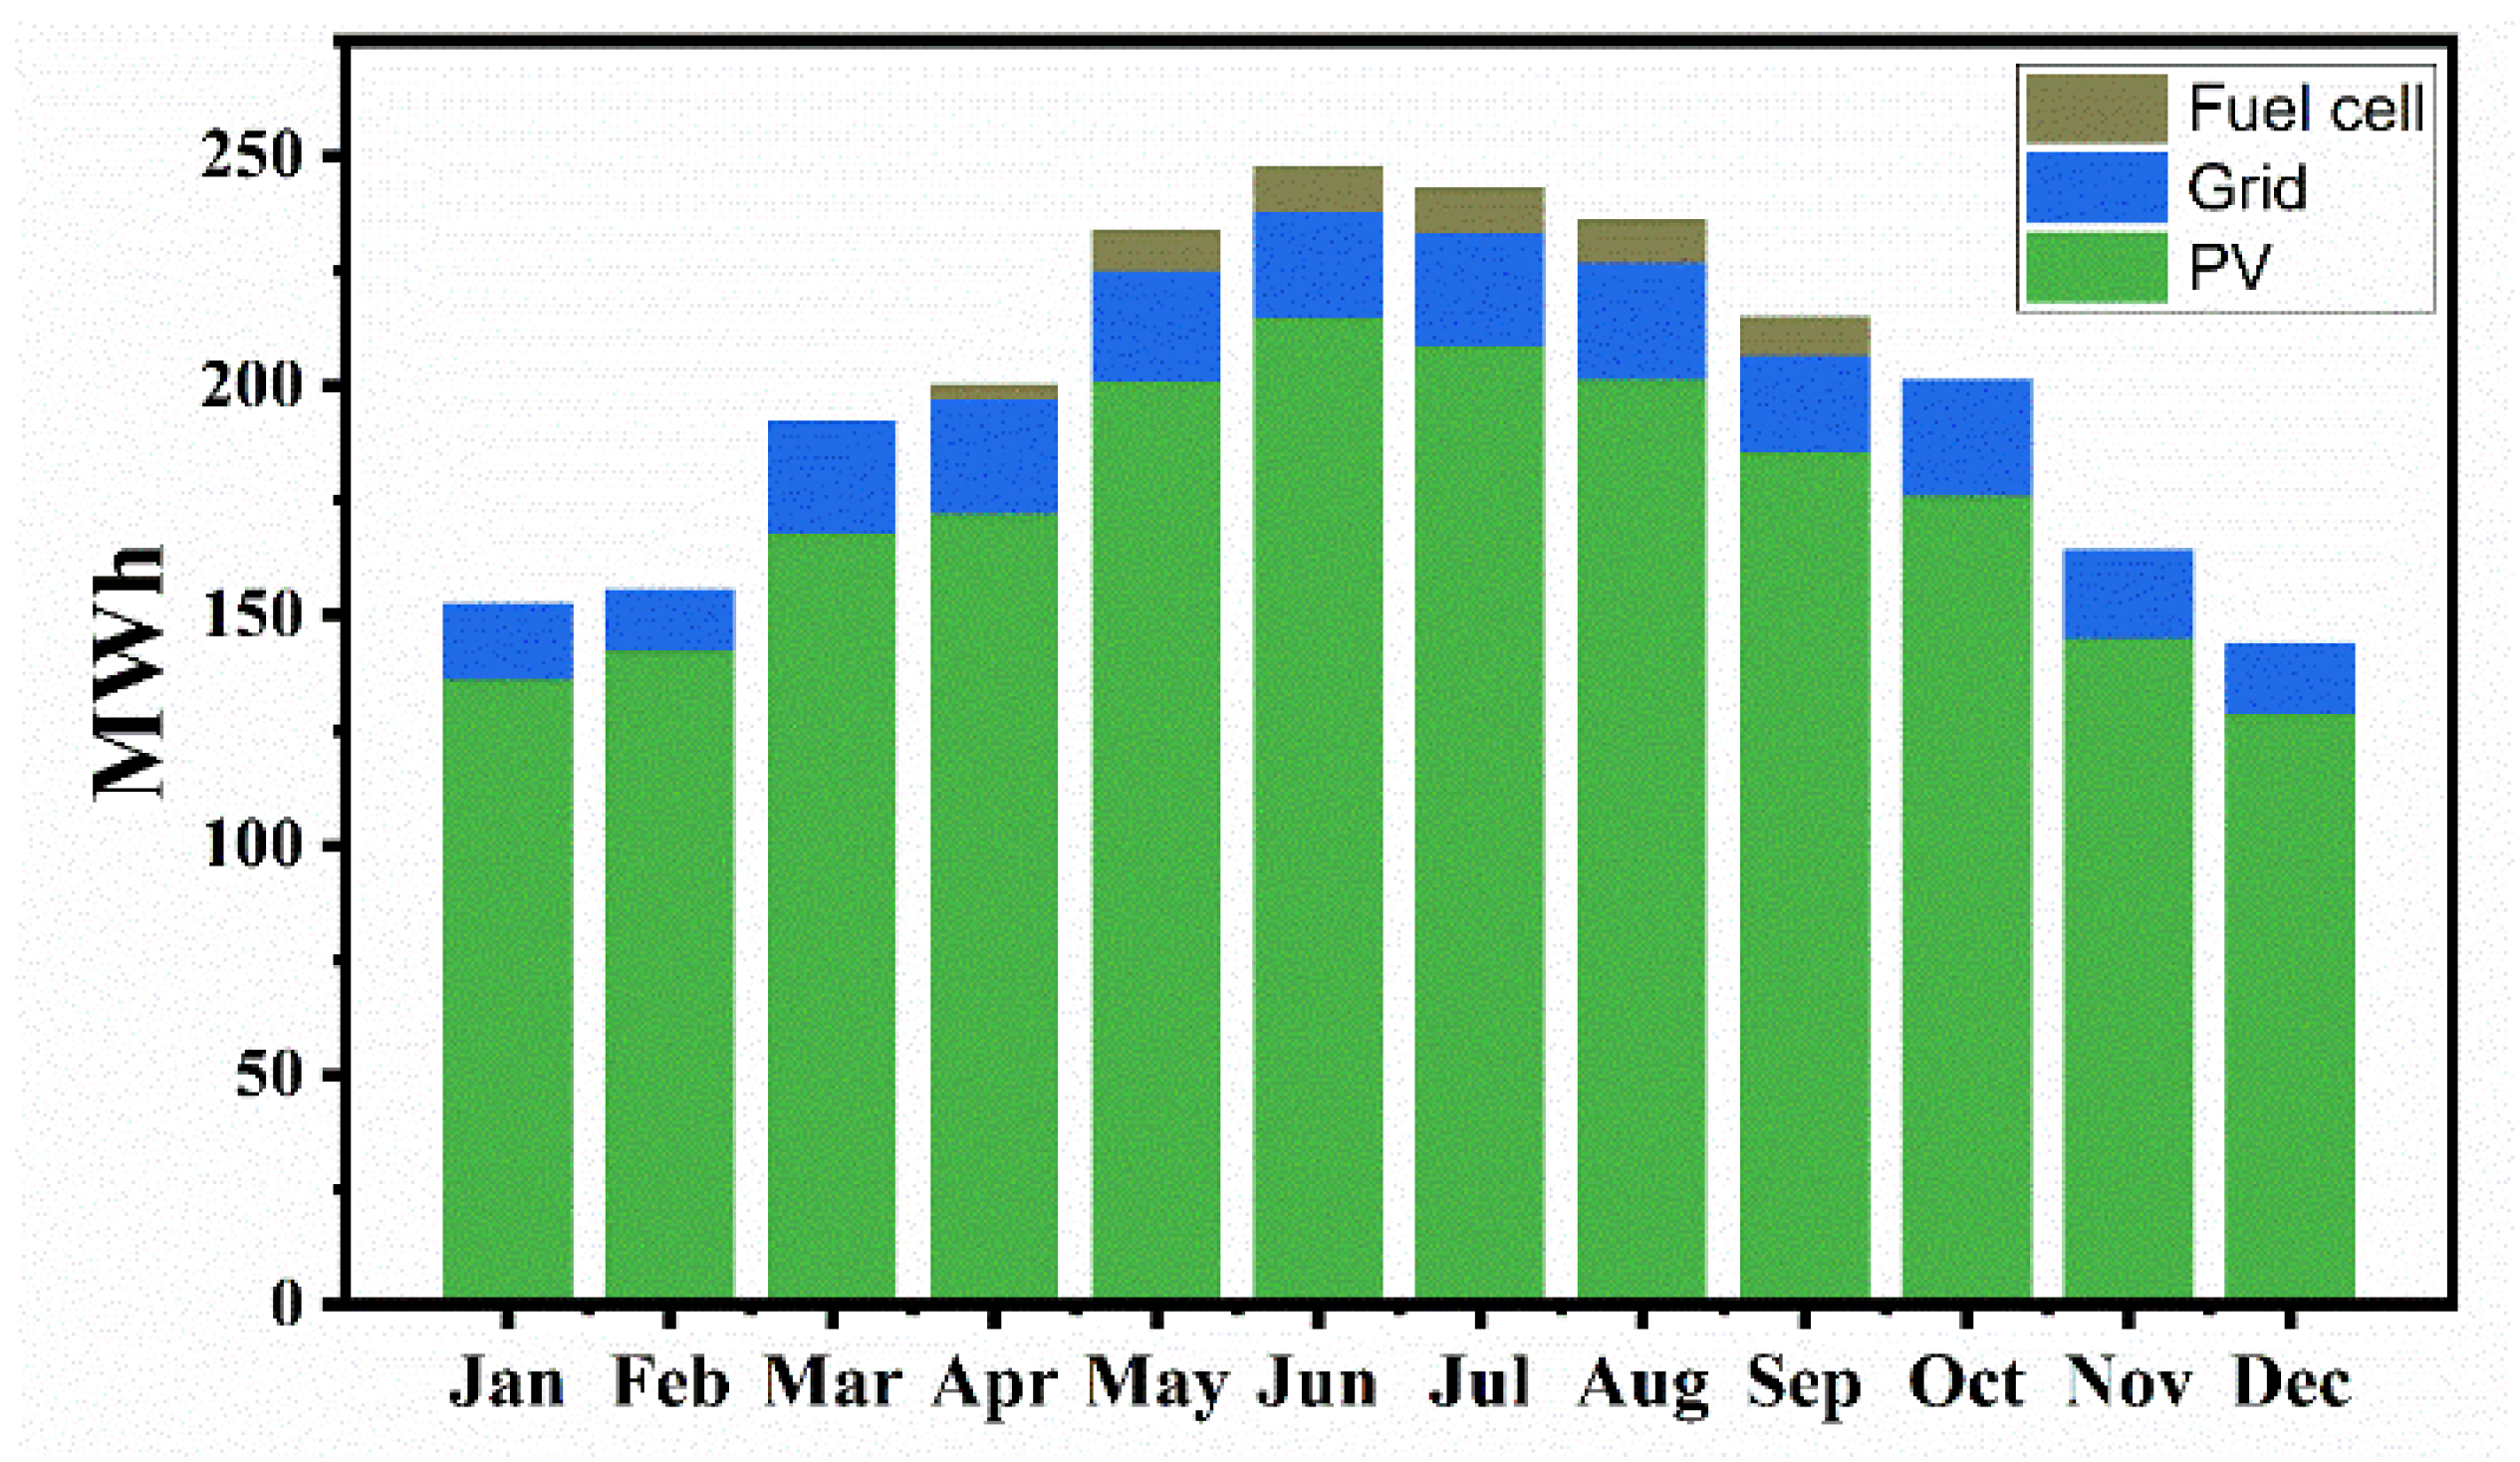
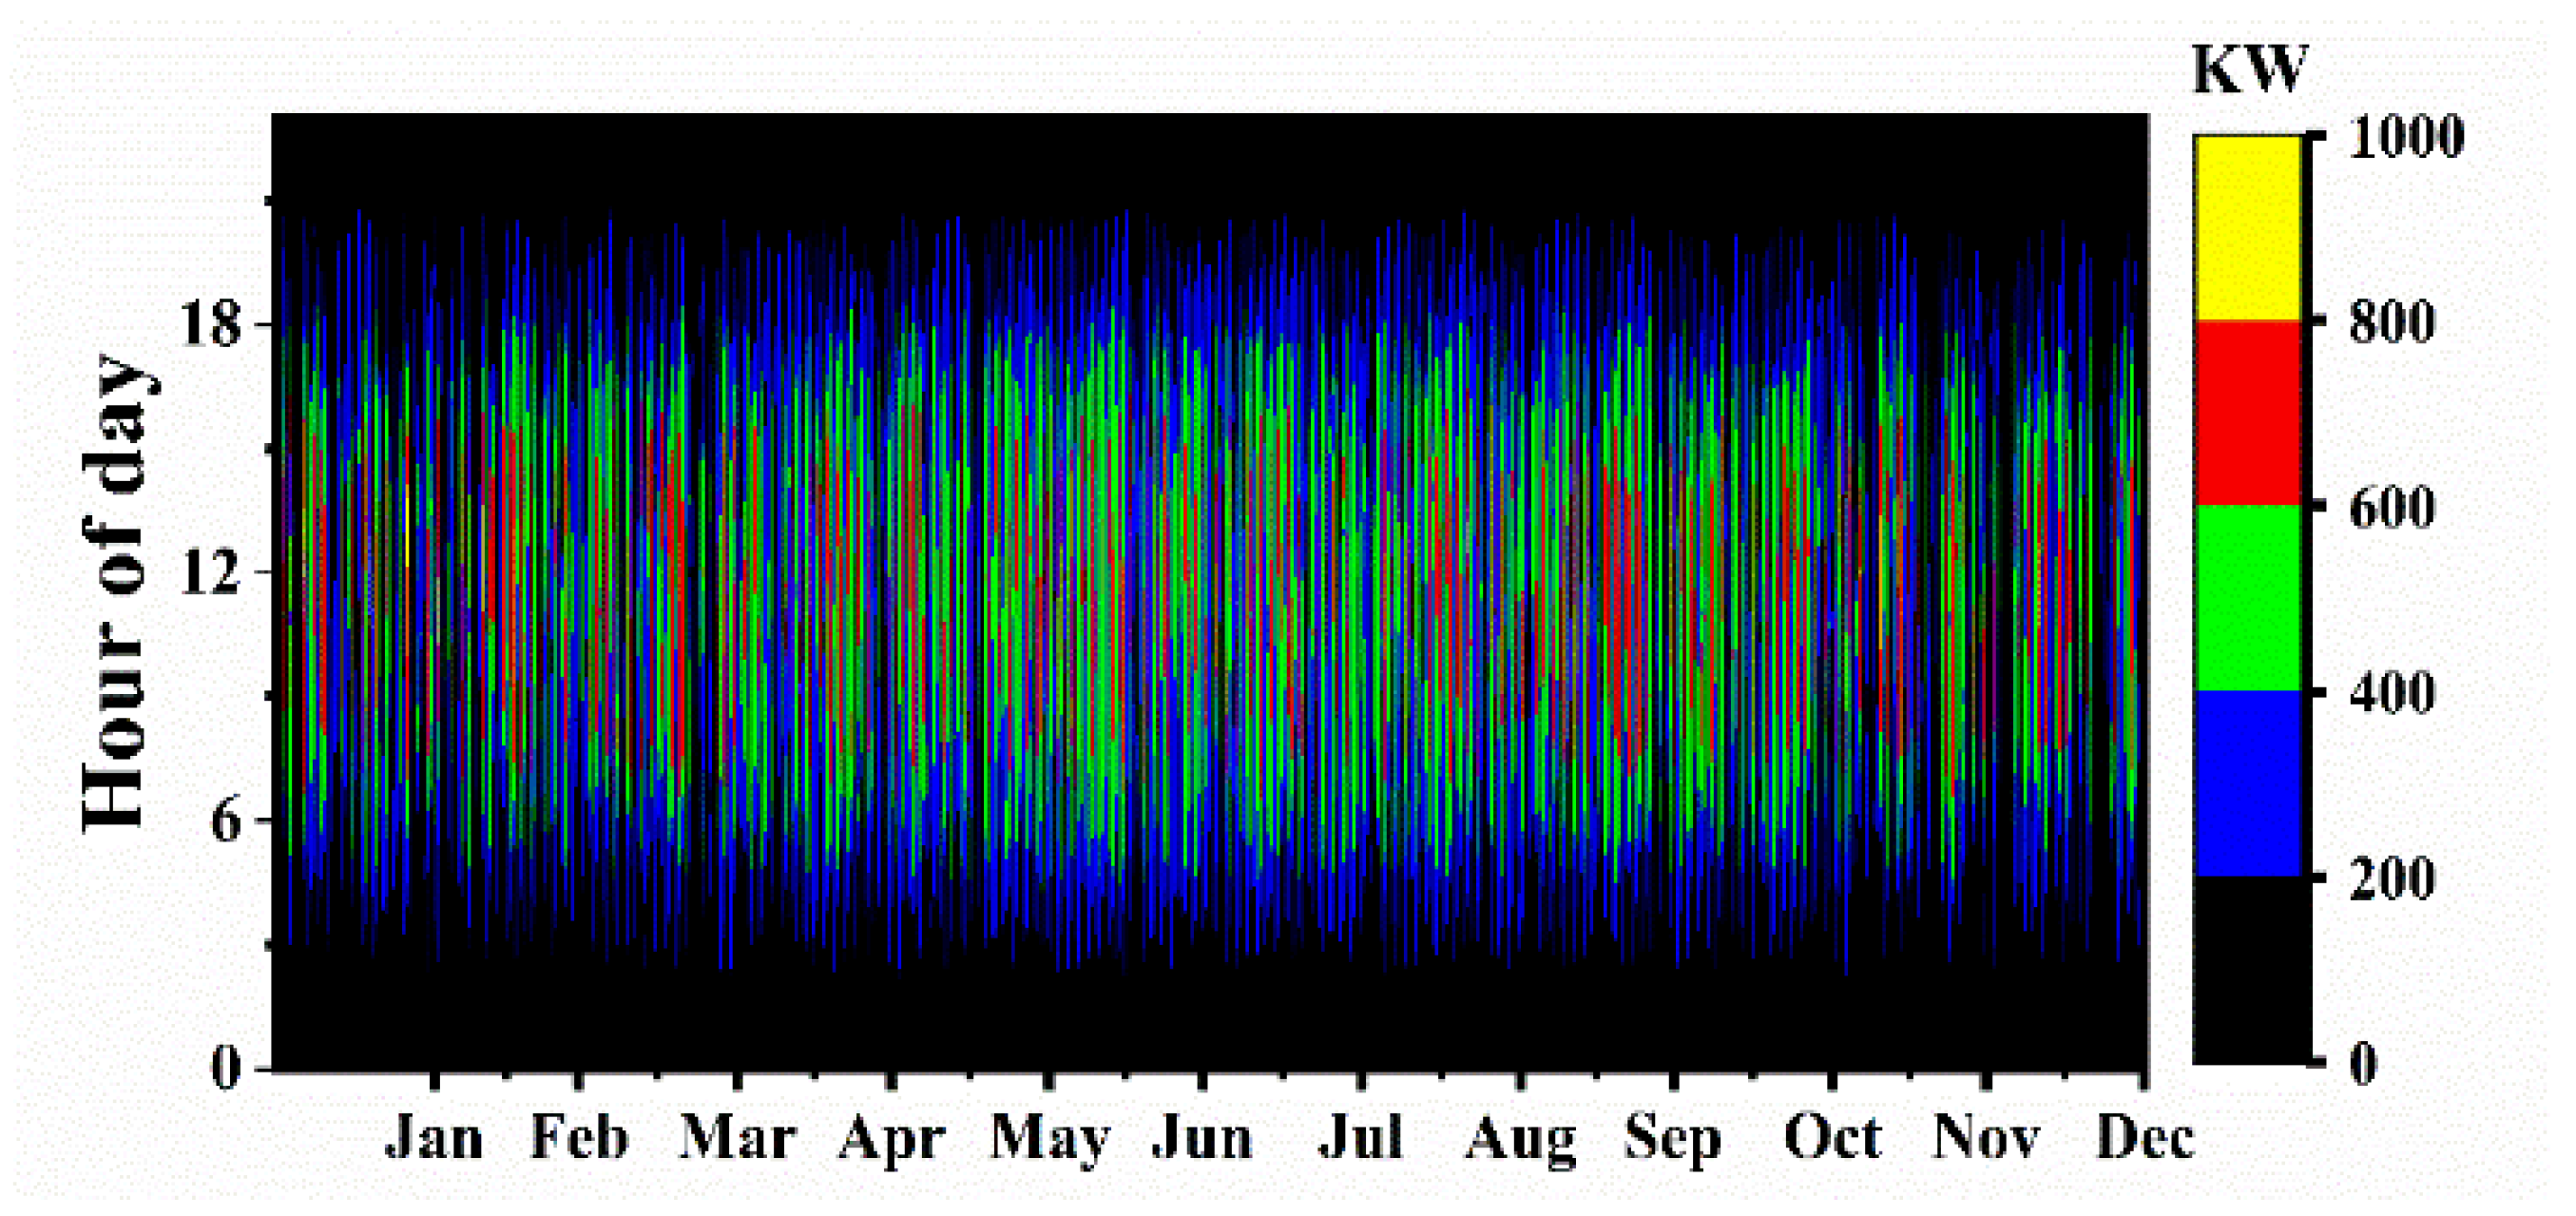
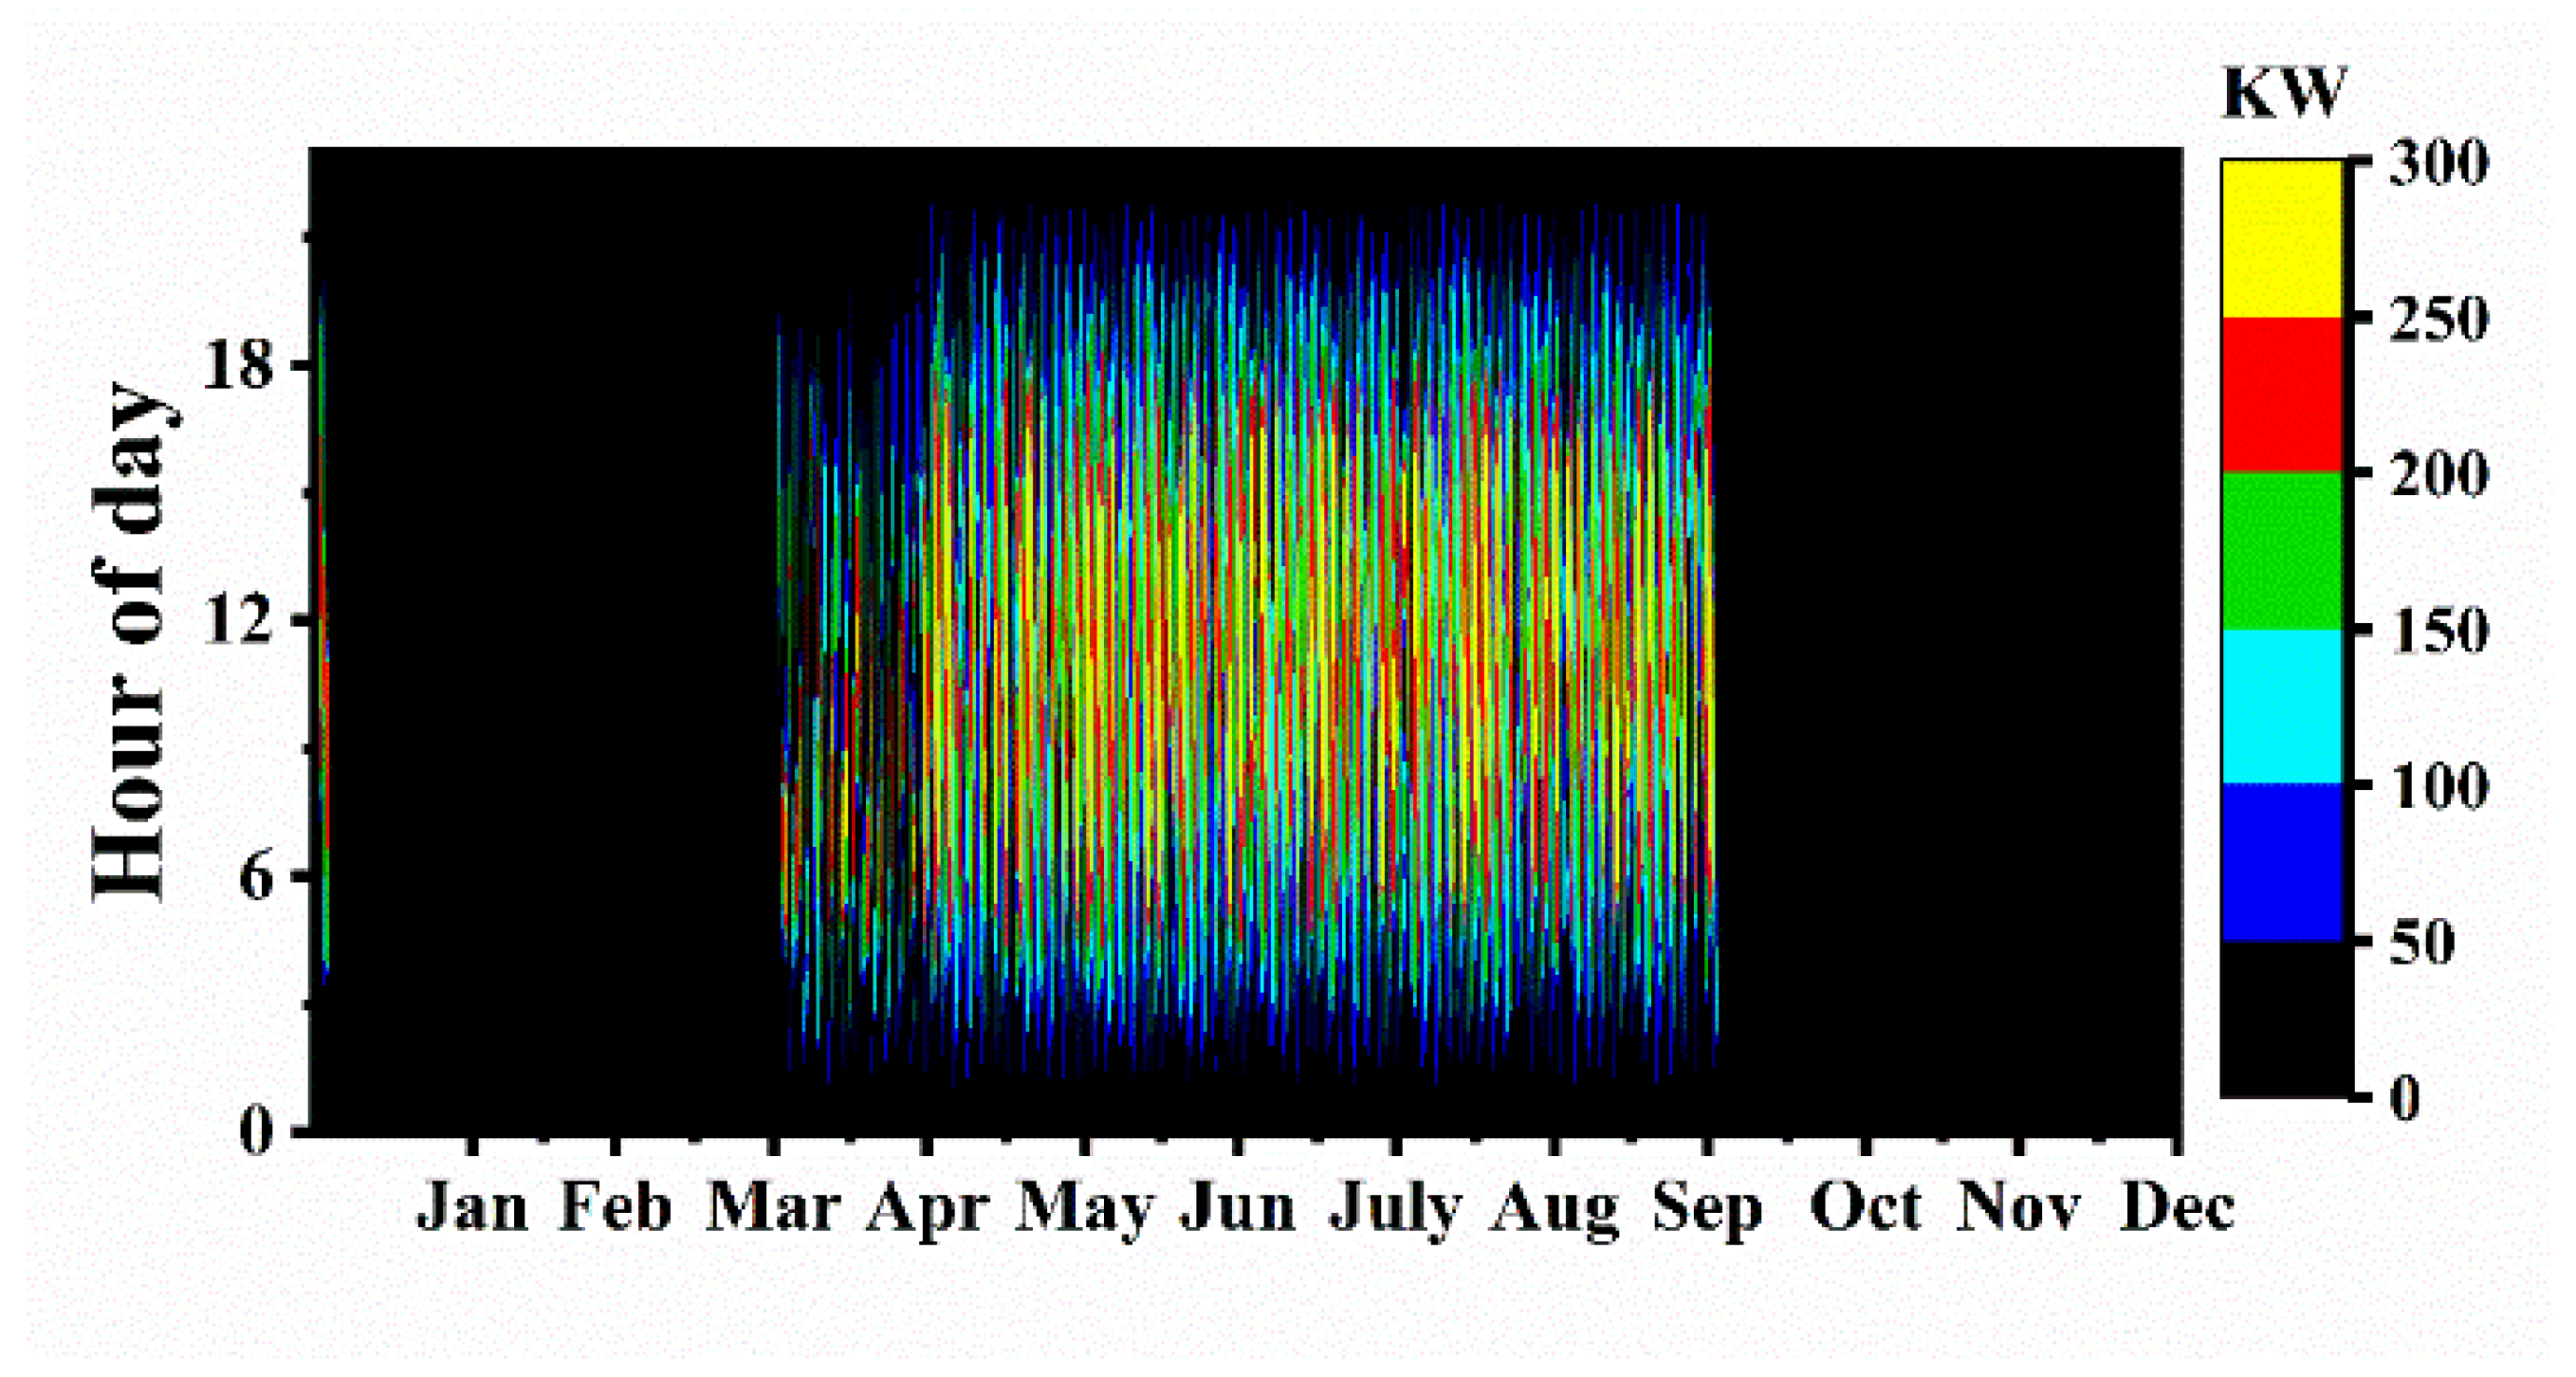
4.3. Operation Status of the Optimal Grid-Connected Hybrid Energy System (PV-FC) with the Best PV Tracking Technique
5. Conclusions
- (1)
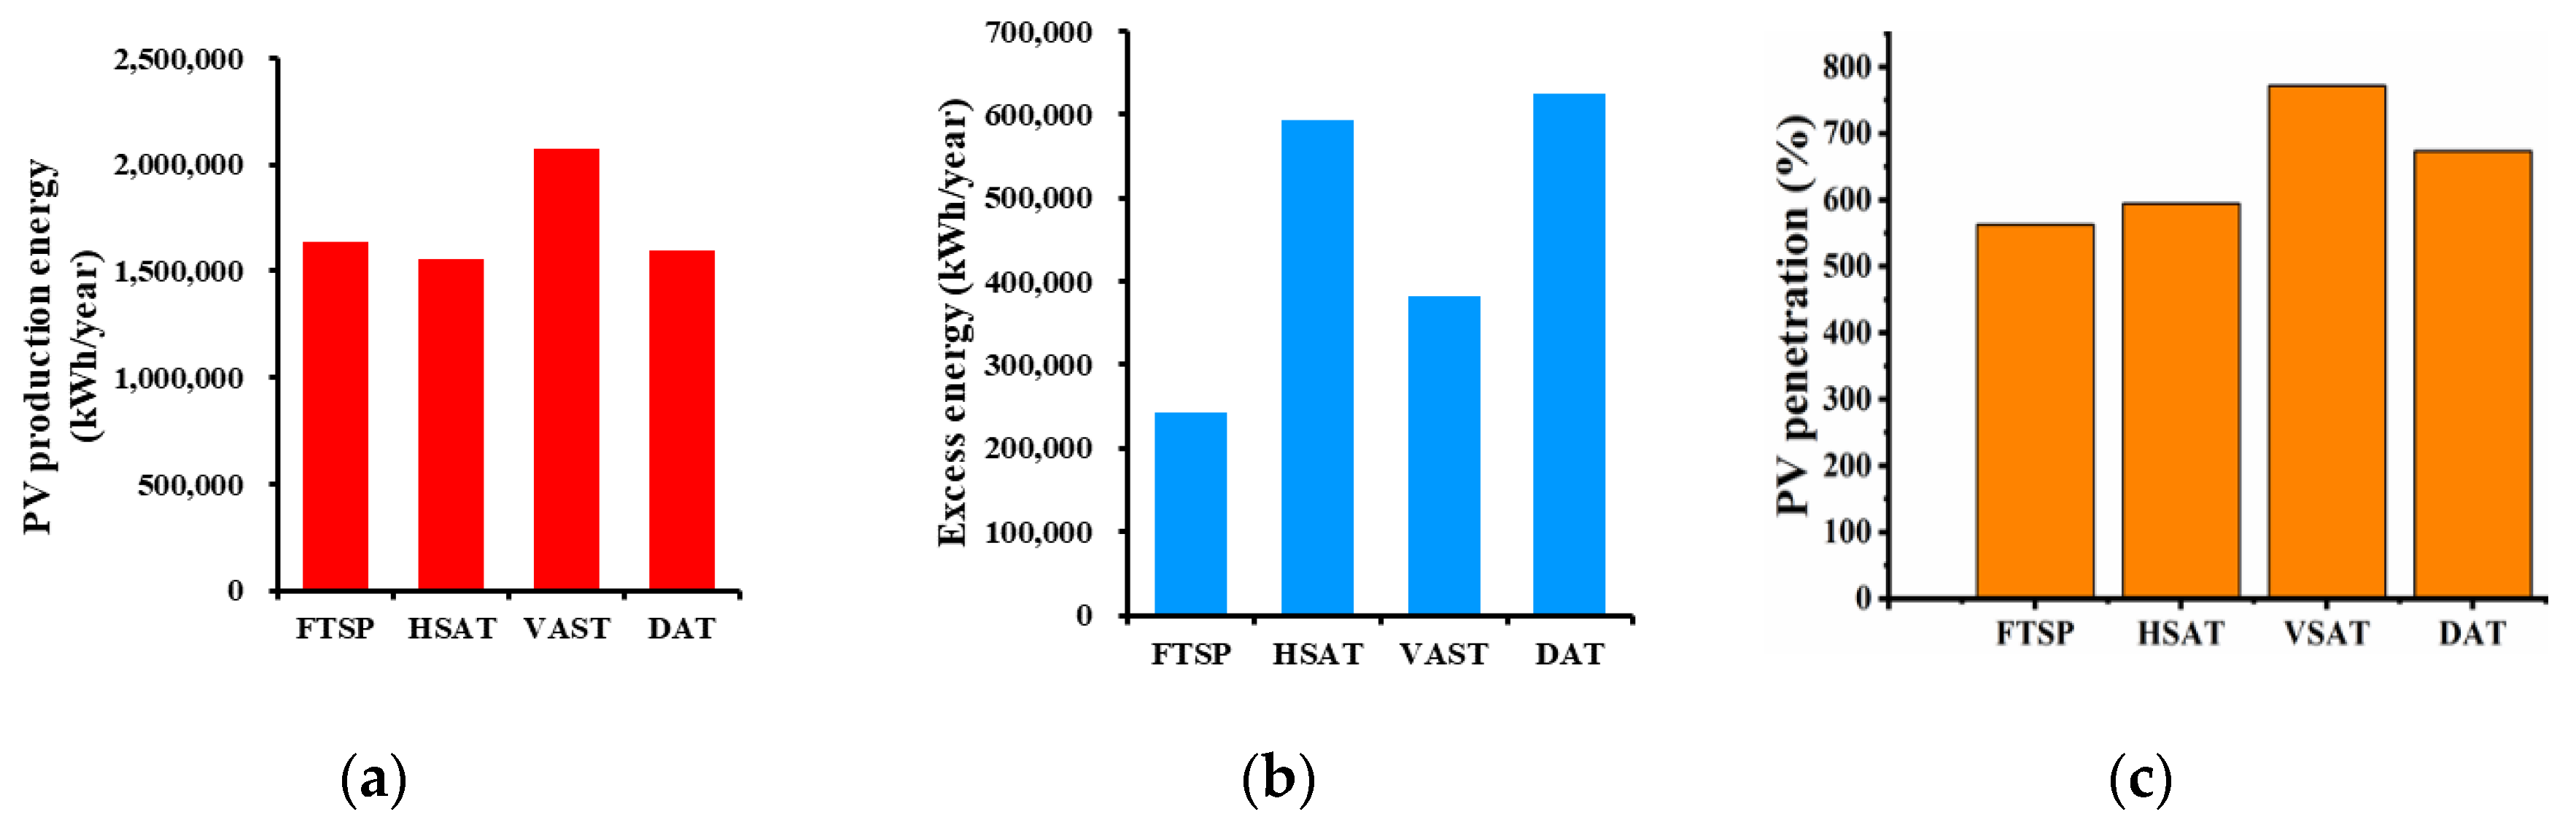
- In terms of yearly energy production, the result found that the VSAT was superior in production of the highest power, following by FTSP, DAT and HSAT, respectively.
- (2)
- In terms of PV penetration, the result demonstrates that VSAT recorded 772% higher PV penetration of solar energy to the grid, followed by DAT, HSAT, and FTSP, which recorded 674%, 595%, and 563%, respectively.
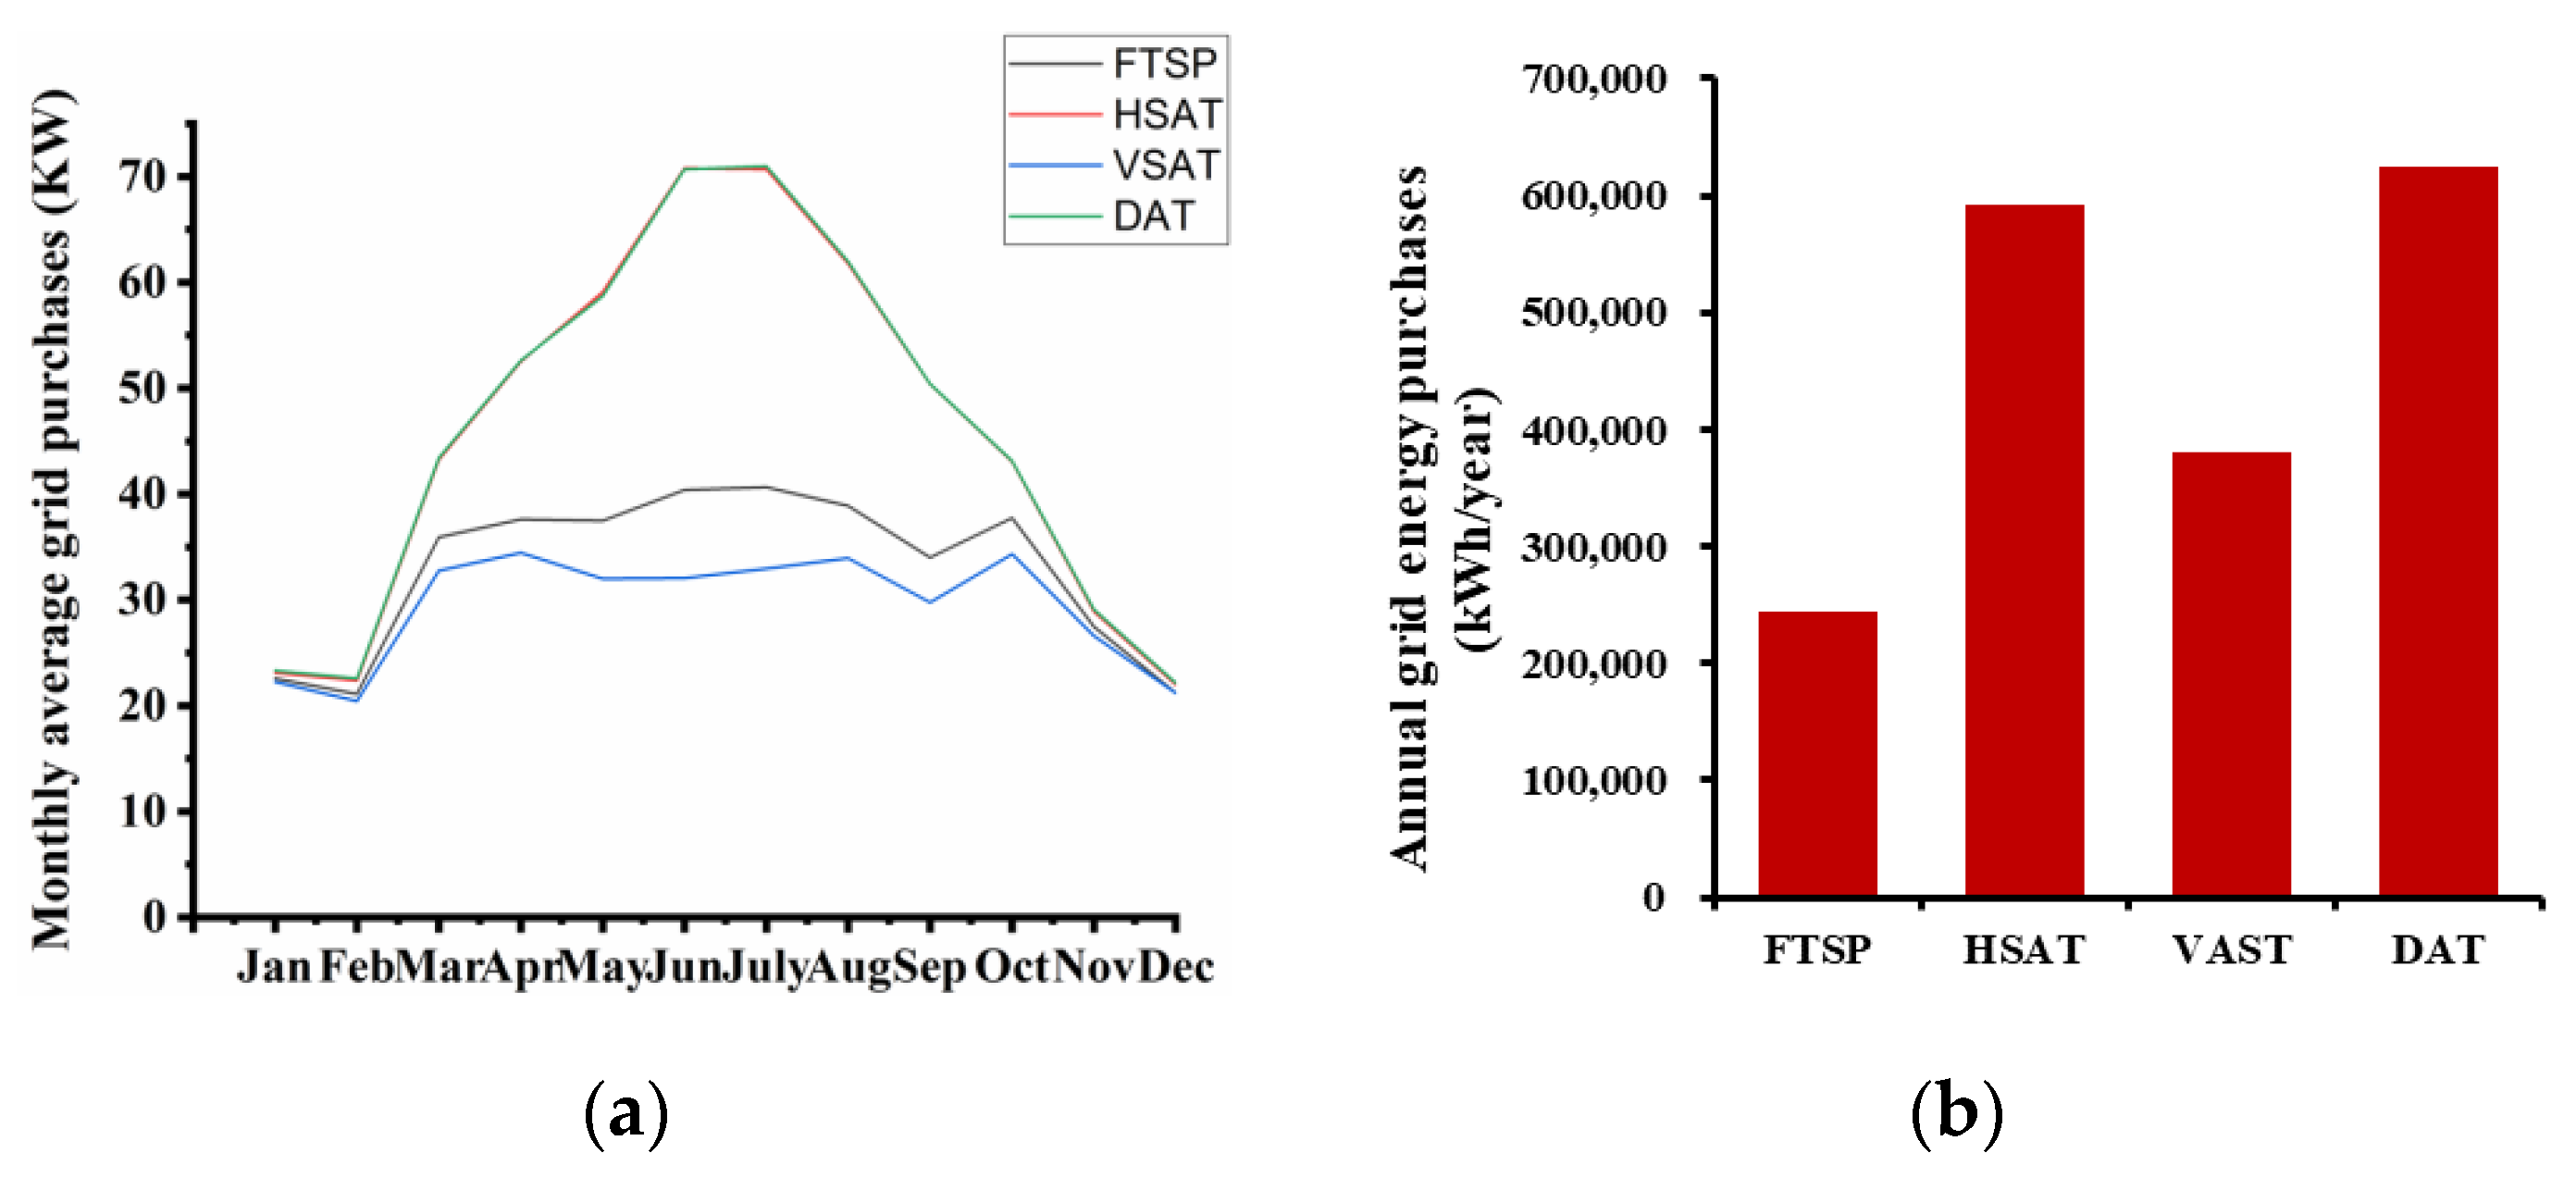
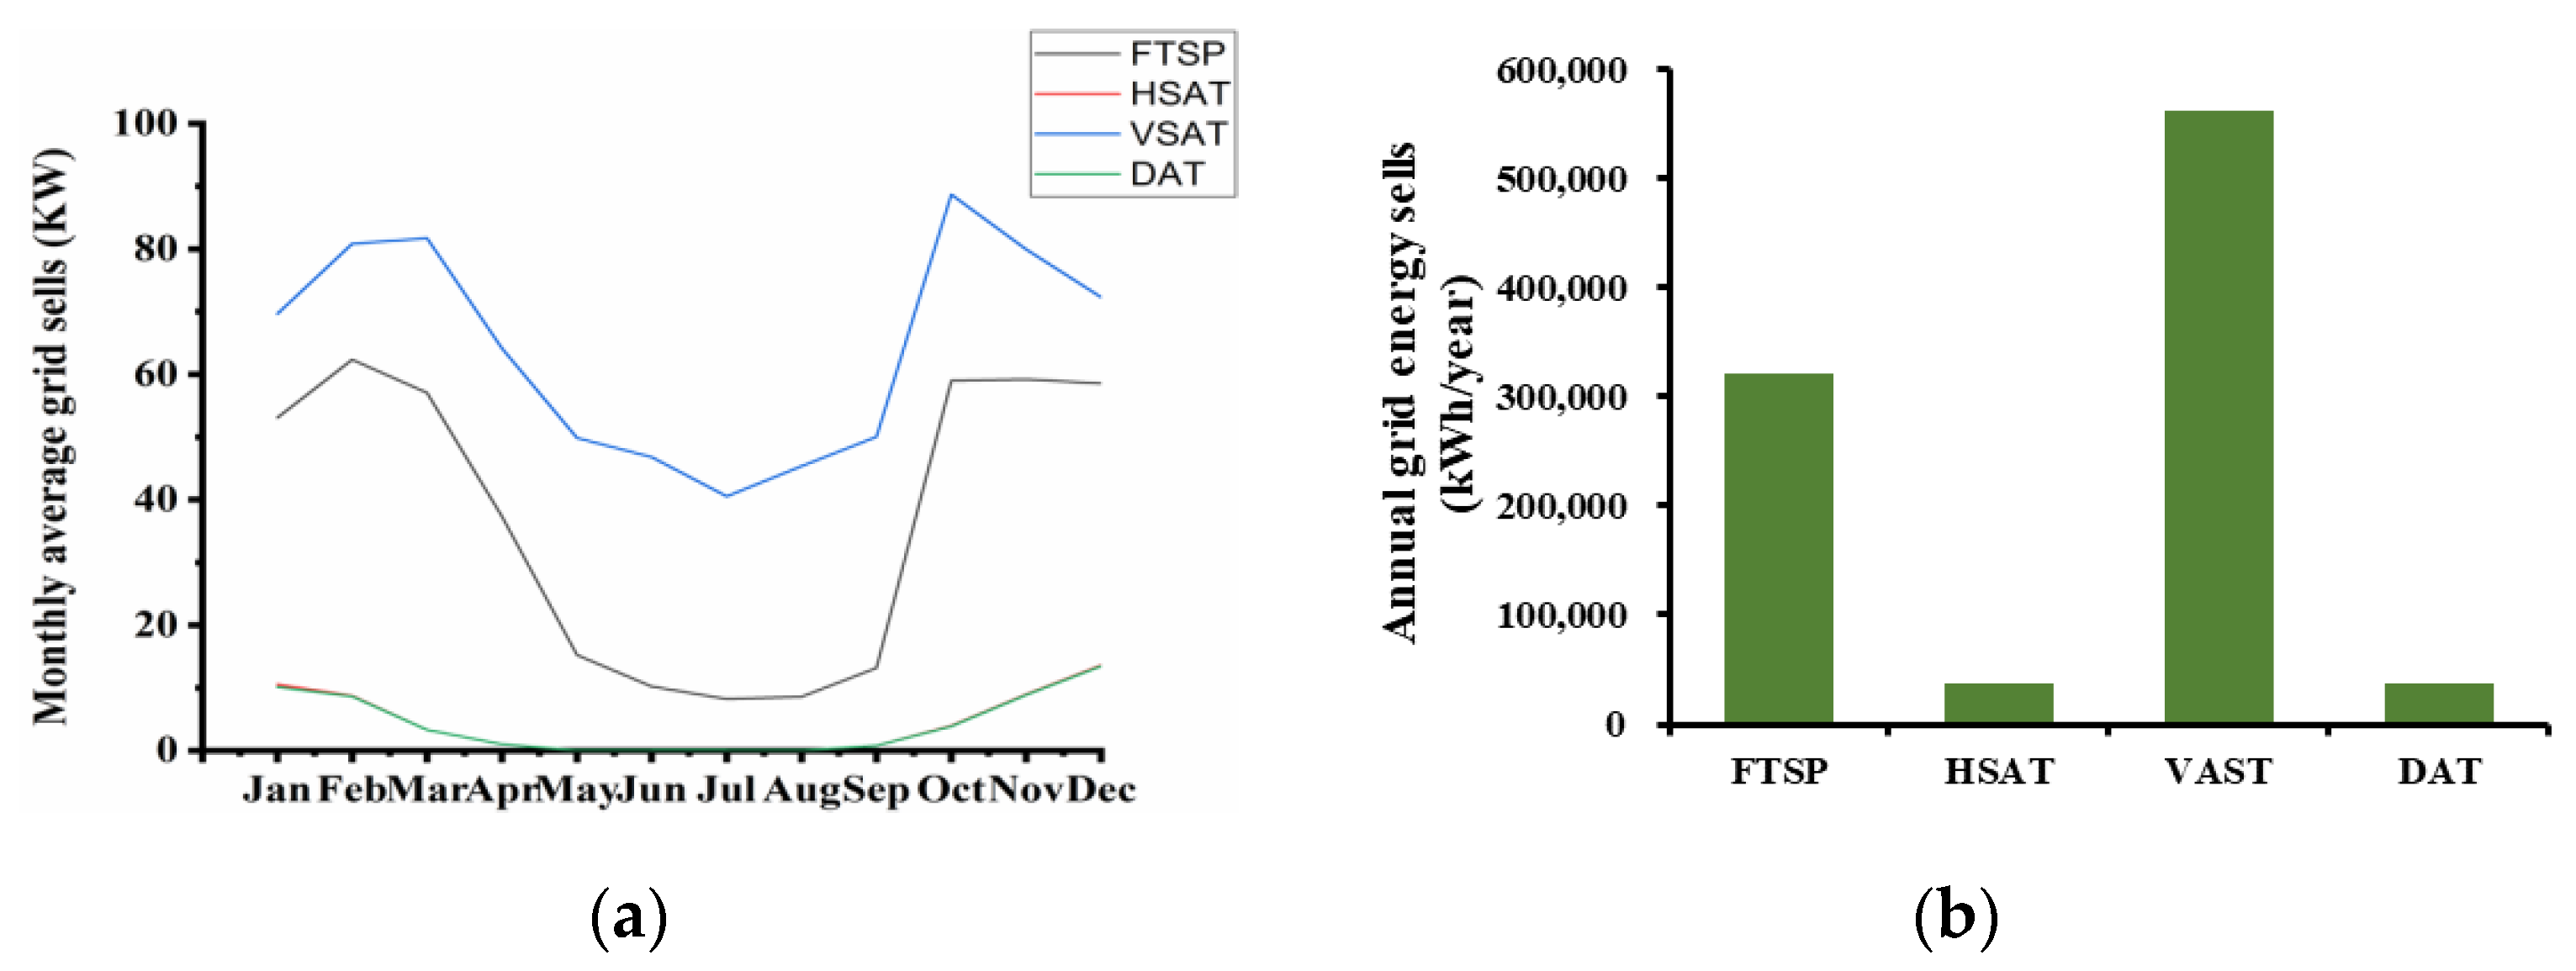
- (3)
- In terms of net purchased energy, VSAT showed the highest of energy sold to the grid than others. Taking the VSAT as the base case that achieved the lowest LCOE, the VSAT can decline 37.65%, 77.5%, and 86.5% of LCOE than FTSP, HSAT, and DAT, respectively.
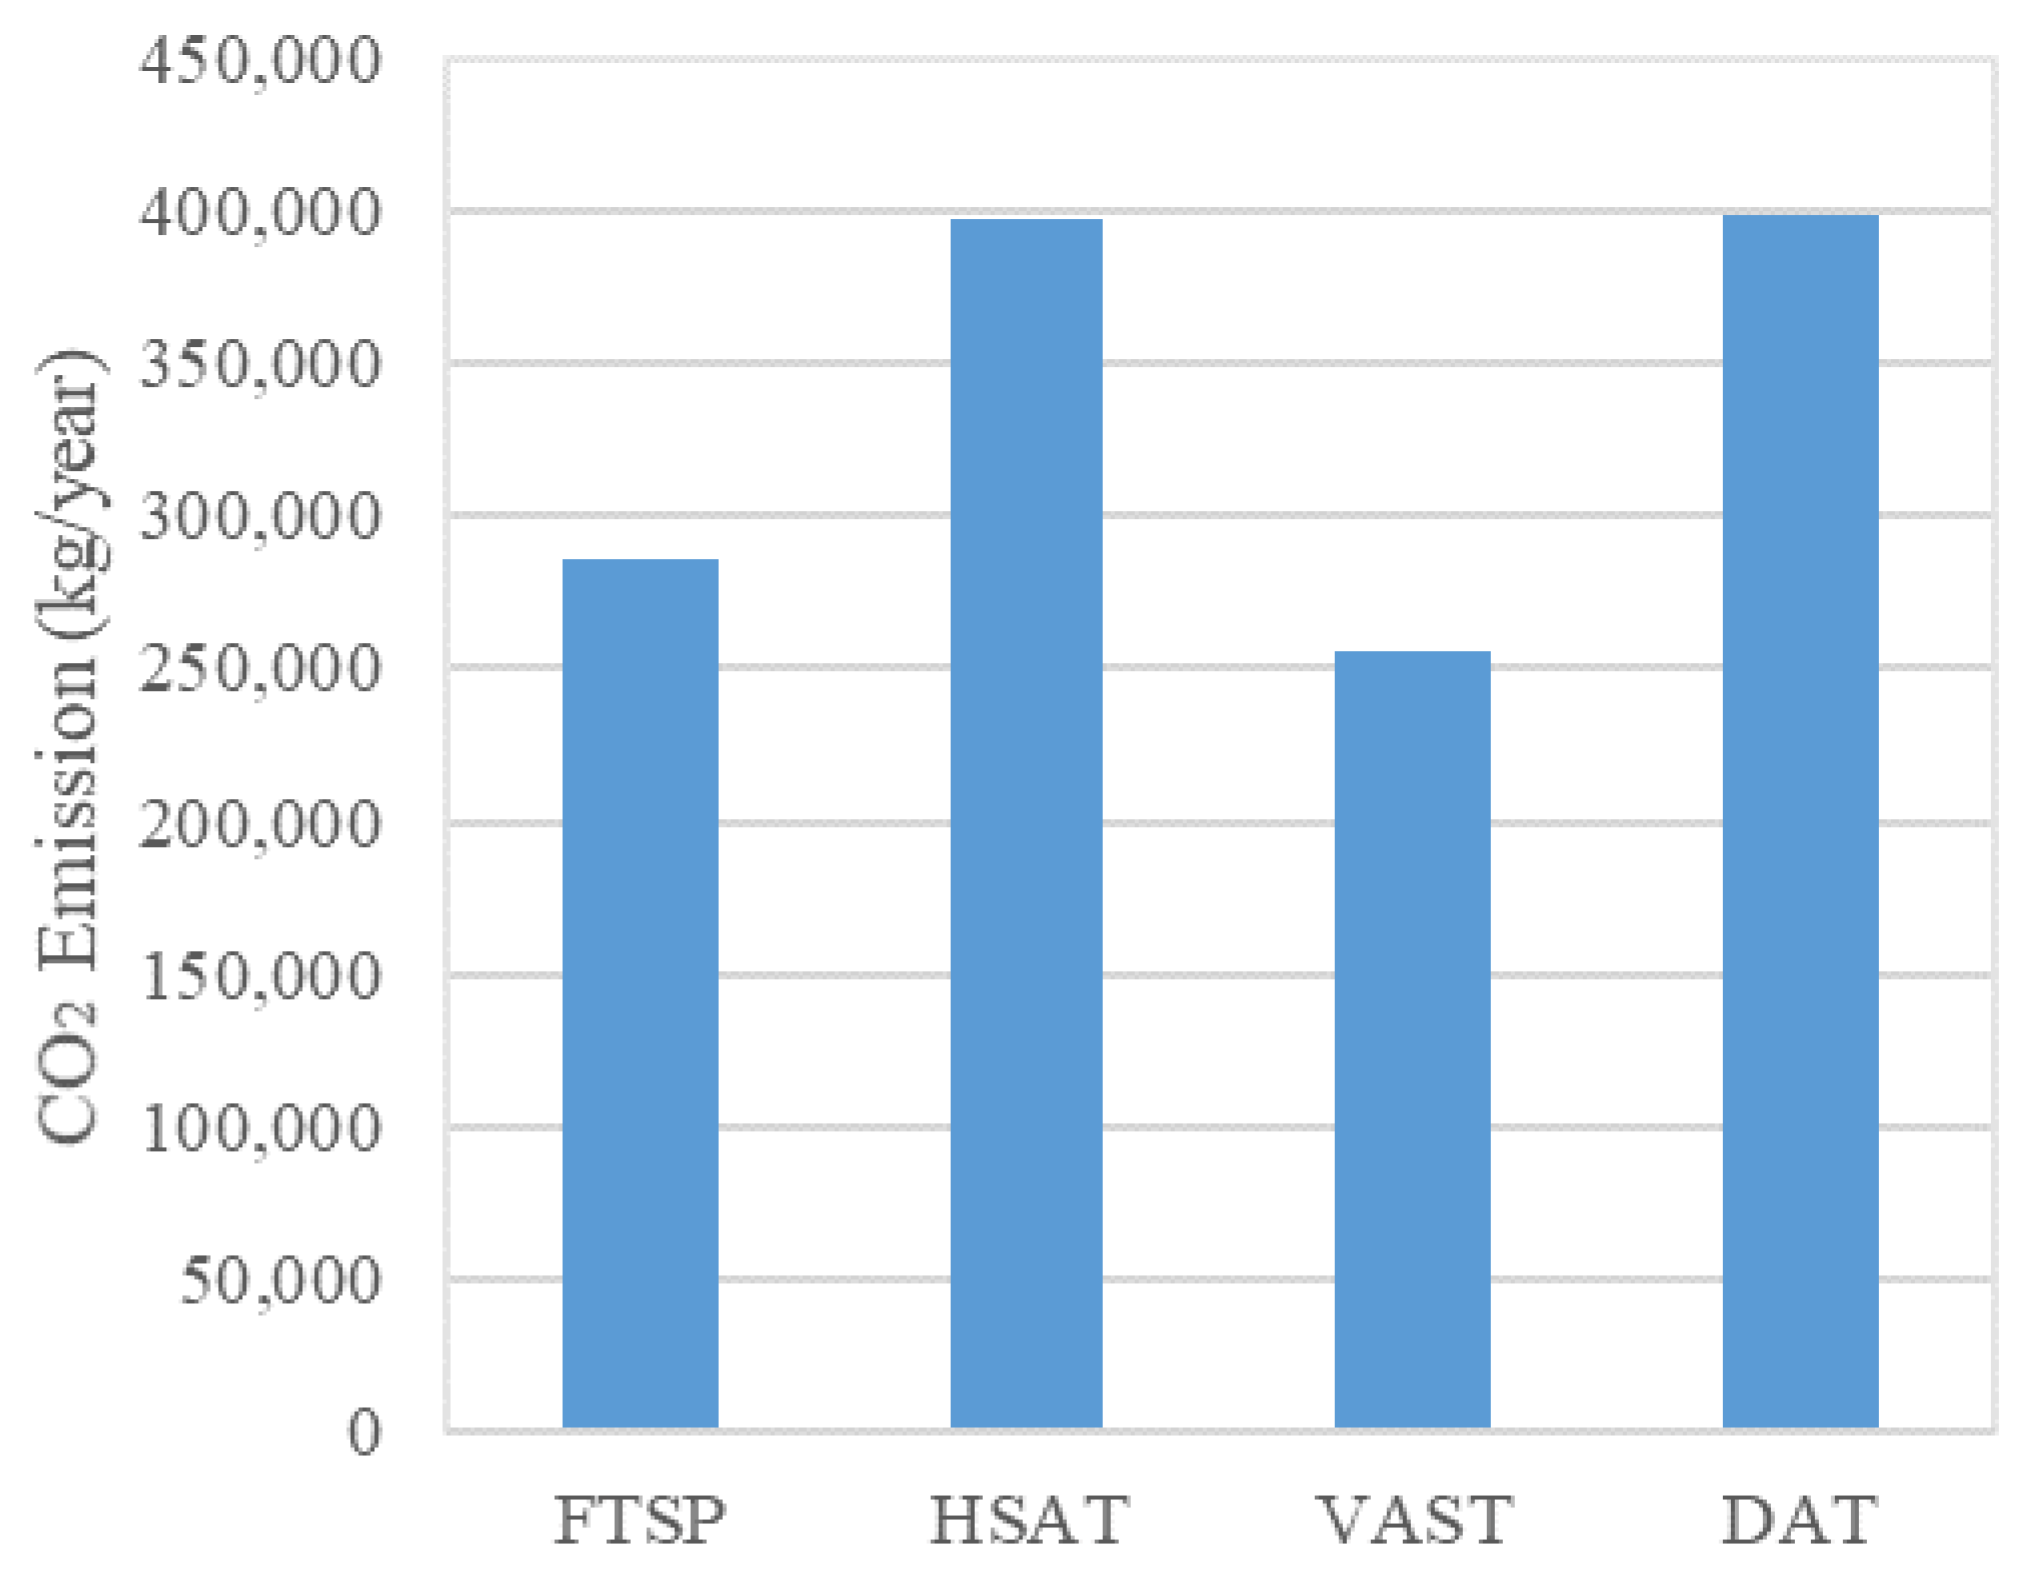
- (4)
- The VSAT showed the lowest CO2 emission, while DAT presented the highest CO2 emission. Due to this it was more reliant on the grid. In this context, VSAT can be the lowest environmental effect.
- (5)
- The study deduced the vital role of VSAT that optimizes the technical performances and extends to a reduced economic cost of the proposed system. Therefore, VSAT can be highly recommended as the best choice of a grid-connected hybrid (PV-FC) energy system for Alkharj city, Saudi Arabia. The proposed system design method and PV tracker investigation are validated for any location in the world, although the result will be different based on components costs, metrological data.
Author Contributions
Funding
Conflicts of Interest
Abbreviations
| PV | Photovoltaic |
| FC | Fuel cell |
| NPC | Net present cost |
| LCOE | Levelized cost of energy |
| IEA | International energy agency |
| COE | Cost of energy |
| GHG | Greenhouse gas |
| DC | Direct current |
| AC | Alternative current |
| FTSP | Fixed-tilt solar panel |
| HSAT | Horizontal single-axis tracker |
| VSAT | Vertical single-axis tracker |
| DAT | Dual-axis tracker |
| O&M | Operation and maintenance |
| PEM | Proton exchange membrane |
| REFIT | Renewable energy feed in tariff |
| GHI | Global horizontal irradiance |
References
- Fossil Fuel. Available online: https://www.studentenergy.org/topics/fossil-fuels?gclid=Cj0KCQiAovfvBRCRARIsADEmbRJcgjWyvt8jZoT53xX8_OspJZKWfA4-t2X5jqRdyKsVpOc4EDL__bgaAv_PEALw_wcB (accessed on 27 November 2020).
- Ambrose, J. “Renewable Energy to Expand by 50% in Next Five Years—Report,” Support the Guardian. Available online: https://www.theguardian.com/environment/2019/oct/21/renewable-energy-to-expand-by-50-in-next-five-years-report (accessed on 27 November 2020).
- Chiang, P.-H.; Chiluvuri, S.P.V.; Dey, S.; Nguyen, T.Q. Forecasting of Solar Photovoltaic System Power Generation Using Wavelet Decomposition and Bias-Compensated Random Forest. In Proceedings of the 9th IEEE Green Technology Conference, Denver, CO, USA, 29–31 March 2017; pp. 260–266. [Google Scholar]
- Velloso, M.F.A.; Martins, F.R.; Pereira, E.B. Case study for hybrid power generation combining hydro- and photovoltaic energy resources in the Brazilian semiarid region. Clean Technol. Environ. Policy 2019, 21, 941–952. [Google Scholar]
- Indragandhi, V.; Subramaniyaswamy, V.; Logesh, R. Resources, configurations, and soft computing techniques for power management and control of PV/wind hybrid system. Renew. Sustain. Energy Rev. 2017, 69, 129–143. [Google Scholar]
- Notton, G.; Nivet, M.-L.; Voyant, C.; Paoli, C.; Darras, C.; Motte, F.; Fouilloy, A. Intermittent and stochastic character of renewable energy sources: Consequences, cost of intermittence and benefit of forecasting. Renew. Sustain. Energy Rev. 2018, 87, 96–105. [Google Scholar] [CrossRef]
- Nadjemi, O.; Nacer, T.; Hamidat, A.; Salhi, H. Optimal hybrid PV/wind energy system sizing: Application of cuckoo search algorithm for Algerian dairy farms. Renew. Sustain. Energy Rev. 2017, 70, 1352–1365. [Google Scholar] [CrossRef]
- Mohod, S.B.; Parihar, V.; Nimkar, S.D. Hybrid power system with integration of wind, battery and solar PV system. In Proceedings of the 2017 IEEE International Conference on Power, Control, Signals and Instrumentation Engineering (ICPCSI), Chennai, India, 21–22 September 2017; pp. 2332–2337. [Google Scholar]
- Li, F.-F.; Qiu, J. Multi-objective optimization for integrated hydro–photovoltaic power system. Appl. Energy 2016, 167, 377–384. [Google Scholar] [CrossRef]
- Bierling, P. The potential of hybrid floating pv-hydropower plants in Vietnam an energy justice perspective. Master’s Thesis, Eindhoven University of Technology, Eindhoven, The Netherlands, 11 August 2019. [Google Scholar]
- Shivashankar, S.; Mekhilef, S.; Mokhlis, H.; Karimi, M. Mitigating methods of power fluctuation of photovoltaic (PV) sources—A review. Renew. Sustain. Energy Rev. 2016, 59, 1170–1184. [Google Scholar] [CrossRef]
- Li, C.; Zhou, D.; Zheng, Y. Techno-economic comparative study of grid-connected PV power systems in five climate zones, China. Energy 2018, 165, 1352–1369. [Google Scholar] [CrossRef]
- Ramli, M.A.; Hiendro, A.; Sedraoui, K.; Twaha, S. Optimal sizing of grid-connected photovoltaic energy system in Saudi Arabia. Renew. Energy 2015, 75, 489–495. [Google Scholar]
- Al Garni, H.Z.; Awasthi, A.; Ramli, M.A.M. Optimal design and analysis of grid-connected photovoltaic under different tracking systems using HOMER. Energy Convers. Manag. 2018, 155, 42–57. [Google Scholar] [CrossRef]
- Aktas, A.; Erhan, K.; Ozdemir, S.; Özdemir, E. Experimental investigation of a new smart energy management algorithm for a hybrid energy storage system in smart grid applications. Electr. Power Syst. Res. 2017, 144, 185–196. [Google Scholar] [CrossRef]
- Dong, W.; Li, Y.; Xiang, J. Optimal Sizing of a Stand-Alone Hybrid Power System Based on Battery/Hydrogen with an Improved Ant Colony Optimization. Energies 2016, 9, 785. [Google Scholar] [CrossRef]
- Fan, X.-C.; Wang, W.-Q.; Shi, R.-J.; Cheng, Z.-J. Hybrid pluripotent coupling system with wind and photovoltaic-hydrogen energy storage and the coal chemical industry in Hami, Xinjiang. Renew. Sustain. Energy Rev. 2017, 72, 950–960. [Google Scholar] [CrossRef]
- Jing, W.; Lai, C.H.; Wong, W.S.; Wong, M.D. A comprehensive study of battery-supercapacitor hybrid energy storage system for standalone PV power system in rural electrification. Appl. Energy 2018, 224, 340–356. [Google Scholar] [CrossRef]
- Amrouche, S.O.; Rekioua, D.; Bacha, S. Overview of energy storage in renewable energy systems. Int. J. Hydrog. Energy 2016, 41, 20914–20927. [Google Scholar] [CrossRef]
- Das, H.S.; Dey, A.; Wei, T.C.; Yatim, A.H.M. Feasibility analysis of standalone PV/wind/battery hybrid energy system for rural Bangladesh. Int. J. Renew. Energy Res. 2016, 6, 402–412. [Google Scholar]
- Hossain, M.; Mekhilef, S.; Olatomiwa, L. Performance evaluation of a stand-alone PV-wind-diesel-battery hybrid system feasible for a large resort center in South China Sea, Malaysia. Sustain. Cities Soc. 2017, 28, 358–366. [Google Scholar] [CrossRef]
- Roumila, Z.; Rekioua, D.; Rekioua, T. Energy management based fuzzy logic controller of hybrid system wind/photovoltaic/diesel with storage battery. Int. J. Hydrog. Energy 2017, 42, 19525–19535. [Google Scholar] [CrossRef]
- Qian, J.; Jing, X. Wind-driven hybridized triboelectric-electromagnetic nanogenerator and solar cell as a sustainable power unit for self-powered natural disaster monitoring sensor networks. Nano Energy 2018, 52, 78–87. [Google Scholar] [CrossRef]
- Ayodele, T.; Ogunjuyigbe, A. Mitigation of wind power intermittency: Storage technology approach. Renew. Sustain. Energy Rev. 2015, 44, 447–456. [Google Scholar] [CrossRef]
- Gao, D.; Jiang, D.; Liu, P.; Li, Z.; Hu, S.; Xu, H. An integrated energy storage system based on hydrogen storage: Process configuration and case studies with wind power. Energy 2014, 66, 332–341. [Google Scholar] [CrossRef]
- Tabanjat, A.; Becherif, M.; Hissel, D.; Ramadan, H. Energy management hypothesis for hybrid power system of H 2 /WT/PV/GMT via AI techniques. Int. J. Hydrog. Energy 2018, 43, 3527–3541. [Google Scholar] [CrossRef]
- Maleki, A. Design and optimization of autonomous solar-wind-reverse osmosis desalination systems coupling battery and hydrogen energy storage by an improved bee algorithm. Desalination 2018, 435, 221–234. [Google Scholar] [CrossRef]
- Mohammed, O.H.; Amirat, Y.; Benbouzid, M.; Elbaset, A.A.; Elbaset, A.A. Optimal design of a PV/fuel cell hybrid power system for the city of Brest in France. In Proceedings of the 2014 1st International Conference on Green Energy (ICGE), Sfax, Tunisia, 25–27 March 2014; pp. 119–123. [Google Scholar]
- Ghenai, C.; Salameh, T.; Merabet, A. Technico-economic analysis of off grid solar PV/Fuel cell energy system for residential community in desert region. Int. J. Hydrog. Energy 2020, 45, 11460–11470. [Google Scholar] [CrossRef]
- Birol, F. How Hydrogen Can Offer a Clean Energy Future, World Economic Forum. Available online: https://www.weforum.org/agenda/2019/06/how-hydrogen-can-offer-a-clean-energy-future (accessed on 27 November 2020).
- Fuel Cell. National Geographic. 2019. Available online: https://www.nationalgeographic.com/environment/global-warming/fuel-cells/ (accessed on 27 November 2020).
- Staffell, I.; Scamman, D.; Abad, A.V.; Balcombe, P.; Dodds, P.E.; Ekins, P.; Shah, N.; Ward, K.R. The role of hydrogen and fuel cells in the global energy system. Energy Environ. Sci. 2019, 12, 463–491. [Google Scholar] [CrossRef] [Green Version]
- Barbir, F. PEM Fuel Cells Theory and Practice, 2nd ed.; Elsevier, Inc.: Amsterdam, The Netherlands, 2013. [Google Scholar]
- Das, H.S.; Tan, C.W.; Yatim, A.; Lau, K.Y. Feasibility analysis of hybrid photovoltaic/battery/fuel cell energy system for an indigenous residence in East Malaysia. Renew. Sustain. Energy Rev. 2017, 76, 1332–1347. [Google Scholar] [CrossRef]
- Samy, M.; Barakat, S.; Ramadan, H. A flower pollination optimization algorithm for an off-grid PV-Fuel cell hybrid renewable system. Int. J. Hydrog. Energy 2019, 44, 2141–2152. [Google Scholar] [CrossRef]
- Maleki, A.; Rosen, M.A.; Pourfayaz, F. Optimal Operation of a Grid-Connected Hybrid Renewable Energy System for Residential Applications. Sustainability 2017, 9, 1314. [Google Scholar] [CrossRef] [Green Version]
- Cordiner, S.; Mulone, V.; Giordani, A.; Savino, M.; Tomarchio, G.; Malkow, T.; Tsotridis, G.; Pilenga, A.; Karlsen, M.; Jensen, J. Fuel cell based Hybrid Renewable Energy Systems for off-grid telecom stations: Data analysis from on field demonstration tests. Appl. Energy 2017, 192, 508–518. [Google Scholar] [CrossRef]
- Hatata, A.; Lafi, A. Clonal Selection Algorithm for Optimum Sizing of WT/PV/FC Hybrid Renewable Power System. In Proceedings of the 1st International Conference on Computer Applications & Information Security (ICCAIS), Riyadh, Saudi Arabia, 4–5 April 2018. [Google Scholar]
- Majidi, M.; Nojavan, S.; Zare, K. Optimal stochastic short-term thermal and electrical operation of fuel cell/photovoltaic/battery/grid hybrid energy system in the presence of demand response program. Energy Convers. Manag. 2017, 144, 132–142. [Google Scholar] [CrossRef]
- Al-Sharafi, A.; Sahin, A.Z.; Ayar, T.; Yilbas, B.S. Techno-economic analysis and optimization of solar and wind energy systems for power generation and hydrogen production in Saudi Arabia. Renew. Sustain. Energy Rev. 2017, 69, 33–49. [Google Scholar] [CrossRef]
- Duman, A.C.; Güler, Ö. Techno-economic analysis of off-grid PV/wind/fuel cell hybrid system combinations with a comparison of regularly and seasonally occupied households. Sustain. Cities Soc. 2018, 42, 107–126. [Google Scholar] [CrossRef]
- Kebede, M.H.; Beyene, G.B. Feasibility Study of PV-Wind-Fuel Cell Hybrid Power System for Electrification of a Rural Village in Ethiopia. J. Electr. Comput. Eng. 2018, 2018, 1–9. [Google Scholar] [CrossRef]
- Khiareddine, A.; Ben Salah, C.; Rekioua, D.; Mimouni, M.F. Sizing methodology for hybrid photovoltaic /wind/ hydrogen/battery integrated to energy management strategy for pumping system. Energy 2018, 153, 743–762. [Google Scholar] [CrossRef]
- Zhang, W.; Maleki, A.; Rosen, M.A.; Liu, J. Optimization with a simulated annealing algorithm of a hybrid system for renewable energy including battery and hydrogen storage. Energy 2018, 163, 191–207. [Google Scholar] [CrossRef]
- Jamalaiah, A.; Raju, C.P.; Srinivasarao, R. Optimization and operation of a renewable energy based pv-fc-micro grid using homer. In Proceedings of the 2017 International Conference on Inventive Communication and Computational Technologies (ICICCT), Coimbatore, India, 10–11 March 2017. [Google Scholar]
- Cervantes, I.; Hernandez-Nochebuena, M.; Cano-Castillo, U.; Araujo-Vargas, I. A graphical approach to optimal power management for uncertain OFF-Grid PV-FC-electrolyzer-battery hybrid systems. Int. J. Hydrog. Energy 2018, 43, 19336–19351. [Google Scholar] [CrossRef]
- Abadlia, I.; Adjabi, M.; Bouzeria, H. Sliding mode based power control of grid-connected photovoltaic-hydrogen hybrid system. Int. J. Hydrog. Energy 2017, 42, 28171–28182. [Google Scholar] [CrossRef]
- Nasri, S.; Ben Slama, S.; Yahyaoui, I.; Zafar, B.; Cherif, A. Autonomous hybrid system and coordinated intelligent management approach in power system operation and control using hydrogen storage. Int. J. Hydrog. Energy 2017, 42, 9511–9523. [Google Scholar] [CrossRef]
- Zulkafli, R.S.; Bawazir, A.S.; Amin, N.A.M.; Hashim, M.S.M.; Majid, M.S.A.; Nasir, N.F.M. Dual axis solar tracking system in Perlis, Malaysia. Telecommun. Electron. Comput. Eng. 2018, 10, 91–94. [Google Scholar]
- Vieira, R.; Guerra, F.; Vale, M.; Araújo, M. Comparative performance analysis between static solar panels and single-axis tracking system on a hot climate region near to the equator. Renew. Sustain. Energy Rev. 2016, 64, 672–681. [Google Scholar] [CrossRef]
- Hu, Y.; Yao, Y. A methodology for calculating photovoltaic field output and effect of solar tracking strategy. Energy Convers. Manag. 2016, 126, 278–289. [Google Scholar] [CrossRef]
- Eldin, S.S.; Abd-Elhady, M.; Kandil, H. Feasibility of solar tracking systems for PV panels in hot and cold regions. Renew. Energy 2016, 85, 228–233. [Google Scholar] [CrossRef]
- Seme, S.; Štumberger, B.; Hadžiselimović, M. A novel prediction algorithm for solar angles using second derivative of the energy for photovoltaic sun tracking purposes. Sol. Energy 2016, 137, 201–211. [Google Scholar] [CrossRef]
- Ruelas, J.; Muñoz, F.; Lucero, B.; Palomares-Ruiz, J. PV Tracking Design Methodology Based on an Orientation Efficiency Chart. Appl. Sci. 2019, 9, 894. [Google Scholar] [CrossRef] [Green Version]
- Karpić, J.; Sharma, E.; Khatib, T.; Elmenreich, W. Comparison of solar power measurements in alpine areas using a mobile dual-axis tracking system. Energy Inform. 2019, 2, 1–14. [Google Scholar] [CrossRef] [Green Version]
- Shabani, M.; Mahmoudimehr, J. Techno-economic role of PV tracking technology in a hybrid PV-hydroelectric standalone power system. Appl. Energy 2018, 212, 84–108. [Google Scholar] [CrossRef]
- Sinha, S.; Chandel, S. Analysis of fixed tilt and sun tracking photovoltaic–micro wind based hybrid power systems. Energy Convers. Manag. 2016, 115, 265–275. [Google Scholar] [CrossRef]
- Kumar, N.M.; Vishnupriyan, J.; Sundaramoorthi, P. Techno-economic optimization and real-time comparison of sun tracking photovoltaic system for rural healthcare building. J. Renew. Sustain. Energy 2019, 11, 015301. [Google Scholar] [CrossRef]
- Racharla, S.; Rajan, K. Solar tracking system—A review. Int. J. Sustain. Eng. 2017, 10, 72–81. [Google Scholar]
- Li, C.; Yu, W. Techno-economic comparative analysis of off-grid hybrid photovoltaic/diesel/battery and photovoltaic/battery power systems for a household in Urumqi, China. J. Clean. Prod. 2016, 124, 258–265. [Google Scholar] [CrossRef]
- Dahiya, D.; Agrawal, R.; Agrawal, D. Performance Analysis Based on Axis Tracking of PV System. Int. Organ. Sci. Res. J. Eng. 2019, 9, 32–39. [Google Scholar]
- Jobair, H.K.; Mahdi, J.M. Economic and Environmental Feasibility of Constructing a Grid-Connected Sun-Tracking PV Power Plant in Iraq. Int. J. Renew. Energy Res. 2019, 9, 997–1004. [Google Scholar]
- Choi, W.; Pate, M.B.; Warren, R.D.; Nelson, R.M. An economic analysis comparison of stationary and dual-axis tracking grid-connected photovoltaic systems in the US Upper Midwest. Int. J. Sustain. Energy 2017, 37, 455–478. [Google Scholar] [CrossRef]
- Alharthi, Y.Z.; Siddiki, M.K.; Chaudhry, G. Resource Assessment and Techno-Economic Analysis of a Grid-Connected Solar PV-Wind Hybrid System for Different Locations in Saudi Arabia. Sustainability 2018, 10, 3690. [Google Scholar] [CrossRef] [Green Version]
- Renvu, GCL Solar PV. Available online: https://www.renvu.com/Browse?website=solar#Solar-Products/Mono-Poly-Crystalline-Solar-Modules (accessed on 27 November 2020).
- Rezk, H.; Dousoky, G.M. Technical and economic analysis of different configurations of stand-alone hybrid renewable power systems—A case study. Renew. Sustain. Energy Rev. 2016, 62, 941–953. [Google Scholar] [CrossRef]
- Mayyas, A.; Mann, M. Manufacturing Competitiveness Analysis for Hydrogen Refueling Stations. Int. J. Hydrog. Energy 2019, 44, 9121–9142. [Google Scholar] [CrossRef]
- Genral Power Technology, Alibaba. Available online: https://gpcpower.en.alibaba.com/?spm=a2700.wholesale.cordpanyb.1.38264feaasWrN3 (accessed on 27 November 2020).
- Rezk, H.; Sayed, E.T.; Al-Dhaifallah, M.; Obaid, M.; El-Sayed, A.H.M.; Abdelkareem, M.A.; Olabi, A. Fuel cell as an effective energy storage in reverse osmosis desalination plant powered by photovoltaic system. Energy 2019, 175, 423–433. [Google Scholar] [CrossRef] [Green Version]
- Trading Economics. Available online: https://tradingeconomics.com/saudi-arabia/interest-rate (accessed on 27 November 2020).
- Inflation Rate in Saudi Arabia from 1984 to 2024. Available online: https://www.statista.com/statistics/268062/inflation-in-saudi-arabia/ (accessed on 27 November 2020).
- Aziz, A.S.; Tajuddin, M.F.N.; Adzman, M.R.; Ramli, M.A.M.; Mekhilef, S. Energy Management and Optimization of a PV/Diesel/Battery Hybrid Energy System Using a Combined Dispatch Strategy. Sustainability 2019, 11, 683. [Google Scholar] [CrossRef] [Green Version]
- Kansara, B.U.; Parekh, B.R. Penetration of renewable energy resources based dispatch strategies for isolated hybrid systems. Int. J. Electr. Electron. Eng. Res. 2013, 3, 121–130. [Google Scholar]
- Al Kharj, Saudi Arabia Geographic Information. LatLong. Available online: https://www.latlong.net/place/al-kharj-saudi-arabia-14178.html (accessed on 27 November 2020).
- Metorological Data Access, NASA Prediction of Worldwide Energy Resources. Available online: https://power.larc.nasa.gov/ (accessed on 27 November 2020).
- OFW Talks. Available online: http://ofwtalks.com/ofws-destination-in-saudi-arabia-al-kharj/ (accessed on 27 November 2020).
- Munir AL-Ali & Sons Co. Available online: www.masc-jo.com (accessed on 27 November 2020).
- Qolipour, M.; Mostafaeipour, A.; Tousi, O.M. Techno-economic feasibility of a photovoltaic-wind power plant construction for electric and hydrogen production: A case study. Renew. Sustain. Energy Rev. 2017, 78, 113–123. [Google Scholar] [CrossRef]
- Salam, M.A.; Khan, S.A. Transition towards sustainable energy production—A review of the progress for solar energy in Saudi Arabia. Energy Explor. Exploit. 2017, 36, 3–27. [Google Scholar] [CrossRef]


| PV Tracking System | $/kWh |
|---|---|
| Horizontal single axis tracker (HSAT) | 880 |
| Vertical single axis tracker (VSAT) | 265 |
| Dual axis tracker (DAT) | 1000 |
| Period | Color | Price ($/kWh) | Sellback ($/kWh) |
|---|---|---|---|
| Off-Peak | Wathet blue | 0.0480 | 0.0380 |
| Shoulder | Green | 0.0480 | 0.0400 |
| Peak | Yellow | 0.0800 | 0.0700 |
Publisher’s Note: MDPI stays neutral with regard to jurisdictional claims in published maps and institutional affiliations. |
© 2020 by the authors. Licensee MDPI, Basel, Switzerland. This article is an open access article distributed under the terms and conditions of the Creative Commons Attribution (CC BY) license (http://creativecommons.org/licenses/by/4.0/).
Share and Cite
Mubaarak, S.; Zhang, D.; Chen, Y.; Liu, J.; Wang, L.; Yuan, R.; Wu, J.; Zhang, Y.; Li, M. Techno-Economic Analysis of Grid-Connected PV and Fuel Cell Hybrid System Using Different PV Tracking Techniques. Appl. Sci. 2020, 10, 8515. https://doi.org/10.3390/app10238515
Mubaarak S, Zhang D, Chen Y, Liu J, Wang L, Yuan R, Wu J, Zhang Y, Li M. Techno-Economic Analysis of Grid-Connected PV and Fuel Cell Hybrid System Using Different PV Tracking Techniques. Applied Sciences. 2020; 10(23):8515. https://doi.org/10.3390/app10238515
Chicago/Turabian StyleMubaarak, Saif, Delong Zhang, Yongcong Chen, Jinxin Liu, Longze Wang, Rongfang Yuan, Jing Wu, Yan Zhang, and Meicheng Li. 2020. "Techno-Economic Analysis of Grid-Connected PV and Fuel Cell Hybrid System Using Different PV Tracking Techniques" Applied Sciences 10, no. 23: 8515. https://doi.org/10.3390/app10238515