Article

Fabrication and Characterization of Porous Core–Shell Graphene/SiO2 Nanocomposites for the Removal of Cationic Neutral Red Dye

1
Haixi Institutes, Chinese Academy of Sciences (CAS), Fuzhou 350002, Fujian, China
2
College of Chemistry and Materials Science, Fujian Normal University, Fuzhou 350007, Fujian, China
*
Author to whom correspondence should be addressed.
Appl. Sci. 2020, 10(23), 8529; https://doi.org/10.3390/app10238529
Submission received: 4 November 2020 / Revised: 16 November 2020 / Accepted: 20 November 2020 / Published: 28 November 2020
(This article belongs to the Section Nanotechnology and Applied Nanosciences)

Abstract

:
Porous rGO/SiO2 nanocomposites with a “core-shell” structure were prepared as an efficient adsorbent for the liquid-phase adsorption of cationic neutral red (NR) dye. The samples were characterized with powder X-ray diffraction (XRD), field-emission scanning electron microscopy (FE-SEM), transmission electron microscopy (TEM), thermogravimetric analysis (TG), X-ray photoelectron spectroscopy (XPS), Raman spectroscopy, and N2 and water vapor adsorption/desorption methods. The NR removal ability and kinetics of the adsorption process of SiO2 and the rGO/SiO2 nanocomposites were investigated at 298 K. The rGO/SiO2 nanocomposite SG 0.30 showed a superior adsorption of NR dye. In regard to NR at pH 5, we measured a superior adsorption capacity of 66.635 mg/g at an initial NR concentration of 50 mg/L. The experimental adsorption capacity of SG 0.30 was 3.791 times higher than that of SiO2. Then, we compared the results with similar materials used for NR removal. Moreover, the water adsorption sites provided by the nitrogen- and oxygen-containing groups might be one of the reasons for the increased adsorption of water vapor. The broad range of properties of the rGO/SiO2 nanocomposite, including its simple synthesis, ability to be mass prepared, and strong adsorption properties, makes it a truly novel adsorbent that can be industrially produced, and shows potential application in the treatment of wastewater-containing dyes.

1. Introduction

With the development of modern industry, water pollution is one of the primary environmental issues in China because it can be harmful to human health and can affect people’s lives [1,2]. Adsorption is an effective method of solving water pollution. Various materials, such as activated carbon [3,4], zeolites [5,6], metal oxides [7], and organic–inorganic hybrids [8], have been used as adsorbents. However, although adsorption with activated carbon is highly developed, the cost of reprocessing and regeneration is high. Additionally, the microporous structure of zeolites limits their application in the field of dye adsorption. Metal materials are costly and do not have good enough adsorption capacity. These limitations encourage the search for inexpensive and readily available materials as adsorbents for the removal of dyes.
Carbon materials have received attention from researchers because of their abundant sources, low cost, and stable performance. Graphene (G), known as a porous carbon material, has been increasingly studied as an adsorbent owing to its large surface area, layered structure, and efficient adsorption performance [9,10,11,12]. Unfortunately, applications of graphene have obvious challenges because of its tendency to agglomerate and its hydrophobicity. These properties make the actual specific surface area of graphene far less than the theoretical value. Modification of the porous structure of graphene may effectively improve its potential for use in practical applications [13,14,15,16,17]. For example, Annamalai reported that graphene-loaded NiCo2S4 could effectively increase the capacitance of supercapacitors because of its porous structure [15]. Kim introduced mesopores in graphene via a template method in order to investigate its potential as an anode material for lithium-sulfur batteries [18]. Nanosilica has randomly packed pores and a large specific surface area, while also being hydrophilic [19,20,21]. The combination of nanosilica and graphene can effectively decrease the agglomeration of both materials. This composite is an inexpensive, renewable, and easily available adsorbent material with a high adsorption capacity, and shows promise for use in environmental and energy applications [22,23,24,25,26]. Wang et al. fabricated 3D-graphene aerogels—mesoporous silica materials—that exhibited a high absorption capacity for phenols because of their high surface area (1000.80 m2 g−1), narrow mesopore size distribution (1.87 nm), and porous structures [27]. Gu et al. prepared sandwich-like multilayer silica-Fe3O4-GO composites with mesopores and a large surface area for the removal of methylene blue from water [28]. Li et al. synthesized Si/rGO nanosheet composites with a large surface area by a sol–gel process for the high-efficiency removal of methylene blue and thionine from water [29]. Thus, it was found that a high surface area, narrow mesopore distribution, and multilayer structure could improve the removal efficiency of contaminants in water. However, materials such as the silicon source tetraethyl orthosilicate (TEOS) greatly increase the cost of industrial applications. Therefore, finding a low-cost preparation method is a key issue for industrial production.
To find rGO/SiO2 composites that were low cost, could be prepared in large quantities, and had high adsorption capacity for removing water pollutants, we designed the following experiments. Herein, cationic neutral red (NR) dye (pH = 5) was selected as the model compound in order to evaluate the adsorption ability of rGO/SiO2 nanocomposites from an aqueous solution. The composites were synthesized by the post synthesis treatment illustrated in Scheme 1. By controlling the ratio of rGO and SiO2, the surface properties could be adjusted to improve the adsorption quantity of NR. The parameters were evaluated for NR removal, with a focus on the ratio of GO and SiO2, concentration of NR, adsorption quantity, equilibrium times, pseudo-first-order kinetic parameters, and pseudo-second-order kinetic parameters.

2. Experimental

2.1. Materials

Potassium permanganate (KMnO4, AR), 3-aminopropyltriethoxysilane (APTES), and neutral red (C15H17ClN4) were purchased from Aladdin, China. Graphite powder (C) was obtained from Adamas Reagent Co., Ltd. Sulfuric acid (H2SO4, 95–98%), phosphoric acid (H3PO4, Aq. 85%), hydrogen peroxide (H2O2, Aq. 35%), hydrazine monohydrate (N2H4.H2O, AR), sodium chloride (NaCl, AR), and distearoyl phosphoethanolamine (PEG2000) were obtained from Sinopharm Chemical Reagent Co., Ltd. Sodium metasilicate (Na2SiO3.9H2O) was obtained from Fujian Yuanxiang Chemical Co., Ltd., China. Deionized water was used for all of the experiments.

2.2. Preparation of the SiO2/rGO Nanocomposites

The preparation of rGO/SiO2 nanocomposites was achieved through a surface grafting method, as shown in Scheme 1. Graphene oxide (GO) was prepared from graphite powder using the modified Hummers’ method [30]. Na2SiO3.9H2O, NaCl, and PEG2000 were mixed in 150 mL of distilled water at room temperature. After stirring for 1 h, 2 mol/L H2SO4 was slowly added to prepare the nanosilica at 358 K, until reaching pH 4, and then the sample was stabilized for 1 h. SiO2 was obtained after washing and freeze-drying. To prepare the surface-grafted SiO2-NH2, APTES was used at 358 K for 2 h. SiO2-NH2 was dispersed in 25 mL of distilled water, and the GO solution was slowly dropped in the SiO2-NH2 dispersion under constant stirring. Then, N2H4. H2O was used as the reductant at 323 K for 3 h. The rGO/SiO2 powder was finally obtained after centrifugation, washing, and drying. Additionally, the rGO was obtained in the same way.
For comparison, silica, SiO2/rGO = 10:10, SiO2/rGO = 10:5, SiO2/rGO = 10:3, SiO2/rGO = 10:2, SiO2/rGO = 10:1, and SiO2/rGO = 10:0.5 were prepared and named SiO2, SG 1.00, SG 0.50, SG 0.30, SG 0.20, SG 0.10, and SG 0.05, respectively.

2.3. Characterizations

Field-emission scanning electron microscopy (FE-SEM) and energy dispersive spectroscopy (EDS) of the samples were acquired on a JSM-6700 (JEOL) scanning electron microscope operating at 5 kV. Transmission electron microscopy (TEM) images of the samples were obtained on a Tecnai F20 (Philips) transmission electron microscope operating at 100 kV. Powder X-ray diffraction (XRD) patterns were obtained on a Miniflex 600 X-ray automatic diffractometer (Rigaku Corporation) with a Cu Kα (λ = 0.15406 nm) radiation source in an explored angular range of 10–65 degrees. Thermogravimetric analysis (TGA)/differential thermal analysis (DTA) was performed on a simultaneous TGA/DTA analyzer (NETZSCH STA449F3) from 30 to 800 °C at a heating rate of 10 °C min−1 in air. The nitrogen adsorption/desorption isotherms were measured at 77 K using an ASAP2020 (Micromeritics, Norcross, GA, USA) gas adsorption analyzer, and the samples were evacuated at 10−4 Pa and 393 K for 2 h before measurement. The water vapor adsorption/desorption isotherms were tested at room temperature by an IGA100B (Hiden Isochema Ltd.) intelligent gravimetric sorption analyzer. The samples were evacuated at zero to a saturated vapor pressure and 393 K for 2 h before the measurement. The X-ray photoelectron spectroscopy (XPS) measurements were performed with an ESCALAB 250Xi spectrometer using an Al Kα (1486.6 eV) radiation source to evaluate the chemical states of the elements on the surface of the samples. Raman spectra were obtained with a LabRAM HR system.

2.4. Experimental Method

The liquid phase adsorption of cationic neutral red (NR) dye (pH 5) on the sample was measured with a UV-1100 spectrophotometer (Shanghai Mapada Instruments Co., Ltd., Shanghai, China). Briefly, 20 mg of sample was added to 30 mL of a 10, 25, or 50 mg/L NR aqueous solution (pH 5). Adsorption was carried out with continuous stirring at 700 rpm at room temperature. At certain time intervals, 5 mL of the mixture was withdrawn and separated by centrifugation (5000 rad min−1). All of the test data were repeated 3 to 5 times and averaged, and the data error was controlled within 5%. The concentration of NR in the solution was determined at 530 nm. The adsorption capacity and removal efficiency of the samples were calculated by the following equations:
Q t = ( C 0 C t ) × V m
E = ( C 0 C t ) × 100 % C 0
where Qt (mg/g) is the amount of NR adsorbed on the adsorbent at time t, C0 (mg/L) is the initial NR concentration, Ct is the NR concentration at time t, V (L) is the volume of the solution, m (g) is the mass of the adsorbent, and E is the removal efficiency of the sample.
Herein, to investigate the kinetics of the adsorption process, pseudo-first-order and pseudo-second-order adsorption models were chosen.
Pseudo-first-order equation [31]:
ln ( Q e Q t ) = ln Q e k 1 t
Pseudo-second-order equation [32]:
t Q t = 1 k 2 Q e 2 + t Q e
where Qe (mg/g) is the theoretical equilibrium saturated adsorption of NR, Qt (mg/g) is the amount of NR adsorbed on the adsorbent at time t, k1 (g mg−1 min−1) is the pseudo-first-order rate constant of adsorption, and k2 (g mg−1min−1) is the pseudo-second-order rate constant of adsorption.

3. Results and Discussion

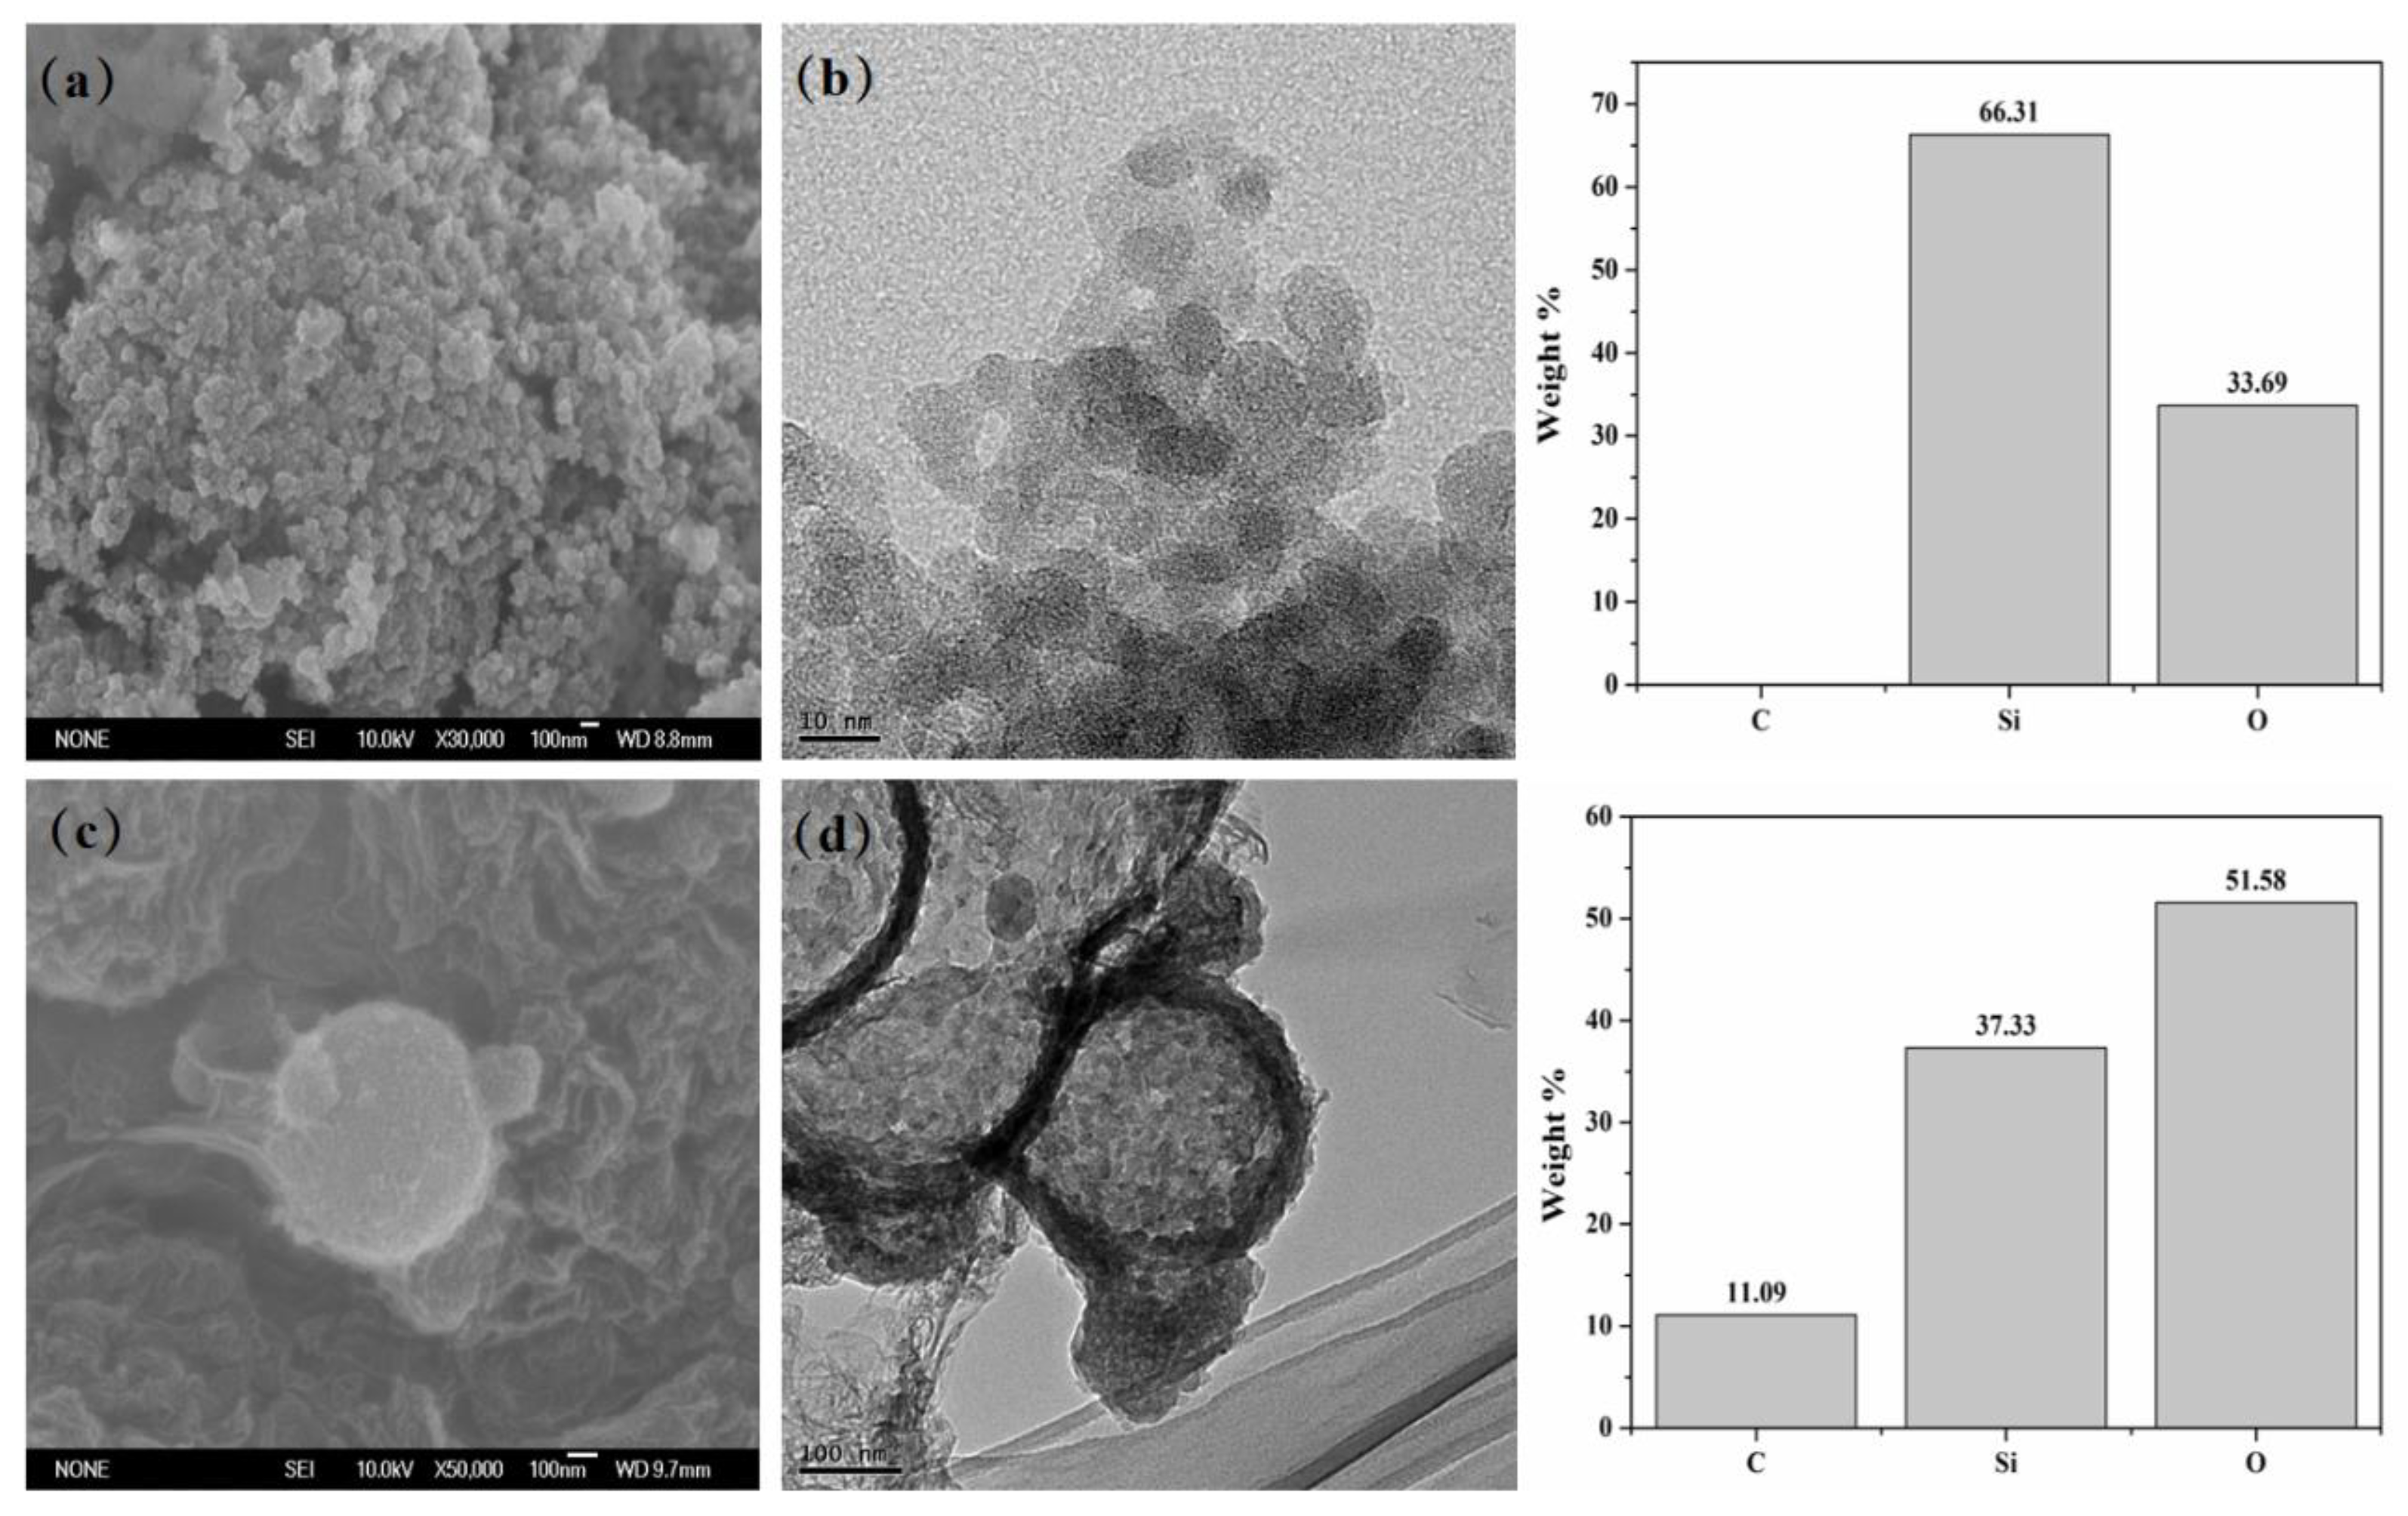
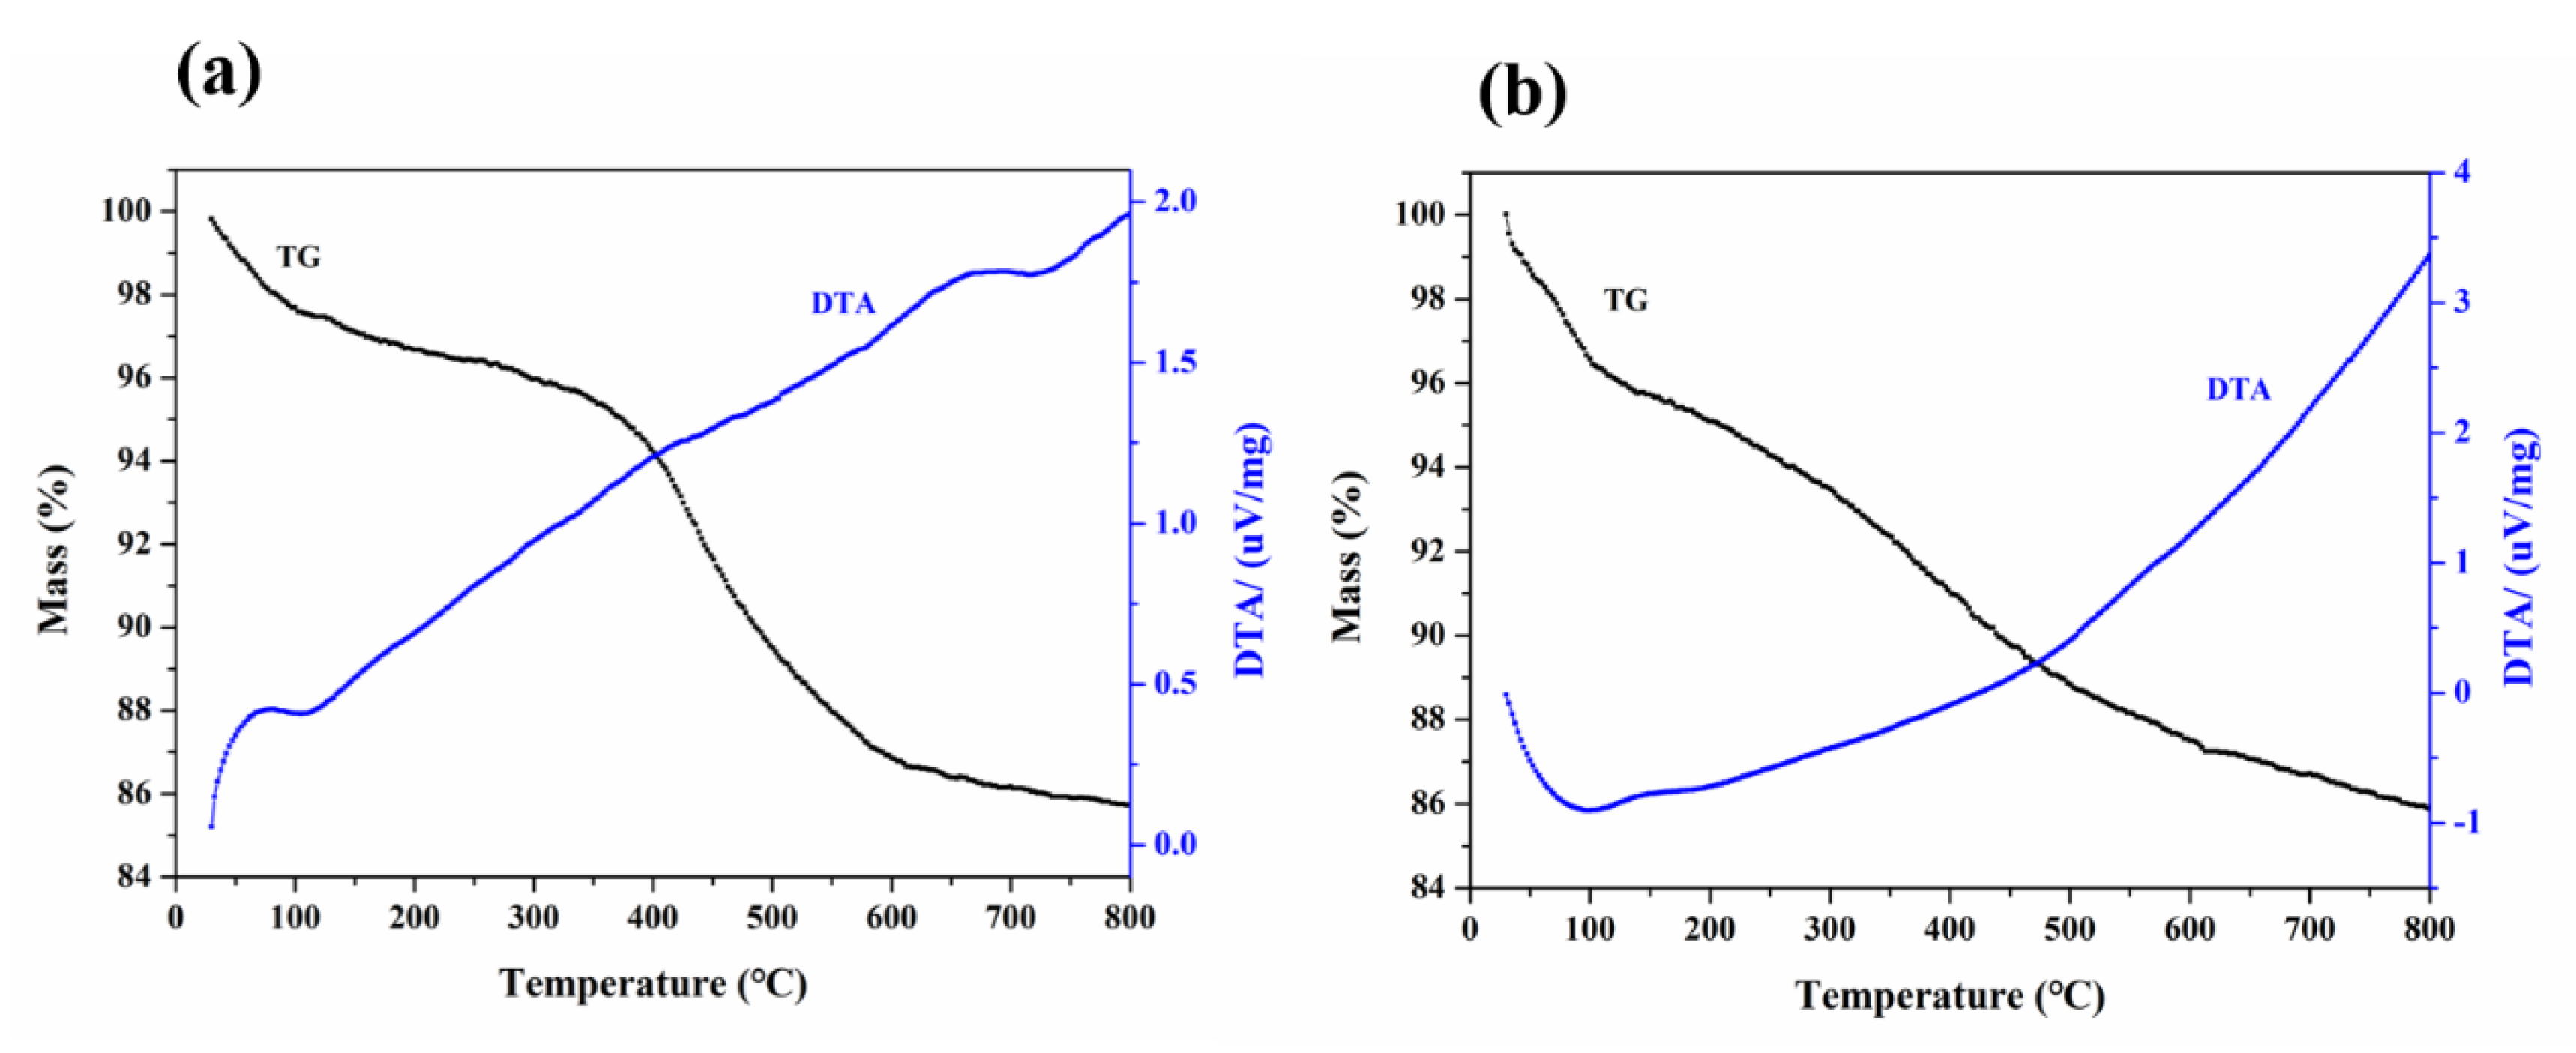
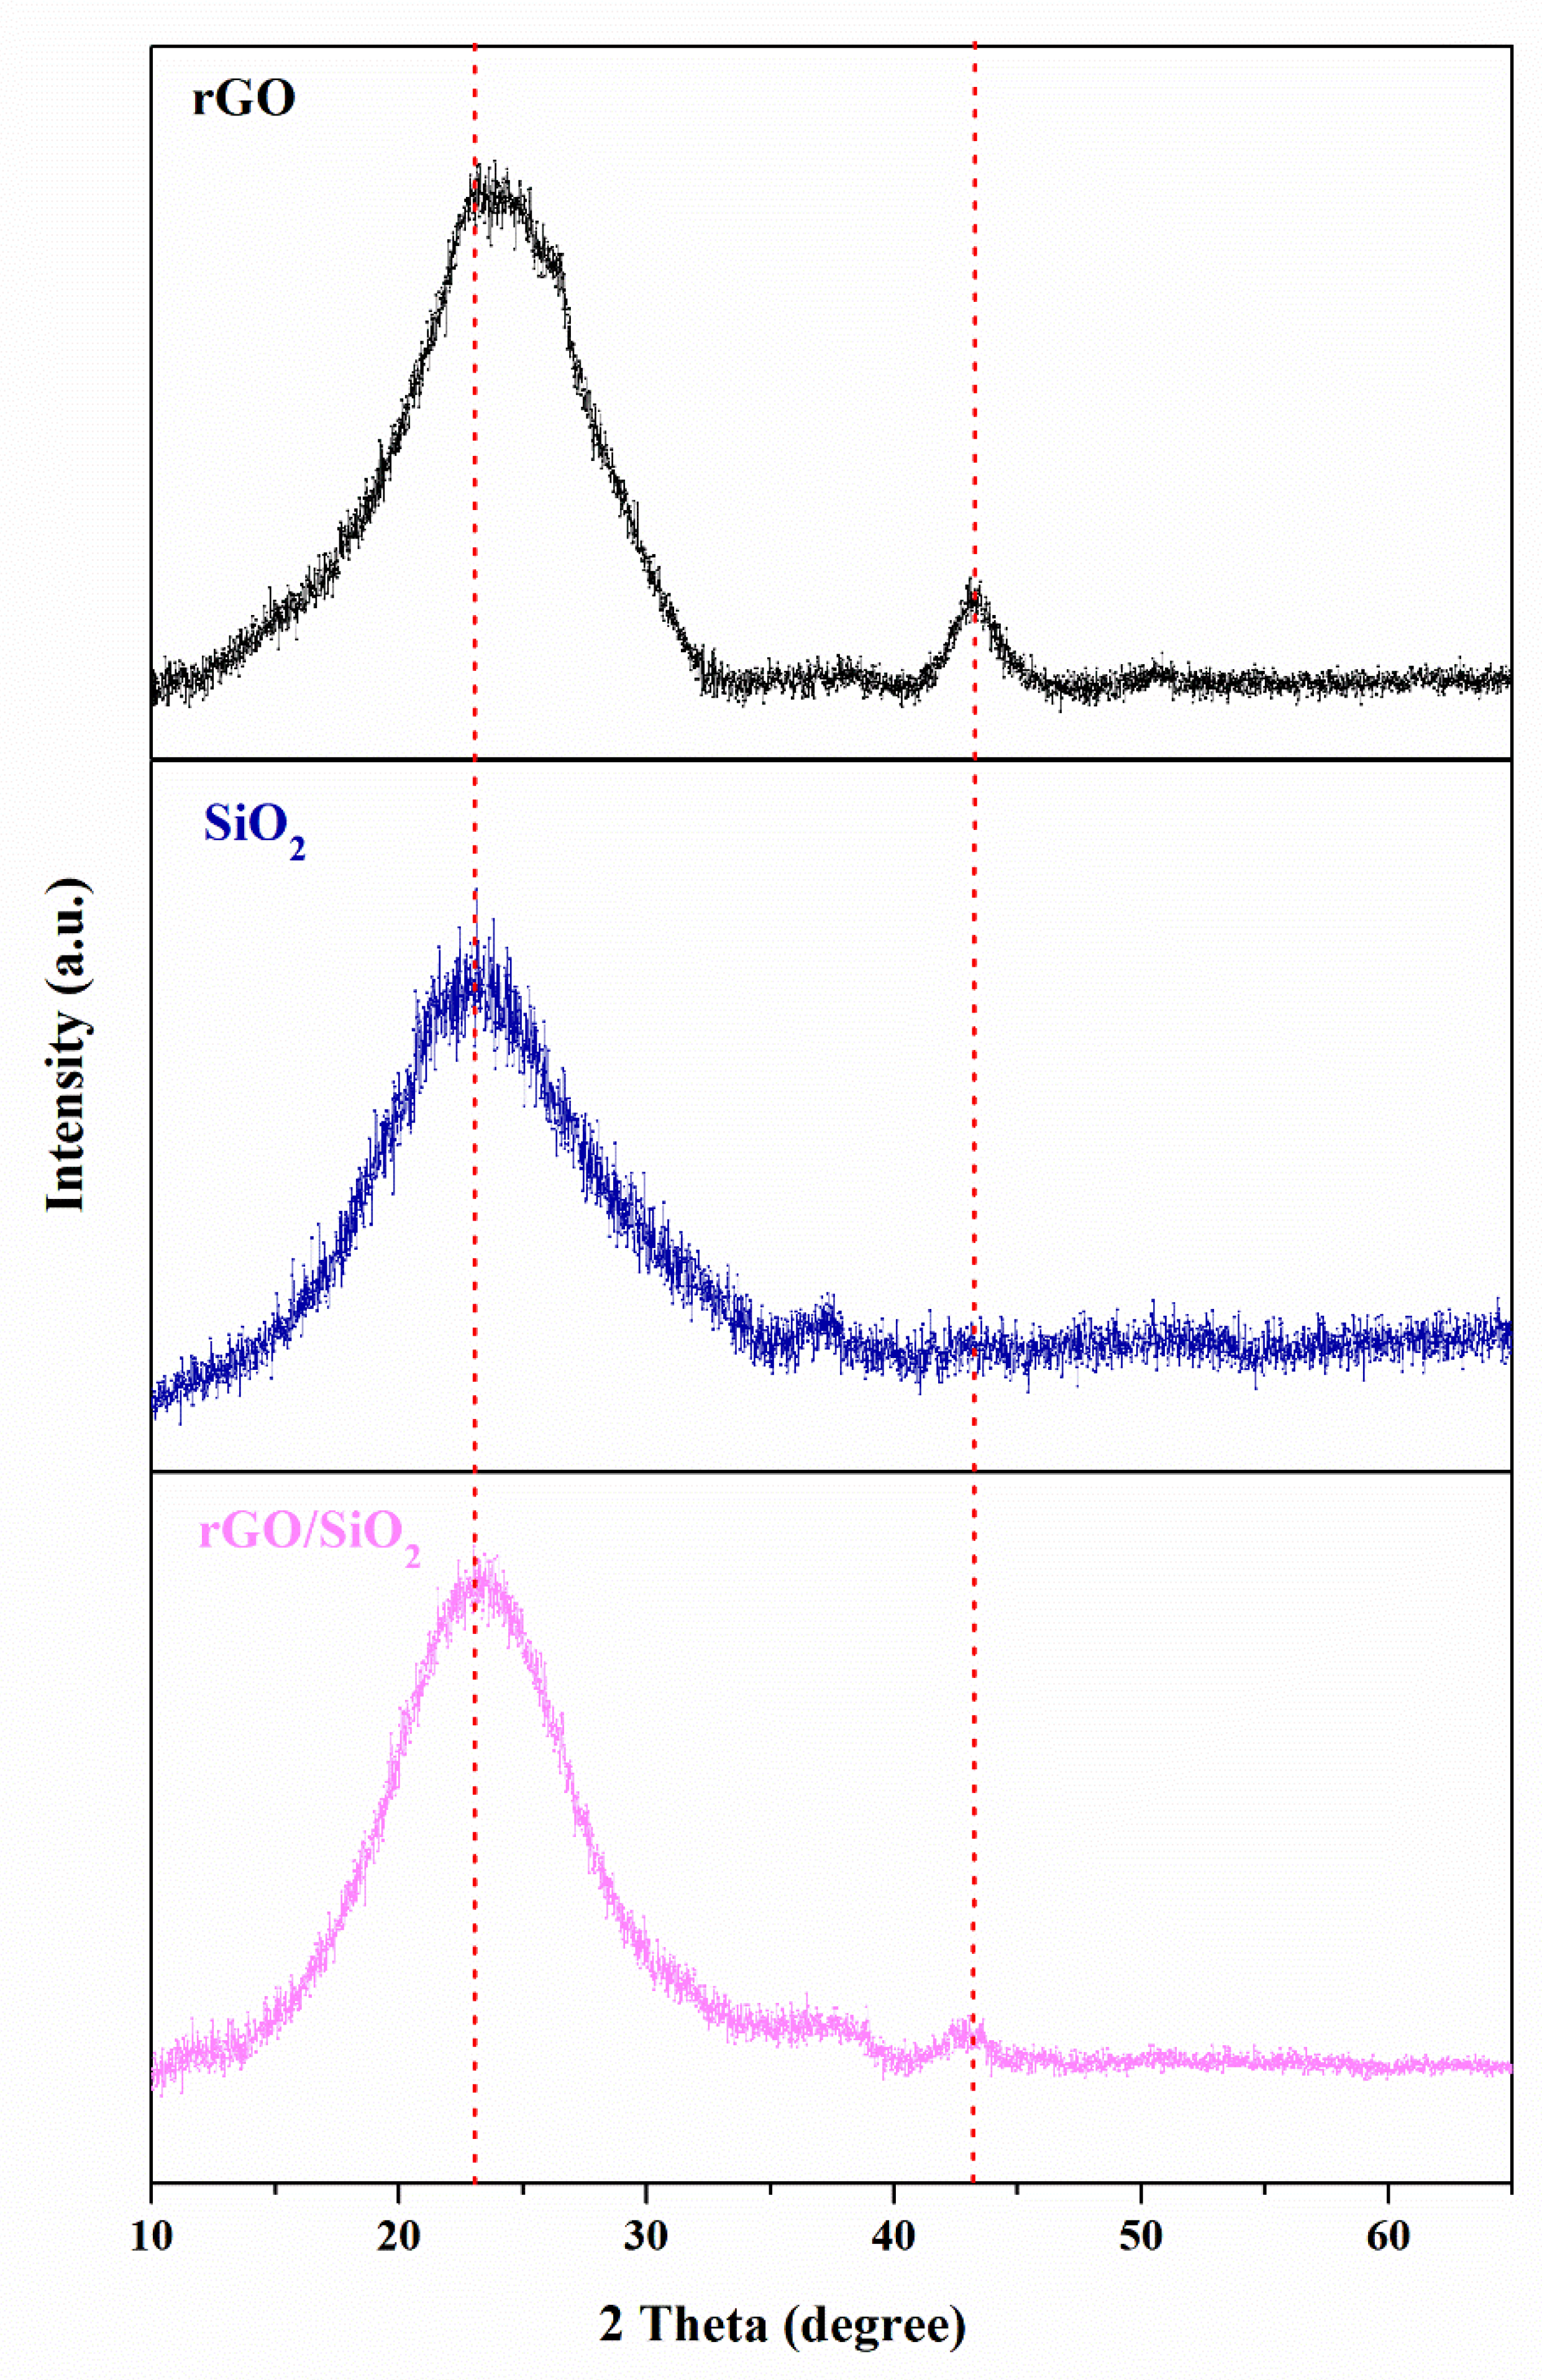
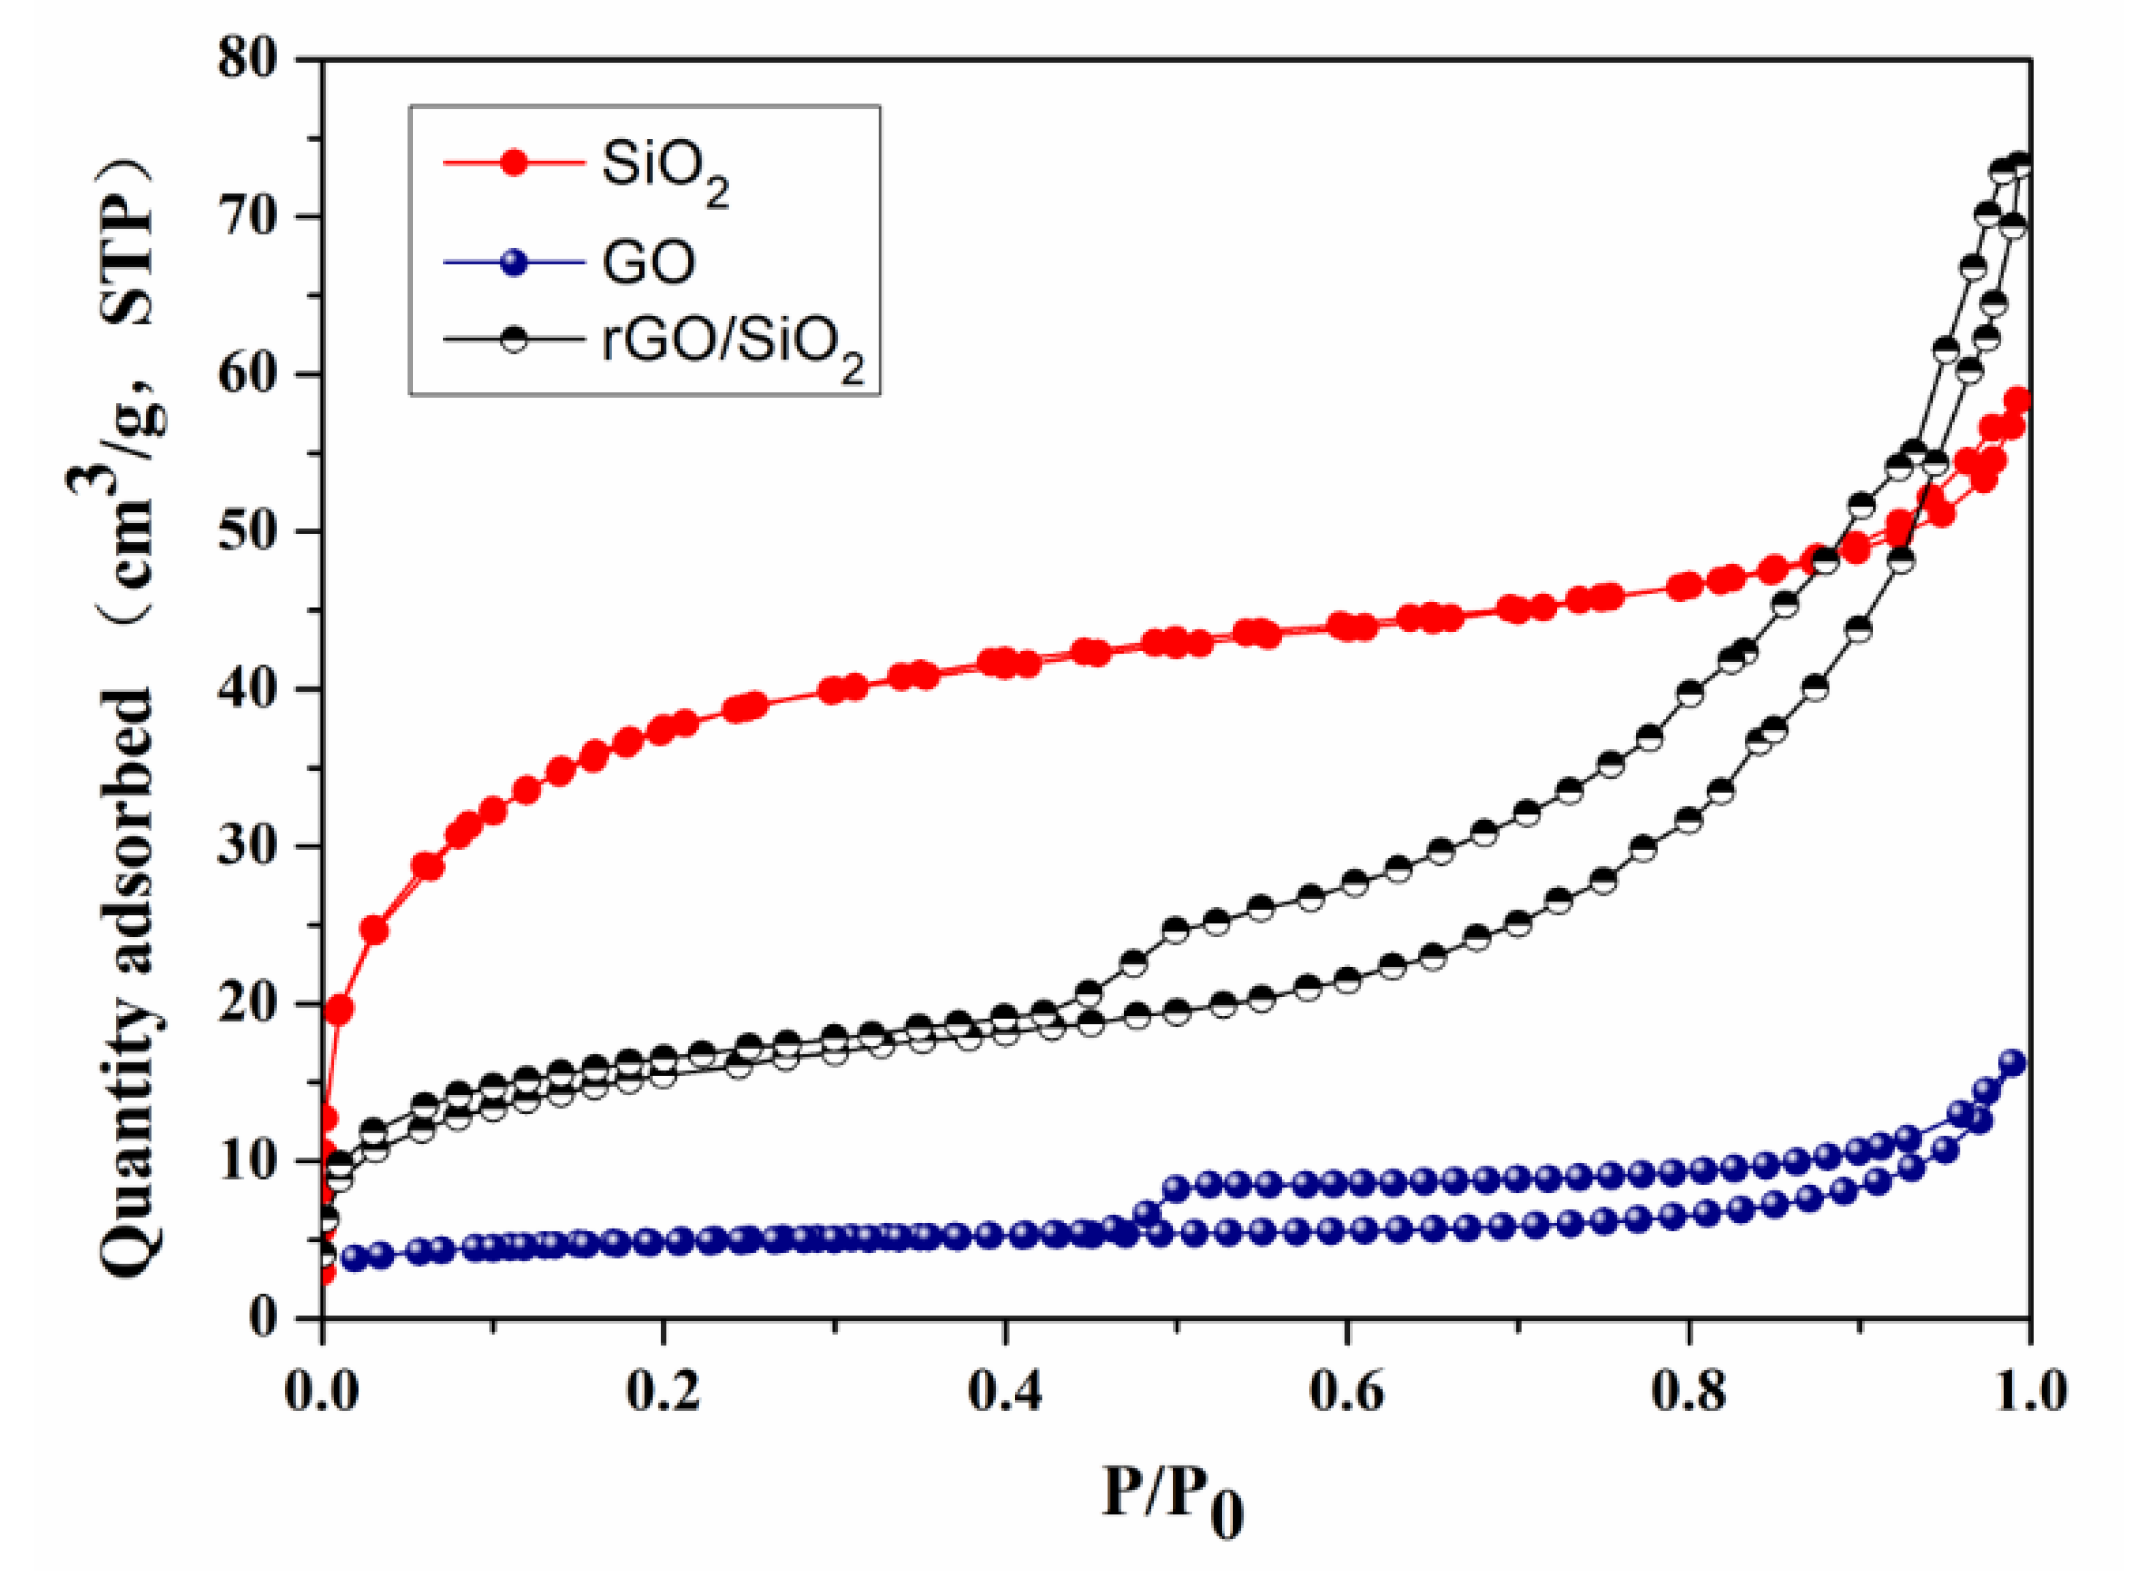
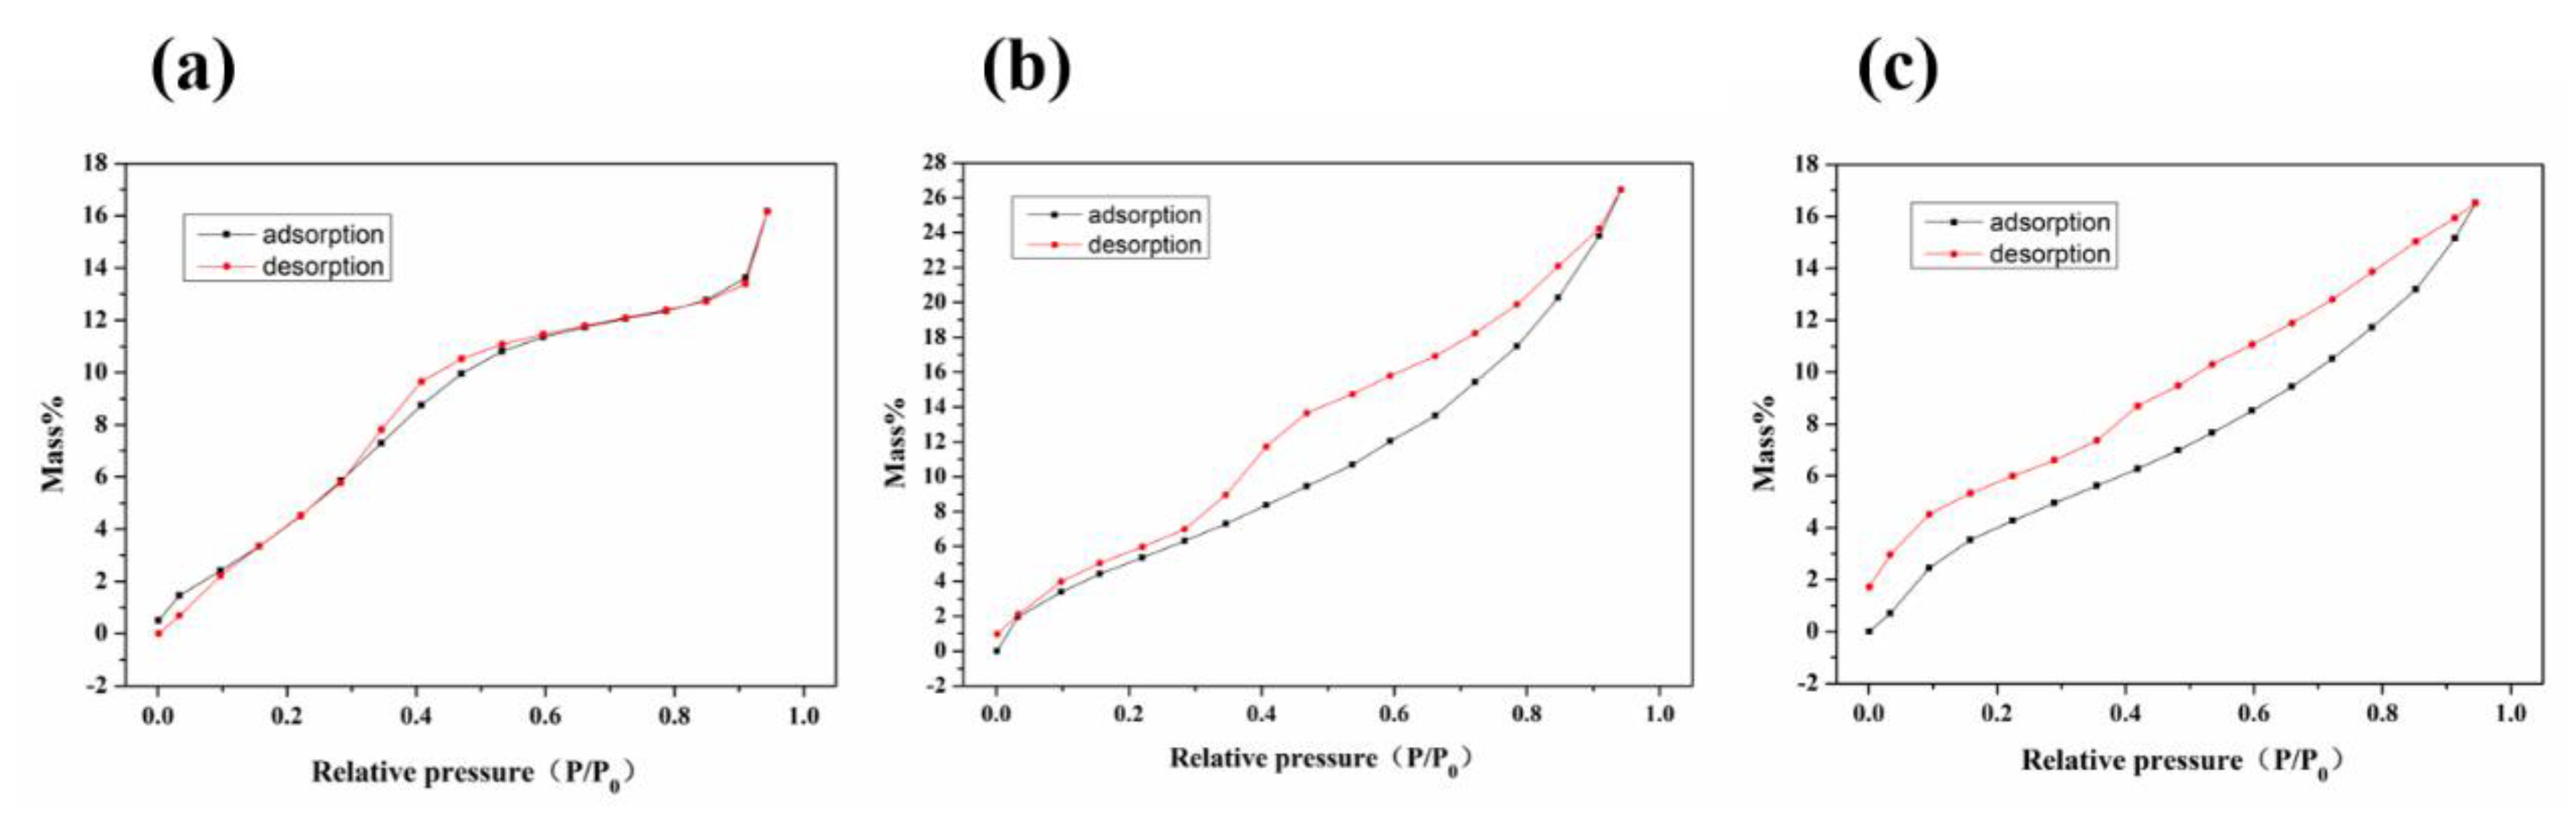
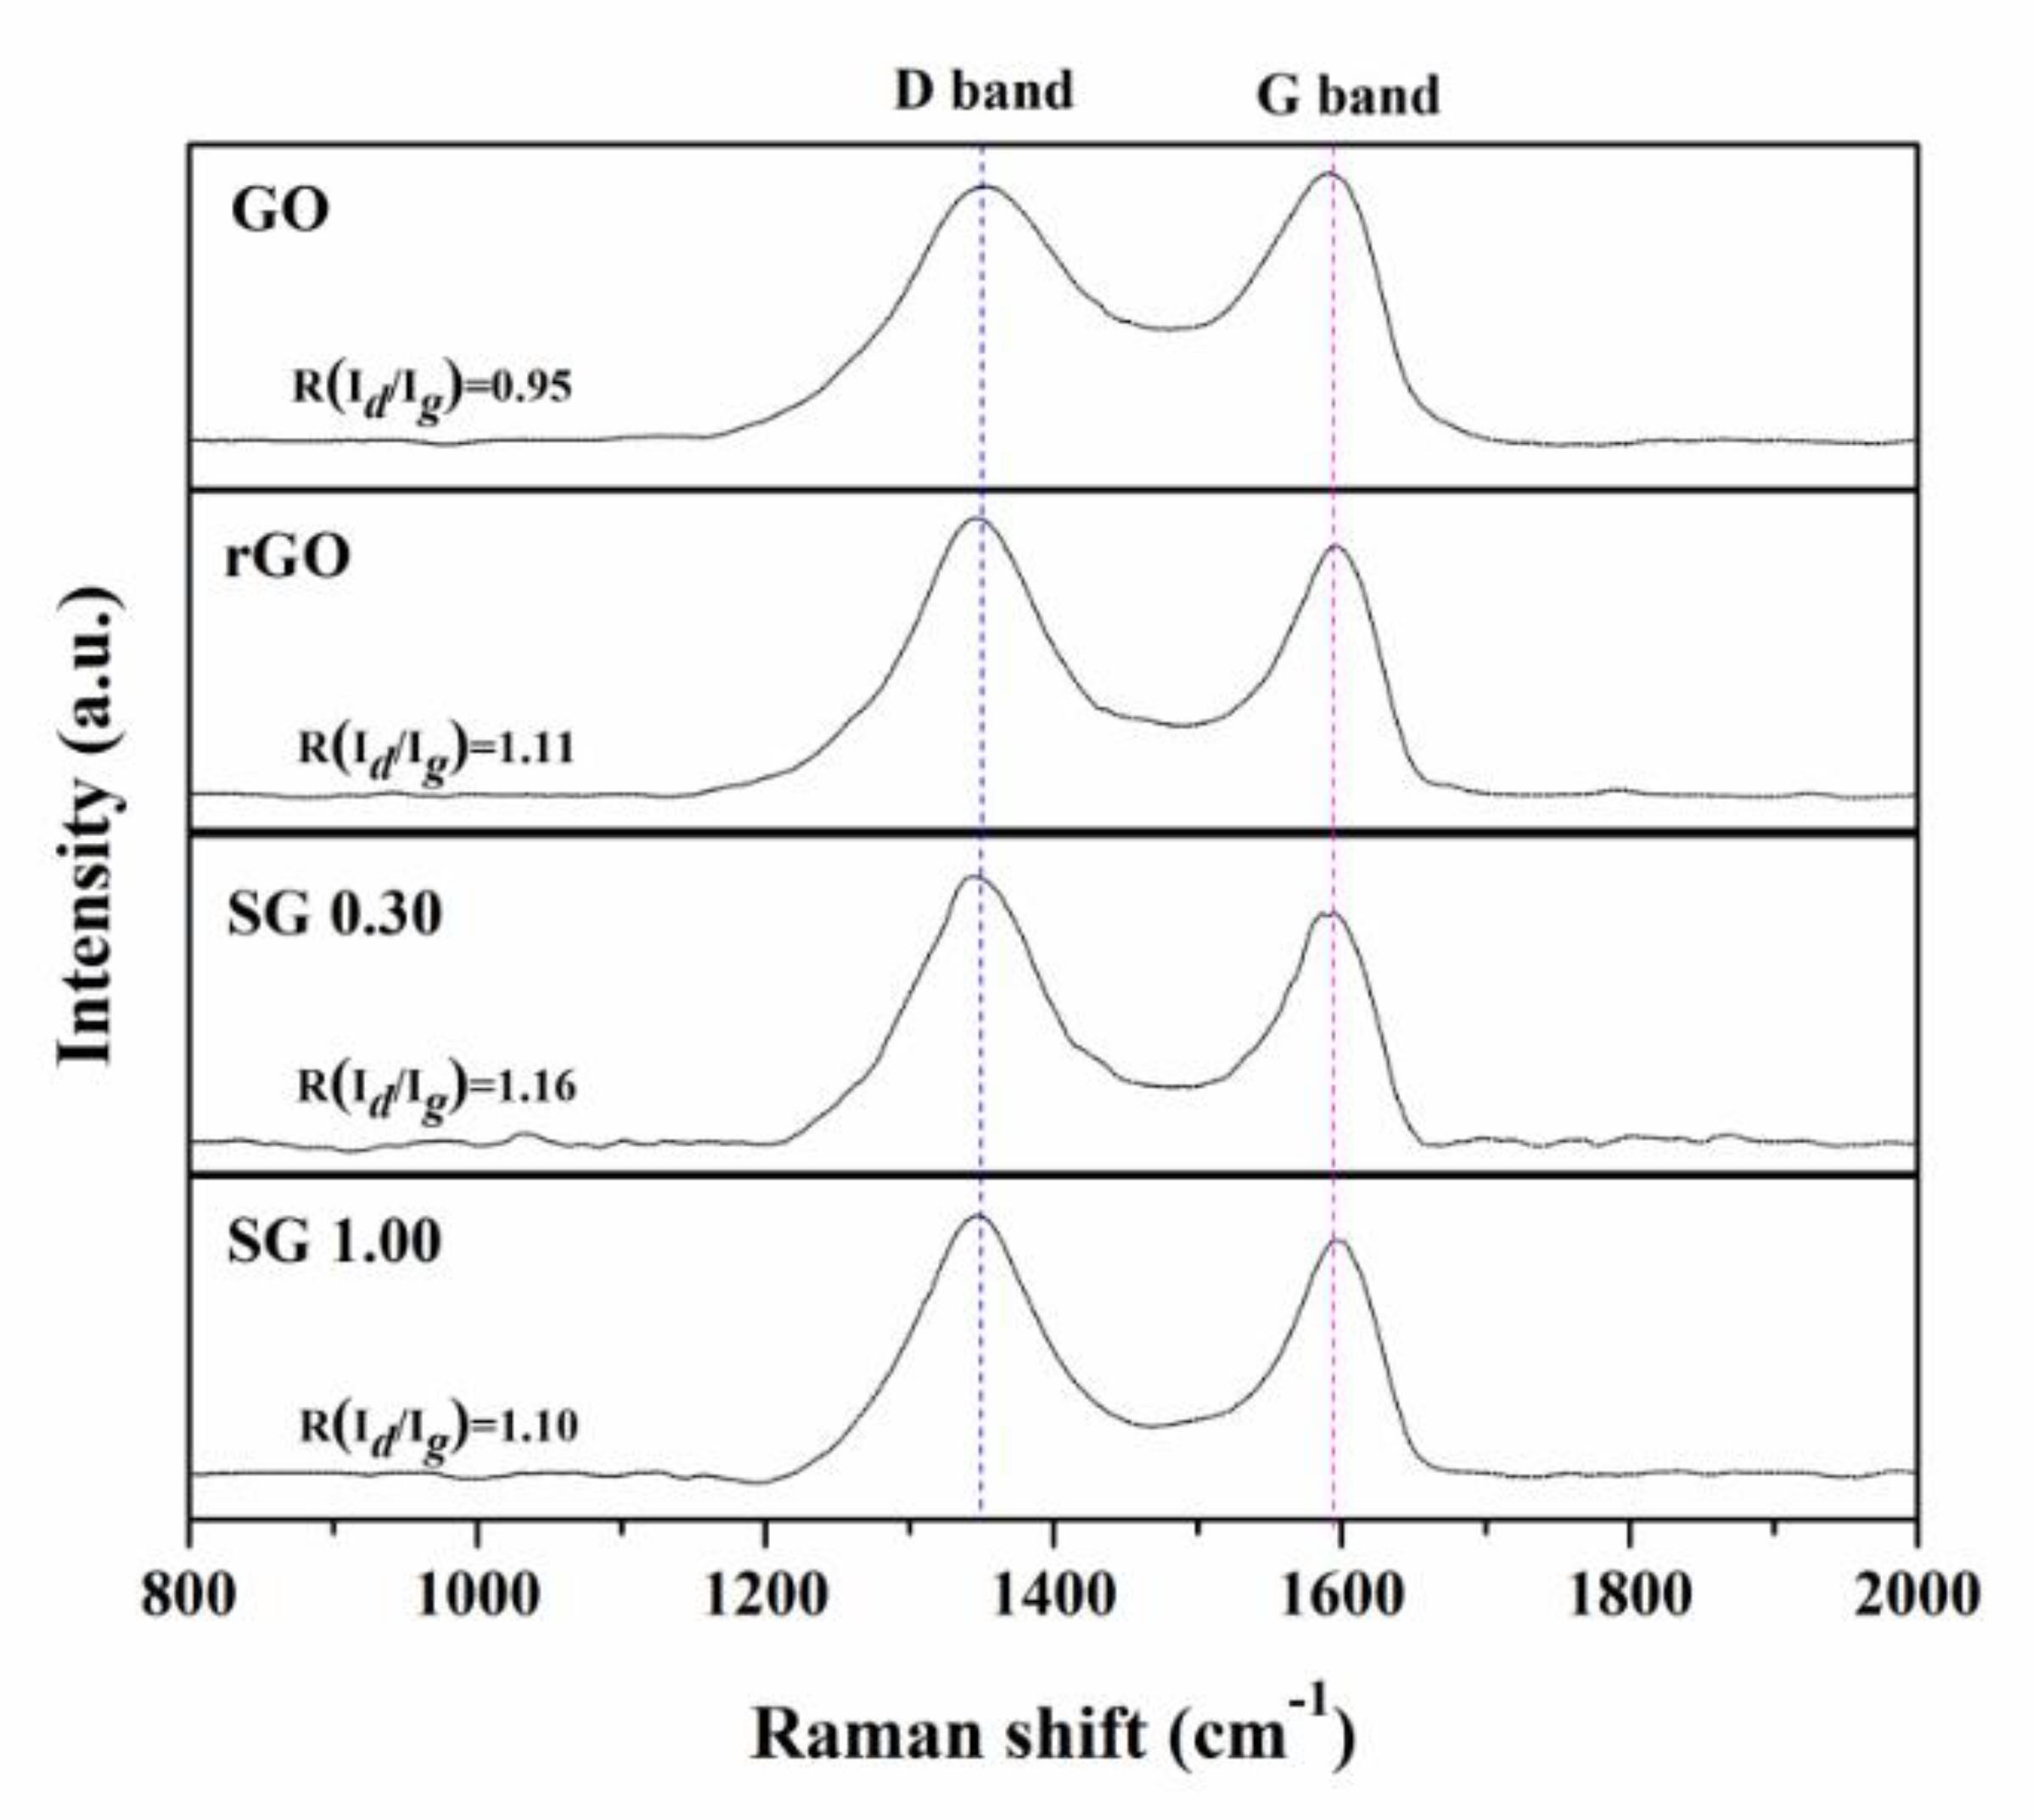
3.1. Characterizations of the Samples

The morphologies and nanostructures of the SiO2 and rGO/SiO2 nanocomposites were examined via FE-SEM and TEM. In Figure 1a,b, the primary SiO2 was a microsphere with a diameter of approximately 10 nm. Nanosilica could effectively reduce agglomeration by using the surface-active agent PEG2000. In Figure 1d, the TEM image clearly shows that the rGO/SiO2 composites had a spherical shell structure similar to a core–shell structure, and the inner layer of nanosilica was wrapped by the outer layer of graphene. A similar structure was observed in the SEM image in Figure 1c, where SiO2 was wrapped in graphene powder with a rough surface. The distributions of the elements in the SiO2 and rGO/SiO2 nanocomposites were determined by EDS, as shown in Figure 1. In the rGO/SiO2 composite, the weight percentages of C and Si were 11.09 and 37.33%, respectively.
Figure 2 shows the TG/DTA of the SiO2 and rGO/SiO2 samples. In regard to SiO2, the thermal decomposition temperature was 479 °C. Free water and CO2 in the pores or on the surface were first lost from 30 to 110 °C. Then, from 110 to 666 °C, the surface groups of silica gradually decomposed, and the reaction was exothermic. Next, from 666 to 720 °C, the reaction was exothermic, which might be because of the removal of the structural water by two Si-OH groups in the silica to form Si-O-Si bonds. Finally, from 720 to 800 °C, the silica continued to decompose. In regard to the rGO/SiO2 sample, the thermal decomposition temperature was 436 °C. The free water and CO2 in the pores or on the surface were lost from 30 to 100 °C, and the silica and rGO gradually decomposed from 100 to 800 °C.
The powder XRD patterns of the rGO, SiO2, and rGO/SiO2 samples are shown in Figure 3. SiO2 exhibited characteristic diffraction peaks at 2θ values of 23°, and rGO showed characteristic diffraction peaks at 2θ values of 43°. In the rGO/SiO2 sample, the same peaks were shown at 2θ values of 23° and 43°, confirming that the rGO/SiO2 composites were prepared successfully.
The nanopore structures were evaluated by nitrogen physical adsorption measurements at 77 K on the SiO2, GO, and rGO/SiO2 samples, as shown in Figure 4. The Brunner−Emmet−Teller (BET) specific surface areas of SiO2 and GO were 130 and 21 m2 g−1, respectively. After the composite was prepared, the BET specific surface area of the rGO/SiO2 samples was 54 m2 g−1. The adsorption total pore volumes of SiO2, GO, and rGO/SiO2 were 0.090, 0.016, and 0.113 cm3 g−1, respectively. The adsorption at P/P0 < 0.1 suggested the presence of micropores, and the adsorption at P/P0 > ~0.4 (to ~1) indicated the presence of stacked mesopores in the rGO/SiO2 samples. Therefore, the rGO/SiO2 sample had a porous structure with both micro- and meso-pores.
To characterize the bonding of the samples, XPS was used to study the functional groups on their surfaces. As shown in Figure 5a, the XPS spectra of GO, rGO, silica, SG 0.30, and SG 1.00 exhibited peaks at 531.9 (O 1s), 400.0 (N 1s), 284.4 (C 1s), and 102.8 eV (Si 2p), indicating the existence of silica on the surface. In Figure 5b, the XPS C 1s spectra of GO, rGO, SG 0.30, and SG 1.00 showed the presence of carbon functional groups, such as O-C=O, C-O-C, C-N, C-C, and C=C, in multiple chemical states and at various relative contents.
The water adsorption isotherms of SiO2, SG 0.30, and SG 1.00 at 298 K are shown in Figure 6. As shown in Figure 5a, the water adsorption of SiO2 was nearly complete up to P/P0~0.5. Both SG 0.30 and SG 1.00 exhibited water adsorption up to P/P0~1.0, which was caused by some exposed surfaces of SiO2 and the graphene-formed micropores, as shown in Figure 6b,c. On the surface of SG 0.30 and SG 1.00, there were C-C, C-O-C, C=C, C-N, and O-C=O groups, providing adsorption sites for water. However, in SG 1.00, excess rGO coated the SiO2 and decreased the number of adsorption sites, which might be the reason why the adsorption isotherm differed from that of SG 0.30. The water adsorption amounts were possibly related to the concentration of oxygen and nitrogen functional groups, such as C-O-C, C-N, and O-C=O, because these groups have the highest affinity toward water molecules [33]. SG 0.30 had a higher concentration of oxygen and nitrogen functional groups than SG 1.00; therefore, the amount of adsorbed water on SG 0.30 was higher than that on SG 1.00.
To investigate the effect of defects on the adsorption properties of the materials, Raman spectroscopy was used. The D band and G band were observed in all samples at shifts of 1350 and 1590 cm−1, respectively, representing disordered and ordered graphitic carbons. The ratio of the D band to G band intensity is shown in Figure 7. The ratio of Id/Ig is a sensitive characterization of the disorder of a tested sample, with higher values indicating a higher disorder and more obvious defects and voids. The number of defects of rGO and the rGO/SiO2 nanocomposites increased as GO was reduced. Compared with that of rGO and SG1.00, the highest Id/Ig was obtained with SG 0.30. It is possible that the abundant defects of SG 0.30 provided more adsorption sites for cationic NR adsorption.

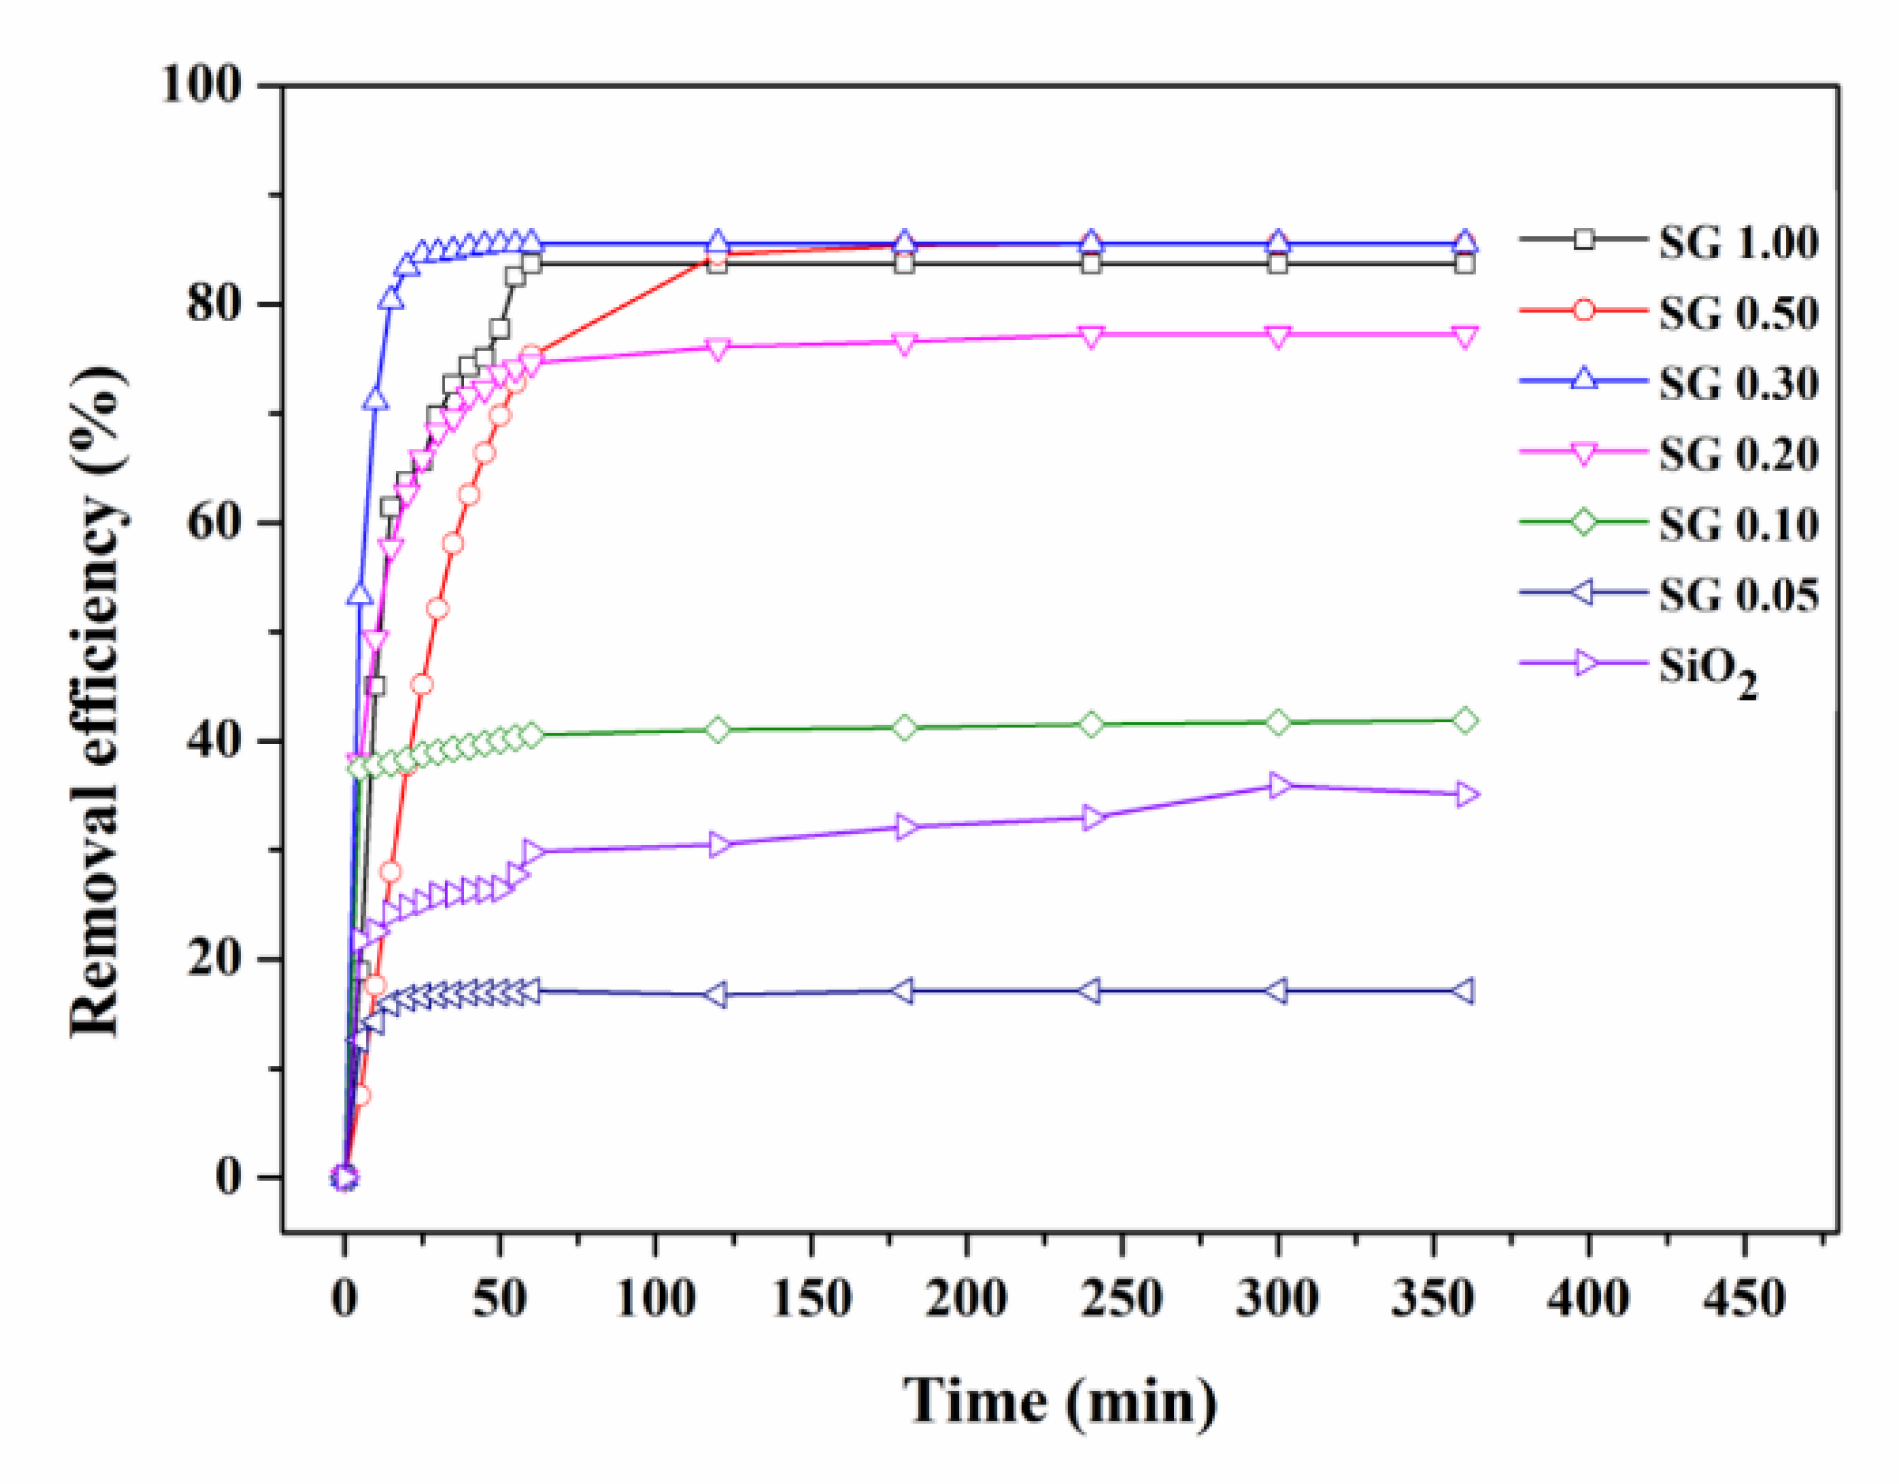
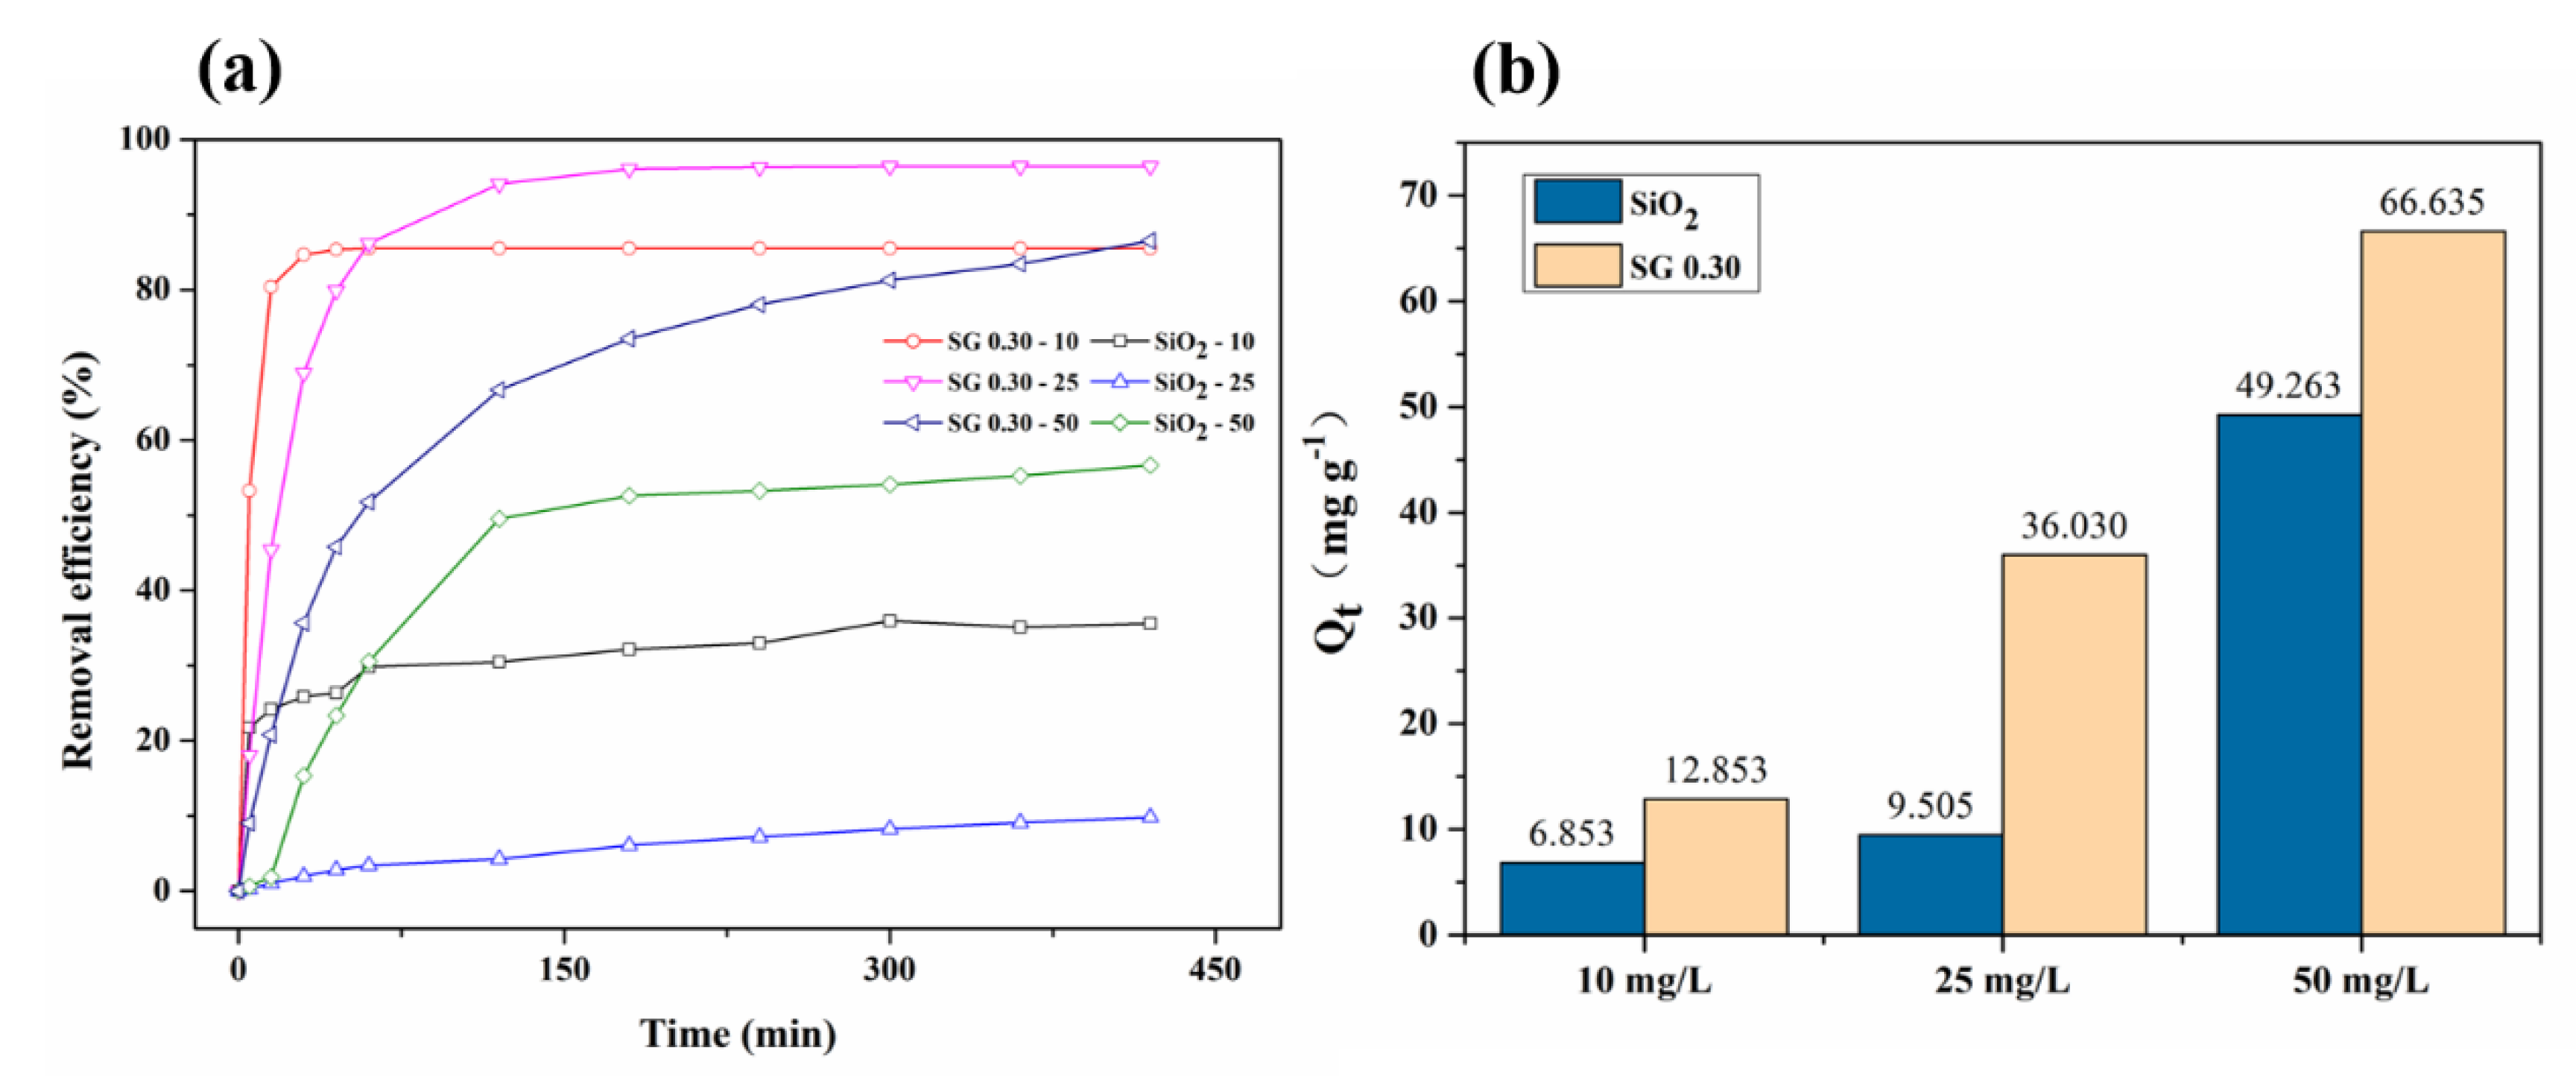
3.2. Adsorption Equilibrium and Kinetics of SiO2 and the rGO/SiO2 Composites

Herein, to investigate the removal ability of SiO2 and rGO/SiO2, we used NR adsorption (pH 5) at 298 K. The parameters of the pseudo-first-order kinetic and pseudo-second-order kinetic models are listed in Table 1 and Table 2, respectively. The correlation coefficients of the pseudo-second-order model are all higher than 0.920, and the pseudo-second-order model agrees well with the experimental values. Therefore, the adsorption of NR on SiO2 and rGO/SiO2 composites was more consistent with the pseudo-second-order kinetic model.
Figure 8 shows the effect of the ratio of GO and SiO2 on the adsorption rate of NR (C0 = 10 mg/L). For the samples at different ratios, the adsorption equilibrium with NR could be achieved within nearly 120 min, and no significant change was observed from 120 to 360 min. As the amount of rGO increased, the adsorption efficiency and adsorption capacity first increased and then decreased. Clearly, compared with the other samples, SG 0.30 was the first sample to reach adsorption equilibrium (30 min), and displayed the highest experimental adsorption amount (12.853 mg g−1). The reason the adsorption rate of SG 0.30 was faster than that of SG 0.50 and SG 1.00 might be that rGO and silica formed a better synergistic interaction to form more “core–shell” structures in SG 0.30. As the amount of rGO increased, excess rGO began to agglomerate, hindering the adsorption of NR and leading to a decrease in the adsorption rate. Moreover, the reason the adsorption capacity of SG 0.05 was lower than that of SiO2 might be the absence of a “core–shell” structure and the poor affinity of rGO toward organic contaminants [34].
To further test the adsorption property of SG 0.30, the concentration of NR was increased to 25 and 50 mg/L (pH = 5). For comparison, SiO2 was used as a reference. Figure 9a shows the removal efficiency and saturated amount of adsorbed NR at equilibrium for SiO2 and SG 0.30 versus the initial NR concentration at room temperature. At the same time, it was obvious that the removal efficiency of SG 0.30 was greater than that of SiO2. Figure 9b displays the saturated amount of adsorbed NR at equilibrium versus different initial NR concentrations (10, 25, and 50 mg/L) at room temperature. When compared, the experimental adsorption capacities of SG 0.30 were 1.876, 3.791, and 1.353 times higher than those of SiO2. In Table 3, the maximum adsorption amounts of the composites toward the adsorption of NR dye from the aqueous solution are compared with those of other adsorbents in the literature at room temperature. As clearly seen, the rGO/SiO2 nanocomposites in this study exhibited a superior adsorption capacity and have potential for use in the treatment of wastewater containing cationic NR dye.

4. Conclusions

In summary, a porous rGO/SiO2 nanocomposite was synthesized using a simple surface grafting method, which shows potential for mass production in industry. The obtained rGO/SiO2 nanocomposite had a porous structure containing micro- and meso-pores. Water vapor adsorption/desorption indicated that the oxygen and nitrogen functional groups, such as the C-C, C-O-C, C=C, C-N, and O-C=O groups on the surfaces of the nanocomposites, provided adsorption sites for water because of their high affinity toward water molecules. On the other hand, the synthesis of rGO/SiO2 nanocomposites exhibited a novel process for the fast liquid-phase removal of cationic neutral red (NR) dye at room temperature. Furthermore, rGO/SiO2 exhibited a higher adsorption capacity than SiO2 and other similar materials used for the removal of NR dye. Therefore, the rGO/SiO2 nanocomposites show potential for use in the treatment of wastewater containing dyes; however, the removal time, reaction conditions, and cost for contaminant treatment need to be optimized in future works.

Author Contributions

J.W. wrote the initial draft, and contributed to the experiments and the analysis of the data. T.C. designed the experiments and had the analysis of data and manuscript refinement. B.X. had discussions about the data. Y.C. contributed to the characterization. All authors have read and agreed to the published version of the manuscript.

Funding

This research received no external funding.

Conflicts of Interest

The authors confirm that the work has no conflicts of interest.

References

  1. Wang, Q.; Yang, Z. Industrial water pollution, water environment treatment, and health risks in China. Environ. Pollut. 2016, 218, 358–365. [Google Scholar] [CrossRef]
  2. Han, D.; Currell, M.J.; Cao, G. Deep challenges for China’s war on water pollution. Environ. Pollut. 2016, 218, 1222–1233. [Google Scholar] [CrossRef] [PubMed] [Green Version]
  3. Zhang, L.; Tu, L.-Y.; Liang, Y.; Chen, Q.; Li, Z.; Li, C.; Wang, Z.-H.; Li, W. Coconut-based activated carbon fibers for efficient adsorption of various organic dyes. RSC Adv. 2018, 8, 42280–42291. [Google Scholar] [CrossRef] [Green Version]
  4. Hameed, B.; Din, A.; Ahmad, A. Adsorption of methylene blue onto bamboo-based activated carbon: Kinetics and equilibrium studies. J. Hazard. Mater. 2007, 141, 819–825. [Google Scholar] [CrossRef] [PubMed]
  5. Alver, E.; Metin, A.Ü. Anionic dye removal from aqueous solutions using modified zeolite: Adsorption kinetics and isotherm studies. Chem. Eng. J. 2012, 200-202, 59–67. [Google Scholar] [CrossRef]
  6. Kesraoui-Ouki, S.; Cheeseman, C.R.; Perry, R. Natural zeolite utilisation in pollution control: A review of applications to metals’ effluents. J. Chem. Technol. Biotechnol. 1994, 59, 121–126. [Google Scholar] [CrossRef]
  7. Zhao, W.; Ma, W.; Chen, C.; Zhao, J.; Shuai, Z. Efficient Degradation of Toxic Organic Pollutants with Ni2O3/TiO2-xBxunder Visible Irradiation. J. Am. Chem. Soc. 2004, 126, 4782–4783. [Google Scholar] [CrossRef]
  8. Wang, L.; Wu, X.-L.; Xu, W.-H.; Huang, X.-J.; Liu, J.-H.; Xu, A.-W. Stable Organic–Inorganic Hybrid of Polyaniline/α-Zirconium Phosphate for Efficient Removal of Organic Pollutants in Water Environment. ACS Appl. Mater. Interfaces 2012, 4, 2686–2692. [Google Scholar] [CrossRef]
  9. Szczęśniak, B.; Choma, J.; Jaroniec, M. Gas adsorption properties of graphene-based materials. Adv. Colloid Interface Sci. 2017, 243, 46–59. [Google Scholar] [CrossRef]
  10. Liu, T.; Li, Y.; Du, Q.; Sun, J.; Jiao, Y.; Yang, G.; Wang, Z.; Xia, Y.; Zhang, W.; Wang, K.; et al. Adsorption of methylene blue from aqueous solution by graphene. Colloids Surfaces B: Biointerfaces 2012, 90, 197–203. [Google Scholar] [CrossRef]
  11. Zhao, G.; Li, J.; Ren, X.; Chen, C.; Wang, X. Few-Layered Graphene Oxide Nanosheets As Superior Sorbents for Heavy Metal Ion Pollution Management. Environ. Sci. Technol. 2011, 45, 10454–10462. [Google Scholar] [CrossRef] [PubMed]
  12. Wang, J.; Tao, Y. Removal of Formaldehyde from the Indoor Environment Using Porous Carbons and Silicas. Recent Innov. Chem. Eng. (Former. Recent Pat. Chem. Eng.) 2020, 13, 194–202. [Google Scholar] [CrossRef]
  13. Sutter, P.W.; Flege, J.-I.; Sutter, E.A. Epitaxial graphene on ruthenium. Nat. Mater. 2008, 7, 406–411. [Google Scholar] [CrossRef] [PubMed]
  14. Li, X.; Zhang, G.; Bai, X.; Sun, X.; Wang, X.; Wang, E.; Dai, H. Highly conducting graphene sheets and Langmuir–Blodgett films. Nat. Nanotechnol. 2008, 3, 538–542. [Google Scholar] [CrossRef] [PubMed] [Green Version]
  15. Annamalai, K.; Liu, L.; Tao, Y. Highly exposed nickel cobalt sulfide–rGO nanoporous structures: An advanced energy-storage electrode material. J. Mater. Chem. A 2017, 5, 9991–9997. [Google Scholar] [CrossRef]
  16. Annamalai, K.; Liu, L.; Tao, Y. Highly Nanoporous Nickel Cobaltite Hexagonal Nanostructure-Graphene Composites for the Next Generation Energy Storage/Conversion Devices. Adv. Mater. Interfaces 2017, 4, 1700219. [Google Scholar] [CrossRef]
  17. Geim, A.K. Graphene: Status and Prospects. Science 2009, 324, 1530–1534. [Google Scholar] [CrossRef] [Green Version]
  18. Kim, K.H.; Jun, Y.-S.; Gerbec, J.A.; See, K.A.; Stucky, G.D.; Jung, H.-T. Sulfur infiltrated mesoporous graphene–silica composite as a polysulfide retaining cathode material for lithium–sulfur batteries. Carbon 2014, 69, 543–551. [Google Scholar] [CrossRef] [Green Version]
  19. Li, L.; Wang, W.; Tang, J.; Wang, Y.; Liu, J.; Huang, L.-J.; Wang, Y.-X.; Tang, J.; Wang, J.; Shen, W.; et al. Classification, Synthesis, and Application of Luminescent Silica Nanoparticles: A Review. Nanoscale Res. Lett. 2019, 14, 190. [Google Scholar] [CrossRef]
  20. Supit, S.W.M.; Shaikh, F.U.A. Durability properties of high volume fly ash concrete containing nano-silica. Mater. Struct. 2015, 48, 2431–2445. [Google Scholar] [CrossRef]
  21. Paris, J.L.; Colilla, M.; Izquierdo-Barba, I.; Manzano, M.; Vallet-Regí, M. Tuning mesoporous silica dissolution in physiological environments: A review. J. Mater. Sci. 2017, 52, 8761–8771. [Google Scholar] [CrossRef] [Green Version]
  22. Watcharotone, S.; Dikin, D.A.; Stankovich, S.; Piner, R.; Jung, I.; Dommett, G.H.B.; Evmenenko, G.; Wu, S.-E.; Chen, S.-F.; Liu, C.-P.; et al. Graphene−Silica Composite Thin Films as Transparent Conductors. Nano Lett. 2007, 7, 1888–1892. [Google Scholar] [CrossRef] [PubMed]
  23. Gadipelli, S.; Guo, Z.X. Graphene-based materials: Synthesis and gas sorption, storage and separation. Prog. Mater. Sci. 2015, 69, 1–60. [Google Scholar] [CrossRef] [Green Version]
  24. Song, W.-L.; Guan, X.-T.; Fan, L.; Zhao, Y.-B.; Cao, W.-Q.; Wang, C.-Y.; Cao, M. Strong and thermostable polymeric graphene/silica textile for lightweight practical microwave absorption composites. Carbon 2016, 100, 109–117. [Google Scholar] [CrossRef] [Green Version]
  25. Varghese, S.S.; Lonkar, S.P.; Singh, K.; Swaminathan, S.; Abdala, A.A. Recent advances in graphene based gas sensors. Sens. Actuators B: Chem. 2015, 218, 160–183. [Google Scholar] [CrossRef]
  26. Su, S.; Chen, B.; He, M.; Hu, B. Graphene oxide–silica composite coating hollow fiber solid phase microextraction online coupled with inductively coupled plasma mass spectrometry for the determination of trace heavy metals in environmental water samples. Talanta 2014, 123, 1–9. [Google Scholar] [CrossRef]
  27. Wang, X.; Lu, M.; Wang, H.; Pei, Y.; Rao, H.; Du, X. Three-dimensional graphene aerogels–mesoporous silica frameworks for superior adsorption capability of phenols. Sep. Purif. Technol. 2015, 153, 7–13. [Google Scholar] [CrossRef]
  28. Gu, F.; Liang, M.; Han, D.; Wang, Z. Multifunctional sandwich-like mesoporous silica–Fe3O4–graphene oxide nanocomposites for removal of methylene blue from water. RSC Adv. 2015, 5, 39964–39972. [Google Scholar] [CrossRef]
  29. Li, W.; Liu, W.; Wang, H.; Lu, W. Preparation of Silica/Reduced Graphene Oxide Nanosheet Composites for Removal of Organic Contaminants from Water. J. Nanosci. Nanotechnol. 2016, 16, 5734–5739. [Google Scholar] [CrossRef]
  30. Marcano, D.C.; Kosynkin, D.V.; Berlin, J.M.; Sinitskii, A.; Sun, Z.; Slesarev, A.; Alemany, L.B.; Lu, W.; Tour, J.M. Improved Synthesis of Graphene Oxide. ACS Nano 2010, 4, 4806–4814. [Google Scholar] [CrossRef]
  31. Ezzati, R. Derivation of Pseudo-First-Order, Pseudo-Second-Order and Modified Pseudo-First-Order Rate Equations from Langmuir and Freundlich isotherms for adsorption. Chem. Eng. J. 2020, 392, 123705. [Google Scholar] [CrossRef]
  32. Ho, Y.S.; McKay, G. Pseudo-second order model for sorption processes. Process. Biochem. 1999, 34, 451–465. [Google Scholar] [CrossRef]
  33. Liu, L.; Tan, S.J.; Horikawa, T.; Do, D.D.; Nicholson, D.; Liu, J. Water adsorption on carbon—A review. Adv. Colloid Interface Sci. 2017, 250, 64–78. [Google Scholar] [CrossRef] [PubMed]
  34. Ersan, G.; Apul, O.G.; Perreault, F.; Karanfil, T. Adsorption of organic contaminants by graphene nanosheets: A review. Water Res. 2017, 126, 385–398. [Google Scholar] [CrossRef]
  35. Wang, W.; Li, C.; Yao, J.; Zhang, B.; Zhang, Y.; Liu, J. Rapid adsorption of neutral red from aqueous solutions by Zn3[Co(CN)6]2.nH2O nanospheres. J. Mol. Liq. 2013, 184, 10–16. [Google Scholar] [CrossRef]
  36. Luo, P.; Zhao, Y.; Zhang, B.; Liu, J.; Yang, Y.; Liu, J. Study on the adsorption of Neutral Red from aqueous solution onto halloysite nanotubes. Water Res. 2010, 44, 1489–1497. [Google Scholar] [CrossRef]
  37. Iram, M.; Guo, C.; Guan, Y.; Ishfaq, A.; Liu, H. Adsorption and magnetic removal of neutral red dye from aqueous solution using Fe3O4 hollow nanospheres. J. Hazard. Mater. 2010, 181, 1039–1050. [Google Scholar] [CrossRef]
  38. Fathy, N.; El-Khouly, S.; Ahmed, S.; El-Nabarawy, T.; Tao, Y. Superior adsorption of cationic dye on novel bentonite/carbon composites. Asia Pac. J. Chem. Eng. 2020, 2586. [Google Scholar] [CrossRef]
  39. Zhang, L.J.; Ma, D.; Mao, G.Y.; Zhang, M.M.; Han, R.P. Adsorption of Neutral Red from Solution by Bio-Chars Produced from Pyrolysis of Wheat Straw. Adv. Mater. Res. 2011, 322, 72–76. [Google Scholar] [CrossRef]
  40. Zou, W.; Han, P.; Li, Y.; Liu, X.; He, X.; Han, R. Equilibrium, kinetic and mechanism study for the adsorption of neutral red onto rice husk. Desalin. Water Treat. 2009, 12, 210–218. [Google Scholar] [CrossRef]
  41. Çoruh, S.; Geyikçi, F.; Elevli, S. Adsorption of Neutral Red Dye from an Aqueous Solution onto Natural Sepiolite Using Full Factorial Design. Clays Clay Miner. 2011, 59, 617–625. [Google Scholar] [CrossRef]
  42. Liu, R.; Fu, H.; Lu, Y.; Yin, H.; Yu, L.; Ma, L.; Han, J. Adsorption Optimization and Mechanism of Neutral Red Onto Magnetic Ni0.5Zn0.5Fe2O4/SiO2 Nanocomposites. J. Nanosci. Nanotechnol. 2016, 16, 8252–8262. [Google Scholar] [CrossRef]
  43. Han, R.; Han, P.; Cai, Z.; Zhao, Z.; Tang, M. Kinetics and isotherms of Neutral Red adsorption on peanut husk. J. Environ. Sci. 2008, 20, 1035–1041. [Google Scholar] [CrossRef]
  44. Aboelenin, R.M.; Kheder, S.; Farag, H.K.; El Nabarawy, T. Removal of Cationic Neutral Red Dye from Aqueous Solutions using Natural and Modified Rice Straw. Egypt. J. Chem. 2017, 60, 577–589. [Google Scholar] [CrossRef] [Green Version]
Scheme 1. Illustration showing the formation process of the rGO/SiO2 composites as a functional adsorbent for the removal of neutral red (NR).
Applsci 10 08529 sch001
Figure 1. (a) SEM image of SiO2 and (b) TEM image of SiO2. (c) SEM image of the rGO/SiO2 nanocomposite and (d) TEM image of the rGO/SiO2 nanocomposite.
Applsci 10 08529 g001
Figure 2. Thermogravimetric (TG)/differential thermal analysis (DTA) of the (a) SiO2 and (b) rGO/SiO2 samples.
Applsci 10 08529 g002
Figure 3. XRD patterns of the rGO, SiO2, and rGO/SiO2 samples.
Applsci 10 08529 g003
Figure 4. Nitrogen adsorption/desorption isotherms of the SiO2, GO and rGO/SiO2 samples at 77 K.
Applsci 10 08529 g004
Figure 5. (a) XPS survey spectra of GO, rGO, silica, SG 0.30, and SG 1.00 and (b) XPS C 1s spectra of GO, rGO, SG 0.30, and SG 1.00.
Applsci 10 08529 g005
Figure 6. Water adsorption/desorption isotherms of the (a) SiO2, (b) SG 0.30, and (c) SG 1.00 samples at 298 K.
Applsci 10 08529 g006
Figure 7. Raman spectra of GO, rGO, SG 0.30, and SG 1.00.
Applsci 10 08529 g007
Figure 8. Effect of the ratio of GO and SiO2 on the adsorption rate of NR (C0 = 10 mg/L).
Applsci 10 08529 g008
Figure 9. (a) Removal efficiency of SiO2 and rGO/SiO2 with different initial concentrations of NR. (b) Plot of the saturated amount of adsorbed NR at equilibrium versus the initial concentration at room temperature.
Applsci 10 08529 g009
Table 1. Pseudo-first-order kinetic parameters for the adsorption of neutral red at various initial concentrations.
10 mg/L NR
K1 (g mg−1 min−1)Qe(theo) (mg g−1)Qe(exp) (mg g−1)R2
SiO20.001833.087746.8530.88963
SG 0.050.066630.546232.5640.88130
SG 0.100.015380.948186.2330.92896
SG 0.200.049935.5959911.4150.96972
SG 0.300.2566623.3290612.8530.96010
SG 0.500.0429517.4479112.7540.99298
SG 1.000.0590511.4216412.5550.84625
25 mg/L NR
SiO20.000936.747969.5050.98911
SG 0.300.0337529.6099436.0300.98066
50 mg/L NR
SiO20.0025627.6664449.2630.84640
SG 0.300.0076149.1452466.6350.97839
Table 2. Pseudo-second-order kinetic parameters for the adsorption of neutral red at various initial concentrations.
10 mg/L NR
K2 (g mg−1 min−1)Qe(theo) (mg g−1)Qe(exp) (mg g−1)R2
SiO20.002177.0246.8530.98982
SG 0.050.375912.5732.5640.99989
SG 0.100.109846.2866.2330.99993
SG 0.200.0182711.83411.4150.99985
SG 0.300.0338713.44112.8530.99829
SG 0.500.0033314.40112.7540.99255
SG 1.000.0062914.48912.5550.99234
25 mg/L NR
SiO20.0001511.0519.5050.92476
SG 0.300.0015139.54136.0300.99604
50 mg/L NR
SiO20.0002650.83949.2630.99934
SG 0.300.0002672.99366.6350.99945
Table 3. Maximum adsorption amounts of various adsorbents toward the removal of NR dye from the aqueous solution at room temperature.
AdsorbentMaximum Adsorption Capacity (mg/g)Initial Concentration of NR (mg/L)Ref.
rGO/SiO2 nanocomposites66.63550This study
Zn3[Co(CN)6]2.nH2O nanospheres24.0650[35]
Halloysite nanotubes24.9650[36]
Fe3O4 hollow nanospheres29.550[37]
Bentonite/carbon composites4650[38]
Biochar14.580[39]
Rice husk26.5100[40]
Natural sepiolite36.32100[41]
Ni0.5Zn0.5Fe2O4/SiO2 Nanocomposites39.95100[42]
Peanut husk35.1150[43]
Urea-treated colloidal carbon52200[44]
Publisher’s Note: MDPI stays neutral with regard to jurisdictional claims in published maps and institutional affiliations.

