Abstract
Air pollution is a prominent problem all over the world, seriously endangering human life. To protect the environment and human health, timely and accurate air quality evaluations are imperative. Recently, with the increasing focus on air pollution, an evaluation tool that can offer intuitive air quality information is especially needed. Though the Air Quality Index (AQI) has played this role over the years, its intrinsic limitations discussed in this study (sharp boundary, biased evaluation, conservative strategy and incomplete criterion) are gradually apparent, limiting its air quality evaluation capability. Therefore, a novel paradigm, the Air Quality Fuzzy Comprehensive Evaluation (AQFCE), is proposed. In the preprocessing module, missing and reversal data are handled by a least square piecewise polynomial fitting and linear regression. An improved fuzzy comprehensive evaluation model is adopted to solve the AQI’s above limitations in the evaluation module. The early warning module provides a timely alert and recommendation. To validate the performance of the AQFCE, Beijing, Shanghai and Xi’an in China are selected for case studies, and daily and hourly concentration data of six conventional air pollutants from September 2018 to August 2019 are employed. For daily reports, the AQFCE and AQI have a high consistent rate and correlation coefficient regarding chief pollutants and levels, respectively, while examples show the level of the AQFCE is more reasonable. For hourly reports, AQI has antinomies and cannot reflect actual pollution, but the AQFCE is still effective. Current major pollutants, “weekend and holiday effect” and “peak type” of pollution are also revealed by the AQFCE. Experiment results prove that the AQFCE is accurate under different pollution conditions and an important supplement to the AQI. Furthermore, the AQFCE can provide health guideline for the public and assist the government in making environmental decisions and development policies.
1. Introduction
In recent years, with the improvement of living standards, people have begun to pay more attention to the living environment and health. Air is an indispensable factor for human survival, and air quality is closely related to human health. However, air pollution is always an anxiety for many countries, which has become the focus of the world [1,2,3,4,5]. To understand the air quality information intuitively, air pollutant concentration can be simplified to a dimensionless index according to the impact on human health and the environment by the Air Quality Index (AQI). The US Environmental Protection Agency firstly proposed the Pollution Standards Index (PSI) in 1976 and renamed it the AQI after revision in 1999 [6]. The European Union (EU) has begun to support the project of Common Information to European Air (CITEAIR) from March 2004, and the Common Air Quality Index (CAQI) was subsequently developed to support European cities to reach the air quality standard [7]. In 2012, the Ministry of Environmental Protection of China also issued the “Ambient Air Quality Standards” and “Technical Regulation on Ambient Air Quality Index (on trial)”, which came into force in 2016 [8]. Although the AQI has been adopted by many countries and under implementation for many years, its limitations are gradually prominent with the increasingly higher demand for precision in air quality evaluation and pollution control. For example, actual air quality depends on the integrated effects of all air pollutants but the evaluation result of the AQI is decided only by the pollutant with the highest subindex. Thus, the evaluation based on the most severe pollutant may overestimate total pollution and bring unnecessary social panic and economic loss from severer control measures, which is biased and too conservative.
Therefore, some scholars tried to develop new methods. Plaia et al. [9] proposed a multisite-multipollutant AQI, which considers the conjoint effect of pollutants. Sowlat et al. [10] developed a fuzzy-based AQI, and a fuzzy inference system evaluates the impacts of ten pollutants. Moreover, a traffic AQI was established by Bagieński for assessing air quality near roadways [11]. Others have also made attempts to either revise the AQI or propose a new index [12,13,14,15,16,17,18]. However, these new methods have their shortcomings and do not deal with AQI limitations well. Revisions based on the similar principle of AQI cannot avoid its intrinsic limitations. The sharp boundary in classification is not reasonable enough, and a biased and conservative evaluation will overstate real pollution [6,9,10,12,19,20,21]. The evaluation result is highly sensitive to the calculation grid, and it is not suitable for distinct models to share the same calculation grid. So, designing a calculation grid that is scientific and compatible with the algorithm is necessary, but there are few relevant studies. It is essential to compare the new method with the accepted AQI in theory and practice, but it is scarce in previous studies. Furthermore, previous methods are too complicated to be used in practice.
Based on the above, an improved air quality evaluation method named Air Quality Fuzzy Comprehensive Evaluation (AQFCE) including preprocessing, evaluation and early warning is proposed in this study. In the preprocessing module, the abnormal data of air pollutants are handled by a least square piecewise polynomial fitting and linear regression. In the evaluation module, the limitations of the AQI (sharp boundary, biased evaluation, conservative strategy and incomplete criterion) are concluded based on sufficient comparison and analysis, and then, inspired by fuzzy math theory, a series of targeted solutions are proposed. Concretely, membership degree can deal with the ambiguity of data near the classification boundary. For the biased evaluation and overly conservative strategy, a principal factor prominent model considering the membership degree and factor weight of all pollutants is adopted to ensure both comprehensive evaluation and public health at the same time. A complete calculation grid based on scientific evidence is established to improve the original evaluation criterion. Moreover, according to the evaluation result, the early warning module can release comprehensive information in a timely manner about air pollution and offer suggestions for the public and government.
2. Current AQI
2.1. Calculation Method of AQI
Although the methods of calculating AQI may be slightly different in form among different countries, they are essentially same with linear interpolation between the class borders [19] and the pollutant with the highest subindex decides both the level of air quality and chief pollutant:
where:
: the subindex of the th pollutant;
: the concentration of the th pollutant;
(): the concentration breakpoint that is ≥ (≤) ;
(): the index breakpoint corresponding to ().
2.2. Calculation Criterion of AQI
Criterion, namely the calculation grid, is composed of pollutant concentration limits. It depends on specific requirement of air quality and is in accordance with local economic development and pollution control capacity. Therefore, criteria vary among regions and Table 1 presents their comparison in three representative regions: the European Union (EU), United States of America (USA) and China (CHN) [7,22,23]. As illustrated by Table 1, there are big differences in some aspects including level, period and limit value. The EU has five concise levels, but there are six levels and level VI still has two sublevels in the USA and CHN, which seem to be redundant. Six conventional pollutants are necessary items in air quality evaluation, so three criteria reach an agreement on pollutants but differ greatly in terms of the period. In addition, apart from PM2.5 and PM10, the EU has no daily criteria for other pollutants. The USA has neither daily criterion for NO2 nor hourly criteria for CO, PM2.5 and PM10, while CHN has a shortage of hourly limits of particulate matters. Furthermore, the maximum 8 h moving average of CO (EU, USA) and O3 (USA, CHN) are used for daily evaluations. At present, daily and hourly reports of air quality are primary tasks, but generally incompleteness and misuse exist in all criteria. As to limit value, the USA and CHN are relatively close to each other. At the same level, daily limits of CHN are close to or higher than that of the USA, which is similar for hourly limit. However, the EU has the most stringent criterion where all limits are far lower than that of the USA and CHN, which greatly protects public health and ecological environment.

Table 1.
The comparison of criterion in EU, USA and CHN.
2.3. Limitations of AQI
AQI has made remarkable contributions to air quality evaluation, which deserves affirmation indeed. However, at the same time its limitations exist objectively:
- (1)
- Like all environmental quality evaluations, air quality evaluations are also full of ambiguities involving the evaluation object, factor, method, criterion and so forth. The sharp boundary adopted by the AQI in the classification scheme may not be reasonable [10,12,24,25]. A tiny difference (slight variation, monitoring error) of concentration near the boundary can lead to distinct evaluation results, and consequently the public and government may have to take totally different measures facing almost the same state of air, which is unnecessary.
- (2)
- Actual air quality is decided by combined effects of various air pollutants, and six conventional pollutants have been included in monitoring. However, in the evaluation process of the AQI, as illustrated by Equation (2), the pollutant with the highest subindex determines air quality level alone, ignoring all other pollutants [6,9,19,20]. Furthermore, Equation (1) clearly shows that the subindex of pollutants is calculated separately according to its own criterion, lacking comparisons of relative hazards among different pollutants, which is insufficient.
- (3)
- The overly conservative strategy adopted by the AQI does not mean the optimal solution [6,9,10,19,20]. Representing total air quality only by the chief pollutant will overestimate actual pollution, which means a series of stricter and unified prevention measures such as closing schools, vehicle restrictions, stopping or limiting production in industrial enterprise, etc. However, in fact, sensitive groups vary in specific pollutants and the conservative strategy could lead to unnecessary economic loss, social disorder and public panic. Therefore, a more accurate and comprehensive method is needed.
- (4)
- Calculation criterion of the AQI proposed many years ago requires further improvements. Pollutant concentration limits should not be constant forever because they need to match the changing requirements of air quality and pollution control capability. Incomplete criterion cannot meet various tasks of air quality evaluation [26,27].
3. The Air Quality Fuzzy Comprehensive Evaluation (AQFCE) Paradigm
3.1. Preprocessing Module of AQFCE
Here, for concentration data of air pollutants, missing data and reversal data are defined as abnormal data. Missing data are usually due to routine maintenance of monitoring instrument (zero calibration and criterion calibration), communication failure and power failure [28]. Reversal data mean that the concentration of PM2.5 which belongs to a part of PM10 is higher than that of PM10 in the same sampling site and time. There is no uniform rule on automatic monitoring methods of PM2.5 and PM10 internationally, and thus distinct monitoring methods of PM2.5 and PM10 could result in this phenomenon especially under higher relative humidity. The integrity and accuracy of data are crucial for air quality evaluation, and abnormal data can lead to questionable and useless results. Nevertheless, there is little attention paid to the abnormal data though they are very common and unavoidable in monitoring data. Therefore, in the preprocessing module, abnormal data processing algorithms are proposed.
- (1)
- For missing data, the deletion method will lose useful information and break the continuity of time series. Interpolation is the most frequently used method, but it is not applicable to data of air pollutant concentration which are highly nonlinear and nonstationary. No matter which interpolation method is selected, its ability of processing such data is limited by the essence of interpolation. Although the interpolation curve is through the known data points, there are problems of bigger errors on unknown data points and the poor capability of extrapolation. In contrast, curve fitting does not go through known data points and approaches the overall trend of data with the minimum error, offering a reasonable solution with better physical meaning. Therefore, for a single pollutant, least square polynomial fitting is recommended to deal with missing data and piecewise fitting is employed during the whole process. The fitting results are acquired based on the least root mean square error and the best determination coefficient and approved by a significant test (95% confidence level).
- (2)
- For reversal data of particulate matter, it is necessary to understand the cause [29]. Take China for example—PM10 was included in the ambient air quality monitoring network far earlier than PM2.5 and there are differences in monitoring methods. Measurement errors caused by the loss of volatile components in PM10 when heating samples are unavoidable for the old Tapered Element Oscillating Microbalance (TEOM) and β-ray methods which have been used until now. Comparatively, new tapered element oscillating microbalance with a Filter Dynamic Measurement System (TEOM + FDMS) and β-ray with a Dynamic Heating System (β-ray + DHS), which have the calibration of temperature and humidity as well as the compensation of volatile components, can ensure accurate results of PM2.5. As a part of PM10, PM2.5 accounts for 50%~80% according to Air Quality Guidelines of the WHO and PM10 is highly related to PM2.5. Least square linear regression is recommended for reversal data of particulate matter and piecewise regression is adopted in the whole process. Normal and paired PM2.5 and PM10 near reversal data are treated as the independent variable and dependent variable to obtain the regression equation which is then used to correct reversal data. The regression result has a high determination coefficient (>0.8) and is approved by a significance test (95% confidence level).
3.2. Evaluation Module of the AQFCE
Based on the comprehensive consideration about the limitations of AQI and current air pollution, an improved air quality evaluation model is needed. Air quality is a huge and ambiguous system with a large number of uncertain factors, so fuzzy math is chosen as the solution [30]. Fuzzy math can effectively reduce impacts of a sharp boundary on evaluation results, and the combination of membership degree and factor weight can eliminate subjective factors in classification, providing an objective and comprehensive evaluation. In recent years, although some attempts related to fuzzy math have been made in the field of environmental evaluation [31,32,33,34], these methods are either too complicated or too simple to be popularized in practice. There is seldom targeted and comprehensive research about air quality evaluations too. In fact, a fuzzy math model with deep customization can not only have more accurate and comprehensive evaluation result but can be as practical and convenient as the AQI, which is exactly what the present study focuses on.
- (1)
- Factor set
As the evaluation object, air quality is influenced by various air pollutants such as sulfur oxides, nitrogen oxides, particulate matters and so forth, which are treated as evaluation factors and selected. Based on the international consensus on conventional air pollutants, SO2, NO2, CO, O3, PM2.5 and PM10 are chosen for current air quality evaluation, and other pollutants can be added to our model immediately if necessary in future. The factor set composed of six factors is shown as follows:
- (2)
- Evaluation set
The evaluation set means the classification of air quality, and it has a corresponding calculation criterion which is similar to that of the AQI. The calculation grid ought to accord with the local situation and the algorithm adopted in the evaluation process. It is really significant because an inappropriate calculation grid will lead to questionable evaluation results, and it is also unsuitable for different algorithms to adopt the same calculation grid. Take China as an example—its calculation grid is in need of revisions for following reasons: Firstly, according to the Annual Bulletin on China’s Environmental State of the last eight years [35], there have been tremendous changes in many aspects including industrial structure, pollution source, air quality and pollution control capacity, which means the current calculation grid released in 2012 is no longer applicable for present and future air quality evaluation and management. Secondly, there are too many levels concerned with pollution to distinguish in the current criterion: light pollution, moderate pollution, serious pollution and severe pollution (two sublevels). This is confusing for the general public and, with increasing attention and demand on air quality, a clearer and stricter version is imperative. Thirdly, an air quality report consists of a daily report and hourly report, which ought to be separated and follow diverse concentration limits, but there is incompleteness and misuse in the current criterion (Table 1). Hourly reports of PM2.5 and PM10 have to follow their daily concentration limits, respectively, leading to severely overrated particulate pollution. Similarly, hourly reports of SO2 will result in an overestimated evaluation result when its concentration is higher than 800 ug/m3 and an underestimation of a daily report of O3 when the concentration is higher than 800 ug/m3. These problems are not accepted and need corrections immediately. Finally, criterion should be compatible with a specific algorithm. Fuzzy math and the AQI have totally different algorithms, and the fuzzy math model (comprehensive strategy) tends to show a lower level of air quality compared with the AQI (conservative strategy) under the same conditions. Therefore, a stricter criterion is also favorable to the smooth transition from the AQI to AQFCE in practice.
To revise the original calculation criterion, authoritative and instructive literature including the Air Quality Guidelines of the WHO, Directive on Ambient Air Quality and Cleaner Air for Europe, Explanation of Ambient Air Quality Standards for China, documents of the AQI for the EU, USA, UK and CHN and Annual Bulletin on China’s Environmental State and Monthly Report on Urban Air Quality have been referenced [7,22,23,35,36,37,38,39,40], which provides tremendous medical and statistical evidence about the effects of air pollutants on human health and regional air quality features. Ratios of limit values in criteria of the EU, USA, UK and CHN have also been referenced, especially in these cases: one pollutant at the same level in different periods, one pollutant at different levels in the same period and PM2.5 and PM10 at the same level and period. Consequently, a new calculation grid for China (for the fourth limitation of the AQI) which focuses on health and environmental impacts is proposed (Table 2). In the new calculation grid, most values have clear sources and others are obtained by existing values and ratios. The evaluation set comprises five levels and corresponding air quality categories are “Excellent, Good, Moderate, Poor, Hazardous”:
Table 2.
A new calculation grid for China.
- (3)
- Fuzzy matrix
Membership degree is the basic idea of fuzzy math and is objectively existent. It can be denoted by , which means the membership degree of factor aiming at the comment . Membership degree is an effective solution to the problem of data near boundary (for the first limitation of the AQI). For air quality evaluation, a pollutant concentration value can belong to both possible levels to various extents rather than be defined as only one certain level, and further membership degree will be combined with factor weight to make a comprehensive evaluation. The membership function can calculate the membership degree of pollutant concentration to the evaluation level. Commonly employed membership functions include the rectangular distribution function, Cauchy distribution function, Gauss distribution function, ridge distribution function, K-order parabolic distribution function, etc. In view of this evaluation object, factor and criterion, the trapezoid-triangle distribution function is adopted in this study. Details are presented as Equations (4)–(6) and Figure 1.
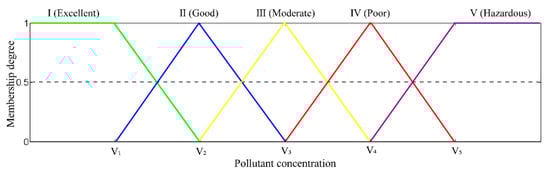
Figure 1.
Membership function of air pollutant concentration.
The fuzzy matrix can be expressed by the matrix :
- (4)
- Factor weight
Hazard of each evaluation factor needs to be quantified and compared, and a proper weighting method can calculate the weight of factor, namely its relative hazard on air quality. The multiple super-scale weighting method is a frequently used method in environment quality evaluations [33], but it can be further improved. Generally, there are some concentration limits (mainly higher value) without definite scientific bases in the calculation grid, which will significantly influence the evaluation result. Thus, the consideration of all limits in the weighting algorithm cannot accurately reflect the fatalness of each pollutant, while limits of the second level are more reliable. In general, the second level is not only the demarcation between pollution and nonpollution but also the target to protect human health, and it is usually employed by the government to evaluate whether air quality is up to standard. Most of all, they have more recommended limits from world authorities such as the WHO. Therefore, an improved method named the Normalized Secondary-Level Limit Weighting (NSLLW) algorithm is proposed as Equation (8). Additionally, due to the fact that factor weight will be combined with a fuzzy matrix to obtain an overall evaluation result of air quality, it can serve as an independent tool to obtain a great deal of useful information including chief pollutant, warning pollutant (), relative hazard and rank (for the second limitation of the AQI). Table 3 shows an example of evaluation results of NSLLW. In contrary, all evaluation results of the AQI are all decided by pollutant with the highest subindex, which is biased and insufficient.
Table 3.
Evaluation results of Normalized Secondary-Level Limit Weighting (NSLLW) on 17 April 2019 in Beijing.
- (5)
- Fuzzy operator
The final evaluation result will be obtained by synthesizing the factor weight and fuzzy matrix with an appropriate composite operator which can be defined by the researcher according to the actual evaluation task. The fuzzy operator plays a significant role and determines the nature of a model. Common fuzzy math models can be divided into three categories:
Principal factor decision model:
Principal factor prominent model:
Weighted average model:
is the first choice for environment quality evaluations because this model is favorable for taking all factors into account and obtaining an integrated effect. This weighted average model seems to be reasonable, but diluting the influence of the chief pollutant makes its evaluation level far lower than that of the AQI (conservative strategy) even under the same conditions, which may affect the people who are sensitive to the chief pollutant. Therefore, we choose which considers the integrated effect of all pollutants and meanwhile highlights the influence of the chief pollutant to ensure a smooth transition from the AQI to AQFCE (for the third limitation of the AQI). Its equation is as follows:
- (6)
- Evaluation result
According to the principle of maximum membership degree, the maximum value of reflects the final evaluation result (level) of air quality.
3.3. Early Warning Module of AQFCE
Besides air quality evaluations at different time scale, forecasts and early warnings can also be achieved by the AQFCE based on forecast data. In order to prevent air pollution and provide maximum protection for public health in a timely manner, the air pollution early warning module was designed as Table 4, which references documents of the AQI from many countries [7,22,23,39] and emergency plan for severe air pollution of many provinces in China [41,42,43,44]. As an alert and recommendation, it can not only guide people’s daily activities but provide decision-making support for governments, such as evaluating whether the air quality of a city reaches the standard, taking mandatory measures to address potential air pollution and so forth.
Table 4.
Air pollution early warning.
SO2: Sulphur dioxide is mainly from the combustion of sulphur-containing fuels and can be the precursor of a secondary particle. It can damage the respiratory system of humans and animals, hinder the growth and development of plants and corrode metal materials.
NO2: Nitrogen dioxide is mainly from thermal power plants, transportation and industrial sources and can be the precursor of a secondary particle. Bronchus and lungs will be affected under high concentration.
CO: Carbon monoxide is from the incomplete combustion of carbon-containing fuel and can cause serious harm to the nervous and cardiovascular system of humans and animals.
O3: Ozone is from photochemical reaction of nitrogen oxide and volatile organic compound produced by transportation and industry. It is a strong oxidant which can cause coughing, chest discomfort and inflammation of the respiratory tract. Plant and building materials are also injured by it.
PM10 and PM2.5: Particulate matter is from natural (volcano eruption, sandstorm) and anthropogenic (industrial processes, traffic emission) sources. It can be divided into primary (emitted directly) and secondary (atmospheric chemistry reaction of precursors) particles. PM10 (d ≤ 10 um) can enter into the upper respiratory tract and has a wide range of health effects involving ones on the cardiovascular system, respiratory system, child growth and mortality. It also reduces visibility by scattering and absorbing light. PM2.5 (d ≤ 2.5 um) can enter into lungs and has a longer suspension time and transmission distance in air, which means greater harm.
4. Experimental Result and Discussion
4.1. Data and Method
To prove the feasibility of the AQFCE in practice, it has been fully tested under various conditions in China. According to “Three-year Action Plan for Winning the Blue Sky Defense War” issued by the China’s State Council in June 2018, the Fenwei Plain has replaced Pearl River Delta to be the key area of air pollution control together with the Jing-jin-ji region and Yangtze River Delta. As representative cities, Beijing, Shanghai and Xi’an (Figure 2), with different environments, industrial structures and pollution features, are selected. Unreasonable industrial and energy structures as well as continuously rapid growth of vehicles have caused huge emissions of local pollution, which is common in the three metropolises. In addition, Beijing and Xi’an are, respectively, located in the northeast and southwest of “Jing-jin-ji air pollution transmission channel”, so they are often affected by regional pollution transport. Adjacent to sand sources, they also suffer from sand- and dust-storms in spring. Daily and hourly concentration data of six conventional air pollutants from September 2018 to August 2019 are from the Ministry of Ecology and Environment of China (http://www.mee.gov.cn). In view of the excessive hourly data, the representative month of every season (October, January, April and July) are used in hourly evaluations. The AQI is the most widely used and recognized air quality evaluation method at present, so comparative analysis with the AQI in practice is necessary for any new method. Therefore, based on the same monitor data, comparative analysis between the AQI and AQFCE is carried out on different spaces (Beijing, Shanghai, Xi’an), time (spring, summer, autumn, winter), tasks (daily report, hourly report) and purposes (air quality level, chief pollutant).
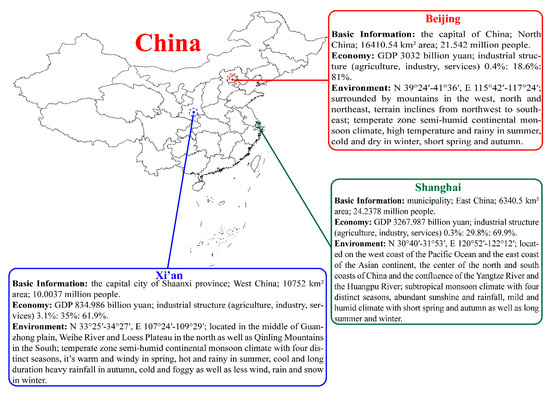
Figure 2.
The overview of study areas.
4.2. Case Study and Analysis
- (1)
- Beijing
Figure 3 presents the concentration variation of six pollutants and corresponding air quality evaluation results (chief pollutant and level) of Beijing in four seasons. Combined pollution is common in Beijing and O3 is dominant in late spring, summer and early autumn. Regional pollution transport and local traffic pollution make PM2.5 and NO2 major air pollutants throughout the year, while PM10 is more notable in spring mainly from dust transport upstream. In general (Figure 3), there is an increase in daily concentration during weekends and holidays, which can be attributed to the strict traffic restriction on weekdays and celebration fireworks during festivals. For hourly concentration (Figure 4A–D), ozone has one peak in the period from 14:00 to 16:00 every day, while two peaks at 8:00 and 20:00 are apparent for other pollutants, which are in accordance with traffic peaks. Referring to pollutant concentration (Figure 3), it is clear from evaluation results that the AQFCE accurately reflects pollution features and trends under different pollution conditions (lighter pollution, heavier pollution, pollution process), and it is sensitive to sudden and significant changes of concentration. As a statistical indicator, the Consistent Rate (CR) and Kendall Correlation Coefficient (T) are applied to compare the AQI with AQFCE on chief pollutants and air quality level (ordered categorical variable). Furthermore, specific examples will provide empirical support for the comparative analysis.
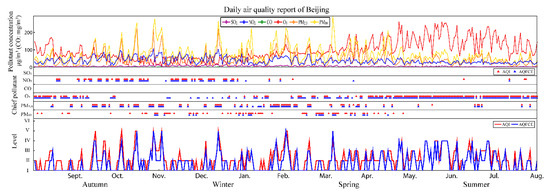
Figure 3.
Daily pollutant concentration variation and air quality evaluation result of chief pollutant and level of Beijing.
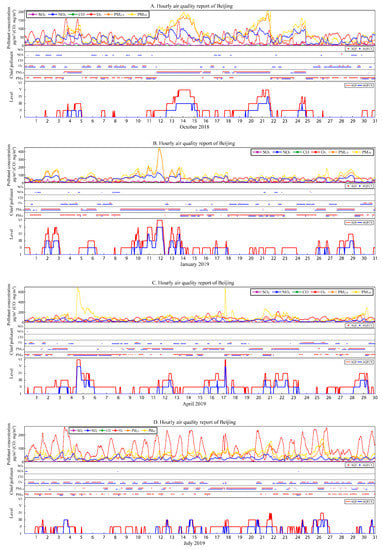
Figure 4.
Hourly pollutant concentration variation and air quality evaluation result of chief pollutant and level of Beijing.
For daily reports (Figure 3), the CR between the AQI and AQFCE are 82.47% and 58.08% on chief pollutant and air quality level, respectively. The chief pollutant has an important purpose and significantly influences the subsequent evaluation on air quality level. So, accurate identification of the chief pollutant is the premise of air quality evaluation, and both methods have high consistency on this point. In view of their middle consistency of level, differences are further analyzed by specific examples. On 2 March 2019 (Figure 3), concentration values of SO2, NO2, CO, O3, PM2.5 and PM10 were 3, 14, 0.4, 77, 40 and 157, which means values of five pollutants are far below or close to the limit of I and one pollutant’s value is close to the limit of II. The AQI and AQFCE determine the same chief pollutant PM10 but a different level III (light pollution) and II (good), respectively, which shows that a sharp boundary and biased evaluation make the AQI overestimate actual pollution. Experimental results indicate almost all their divergences are due to the fact that the level of AQI with a conservative strategy is higher than that of the AQFCE with a comprehensive strategy by one level, but they have a similar trend and high correlation coefficient 0.78. In conclusion, though the AQI and AQFCE are two completely different methods, namely their distinct algorithms, criteria and strategies, their effectiveness in daily reports are proved by each other and the AQFCE is more comprehensive.
For hourly reports (Figure 4A–D), the incomplete criterion of the AQI is really a problem for not only the comparison but also AQI’s own evaluation. This is because in the hourly report of the AQI PM2.5 and PM10 use daily criterion while other pollutants use hourly criterion, which is unreasonable. This leads to an exaggerated hazard of PM2.5 and PM10, and they are more likely to be chosen as chief pollutants even if they are not the biggest hazard. The AQI’s level is decided by the chief pollutant alone, so a questionable chief pollutant may give a meaningless air quality level. Experimental results prove this and there are antinomies in the results of the AQI. For example, on 23 October 2018, the chief pollutant of the hourly report was PM10 in every hour but the daily report’s chief pollutant was NO2, which is contradictory. The AQFCE is complete in hourly reports, and there is a marked drop of CR compared with the daily report as expected—63.04% and 45.49% for the chief pollutant and level. PM2.5 and PM10 without hourly criterion really disturb the comparison, but CR increase significantly to 89.74% and 97.39%, respectively, after eliminating their influence, which means AQI with appropriate concentration limits is similar to the AQFCE. Actually, an hourly report of the AQI is severely affected by its criterion, and the AQFCE is robust for use in various tasks.
- (2)
- Shanghai and Xi’an
From Figure 5 and Figure 6, a mobile pollution source is prominent in Shanghai, which promotes NO2 and further helps PM2.5 occupy the majority of the particle pollution. Excessive emission of Volatile Organic Compounds (VOCs) and a high temperature leads to the dominance of O3 during the year, except in winter. The “Weekend effect” and “holiday effect” for daily concentrations (Figure 5) and “Peak Type” for hourly concentrations (Figure 6A–D) appear in Shanghai too, which is common in a metropolis. Two methods have similar performances in terms of their daily reports (Figure 5), and their CRs (T) are 85.48% and 48.77% (0.62) for the chief pollutant and level. From Figure 6A–D, exaggerated hazard of particulate matter by the AQI often leads to a questionable chief pollutant (mainly PM2.5 and PM10) and level. Even though when particulate matter is the actual chief pollutant, the level of the AQI is seriously overvalued too. On the contrary, based on the actual pollutant concentration, results of the AQFCE in hourly report are more convincing. Excluding the influence of particulate matter, the CR has a sharp rise about 40% of both the chief pollutant (47.59%–84.76%) and level (58.74%–96.99%).
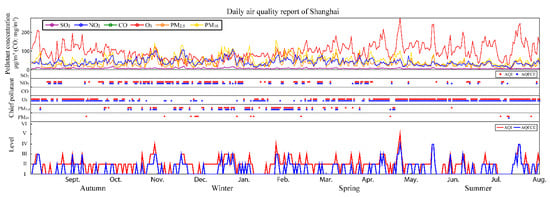
Figure 5.
Daily pollutant concentration variation and air quality evaluation result of chief pollutant and level of Shanghai.
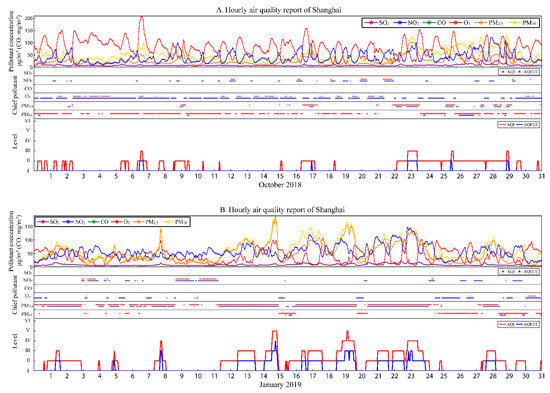
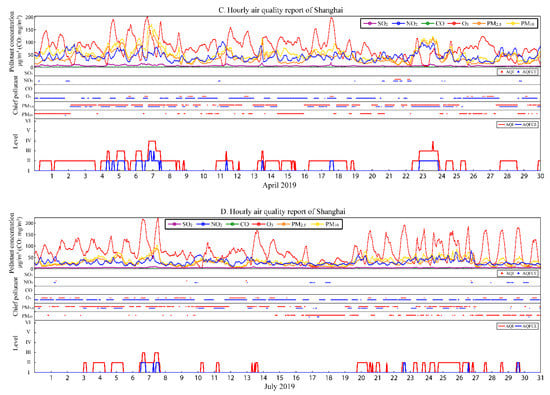
Figure 6.
Hourly pollutant concentration variation and air quality evaluation result of chief pollutant and level of Shanghai.
It is clear from Figure 7 that ozone pollution is also a tough problem in the summer of Xi’an. Perennial pollution transport from the northeast and local pollution emission as well as sand dust transport from the northwest cause severe particle pollution in autumn, winter (mainly PM2.5) and spring (mainly PM10). From Figure 7, comparison results of daily and hourly reports are similar to Beijing and Shanghai. The AQFCE and AQI have an approximate performance in chief pollutant (83.84%) and level (49.9%/0.78) for daily reports (Figure 7), while huge divergences on the chief pollutant in summer (Figure 8D) and level in winter (Figure 8B) stem from magnified particle pollution by the AQI for hourly reports. Table 5 presents the comparison of evaluation results between the AQI and AQFCE by consistency and similarity.
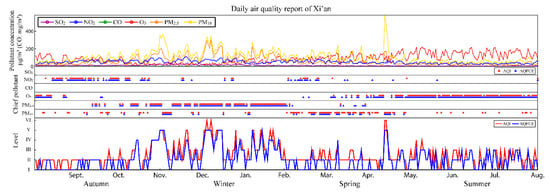
Figure 7.
Daily pollutant concentration variation and air quality evaluation result of chief pollutant and level of Xi’an.
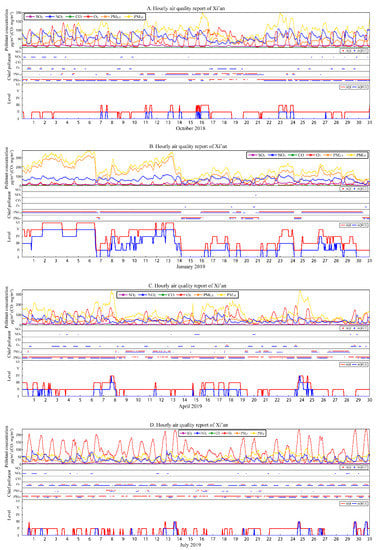
Figure 8.
Hourly pollutant concentration variation and air quality evaluation result of chief pollutant and level of Xi’an.
Table 5.
The comparison of evaluation result between the Air Quality Index (AQI) and Air Quality Fuzzy Comprehensive Evaluation (AQFCE) by consistent rate (CR) (T).
5. Conclusions
The AQI has been used around the world for many years, yet its intrinsic limitations are increasingly apparent. A sharp boundary leads to completely different evaluation results and corresponding measures facing almost the same air quality. A biased evaluation is not objective and comprehensive enough, and a conservative strategy may exaggerate actual air pollution and bring about unnecessary economic loss and public concern. In addition, incomplete criteria have caused questionable evaluation results. Now people are beginning to realize the inconsistency between their feelings and reports of AQI, and meanwhile governments are also considering how to balance air pollution control and economic development. Therefore, based on the comparative analysis of AQI in theory, we designed a novel air quality evaluation paradigm, the AQFCE, which consists of preprocessing, evaluation and early warning. To ensure the integrity and accuracy of data, least square piecewise polynomial fitting and linear regression was used for missing and reversal data of air pollutant concentration in the preprocessing module. In the evaluation module, membership degree is adopted to deal with the problem of a sharp boundary. Compared with the biased evaluation and conservative strategy of the AQI, a principal factor prominent model based on the membership degree and factor weight of all pollutants can give more objective evaluation results and balance human health protection and pollution control cost. A complete and targeted calculation grid based on scientific evidence is proposed too. Moreover, the early warning module can provide timely alerts and recommended measures according to the evaluation results of air quality. In general, the AQFCE can achieve an air quality evaluation and forecast at different time scale. Comparative analysis of the AQI and AQFCE in practice was carried out in China under various conditions including different space (Beijing, Shanghai and Xi’an), time (autumn, winter, spring and summer), task (daily report, hourly report) and purpose (chief pollutant, level). Experimental results offer some meaningful information:
- (1)
- Referring to actual pollutant concentration, the AQFCE accurately reflects the trend of air pollution under different pollution conditions (lighter pollution, heavier pollution, pollution process) and is sensitive to sudden and significant changes in concentration. In daily reports, the AQFCE and AQI have high consistent rates and correlation coefficients regarding the chief pollutant and level, respectively, in Beijing, Shanghai and Xi’an, while examples prove the AQFCE with a comprehensive strategy is more reasonable than the AQI with a conservative strategy. In hourly reports, examples indicate that the AQI, influenced by incomplete criterion, has questionable evaluation results and even antinomies, while the AQFCE is still as effective as daily reports.
- (2)
- The AQFCE successfully reveals that O3, PM2.5, PM10 and NO2 are major air pollutants in China at present, while SO2 and CO have faded out. The “Weekend effect” and “holiday effect” for daily concentration and “single peak type” of O3 as well as “double peak type” of the other pollutants for hourly concentration are found. In addition, with common ozone pollution in summer and fine particle pollution in winter, pollution features vary among the Jing-jin-ji region, Yangtze River Delta and Fenwei Plain for different pollution sources and diffusion conditions.
In conclusion, comparative analysis in theory and practice prove the feasibility of the AQFCE. The AQFFCE solves the limitations of the AQI and is an important improvement and supplement to the AQI. In the future, we will further improve the AQFCE and hope that it can provide health guidelines for the public and support in short-term environmental decision-making as well as a long-term development plan for government.
Author Contributions
Conceptualization, X.M. and Z.Q.; Methodology, X.M.; software, H.L.; validation, X.M., H.L., writing—original draft preparation, X.M., H.L.; writing—review and editing, X.M., H.L., L.Z. and Z.Q.; supervision, L.Z.; project administration, L.Z.; funding acquisition, L.Z. All authors have read and agreed to the published version of the manuscript.
Funding
This research was funded by the National Natural Science Foundation of China, grant number 41521004, 41627807.
Conflicts of Interest
The authors declare no conflict of interest.
References
- Hadley, M.B.; Vedanthan, R.; Fuster, V. Air pollution and cardiovascular disease: A window of opportunity. Nat. Rev. Cardiol. 2018, 15, 193–194. [Google Scholar] [CrossRef]
- Wang, H.; Zhang, Y.; Zhao, H.; Lu, X.; Zhang, Y.; Zhu, W.; Nielsen, C.P.; Li, X.; Zhang, Q.; Bi, J.; et al. Trade-driven relocation of air pollution and health impacts in China. Nat. Commun. 2017, 8, 1–7. [Google Scholar] [CrossRef]
- Waller, L.A. Estimate suggests many infant deaths in sub-Saharan Africa attributable to air pollution. Nat. Cell Biol. 2018, 559, 188–189. [Google Scholar] [CrossRef]
- Costa, A.F.; Hoek, G.; Brunekreef, B.; De Leon, A.C.P. Air Pollution and Deaths among Elderly Residents of São Paulo, Brazil: An Analysis of Mortality Displacement. Environ. Heal. Perspect. 2017, 125, 349–354. [Google Scholar] [CrossRef]
- Sofia, D.; Gioiella, F.; Lotrecchiano, N.; Giuliano, A. Cost-benefit analysis to support decarbonization scenario for 2030: A case study in Italy. Energy Policy 2020, 137, 111137. [Google Scholar] [CrossRef]
- Cheng, W.-L.; Chen, Y.-S.; Zhang, J.; Lyons, T.; Pai, J.-L.; Chang, S.-H. Comparison of the Revised Air Quality Index with the PSI and AQI indices. Sci. Total. Environ. 2007, 382, 191–198. [Google Scholar] [CrossRef]
- Elshout, S.V.D.; Léger, K.; Heich, H. CAQI Common Air Quality Index — Update with PM2.5 and sensitivity analysis. Sci. Total. Environ. 2014, 489, 461–468. [Google Scholar] [CrossRef]
- Chen, W.; Tang, H.; Zhao, H. Urban air quality evaluations under two versions of the national ambient air quality standards of China. Atmos. Pollut. Res. 2016, 7, 49–57. [Google Scholar] [CrossRef]
- Plaia, A.; Di Salvo, F.; Ruggieri, M.; Agró, G. A Multisite-Multipollutant Air Quality Index. Atmospheric Environ. 2013, 70, 387–391. [Google Scholar] [CrossRef]
- Sowlat, M.H.; Gharibi, H.; Yunesian, M.; Mahmoudi, M.T.; Lotfi, S. A novel, fuzzy-based air quality index (FAQI) for air quality assessment. Atmos. Environ. 2011, 45, 2050–2059. [Google Scholar] [CrossRef]
- Bagieński, Z. Traffic air quality index. Sci. Total. Environ. 2015, 505, 606–614. [Google Scholar] [CrossRef]
- Olvera-García, M.Á.; Carbajal-Hernández, J.J.; Sánchez-Fernández, L.P.; Hernández-Bautista, I. Air quality assessment using a weighted Fuzzy Inference System. Ecol. Inform. 2016, 33, 57–74. [Google Scholar] [CrossRef]
- Li, Z.Y.; Zhang, Z.J.; Wang, J.Y. Universal Index Formulae of Air Quality Evaluation by Transformed Values of Indexes. Environ. Sci. Technol. 2012, 35, 179–184. (In Chinese) [Google Scholar]
- Gorai, A.K.; Kanchan; Upadhyay, A.; Tuluri, F.; Goyal, P.; Tchounwou, P.B. An innovative approach for determination of air quality health index. Sci. Total. Environ. 2015, 533, 495–505. [Google Scholar] [CrossRef] [PubMed]
- Adams, M.D.; Kanaroglou, P. A criticality index for air pollution monitors. Atmos. Pollut. Res. 2016, 7, 482–487. [Google Scholar] [CrossRef]
- Thach, T.Q.; Tsang, H.; Cao, P.; Ho, L.-M. A novel method to construct an air quality index based on air pollution profiles. Int. J. Hyg. Environ. Heal. 2018, 221, 17–26. [Google Scholar] [CrossRef]
- Wang, Y.; Fu, X.-K.; Jiang, W.; Wang, T.; Tsou, M.-H.; Ye, X. Inferring urban air quality based on social media. Comput. Environ. Urban Syst. 2017, 66, 110–116. [Google Scholar] [CrossRef]
- Chen, Y.; Wang, L.; Li, F.; Du, B.; Choo, K.-K.R.; Hassan, H.; Qin, W. Air quality data clustering using EPLS method. Inf. Fusion 2017, 36, 225–232. [Google Scholar] [CrossRef]
- Ruggieri, M.; Plaia, A. An aggregate AQI: Comparing different standardizations and introducing a variability index. Sci. Total. Environ. 2012, 420, 263–272. [Google Scholar] [CrossRef]
- Plaia, A.; Ruggieri, M. Air quality indices: A review. Rev. Environ. Sci. Bio/Technol. 2010, 10, 165–179. [Google Scholar] [CrossRef]
- Sofia, D.; Lotrecchiano, N.; Giuliano, A.; Barletta, D.; Poletto, M. Optimization of Number and Location of Sampling Points of an Air Quality Monitoring Network in an Urban Contest. Chem. Eng. Trans. 2019, 74, 277. [Google Scholar]
- Environmental Protection Agency of USA. National Ambient Air Quality Standards for Ozone [EB/OL]. Available online: https://www.govinfo.gov/content/pkg/FR-2015-10-26/pdf/2015-26594.pdf (accessed on 1 December 2020).
- Ministry of Environmental Protection of China. Technical Regulation Ambient Air Quality Index (Trial) (HJ 633-2012) [EB/OL]. Available online: http://www.cnemc.cn/jcgf/dqhj/201706/t20170606_647274.shtml (accessed on 1 December 2020).
- Gorai, A.K.; Kanchan; Upadhyay, A.; Goyal, P. Design of fuzzy synthetic evaluation model for air quality assessment. Environ. Syst. Decis. 2014, 34, 456–469. [Google Scholar] [CrossRef]
- Suo, C.; Li, Y.; Sun, J.; Yin, S. An air quality index-based multistage type-2-fuzzy interval-stochastic programming model for energy and environmental systems management under multiple uncertainties. Environ. Res. 2018, 167, 98–114. [Google Scholar] [CrossRef]
- Wang, S.; Du, L.; Wang, R. Comparison of Air Quality Index between China and Foreign Countries. Environ. Monit. China 2013, 29, 58–65. (In Chinese) [Google Scholar]
- Gao, Q.-X.; Liu, J.-R.; Li, W.-T.; Gao, W.-K. Comparative Analysis and Inspiration of Air Quality Index between China and America. Environ. Sci. 2015, 36, 1141–1147. (In Chinese) [Google Scholar]
- China National Environmental Monitoring Center. Release Notes of Urban Air Quality Real Time Release Platform of China [DB/OL]. Available online: http://106.37.208.233:20035/ (accessed on 1 December 2020).
- Pan, B.F.; Zheng, H.H.; Li, L.N.; Wang, W. The Characteristic and Reason about the Reversal between PM2.5 and PM10 in Ambient Air Quality Automatic Monitoring. Environ. Monit. China 2014, 30, 90–95. (In Chinese) [Google Scholar]
- Chen, G.; Pham, A.T.T. Introduction to Fuzzy Sets, Fuzzy Logic, and Fuzzy Control Systems; CRC Press: Boca Raton, FL, USA, 2001. [Google Scholar]
- Ping, J.; Chen, B.; Husain, T. Risk Assessment of Ambient Air Quality by Stochastic-Based Fuzzy Approaches. Environ. Eng. Sci. 2010, 27, 233–246. [Google Scholar] [CrossRef]
- Vadiati, M.; Moghaddam, A.A.; Nakhaei, M.; Adamowski, J.; Akbarzadeh, A. A fuzzy-logic based decision-making approach for identification of groundwater quality based on groundwater quality indices. J. Environ. Manag. 2016, 184, 255–270. [Google Scholar] [CrossRef]
- Xu, Y.; Yang, W.; Wang, J. Air quality early-warning system for cities in China. Atmos. Environ. 2017, 148, 239–257. [Google Scholar] [CrossRef]
- Yang, Z.; Wang, J. A new air quality monitoring and early warning system: Air quality assessment and air pollutant concentration prediction. Environ. Res. 2017, 158, 105–117. [Google Scholar] [CrossRef]
- China National Environmental Monitoring Center. Bulletin on China’s Environmental State [EB/OL]. Available online: http://www.cnemc.cn/jcbg/zghjzkgb/ (accessed on 1 December 2020).
- Jindal, S.K. Regional Office for Europe. Air quality guidelines: Global update 2005. Particulate matter, ozone, nitrogen dioxide and sulfur dioxide. Indian J. Med. Res. 2007, 4, 492–493. [Google Scholar]
- Directive 2008/50/EC of the European Parliament and of the Council of 21 May 2008 on Ambient Air Quality and Cleaner Air for Europe. Available online: http://eur-lex.europa.eu/LexUriServ/LexUriServ.do?uri=OJ:L:2008:152:0001:0044:EN:PDF (accessed on 1 December 2020).
- Ministry of Ecology and Environment of the People’s Republic of China. Explanation of Ambient Air Quality Standards [EB/OL]. Available online: http://www.mee.gov.cn/gkml/hbb/bgth/201011/t20101130_198128.htm (accessed on 1 December 2020).
- Holgate, S. Review of the UK Air Quality Index. A Report by the Committee on the Medical Effects of Air Pollutants; Health Protection Agency: London, UK, 2011.
- Ministry of Ecology and Environment of the People’s Republic of China. Monthly Report on Urban Air Quality [EB/OL]. Available online: http://www.mee.gov.cn/hjzl/dqhj/cskqzlzkyb/index.shtml (accessed on 1 December 2020).
- The People’s Government of Beijing Municipality. Emergency Plan for Severe Air Pollution of Beijing [EB/OL]. Available online: http://www.beijing.gov.cn/zhengce/zfwj/zfwj2016/szfwj/201905/t20190522_61613.html (accessed on 1 December 2020).
- The People’s Government of Hongkou District, Shanghai. Emergency Plan for Severe Air Pollution of Shanghai [EB/OL]. Available online: http://xxgk.shhk.gov.cn/hkxxgk/depart/showinfo.aspx?infoid=488327c6-0a30-48da-9267-c83142ae78c6&categorynum=002004005001 (accessed on 1 December 2020).
- The People’s Government of Xi’an. Emergency Plan for Severe Air Pollution of Xi’an [EB/OL]. Available online: http://www.xa.gov.cn/gk/zhsgjy/yjyj/5d490976fd850833ac58c3ff.html (accessed on 1 December 2020).
- Tianjin Municipal People’s Government. Emergency Plan for Severe Air Pollution of Tianjin [EB/OL]. Available online: http://www.tj.gov.cn/zwgk/szfwj/tjsrmzfbgt/202005/t20200519_2370645.html (accessed on 1 December 2020).
Publisher’s Note: MDPI stays neutral with regard to jurisdictional claims in published maps and institutional affiliations. |
© 2020 by the authors. Licensee MDPI, Basel, Switzerland. This article is an open access article distributed under the terms and conditions of the Creative Commons Attribution (CC BY) license (http://creativecommons.org/licenses/by/4.0/).