Article

Evaluation of the Biomechanical Parameters of Human-Wheelchair Systems during Ramp Climbing with the Use of a Manual Wheelchair with Anti-Rollback Devices

1
Institute of Machine Design, Faculty of Mechanical Engineering, Poznan University of Technology, 60-965 Poznań, Poland
2
Institute of Mechatronic Devices, Faculty of Mechanical Engineering, Poznan University of Technology, 60-965 Poznań, Poland
*
Author to whom correspondence should be addressed.
Appl. Sci. 2020, 10(23), 8757; https://doi.org/10.3390/app10238757
Submission received: 16 November 2020 / Revised: 30 November 2020 / Accepted: 2 December 2020 / Published: 7 December 2020

Abstract

:
Purpose: The main purpose of the research conducted was the analysis of kinematic and biomechanical parameters measured during manual wheelchair ramp-climbing with the use of the anti-rollback system and the comparison of the values tested with the manual wheelchair climbing the same ramp but without any modifications. The paper presents a quantitative assessment relating to the qualitative research of the anti-rollback system performed by another research team. Method and materials: The article presents the measurement results of the wheelchair motion kinematics and the activity of four upper limb muscles for eight subjects climbing a 4.58° ramp. Each subject propelled the wheelchair both with and without the anti-rollback system. The kinematic parameters were measured by means of two incremental encoders with the resolution of 500 impulses per single revolution of the measurement wheel. Whereas, the muscle activity was measured by means of surface electromyography with the use of Noraxon Mini DTS apparatus equipped with four measurement channels. Results: The surface electromyography measurement indicated an increase in the muscle activity for all four muscles, during the use of the anti-rollback system. The increase was: 18.56% for deltoid muscle anterior, 12.37% for deltoid muscle posteriori, 13.0% for triceps brachii, and 15.44% for extensor carpi radialis longus. As far as the kinematics analysis is concerned, a decrease in the measured kinematic parameters was observed in most participants. The medium velocity of the propelling cycle decreased by 26%. The ratio of the generated power and the loss power in a single propelling cycle λ had decreased by 18%. The least decrease was recorded for the measurement of mechanical energy E and the propelling cycle duration time. For the total mechanical energy, the decrease level was 3%, and for the propelling cycle duration it was 1%. The research carried out did not demonstrate any impact of the anti-rollback system use on the push phase share in the entire propelling cycle.

1. Introduction

A disabled person moving on a manual wheelchair pushes the drive wheels with their upper limbs what results in the linear motion of the wheelchair [1,2]. When propelling a wheelchair, its user overcomes various architectural and terrain barriers [3,4]. One of the most demanding obstacles most frequently faced by a wheelchair user are slopes and ramps [5], this problem worsens with unfavorable weather conditions (icing, residual snow) [6]. When climbing a ramp, a manual wheelchair user must perform cyclic propelling motions consisting of a push phase and a phase of hand returning to their initial position [7]. During the hands return phase, the wheelchair begins to slow down abruptly and if another push is not performed in a proper time interval, the system will start to roll down the ramp. This is an effect of the gravity force impact on the system, which results in so called slope resistance [8,9,10].
The limited physical capabilities of a disabled person and the structure of a wheelchair contribute to the fact that the occurrence of terrain barriers may prevent the user from unaided movement around a public space. This is visible particularly in developing countries and old municipal agglomerations [11]. Currently, in newly-constructed urban areas, all the types of facilities are used for the disabled, whose task is to level terrain unevenness such as curbs. Levelling such unevenness is obtained through the construction of special ramps or road slopes [12]. In order to prevent the excessive values of the ramp inclination angle, many countries introduce construction guidelines and standards. In the USA, the maximum ramp inclination for the disabled may reach 8.3% [13]. In EU countries, the ramp inclination angle may reach 4.57° for the height of 0.5 m and 3.42° for the height above 0.5 m [14]. Even despite introducing standards harmonizing the range of the ramp inclination, a wheelchair user is still subject to a considerable muscle effort [15]. Such an effort, in extreme cases, may prevent climbing the ramp.
Apart from reducing terrain disruptions by town planners and designers, work is underway on the development of wheelchairs to overcome the described obstacles. Various technical solutions are available for overcoming terrain obstacles other than elevations, such as, e.g., stairs and thresholds [16]. However, they require additional electric drives [17] or the participation of third parties in moving [18]. One of the basic systems supporting climbing hills by the disabled or ramps is an electric wheelchair. Despite the improved movement, it has the following shortcomings: difficulty to transport in a vehicle [19,20], limited battery life [19], limited use inside the home [20], the need to take into account control delay characterized by unnatural interaction with the user [20,21,22]. What is particularly noticeable is reduced precision of control compared to classic wheelchairs [20], due to the increased weight, size and the possibility of delay of control signals [23]. In addition, there is a risk that wheelchairs users may have a less active lifestyle, which limits their physical development, which in turn may predispose them to a variety of long-term health problems [23]. In order to protect the health of users, hybrid (electric-manual) wheelchairs or wheelchairs with propulsion assistance system [24,25,26,27,28,29] are used. However, the cost of these devices is much higher than traditional manual wheelchairs. Moreover, manual wheelchairs can be used periodically by people who have suffered non-permanent injuries and do not want to incur relatively large expenses for the purchase of a wheelchair. In such cases, it seems advantageous to use much cheaper mechanical systems that assist in climbing ramps by securing the reverse movement of the wheelchair [30].
The type of disability has a significant impact on the ability to overcome terrain inclinations because it affects the value of the generated propelling force [31]. Whereas, the generated propelling force is reflected in a range of dynamic parameters describing the motion of the human-wheelchair system. One of such parameters is the wheelchair velocity, which in the event of moving on the levelled terrain may reach 1.5 m/s right after the end of the push phase [32]. It must be noted that during the phase of hands returning to the initial position, the wheelchair velocity decreases to around 1.2 m/s only as a result of the motion resistance impact which is connected with the surface type [33]. Wheelchair users, in order to facilitate their climbing, accelerate the wheelchair to gather an energy reserve, which in the effect of inertia will make climbing easier. The tests conducted on the level road demonstrated that in three propelling cycles it is possible to accelerate the wheelchair to the velocity of 3.0 m/s. Such wheelchair velocity results in the reduction in the frequency of performed pushes in the initial phase of ramp climbing. However, as far as longer ramps are concerned, kinetic energy accumulated during wheelchair acceleration is lost and the user is forced to increase the frequency of pushes, at the same time shortening the path distance in a single propelling cycle [34]. Notwithstanding, the selected ramp climbing technique, in the event of each user, the increase of muscle activity and effort is observed which is demonstrated through the growth of the user’s pulse rate and the frequency of breaths.
The increase in the above-mentioned parameters is closely related to the driving force generated by the upper limb. There is a scientific work [35], in which the changes in the value of forces in various movement phases during the rotation of a wheelchair wheel were analyzed. The authors suggested that research results could reduce the risk of injury by minimizing joint forces as a way to maximize performance. The risk of injury caused by overexertion can be minimized by modifying the structure or changing the biomechanics of driving the wheelchair [36].
The specificity of propelling a manual [37] wheelchair consisting of an alternating push phase during which propelling force is generated [38] and a return phase results in the considerable decreases in the wheelchair velocity during hands returning to the initial position on the push rims. In consequence, there is a risk of wheelchair moving downhill and muscle system injuries due to excessive physical effort. A response to such problems are the modifications of a traditional propulsion system consisting in adding the anti-rollback system [39,40,41]. One of the research papers includes the evaluation of two prototypes of anti-rollback devices [42]. As part of the research, the utility and functionality was evaluated by means of Quebec user evaluation of satisfaction with assistive technology (QUEST 2.0). The subjects stated that using the anti-rollback system makes ramp climbing easier and safer. Nevertheless, the authors of the experiment claimed that it would be worth conducting some additional tests focused on the quantitative measurement of kinematic parameters resulting from propelling the wheelchair on the inclined ramp. This conclusion as well as the author’s solutions in the aspect of the anti-rollback system were the motivation for undertaking the presented research paper. In response to the indicated needs, the research was carried out aimed at comparing the unmodified manual wheelchair in the traditional configuration and the wheelchair equipped with the anti-rollback system. The comparison was conducted during ramp climbing, measuring such dynamic and biomechanical parameters as: velocity, power, mechanical energy and muscle activity (muscle electromyography). The main objective of the research was to check whether the qualitative test determining the increase in comfort and safety during propelling the wheelchair with the anti-rollback system on the ramp results in the improvement in the motion dynamics of the human-wheelchair anthropotechnic system.

2. Materials and Methods

A Vermeiren v300 manual wheelchair equipped with the anti-rollback system, consistent with the patent application, was used for the tests. The anti-rollback device prototype (Figure 1) may fulfil two functions: a parking brake and anti-rollback. The anti-rollback system is an addition to the classic lever brake, so it can be disengaged when driving on flat terrain. The brake module consists of a central axis 3 screwed down to the arm of the traditional parking brake by means of the screw unit 1–2. The unidirectional coupling 5, pre-forced into the brake roller 4, is pulled over the central axis. The brake roller 4 can be covered with plastic or rubber to improve contact between the roller and the wheel [43,44]. The coupling enables only the unidirectional movement of the brake roller. This provides the effect of the wheelchair pulling back lock. The unidirectional coupling 5 is secured on the central axis 3 with a locking plate 6 pressed down by the screw 6. The safety lock 9 is screwed into the locking plate 6. The safety lock consists of a locking fastener 11, which blocks the brake roller, body 9, press spring 10 and holder 8 facilitating the disconnection of the brake roller lock 4. The safety lock is responsible for switching the device from the anti-rollback function to the traditional parking brake function. During the tests, the safety lock was removed in order to obtain the anti-rollback function. During the test, the pressure in the wheels cooperating with the anti-rollback device was checked to remain at the level of 3 ± 0.1 bar.
The measurement was conducted on the special ramp (Figure 2) consisting of a horizontal section enabling wheelchair acceleration (Section A), a ramp section inclined at the angle α = 4.58° (Section B, Section C) and a horizontal section enabling braking the wheelchair (Section D). The assumed ramp inclination angle satisfies the requirements of the European standards referring to designing ramps for terrain down casts exceeding 0.5 m. The analysis of dynamic and biomechanical parameters included only the data measured after covering approx. 30% of the ramp (Section C). Thus, the impact of the share of mechanical energy [30] accumulated during wheelchair acceleration in the initial horizontal section in the form of the inertia of the accelerated system (Section A).
Eight able-bodied participants participated in the tests (Table 1). The participants were classified according to height, weight, age, maximum strength of an upper limb generated during pushing and experience in moving on a wheelchair. Each participant was familiarized with the test procedure and filled in the form of voluntary consent. Able-bodied subjects were chosen because the anti-rollback system prototype had not previously been tested. The participation of people without any motor disabilities increased safety and guaranteed that in the event of any prototype failure, a person would be able to leave the wheelchair before it moved downhill. The task of the participants was to cover the whole prepared track, at the same time keeping the wheelchair trajectory which was straight and parallel to the track, with the comfortable frequency of pushes. The research was evaluated positively by the Bioethical Commission at Karol Marcinkowski Medical University in Poznan Poland, Resolution No. 1100/16 of 10 November 2016, under the guidance of Prof. MD Chęciński P. for the research team led by Ph.D. Wieczorek B. The authors obtained the written consent of the examined person for the publication of the research results with its participation. The data was presented in such a way as to ensure its complete anonymity.
The test was performed with the use of a measurement system consisting of two incremental encoders: 1 was connected with the central unit 2 transmitted by means of the micro-controlled system based on Arduino architecture, a measurement signal for the author’s software (Figure 3). The measurement system used Hohner 21–122–500 encoders with the resolution of 500 impulses for determining the angular velocities of the left drive wheel ω L and right drive wheel ω P . Then, the above was used to generate the wheelchair velocity histogram from which single propelling cycles were separated (Figure 4).
Given the wheelchair linear velocity v t for a single propelling cycle, firstly, the path distance was defined s C (1) and the wheelchair total acceleration a T (2). Based on the defined acceleration a T the propelling force F D (3) of the whole wheelchair was calculated. Given the propelling force F D power P t was calculated (4). Then, based on the above and based on the given propelling cycle duration time, total mechanical energy E generated during a single cycle was determined (5).
s C = t s t a r t t e n d v t d t
a T t = d v t d t
F D t = m h + m w a T t = m h + m w d v t d t
P t =   F D t v t =   m h + m w d v t d t v t
E = t s t a r t t e n d P t d t =   t s t a r t t e n d F D t v t d t
where: s C is the a path distance by the wheelchair during a single propelling cycle, t s t a r t is the propelling cycle starting time, t e n d is the propelling cycle stopping time, a T is the wheelchair total acceleration considering all the enforcements and delays occurring in the propelling cycle, v is the wheelchair linear velocity measured at the constant time interval, F D is the wheelchair propelling force affecting the human-wheelchair system, m h is the body weight, m w is the wheelchair weight, P is the power of the human-wheelchair system generated in the propelling cycle, E is the mechanical energy generated after the end of the entire propelling cycle.
The muscle activity measurement enabling the estimation of the upper limb muscle activity was conducted by means of Noraxon Mini DTS apparatus for surface electromyography equipped with four measurement channels. The analysis and recording of the muscle activity signal was carried out with the use of Noraxon MR3 software. The muscle effort analysis applied to four muscles taking part in propelling the wheelchair: deltoid muscle anterior and posteriori, triceps brachii, and extensor carpi radialis longus. Prior to the commencement of the proper muscle activity measurement (during slope climbing), each participant went through a standardization procedure consistent with the guidelines of EMG [45], the apparatus producer. It was aimed at determining a reference value necessary for subsequent calculations. A set of five dedicated exercises was carried out to test the maximum contraction of any muscle, which was selected on the basis of the previous studies [15]. The recorded data were normalized successively, taking the arithmetic mean of the amplitude of the highest signal segment with a constant duration of 1000 ms as the reference value. Round electrodes (20 mm in diameter) with a gel were used in the tests. They were placed in the central part of the tested muscles belly. The measurements were carried out with the frequency of 1500 Hz. Standardization was performed a day before the proper test, to allow muscle regeneration after an effort resulting from the standardization procedure. After a one-day rest, a participant performed the proper measurement test on the ramp. The measured EMG signals were rectified and then smoothed using Root Mean Square (RMS) algorithms with a window width of 150 ms. Later the maximum voluntary contraction test (MVC) was performed. This post-processing method uses a reference value normalize subsequent EMG data series (6). The output is displayed as a percentage of the MVC value, which can be used to establish easily a common ground when comparing data between repetitions and subjects.
M A =   M V C M V C m a x · 100 %

3. Results

Each tested participant climbed the ramp six times. Three times with the activated anti-rollback system and three times with the deactivated anti-rollback system. Three complete propelling cycles were separated from each climbing made by a participant, and they were subject to a further kinematic and biomechanical analysis. The following was verified as part of the kinematic analysis: propelling cycle maximum velocity v m a x , propelling cycle minimum velocity v m i n , propelling cycle medium velocity M v , path distance during a single propelling cycle s , propelling cycle duration t c y c l e , a push phase share in the propelling cycle, a return phase share in the propelling cycle, the ratio of generated average power and average loss power for a single propelling cycle λ , and the total mechanical energy after a single propelling cycle E . The average values of these kinematic parameters for 72 propulsion cycles performed in total by 8 users are presented in Table 2.
The measurement results of the path distance in a single propelling cycle s , maximum velocity obtained in a single propelling cycle v m a x and the share of the p u s h phase in the propelling cycle during ramp climbing for all the tested participants are presented in Figure 5, Figure 6 and Figure 7. The diagrams include the division of the analyzed values among respective participants and a mean value for the entire population. The kinematic parameters shown in these diagrams were characteristic for the highest discrepancy between the activated anti-rollback system and the deactivated anti-rollback system.
The impact of the use of the anti-rollback system on respective participants depending on the analyzed kinematic parameter is presented in Figure 8, Figure 9 and Figure 10, and Table 3 and Table 4. In order to depict the differences between the activation and deactivation of the anti-rollback system, the percentage increases or decreases ∆ of kinematic parameters were determined individually for each participant.
Based on the analysis of the kinematic parameter values averaged for each participant, the following comparison was prepared (Table 5) containing information on the average percentage difference in the values of the tested parameters depending on the activation and deactivation of the anti-rollback system. Moreover, the comparison includes the information on the number of participants in which the increase, decrease and lack of changes occurred in the values of the tested kinematic parameters with the activated anti-rollback system during slope climbing.
Simultaneously, with the kinematic parameters measurement, the muscle activity measurement was carried out for each tested participant. The analysis involved only the muscle activity M A measured during ramp climbing. The aim of this analysis was to compare the impact of the activated anti-rollback system on the selected muscles of the upper limb. The average results of the muscle activity of the upper limb four muscles for respective participants are presented in Figure 11, and in Table 6 and Table 7. The compared results also include a percentage difference Δ between the muscle activity measured with the activated anti-rollback system and with the deactivated anti-rollback system.

4. Discussions

Based on the mean from the performed 72 measurement tests it was determined that the average maximum velocity v m a x in a single propelling cycle with the activated anti-rollback system was 0.47 m/s and with the deactivated anti-rollback system it was 0.54 m/s. This results in a 13% decrease in velocity during ramp climbing with the activated anti-rollback system in relation to the ramp climbing with the deactivated anti-rollback system. In the event of the minimum velocity of the propelling cycle, the following values were recorded: 0.13 m/s for the activated anti-rollback system and 0.27 m/s for the deactivated anti-rollback system. This results in 52% decrease in velocity during ramp climbing with the activated anti-rollback system in relation to the ramp climbing with the deactivated anti-rollback system. When averaging the velocity of a single propelling cycle and then determining a mean for all the performed measurement tests, the results were as follows: 0.31 m/s for the activated anti-rollback system and 0.42 m/s for the deactivated anti-rollback system. For this parameter, the decrease amounted to 26% during ramp climbing with the activated anti-rollback system. Despite this decrease of the average propelling cycle velocity with the activated anti-rollback system, a minor difference in the path distance in a single propelling cycle was observed. The decrease in the path distance in a single propelling cycle s equaling 7% with the activated anti-rollback system was determined. Moreover, during ramp climbing with the activated anti-rollback system, it was determined that the average increase in the propelling cycle duration time t c y c l e was 1%.
These observations indicate that the kinematics of the upper limb movement propelling the drive wheel did not change with the activated anti-rollback system in relation to the wheelchair without such modifications. This was confirmed by the analysis of the push phase share in the propelling cycle because an average value of the push phase share was the same for ramp climbing with the activated anti-rollback system and with the deactivated anti-rollback system. The differences described in the velocity values result only from supplying the propelling system with an additional element generating motion resistances.
The analysis of power and mechanical energy indicated that for the coefficient of generated power and loss power ratio λ, the decrease of 18% was observed. The skewness µ of the measured coefficient distribution λ is also of importance here. It was right-sided for ramp climbing with the activated and deactivated anti-rollback system. Therefore, for the majority of the performed tests, the coefficient values λ were higher than the average value. Whereas, the average coefficient value λ for ramp climbing with the activated anti-rollback system was 0.8 and for ramp climbing with the deactivated anti-rollback system it was 0.97. The differentiation of coefficient λ indicates the significant impact of additional motion resistances resulting from the use of the anti-rollback system. In the event of the total mechanical energy of a single propelling cycle, it was observed that the use of the anti-rollback system did not exert any significant impact. Based on the measured values it was determined that the total mechanical energy o E decreased on average merely by 3% during ramp climbing with the activated anti-rollback system.
Referring to the individual evaluation of kinematic parameters for respective participants, it was determined that for 88% tested participants, the increase in the propelling cycle duration time t was observed cycle, which on average amounted to 6% as compared to ramp climbing with the deactivated anti-rollback system. This proves the performance of propelling cycles with lower frequency. Probably, such a phenomenon is a consequence of the feeling of safety [42] in users who did not have to worry about wheelchair rolling down in the event of decreasing the frequency of propelling cycles. For 63% participants, the maximum velocity decrease v m a x was recorded on average as 12% during ramp climbing with the activated anti-rollback system. For the same number of participants, the decrease was observed in coefficient λ, which was 17% during ramp climbing with the anti-rollback system. While analyzing the changes in the value of the total mechanical energy, it was observed that in 50% participants there was the increase of mechanical energy. In the event of the push phase measurement in the propelling cycle, it was observed that in 63% of participants, an increase was observed and in 37%—a decrease was observed in the push phase. Whereas, the difference in the shares of the push phase depending on the activation of the anti-rollback system did not exceed 1%. A main factor affecting the differences among respective participants in the increases or decreases of respective kinematic parameters during ramp climbing with the activated or deactivated anti-rollback system includes physical conditions such as static force during pushing and body performance [46]. In the case of participants with a push force lower than the average (for all subjects), the greatest drops in the kinematic parameters of the wheelchair were found while using the anti-rollback system. In participants with a high physical fitness, the high amplitudes of wheelchair acceleration were observed which resulted directly in the value of mechanical energy.
The analysis of muscle activity (MA) demonstrated that during the use of the anti-rollback system when climbing the ramp, the participant’s muscle system was exposed to a higher effort as compared to ramp climbing without the use of the anti-rollback system. An exception from the above observation was determined only in two cases. During the M A measurement of deltoid muscle posteriori for Participant 2 with the recorded 0.62% decrease during the use of the anti-rollback system, and the M A measurement of triceps brachii for Participant 5, with the observed 21.27% decrease during the use of the anti-rollback system. During ramp climbing, the highest M A increase was recorded for Deltoid muscle anterior. The average M A increase value during ramp climbing with the activated anti-rollback system was 18.56%. For all the tested muscles, a difference in muscle effort ( M A ) depending on the use of the anti-rollback system was at a similar level and it amounted to accordingly: deltoid muscle anterior—18.56%, deltoid muscle posteriori—12.37%, triceps brachii—13.0%, extensor carpi radialis longus—15.44%. As with the analysis of kinematic parameters, also during the analysis of muscle activity, a considerable increase in the percentage difference was observed between muscle activity measured with the activated anti-rollback system and the deactivated anti-rollback system for participants demonstrating a large experience in the operation of a manual wheelchair. This phenomenon may be observed in Participants 1 to 4, especially for muscle effort measured on deltoid muscle anterior and triceps brachii.
The two types of recordings (with and without anti-rollback system) were made for each subject for four muscles. The determined values of muscle activity were analyzed statistically. The significance level of differences between these results was analyzed by paired student’s t-test. For all statistical tests, the limit of significance was set on 5% level (p < 0.05). The determined values of student’s t-test are shown in Table 8.
The determined values show that in most cases (88%) for the analyzed muscles, significant differences according to the student’s t-test (p < 0.05) can be indicated. Values deviating from this rule are as follows: triceps brachii for Participant 1, extensor carpi radialis longus for Participants 2 and 5, deltoid muscle posteriori for Participants 3, 7, 8 and deltoid muscle anterior for Participant 6. The results of the analysis showed no differences for the examined muscles of Participant 4.
Interestingly, there were no statistically significant differences in more than one muscle in any of the cases. Perhaps the human factor is responsible for such an observation. Everyone has their own individual way of performing certain physical activities. Propulsive movements may differ from one participant to the other: torso tilt, limb motion range, or hand motion trajectory. As a result, individual people carry out the work related to propelling the wheelchair, engaging different muscle groups in this activity in different ways. This suggests that, in future, tests should focus on examining the influence of the position of the human body on the recorded results (in the context of the movement of body segments while propelling the wheelchair).

5. Conclusions

It is unquestionable that the use of various anti-rollback system structures in wheelchairs with manual propulsion system increases the operation safety and usage comfort. Nevertheless, comfort is to be understood as the psychical comfort of a user having the increased safety feeling and awareness of the possibility of resting in any place, even on the ramp with a significant inclination angle [42]. Unfortunately, this comfort does not result in the mechanical and biomechanical parameters describing the human-wheelchair anthropotechnic system. The performed analysis of kinematic parameters demonstrated their deterioration in the event of using a wheelchair equipped with the anti-rollback system. This is particularly visible in the decreases in the wheelchair velocity. The reasons for the decrease in the velocity value is the outcome of introducing additional motion resistances to the system due to the specification of the tested anti-rollback system structure. Additional rolling resistances result from a friction coupling between the anti-rollback system and the wheelchair drive wheel. As part of this coupling, in order to avoid a slide between the brake roller and the drive wheel, a force pressing the brake roller is generated. The presence of this force results in the deformation of a drive wheel tire, thus additional resistances are introduced to the propulsion system during brake roller rolling along the drive wheel. In the event of a disabled person with a significant disability degree or with little experience in the operation of a wheelchair, the use of the anti-rollback system is advantageous even despite the determined decrease of a few percent of some kinematic parameters. This thesis results from the main anti-rollback system advantages, which is the improvement of operation safety and preventing the wheelchair rolling down the ramp. In the event of participants with much experience in the wheelchair operation and demonstrating significant physical fitness, the anti-rollback system may introduce adverse limitations in their learnt biomechanics of wheelchair propulsion. The impact of supplying the human-wheelchair system with additional motion resistances resulted in the muscle effort increase. In the muscle activity analysis, it was observed that the highest deterioration of this parameter was in participants with significant physical fitness and large experience in the wheelchair operation.
The conducted research achieved the main goal of supplementing the qualitative assessment performed for anti-rollback systems with additional quantitative tests. As part of these studies, the impact of the anti-rollback system on the kinematic, dynamic and biomechanical parameters when driving a manual wheelchair was assessed. It must be noted that the tests involved the anti-rollback system design solution based on the unidirectional coupling. It resulted in the above discussed motion resistances which reduced effectively the possibility of mechanical energy accumulation during wheelchair acceleration in the horizontal section before the ramp. This had a particularly negative effect in participants who conditioned their ramp climbing technique on such a phenomenon. In the event of using the anti-rollback system, kinematic parameters increase and a muscle effort decreases with the uniform and long-term propelling cycles. Hence, it is worth conducting identical tests for other design solutions fulfilling the same function [47]. In consequence, it would be possible to reduce the negative impact of the anti-rollback system on kinematic and biomechanical parameters, with the simultaneous lack of impact on the natural technique of ramp climbing which is based on the mechanical energy accumulation through wheelchair acceleration [24]. It is worth emphasizing, however, that in some cases the user’s feeling of safety, which directly translates into driving comfort, may be more important than the need to exercise more physical effort while climbing a ramp. Calm implementation of successive propulsion phases with greater force (as a result of the use of an anti-rollback device) may be subjectively perceived by the user as seemingly easier than more dynamic and chaotic propulsion of the wheelchair in such a way that it does not roll back while climbing the ramp, even if it requires less force (no additional friction in the system). The solution can be beneficial for disabled people with high physical fitness, e.g., athletes [48,49] and people infirm or inexperienced in moving in a wheelchair, as it affects their efficiency while moving [50].

6. Patents

Patent application in the Patent Office of the Republic of Poland, 431924, Module for the Universal Lever Brake of a Wheelchair Wheel, WIECZOREK Bartosz, WARGUŁA, 2019.
Patent application in the Patent Office of the Republic of Poland, 431449, Wheelchair Reversing Lock Module for Lift Parking Brake, WIECZOREK Bartosz, WARGUŁA Łukasz, BERDYCHOWSKI Maciej, 2019.

Author Contributions

Conceptualization, B.W., Ł.W. and M.K.; methodology, B.W.; software, D.R.; validation, B.W., M.K., Ł.W.; formal analysis, B.W.; investigation, B.W., M.K., Ł.W.; resources, B.W.; data curation, B.W.; writing—original draft preparation, B.W.; writing—review and editing, B.W. and M.K.; visualization, B.W.; supervision, B.W.; project administration, B.W.; funding acquisition, B.W. All authors have read and agreed to the published version of the manuscript.
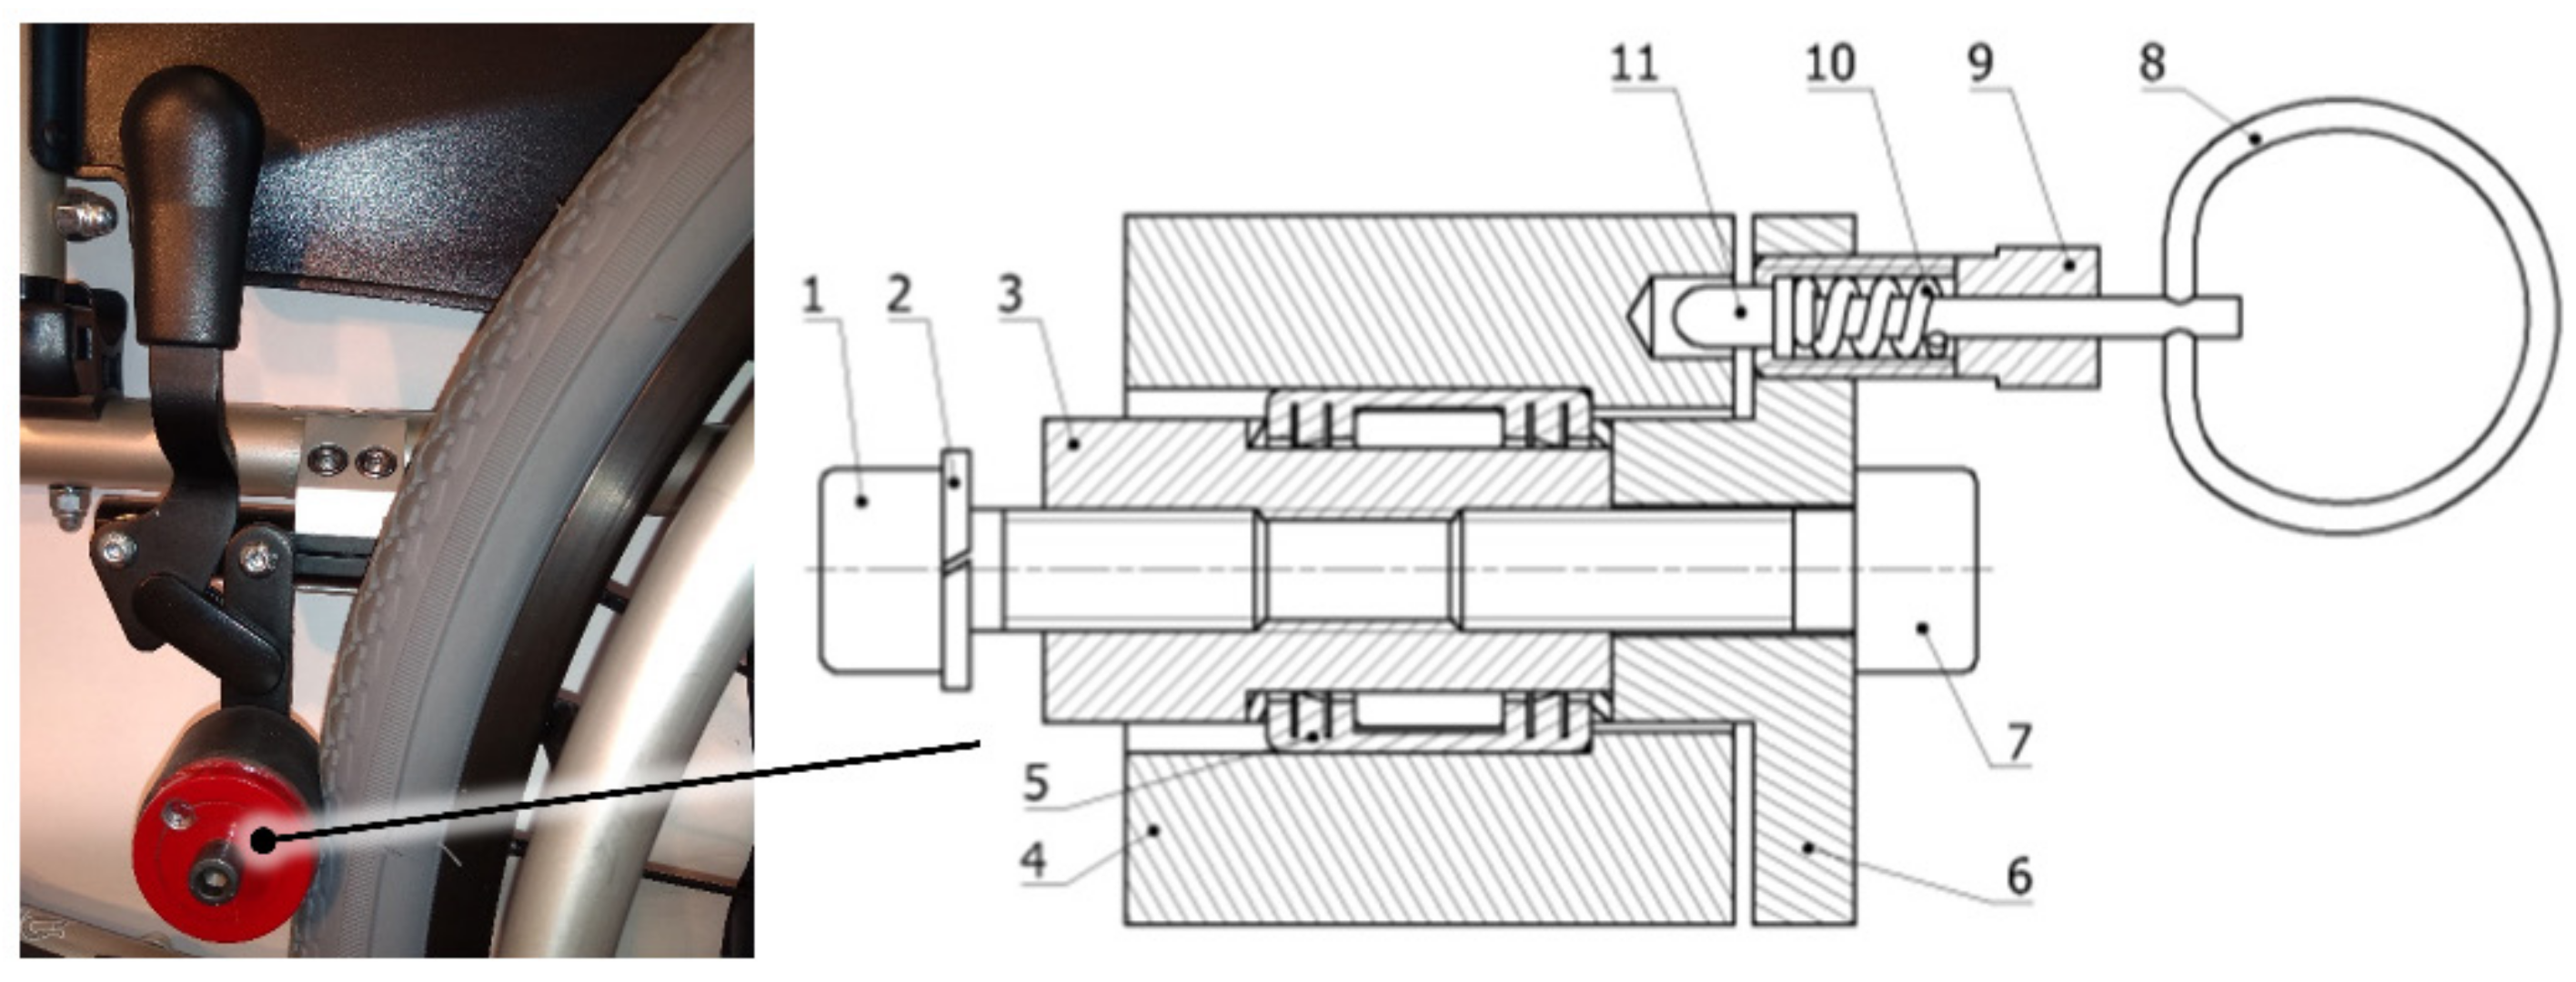
Funding

Wieczorek Bartosz, study of the biomechanics of manually propelled wheelchair for innovative manual and hybrid drives (LIDER/7/0025/L-7/15/2016) financed by the National Centre for Research and Development, https://www.ncbr.gov.pl/en/.

Conflicts of Interest

The authors declare no conflict of interest.

References

  1. Nikpour, M.; Huang, L.; Al-Jumaily, A.M. An Approach on Velocity and Stability Control of a Two-Wheeled Robotic Wheelchair. Appl. Sci. 2020, 10, 6446. [Google Scholar] [CrossRef]
  2. Van der Slikke, R.; Berger, M.; Bregman, D.; Veeger, D. Push characteristics in wheelchair court sport sprinting. Procedia Eng. 2016, 147, 730–734. [Google Scholar] [CrossRef]
  3. Wolniak, R.; Skotnicka-Zasadzień, B. Developing a Model of Factors Influencing the Quality of Service for Disabled Customers in the Condition s of Sustainable Development, Illustrated by an Example of the Silesian Voivodeship Public Administration. Sustainability 2018, 10, 2171. [Google Scholar] [CrossRef] [Green Version]
  4. Birau, F.R.; Dănăcică, D.E.; Spulbar, C.M. Social Exclusion and Labor Market Integration of People with Disabilities. A Case Study for Romania. Sustainability 2019, 11, 5014. [Google Scholar] [CrossRef] [Green Version]
  5. Bennett, S.; Lee Kirby, R.; Bennett, S.; Lee Kirby, R.; Macdonald, B. Wheelchair accessibility: Descriptive survey of curb ramps in an urban area. Disabil. Rehabil. Assist. Technol. 2009, 4, 17–23. [Google Scholar] [CrossRef]
  6. Lemaire, E.D.; O’Neill, P.A.; Desrosiers, M.M.; Robertson, D.G. Wheelchair ramp navigation in snow and ice-grit conditions. Arch. Phys. Med. Rehabil. 2010, 91, 1516–1523. [Google Scholar] [CrossRef] [PubMed]
  7. Shimada, S.D.; Robertson, R.N.; Bonninger, M.L.; Cooper, R.A. Kinematic characterization of wheelchair propulsion. J. Rehabil. Res. Dev. 1998, 35, 210–218. [Google Scholar] [PubMed]
  8. Pałasz, B.; Waluś, K.J.; Warguła, Ł. The determination of the rolling resistance coefficient of a passenger vehicle with the use of selected road tests methods. In MATEC Web of Conferences, Proceedings of the XXIII Polish-Slovak Scientific Conference on Machine Modelling and Simulations, Rydzyna, Poland, 4–7 September 2019; EDP Sciences: Lez Ili, France, 2019; Volume 254. [Google Scholar] [CrossRef]
  9. Sawicki, P.; Waluś, K.J.; Warguła, Ł. The comparative analysis of the rolling resistance coefficients depending on the type of surface–experimental research. In Proceedings of the 22nd International Scientific Conference on Transport Means (Transport Means), Traki, Lithuania, 3–5 October 2018; pp. 434–441. [Google Scholar]
  10. Warguła, Ł.; Wieczorek, B.; Kukla, M. The determination of the rolling resistance coefficient of objects equipped with the wheels and suspension system—Results of preliminary tests. In MATEC Web of Conferences, Proceedings of the XXIII Polish-Slovak Scientific Conference on Machine Modelling and Simulations, Rydzyna, Poland, 4–7 September 2019; EDP Sciences: Lez Ili, France, 2019; Volume 254. [Google Scholar] [CrossRef]
  11. Hartblay, C. Good ramps, bad ramps: Centralized design standards and disability access in urban Russian infrastructure. Am. Ethnol. 2017, 44, 9–22. [Google Scholar] [CrossRef]
  12. Vizioli, S.H.T.; Bruna, G.C.; Peres, P.T. A study of the pedestrian public ways in Sao Paulo City Centre, Brasil, focusing on wheelchair users. In Proceedings of the 24 Southern African Transport Conference (SATC 2005), Pretoria, Sount Africa, 11–13 July 2005; pp. 323–331. [Google Scholar]
  13. Blampied, N.; Tommelein, I.D. Product versus Performance Specification for Wheelchair Ramp Construction. In Proceedings of the 24th Annual International Group for Lean Construction (IGLC) Conference, Boston, MA USA, 18–24 July 2016; pp. 163–172. [Google Scholar]
  14. Zierke, P. Buildings and their location-Polish Technical Conditions 2018—Part III Buildings and Rooms. Available online: https://www.researchgate.net/publication/337338881_Buildings_and_their_Location_-_Polish_Technical_Conditions_2018_-_Part_III_Buildings_and_Rooms (accessed on 4 December 2020).
  15. Kukla, M.; Wieczorek, B.; Warguła, Ł. Development of methods for performing the maximum voluntary contraction (MVC) test. In MATEC Web of Conferences, Proceedings of the Machine Modelling and Simulations, Sklené Teplice, Slovak Republic, 5–8 September 2017; EDP Sciences: Lez Ili, France, 2018; Volume 157. [Google Scholar] [CrossRef] [Green Version]
  16. Sundaram, S.A.; Wang, H.; Ding, D.; Cooper, R.A. Step-climbing power wheelchairs: A literature review. Top. Spinal Cord Inj. Rehabil. 2017, 23, 98–109. [Google Scholar] [CrossRef] [Green Version]
  17. Quaglia, G.; Franco, W.; Oderio, R. Wheelchair. q, a mechanical concept for a stair climbing wheelchair. In Proceedings of the 2009 IEEE International Conference on Robotics and Biomimetics, Guilin, China, 19–23 December 2009; pp. 800–805. [Google Scholar] [CrossRef]
  18. Riascos, L.A. A low cost stair climbing wheelchair. In Proceedings of the 2015 IEEE 24th International Symposium on Industrial Electronics, Buzios, Brazil, 3–5 June 2015; pp. 627–632. [Google Scholar]
  19. Giacobbi, P.R., Jr.; Levy, C.E.; Dietrich, F.D.; Winkler, S.H.; Tillman, M.D.; Chow, J.W. Wheelchair users’ perceptions of and experiences with power assist wheels. Am. J. Phys. Med. Rehabil. 2010, 89, 225–234. [Google Scholar] [CrossRef]
  20. Kloosterman, M.G.; Snoek, G.J.; Van der Woude, L.H.; Buurke, J.H.; Rietman, J.S. A systematic review on the pros and cons of using a pushrim-activated power-assisted wheelchair. Clin. Rehabil. 2013, 27, 299–313. [Google Scholar] [CrossRef] [PubMed]
  21. Guillon, B.; Van-Hecke, G.; Iddir, J.; Pellegrini, N.; Beghoul, N.; Vaugier, I.; Figère, M.; Pradon, D.; Lofaso, F. Evaluation of 3 pushrim-activated power-assisted wheelchairs in patients with spinal cord injury. Arch. Phys. Med. Rehabil. 2015, 96, 894–904. [Google Scholar] [CrossRef] [PubMed]
  22. Kloosterman, M.G.; Eising, H.; Schaake, L.; Buurke, J.H.; Rietman, J.S. Comparison of shoulder load during power-assisted and purely hand-rim wheelchair propulsion. Clin. Biomech. 2012, 27, 428–435. [Google Scholar] [CrossRef]
  23. Van der Woude, L.H.; De Groot, S.; Janssen, T.W. Manual wheelchairs: Research and innovation in rehabilitation, sports, daily life and health. Med. Eng. Phys. 2006, 28, 905–915. [Google Scholar] [CrossRef]
  24. Wieczorek, B.; Warguła, Ł.; Rybarczyk, D. Impact of a Hybrid Assisted Wheelchair Propulsion System on Motion Kinematics during Climbing up a Slope. Appl. Sci. 2020, 10, 1025. [Google Scholar] [CrossRef] [Green Version]
  25. Oh, S.; Hori, Y. Disturbance attenuation control for power-assist wheelchair operation on slopes. IEEE Trans. Control Syst. Technol. 2013, 22, 828–837. [Google Scholar]
  26. Chen, S.H.; Yang, C.L.; Chou, J.J. Novel optimal cross-coupling control for the power wheelchair with rim motor. In Proceedings of the IEEE International Conference on Automation Science and Engineering (CASE), Gothenburg, Sweden, 24–28 August 2015; pp. 1533–1538. [Google Scholar]
  27. Warguła, Ł.; Kukla, M.; Wieczorek, B. The impact of wheelchairs driving support systems on the rolling resistance coefficient. IOP Conf. Ser. Mater. Sci. Eng. 2020, 776, 012076. [Google Scholar] [CrossRef]
  28. Cooper, R.A.; Corfman, T.A.; Fitzgerald, S.G.; Boninger, M.L.; Spaeth, D.M.; Ammer, W.; Arva, J. Performance assessment of a pushrim-activated power-assisted wheelchair control system. IEEE Trans. Control Syst. Technol. 2002, 10, 121–126. [Google Scholar] [CrossRef]
  29. Oh, S.; Kong, K.; Hori, Y. Operation state observation and condition recognition for the control of power-assisted wheelchair. Mechatronics 2014, 24, 1101–1111. [Google Scholar] [CrossRef]
  30. Wieczorek, B.; Warguła, Ł. Module for the Universal Lever Brake of a Wheelchair Wheel; Poznan University of Technology: Poznań, Poland, 2019. [Google Scholar]
  31. Dallmeijer, A.J.; van der Woude, L.H.; Veeger, H.D.; Hollander, A.P. Effectiveness of force application in manual wheelchair propulsion in persons with spinal cord injuries. Am. J. Phys. Med. Rehabil. 1998, 77, 213–221. [Google Scholar] [CrossRef]
  32. Gagnon, D.H.; Babineau, A.C.; Champagne, A. Pushrim biomechanical changes with progressive increases in slope during motorized treadmill manual wheelchair propulsion in individuals with spinal cord injury. J. Rehabil. Res. Dev. 2014, 51, 789. [Google Scholar] [CrossRef] [PubMed]
  33. Sauret, C.; Vaslin, P.; Dabonneville, M.; Cid, M. Drag force mechanical power during an actual propulsion cycle on a manual wheelchair. Irbm 2009, 30, 3–9. [Google Scholar] [CrossRef] [Green Version]
  34. Koontz, A.M.; Cooper, R.A.; Boninger, M.L.; Yang, Y.; Impink, B.G.; Van Der Woude, L.H. A kinetic analysis of manual wheelchair propulsion during start-up on select indoor and outdoor surfaces. J. Rehabil. Res. Dev. 2005, 42, 447–458. [Google Scholar] [CrossRef] [PubMed] [Green Version]
  35. Robertson, R.N.; Boninger, M.L.; Cooper, R.A.; Shimada, S.D. Pushrim forces and joint kinetics during wheelchair propulsion. Arch. Phys. Med. Rehabil. 1996, 77, 856–864. [Google Scholar] [CrossRef]
  36. Mercer, J.L.; Boninger, M.; Koontz, A.; Ren, D.; Dyson-Hudson, T.; Cooper, R. Shoulder joint kinetics and pathology in manual wheelchair users. Clin. Biomech. 2006, 21, 781–789. [Google Scholar] [CrossRef]
  37. Collinger, J.L.; Boninger, M.L.; Koontz, A.M.; Price, R.; Sisto, S.A.; Tolerico, M.L.; Cooper, R.A. Shoulder Biomechanics During the Push Phase of Wheelchair Propulsion: A Multisite Study of Persons With Paraplegia. Arch. Phys. Med. Rehabil. 2008, 89, 667–676. [Google Scholar] [CrossRef]
  38. Van Der Woude, L.H.; Hendrich, K.M.; Veeger, H.E.; van Ingen Schenau, G.J.; Rozendal, R.H.; De Groot, G.; Hollander, A.P. Manual wheelchair propulsion: Effects of power output on physiology and technique. Med. Sci. Sports Exerc. 1988, 20, 70–78. [Google Scholar] [CrossRef]
  39. Rozendaal, L.A.; Veeger, H.E.J.; Van Der Woude, L.H.V. The push force pattern in manual wheelchair propulsion as a balance between cost and effect. J. Biomech. 2003, 36, 239–247. [Google Scholar] [CrossRef]
  40. Delahoussaye, R.D.; Brazell, I.J.W. Wheelchair Anti-Rollback Mechanism. U.S. Patent No. 4,538,825, 3 September 1985. [Google Scholar]
  41. Fought, G.E.; Herrmann, R.J. Wheelchair with Combined Wheel Lock and Hill Holder. U.S. Patent No. 4,887,830, 19 December 1989. [Google Scholar]
  42. Manning, D.L. Anti-Rolling Device for Wheelchair. U.S. Patent No. 4,733,755, 29 March 1988. [Google Scholar]
  43. Krawiec, P.; Różański, L.; Czarnecka-Komorowska, D.; Warguła, Ł. Evaluation of the Thermal Stability and Surface Characteristics of Thermoplastic Polyurethane V-Belt. Materials 2020, 13, 1502. [Google Scholar] [CrossRef] [Green Version]
  44. Krawiec, P.; Warguła, Ł.; Małozięć, D.; Kaczmarzyk, P.; Dziechciarz, A.; Czarnecka-Komorowska, D. The Toxicological Testing and Thermal Decomposition of Drive and Transport Belts Made of Thermoplastic Multilayer Polymer Materials. Polymers 2020, 12, 2232. [Google Scholar] [CrossRef]
  45. Guo, L.Y.; Su, F.C.; Wu, H.W.; An, K.N. Mechanical energy and power flow of the upper extremity in manual wheelchair propulsion. Clin. Biomech. 2003, 18, 106–114. [Google Scholar] [CrossRef]
  46. Konrad, P. The ABC of EMG: A Practical Introduction to Kinesiological Electromyography; Noraxon, Inc.: Scottsdale, AZ, USA, 2005. [Google Scholar]
  47. Davis, G.M.; Kofsky, P.R.; Kelsey, J.C.; Shephard, R.J. Cardiorespiratory fitness and muscular strength of wheelchair users. Can. Med. Assoc. J. 1981, 125, 1317. [Google Scholar] [PubMed]
  48. Villacieros, J.; Pérez-Tejero, J.; Garrido, G.; Grams, L.; López-Illescas, Á.; Ferro, A. Relationship between Sprint Velocity and Peak Moment at Shoulder and Elbow in Elite Wheelchair Basketball Players. Int. J. Environ. Res. Public Health 2020, 17, 6989. [Google Scholar] [CrossRef] [PubMed]
  49. Egger, T.; Flueck, J.L. Energy Availability in Male and Female Elite Wheelchair Athletes over Seven Consecutive Training Days. Nutrients 2020, 12, 3262. [Google Scholar] [CrossRef]
  50. Perdios, A.; Sawatzky, B.J.; Sheel, A.W. Effects of camber on wheeling efficiency in the experienced and inexperienced wheelchair user. J. Rehabil. Res. Dev. 2007, 44, 459–466. [Google Scholar] [CrossRef]
Figure 1. The structure of the anti-rollback system used in the test.
Applsci 10 08757 g001
Figure 2. Test ramp outline, where: Section A—a section of the road where the wheelchair was accelerated, Section B—a section of the ramp for which the measurement results were not considered, Section C—a section of the ramp for which measurement was carried out, Section D—a final section in which the wheelchair was stopped, α-ramp inclination angle.
Applsci 10 08757 g002
Figure 3. A wheelchair with the test apparatus for measuring its motion kinematics, where: 1—incremental encoder with the resolution of 500 steps, a central unit collecting a measurement signal, 2—a central unit collecting a measurement signal. Selected symbol ω P is the angular velocity of the right wheel of the wheelchair.
Applsci 10 08757 g003
Figure 4. The example of the wheelchair velocity diagram during slope climbing (A) and a separated single propelling cycle in the function of the percentage value of the propelling cycle completion (B).
Applsci 10 08757 g004
Figure 5. The diagram with the wheelchair maximum velocity for all the analyzed measurement tests, where MAX v-on—wheelchair maximum velocity with the activated anti-rollback system, MAX v-off-wheelchair maximum velocity with the deactivated anti-rollback system, M MAX v-on—wheelchair average maximum velocity for all the measurement tests with the activated anti-rollback system, M MAX v-off—wheelchair average maximum velocity for all the measurement tests with the deactivated anti-rollback system.
Applsci 10 08757 g005
Figure 6. The diagram of the path distance in a single propelling cycle for all the analyzed measurement tests, where s-on—a path distance in a single propelling cycle with the activated anti-rollback system, s-off—a path distance in a single propelling cycle with the deactivated anti-rollback system, M s-on—an average road for all the measurement tests with the activated anti-rollback system, M s-off—an average road for all the measurement tests with the deactivated anti-rollback system.
Applsci 10 08757 g006
Figure 7. The diagram of the push phase share in the propelling cycle for all the analyzed measurement tests, where push-on—a push phase share with the activated anti-rollback system, push-off—a push phase share with the deactivated anti-rollback system, M push-on—an average push phase share for all the measurement tests with the activated anti-rollback system, M push-off—an average push phase share for all the measurement tests with the deactivated anti-rollback system.
Applsci 10 08757 g007
Figure 8. The diagrams of (a) the average values of the maximum velocity in the propelling cycle and a (b) path distance in a single propelling cycle (B) for respective participants with the activated anti-rollback system (anti-rollback ON) and the deactivated anti-rollback system (anti-rollback system OFF). Where: ∆—a percentage difference between the parameter measured with the activated anti-rollback-system and with the deactivated anti-rollback-system.
Applsci 10 08757 g008
Figure 9. The diagrams of (a) the average values of the propelling cycle duration time and (b) the push phase share in the propelling cycle for respective participants with the activated anti-rollback system (anti-rollback ON) and the deactivated anti-rollback system (anti-rollback system OFF). Where: ∆—a percentage difference between the parameter measured with the activated anti-rollback-system and with the deactivated anti-rollback-system.
Applsci 10 08757 g009
Figure 10. The diagrams of (a) the average coefficient of the generated power and loss power ratio in a single propelling cycle and (b) the total mechanical energy of a single propelling cycle for respective participants with the activated anti-rollback system (anti-rollback ON) and the deactivated anti-rollback system (anti-rollback system OFF). Where: ∆—a percentage difference between the parameter measured with the activated anti-rollback-system and with the deactivated anti-rollback-system.
Applsci 10 08757 g010
Figure 11. The diagrams of the average muscle activity for respective participants with the activated anti-rollback system (anti-rollback ON) and with the deactivated anti-rollback system (anti-rollback system OFF). Where: ∆—a percentage difference between the muscle activity measured with the activated anti-rollback-system and with the deactivated anti-rollback-system.
Applsci 10 08757 g011
Table 1. Comparison of anthropometric features and the level of experience in wheelchair operation of the test subjects. The experience was assessed on the basis of the number of hours spent driving a manual wheelchair.
HeightWeightAgePush ForceExperience
(cm)(kg)(Years)(N)(-)
Participant 11709633282●●●●●
Participant 21739033244●●●●○
Participant 31788932315●●●●●
Participant 41758332292●●●●○
Participant 51767233271●●●○○
Participant 61807433290●●○○○
Participant 717511032320●●●●○
Participant 817010329311●●●○○
● qualitative assessment of the driving skills of the wheelchair, where the ○ representing the user’s first contact with the manual drive.
Table 2. The comparison of the average tested kinematic parameters during ramp climbing with the activated anti-rollback system and with the deactivated anti-rollback system, where M-mean, σ—standard deviation, µ—distribution skewness coefficient (the description of the kinematic parameter symbols is provided in the text).
v m a x v m i n M v s t c y c l e P u s h R e t u r n λ E
(m/s)(m/s)(m/s)(m)(s)(-)(-)(-)(J)
anti–rollback ON M 0.470.130.310.401.060.620.380.800.30
σ 0.210.210.210.130.140.090.090.415.30
μ 0.951.371.090.57−2.01−0.620.621.70−1.27
anti-rollback OFF M 0.540.270.420.430.990.620.380.970.29
σ 0.230.220.230.150.170.100.100.485.49
μ 0.640.540.550.95−0.87−0.070.071.49−2.82
Table 3. The comparison of the average values of maximum velocity v m a x , of the roads, push phase duration time t c y c l e for respective participants. Where: ∆—a percentage difference between the parameter measured with the deactivated anti-rollback-system and the activated anti-rollback system, ON—activated anti-rollback system, OFF—deactivated anti-rollback system.
v m a x Δ s Δ t c y c l e Δ
(m/s)(m/s)(%)(m)(m)(%)(s)(s)(%)
ONOFF ONOFF ONOFF
Participant 10.440.7037.140.380.4515.561.100.7546.67
Participant 20.480.464.350.440.3912.821.091.062.83
Participant 30.860.9610.420.520.6114.750.730.695.80
Participant 40.650.7412.160.600.6913.041.061.050.95
Participant 50.270.3215.630.280.306.671.111.100.91
Participant 60.270.3215.630.280.293.451.081.123.57
Participant 70.340.340.000.290.316.451.081.090.92
Participant 80.560.560.000.490.466.521.101.0010.00
Table 4. The comparison of the average values of the push phase share in the entire propelling cycle, a coefficient of the generated power and loss power ratio in the propelling cycle λ , total mechanical energy for a single propelling cycle E . Where: Δ —a percentage difference between the parameter measured with the deactivated anti-rollback-system and the activated anti-rollback system, ON—activated anti-rollback system, OFF—deactivated anti-rollback system.
PushΔλΔEΔ
(-)(-)(%)(-)(-)(%)(J)(J)(%)
ONOFF ONOFF ONOFF
Participant 10.610.621.611.101.197.560.60−1.36144.12
Participant 20.530.6417.191.101.3116.033.371.24171.77
Participant 30.620.7618.420.860.6238.71−3.28−1.8379.23
Participant 40.690.639.520.580.9538.95−3.41−0.50582.00
Participant 50.630.5514.550.610.9837.760.540.6314.29
Participant 60.640.598.470.571.0244.120.270.7965.82
Participant 70.600.591.690.891.1321.240.920.7522.67
Participant 80.610.577.020.910.8210.981.370.121041.67
Table 5. The comparison of the average percentage difference in the values of the tested parameters M∆—a percentage difference in the average values of a selected kinematic parameter resulting from the activation of the anti-rollback system, increase—the number of participants in which the analyzed parameter was higher with the activated anti-rollback system than with the deactivated anti-rollback system, decrease—the number of participants in which the analyzed parameter was lower with the activated anti-rollback system than with the deactivated anti-rollback system, equality—the number of participants in which the analyzed parameter was equal with the activated anti-rollback system and with the deactivated anti-rollback system.
M Δ IncreaseDecreaseEquality
(%) Number of ParticipantsNumber of ParticipantsNumber of Participants
v m a x 12152
s 6260
t c y c l e 6710
p u s h 0530
λ 17260
E 337440
Table 6. The comparison of the average muscle activity of deltoid muscle anterior and deltoid muscle posteriori for respective participants, where MA—muscle activity, ON—activated anti-rollback system, OFF—deactivated anti-rollback system, Δ—a percentage difference between muscle activity measured with the activated anti-rollback system and the deactivated anti-rollback system.
Deltoid Muscle Anterior M A ΔDeltoid Muscle Posteriori M A Δ
(%) (%) (%) (%) (%) (%)
ONOFF ONOFF
Participant 1121.88168.5327.6864.2767.755.14
Participant 2109.19166.7534.5259.3558.980.62
Participant 3112.74137.9818.2964.0672.8412.06
Participant 4109.68119.157.95109.80140.9322.09
Participant 540.5446.3012.4385.4994.569.59
Participant 637.8544.8915.6795.1997.202.07
Participant 741.1950.1517.8754.7367.4917.87
Participant 849.8057.9214.0366.6594.9629.81
Table 7. The comparison of the average muscle activity of triceps brachii and extensor carpi radialis longus for respective participants, where M A —muscle activity, ON—activated anti-rollback system, OFF—deactivated anti-rollback system, Δ —a percentage difference between muscle activity measured with the activated anti-rollback system and the deactivated anti-rollback system.
Triceps Brachii M A Δ Extensor Carpi Radialis Longus M A Δ
(%)(%)(%)(%)(%)(%)
ONOFF ONOFF
Participant 151.3065.3721.5287.7293.866.54
Participant 260.1666.008.8571.5982.4113.14
Participant 353.1063.8416.8433.1233.410.86
Participant 437.4646.0518.6737.3943.3713.79
Participant 555.7145.9421.2719.0529.1834.69
Participant 646.6955.0515.1818.1423.2622.01
Participant 733.1535.636.9615.0720.7627.42
Participant 827.5543.9237.2826.9928.435.08
Table 8. The values of the student’s t-test for different muscles and participants.
MuscleParticipant Number
12345678
Deltoid muscle anterior0.03430.00110.00010.03830.03200.14961.36 × 1050.0314
Deltoid muscle posteriori0.00080.04930.22600.00724.75 × 1052.28 × 1050.84120.6248
Triceps brachii0.19630.04850.00182.13 × 1052.70 × 1050.00200.04700.0084
Extensor carpi radialis longus0.00000.86730.04711.01 × 1050.61460.00920.00200.0022
Publisher’s Note: MDPI stays neutral with regard to jurisdictional claims in published maps and institutional affiliations.

