1. Introduction
The unsupported excavations are commonly encountered in civil engineering projects. Slope instability failures pose serious threat to structures, as these failures may lead to great loss of lives and property [
1]. Predicting the stability of excavation is an important task for geotechnical engineers. The combined effects of geology, hydrology, and soil properties generally exist as stability issues.
In order to design the excavation, more rigorous numerical modeling is needed, especially for large-scale complex projects. However, the performing numerical simulations are not always warranted or feasible because of time and cost constraints [
2]. Therefore, stability numbers can be seen as convenient tools that provide an easier way to determine the factor of safety.
The stability numbers (
N) were used extensively as design tools, and draw the attention of many investigators. The first set of stability number was proposed by Taylor [
3] and various stability charts have been developed [
4,
5,
6,
7,
8,
9,
10,
11]. Traditionally, majority of research have studied the stability number by using the limit-equilibrium method (LEM), which is one of the most popular methods to assess the slope stability [
12,
13,
14]. It is known that for the LEM not only the potential slip surface must be assumed before calculating the factor of safety, but also it cannot guarantee the best solutions [
15]. It was found that the factor of safety, which is calculated by LEM, is overestimating compared with the other method [
16] and using the finite-element method (FEM) can avoid this drawback, as the failure mechanism is generated automatically [
17,
18]. With the finite-element method it is generally possible to model many complex conditions with a high degree of realism, including in the analyses, such as things as nonlinear stress–strain behavior, non-homogeneous conditions, and changes in geometry during construction of an excavation [
19].
The finite element method has been widely used to simulate excavation construction steps (e.g., [
20,
21,
22]). In a few research [
5,
9], FEM was used to perform stability charts by using FEM, and only limited parameters such as angle of inclination, the depth ratio, width ratio, which consists of a height, and a radius at the bottom of excavation was considered. In particular, majority of studies have studied homogenous soil. Therefore, various charts based on different valuable parameters such as a strength difference between two layers, relative to the top layer thickness in multi-layer is needed.
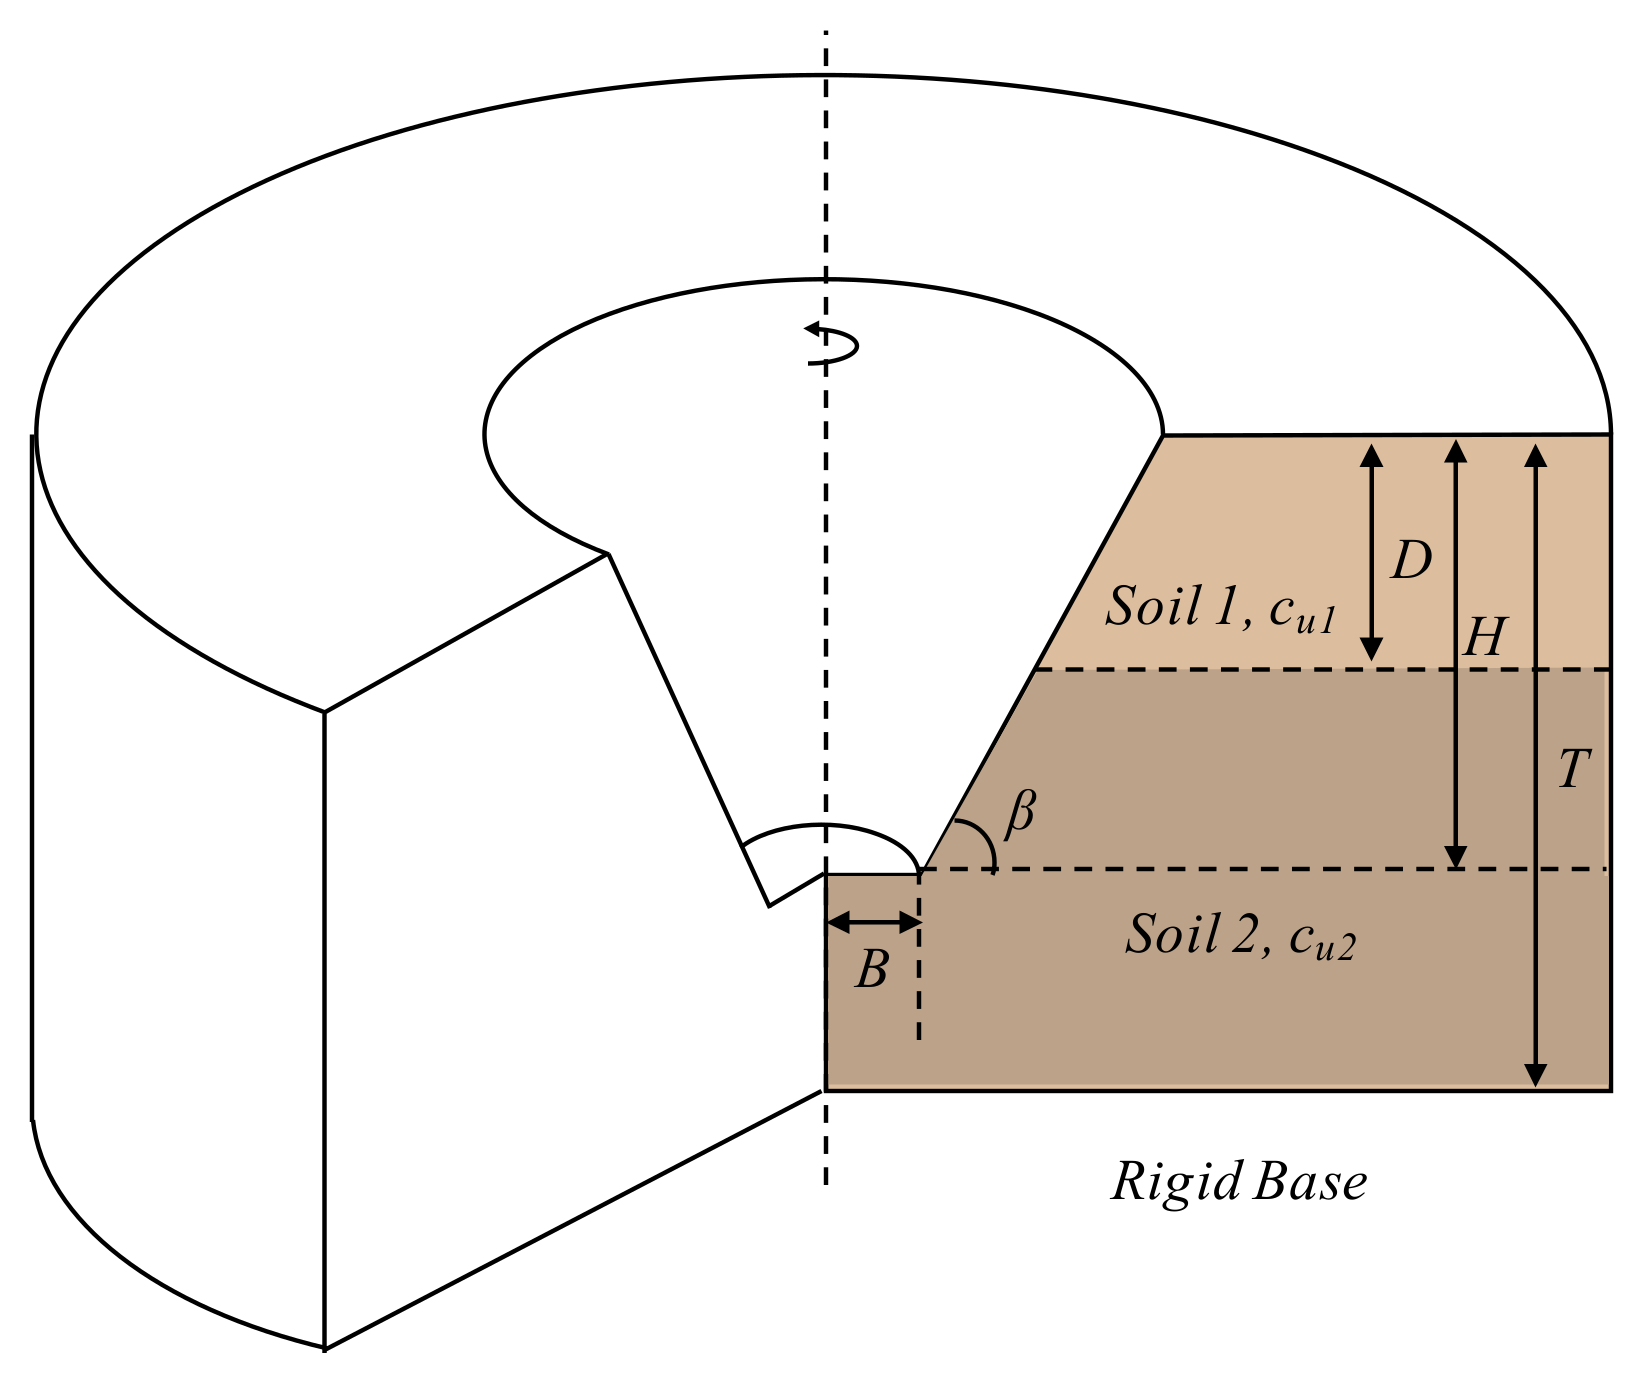
In this study, a series of numerical studies were conducted to assess the variation of the stability number in the multi-layer using FEM. The valuable parameters, which are (1) angle of inclination (
β), (2) depth ratio (
D/
H), which is relative to the top layer thickness to excavation depth, (3) strength ratio (c
u1/c
u2), which is strength difference between two different layers on the rigid base, (4) width ratio (
H/
B), which is the excavation height to radius at the bottom of excavation, and (5) thickness ratio (
T/
H), which is the ratio of the excavation height to thickness of soil layers, are considered to confirm the stability. The stability number (
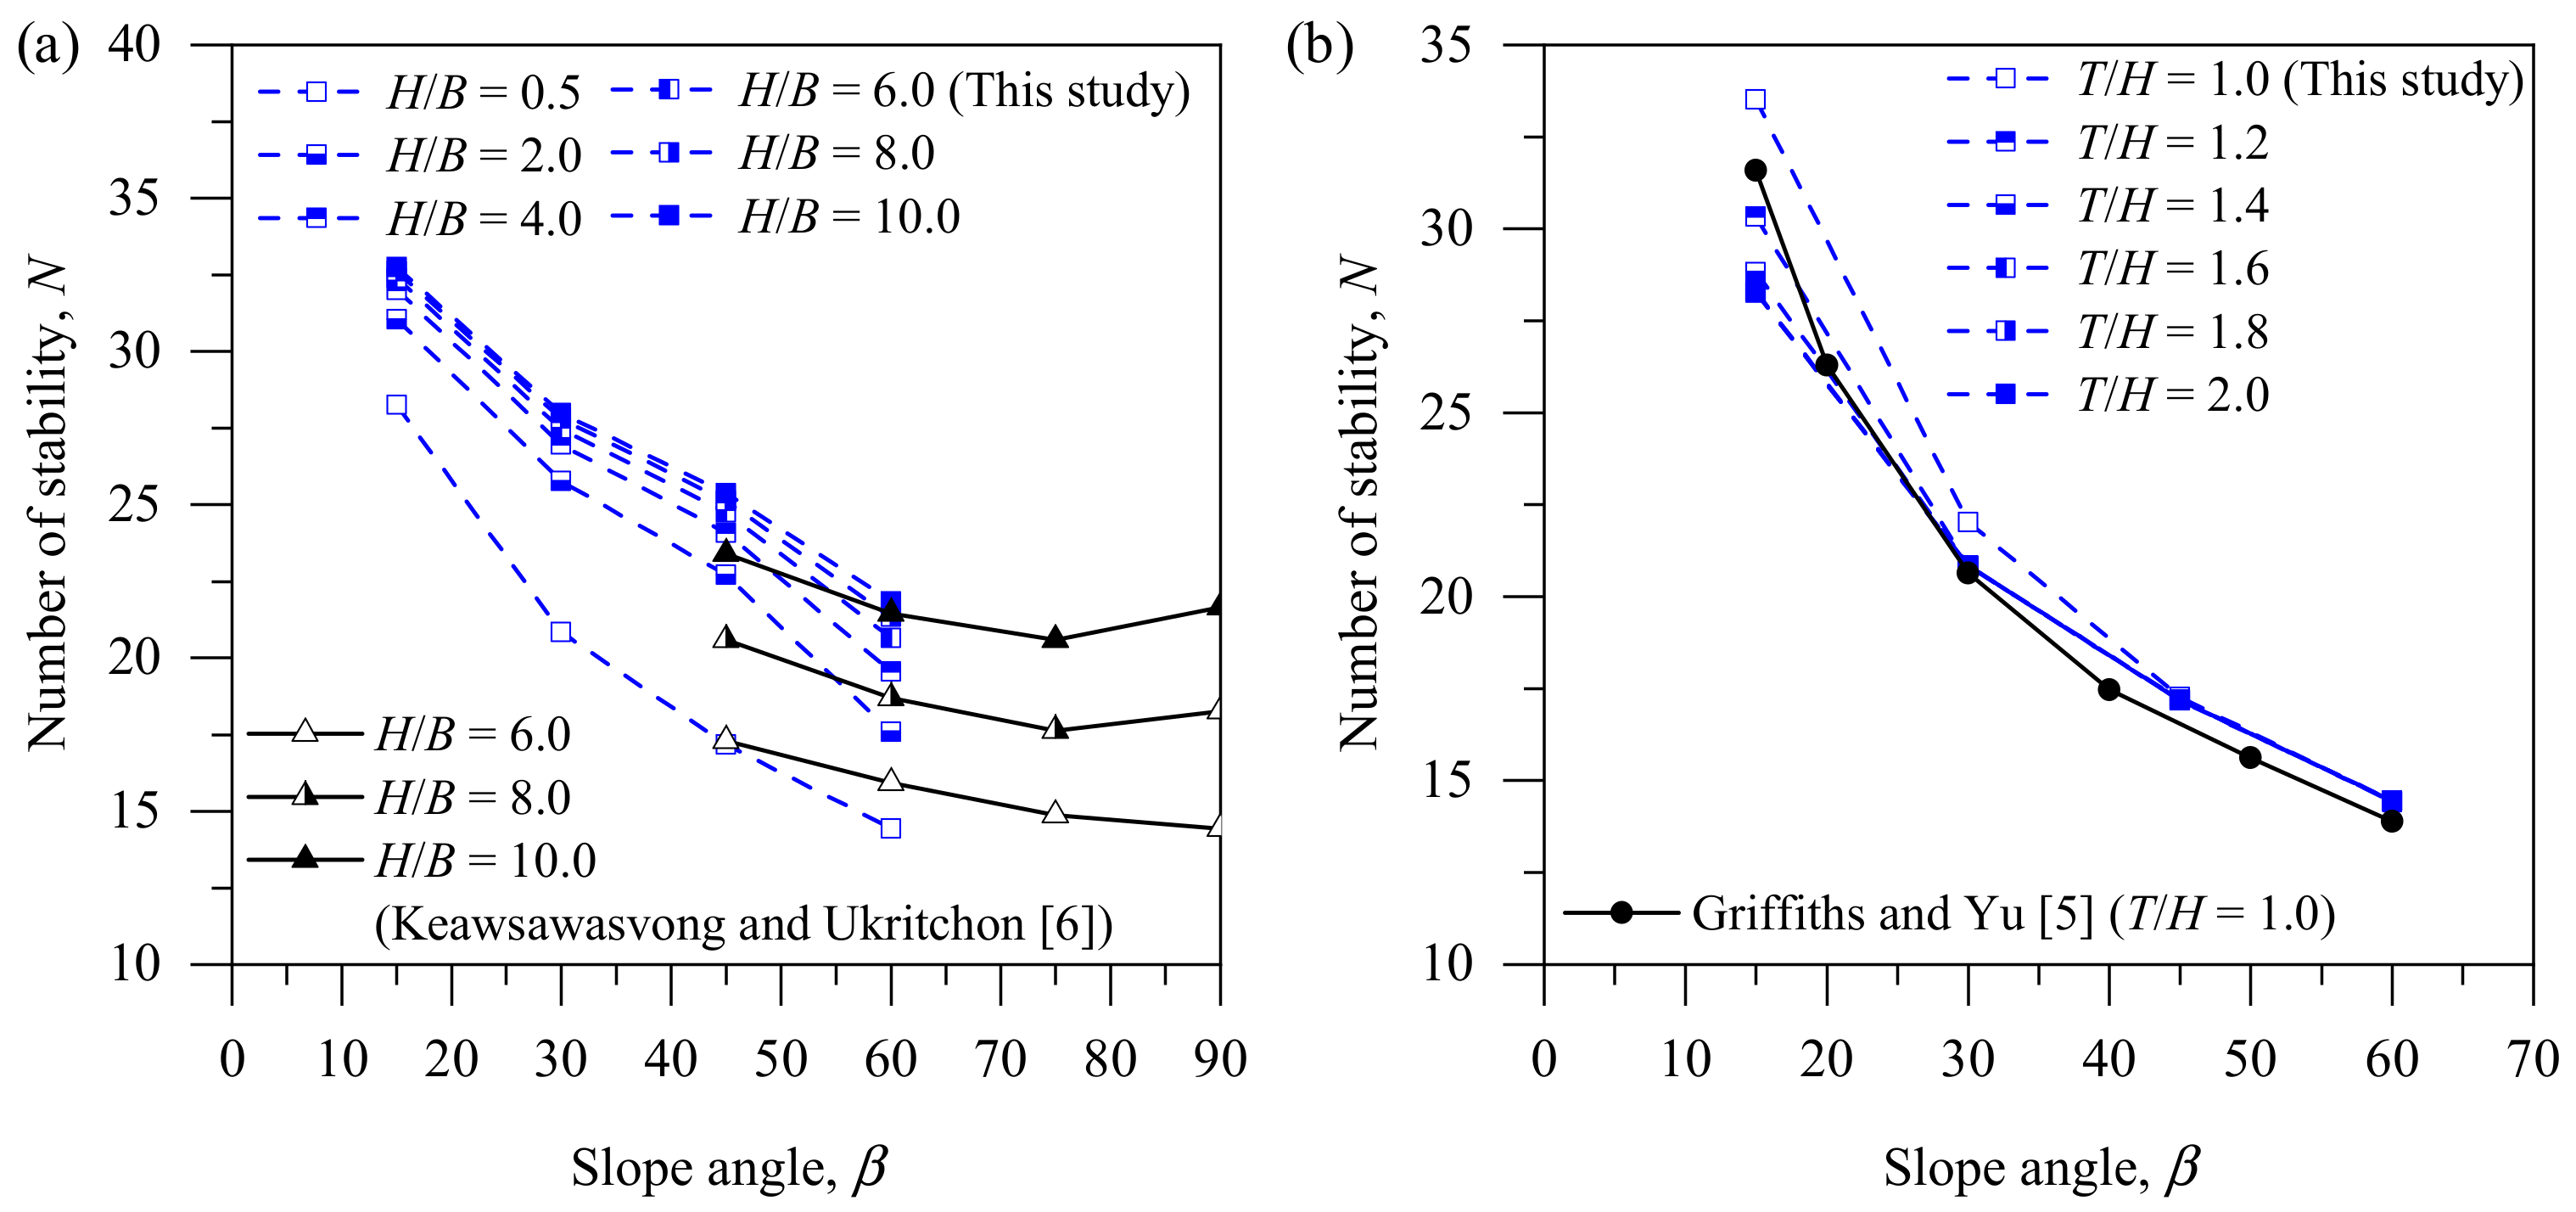
N) was provided as a function of these parameters. The obtained stability numbers are compared with existing solutions published in the literature [
5,
6]. The analysis results are in good agreement with published data. The stability numbers in variable conditions are presented using chart solutions. This chart shows the trend of stability number according to parameters and it can be used for engineering practice.
3. Results and Discussion
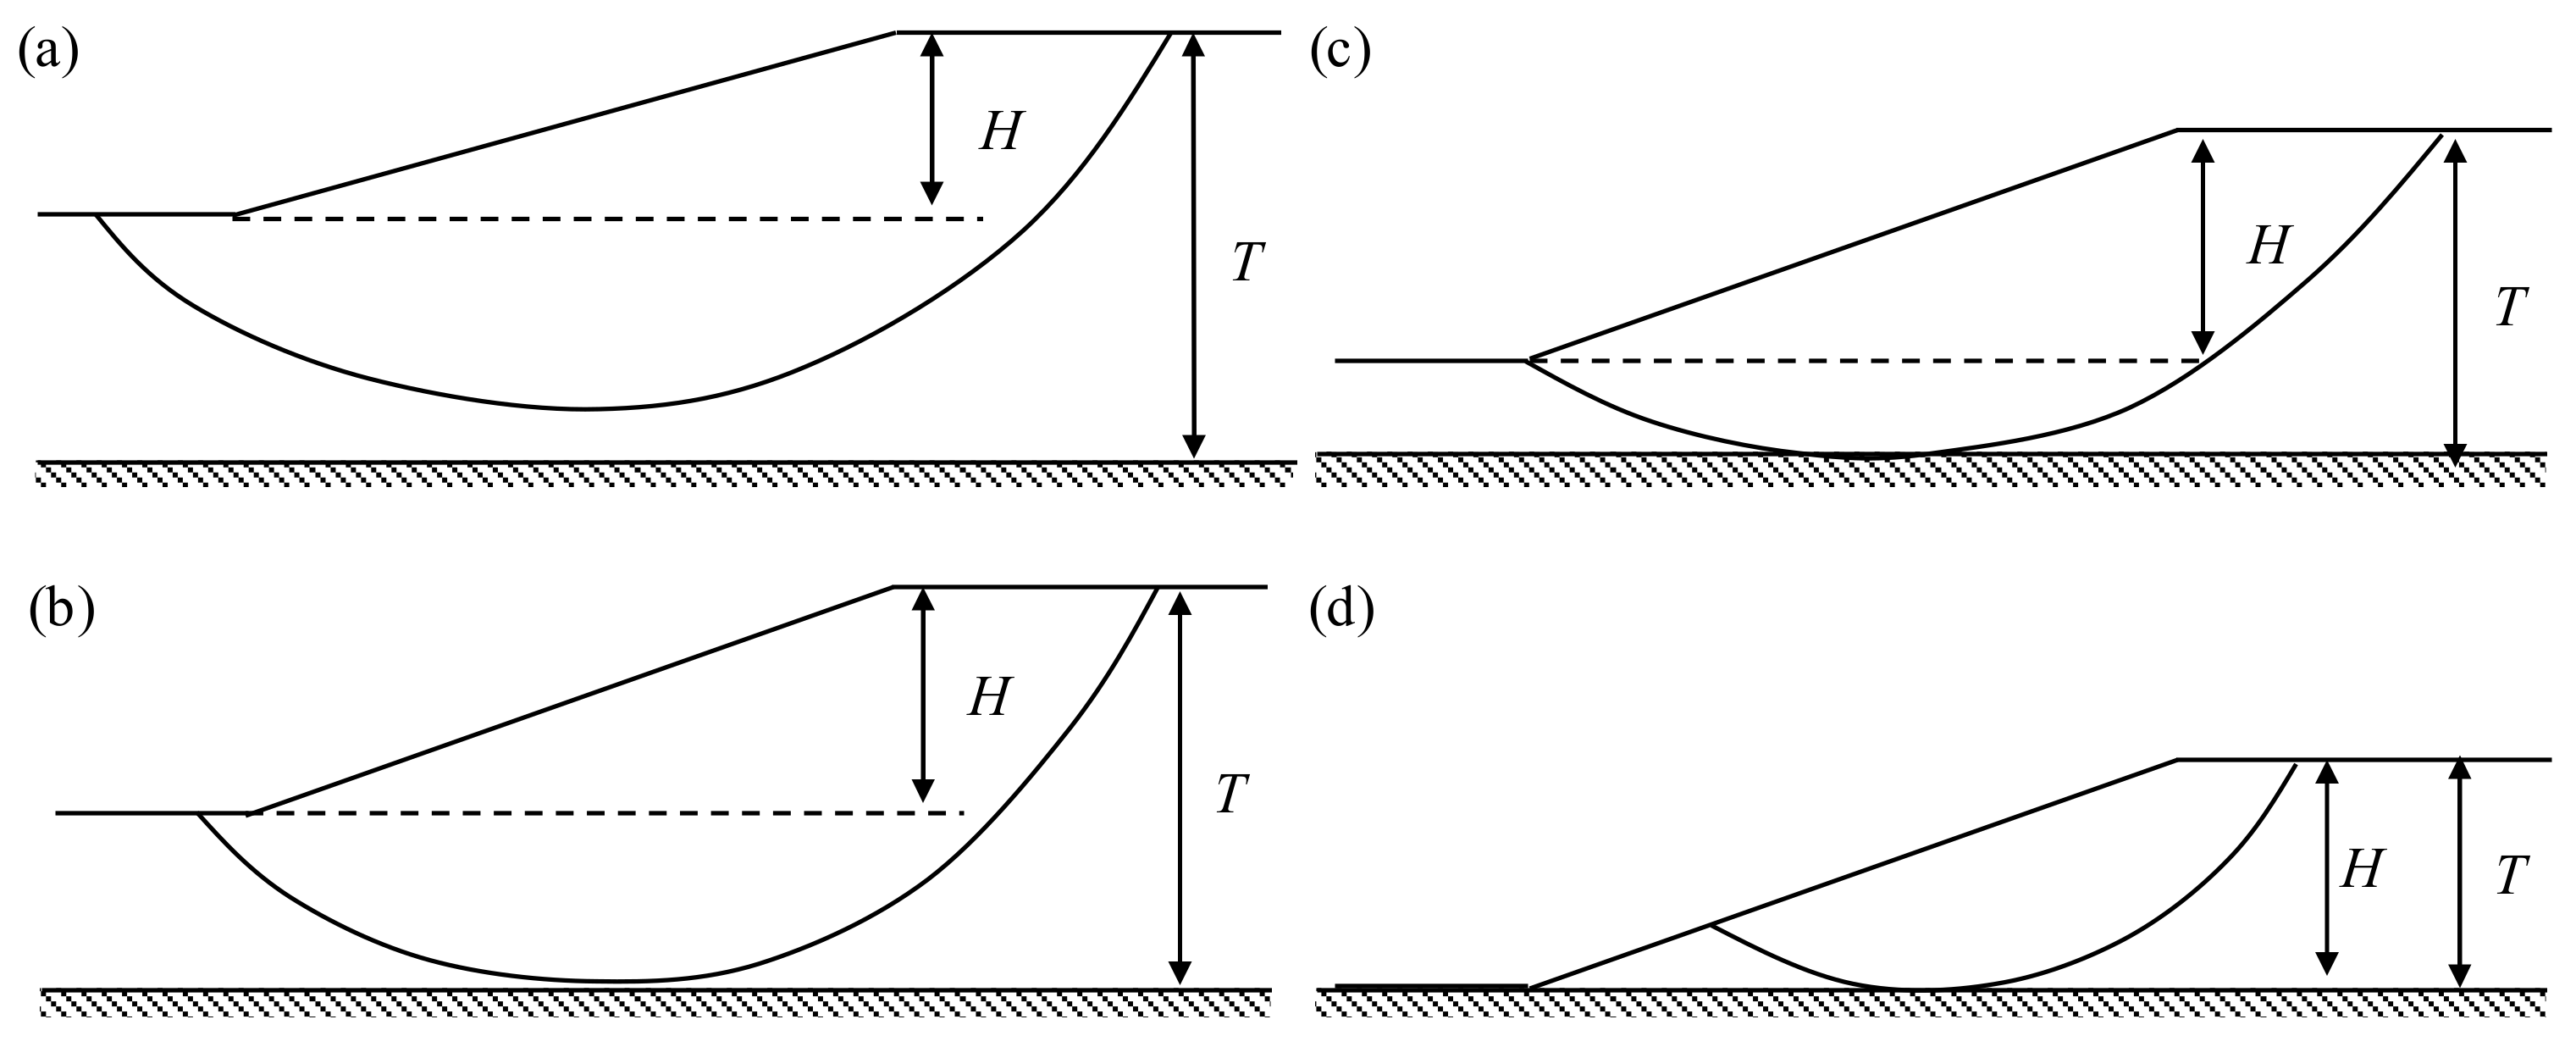
The variation of the stability number (N) for a range of values of the parameters (H/B, T/H, D/H, cu1/cu2, and β) was obtained from finite element (FE) analyses. Before showing a full set of results for different parametric combinations, a typical set of graphical results is given to explain the trends of the slip surface.
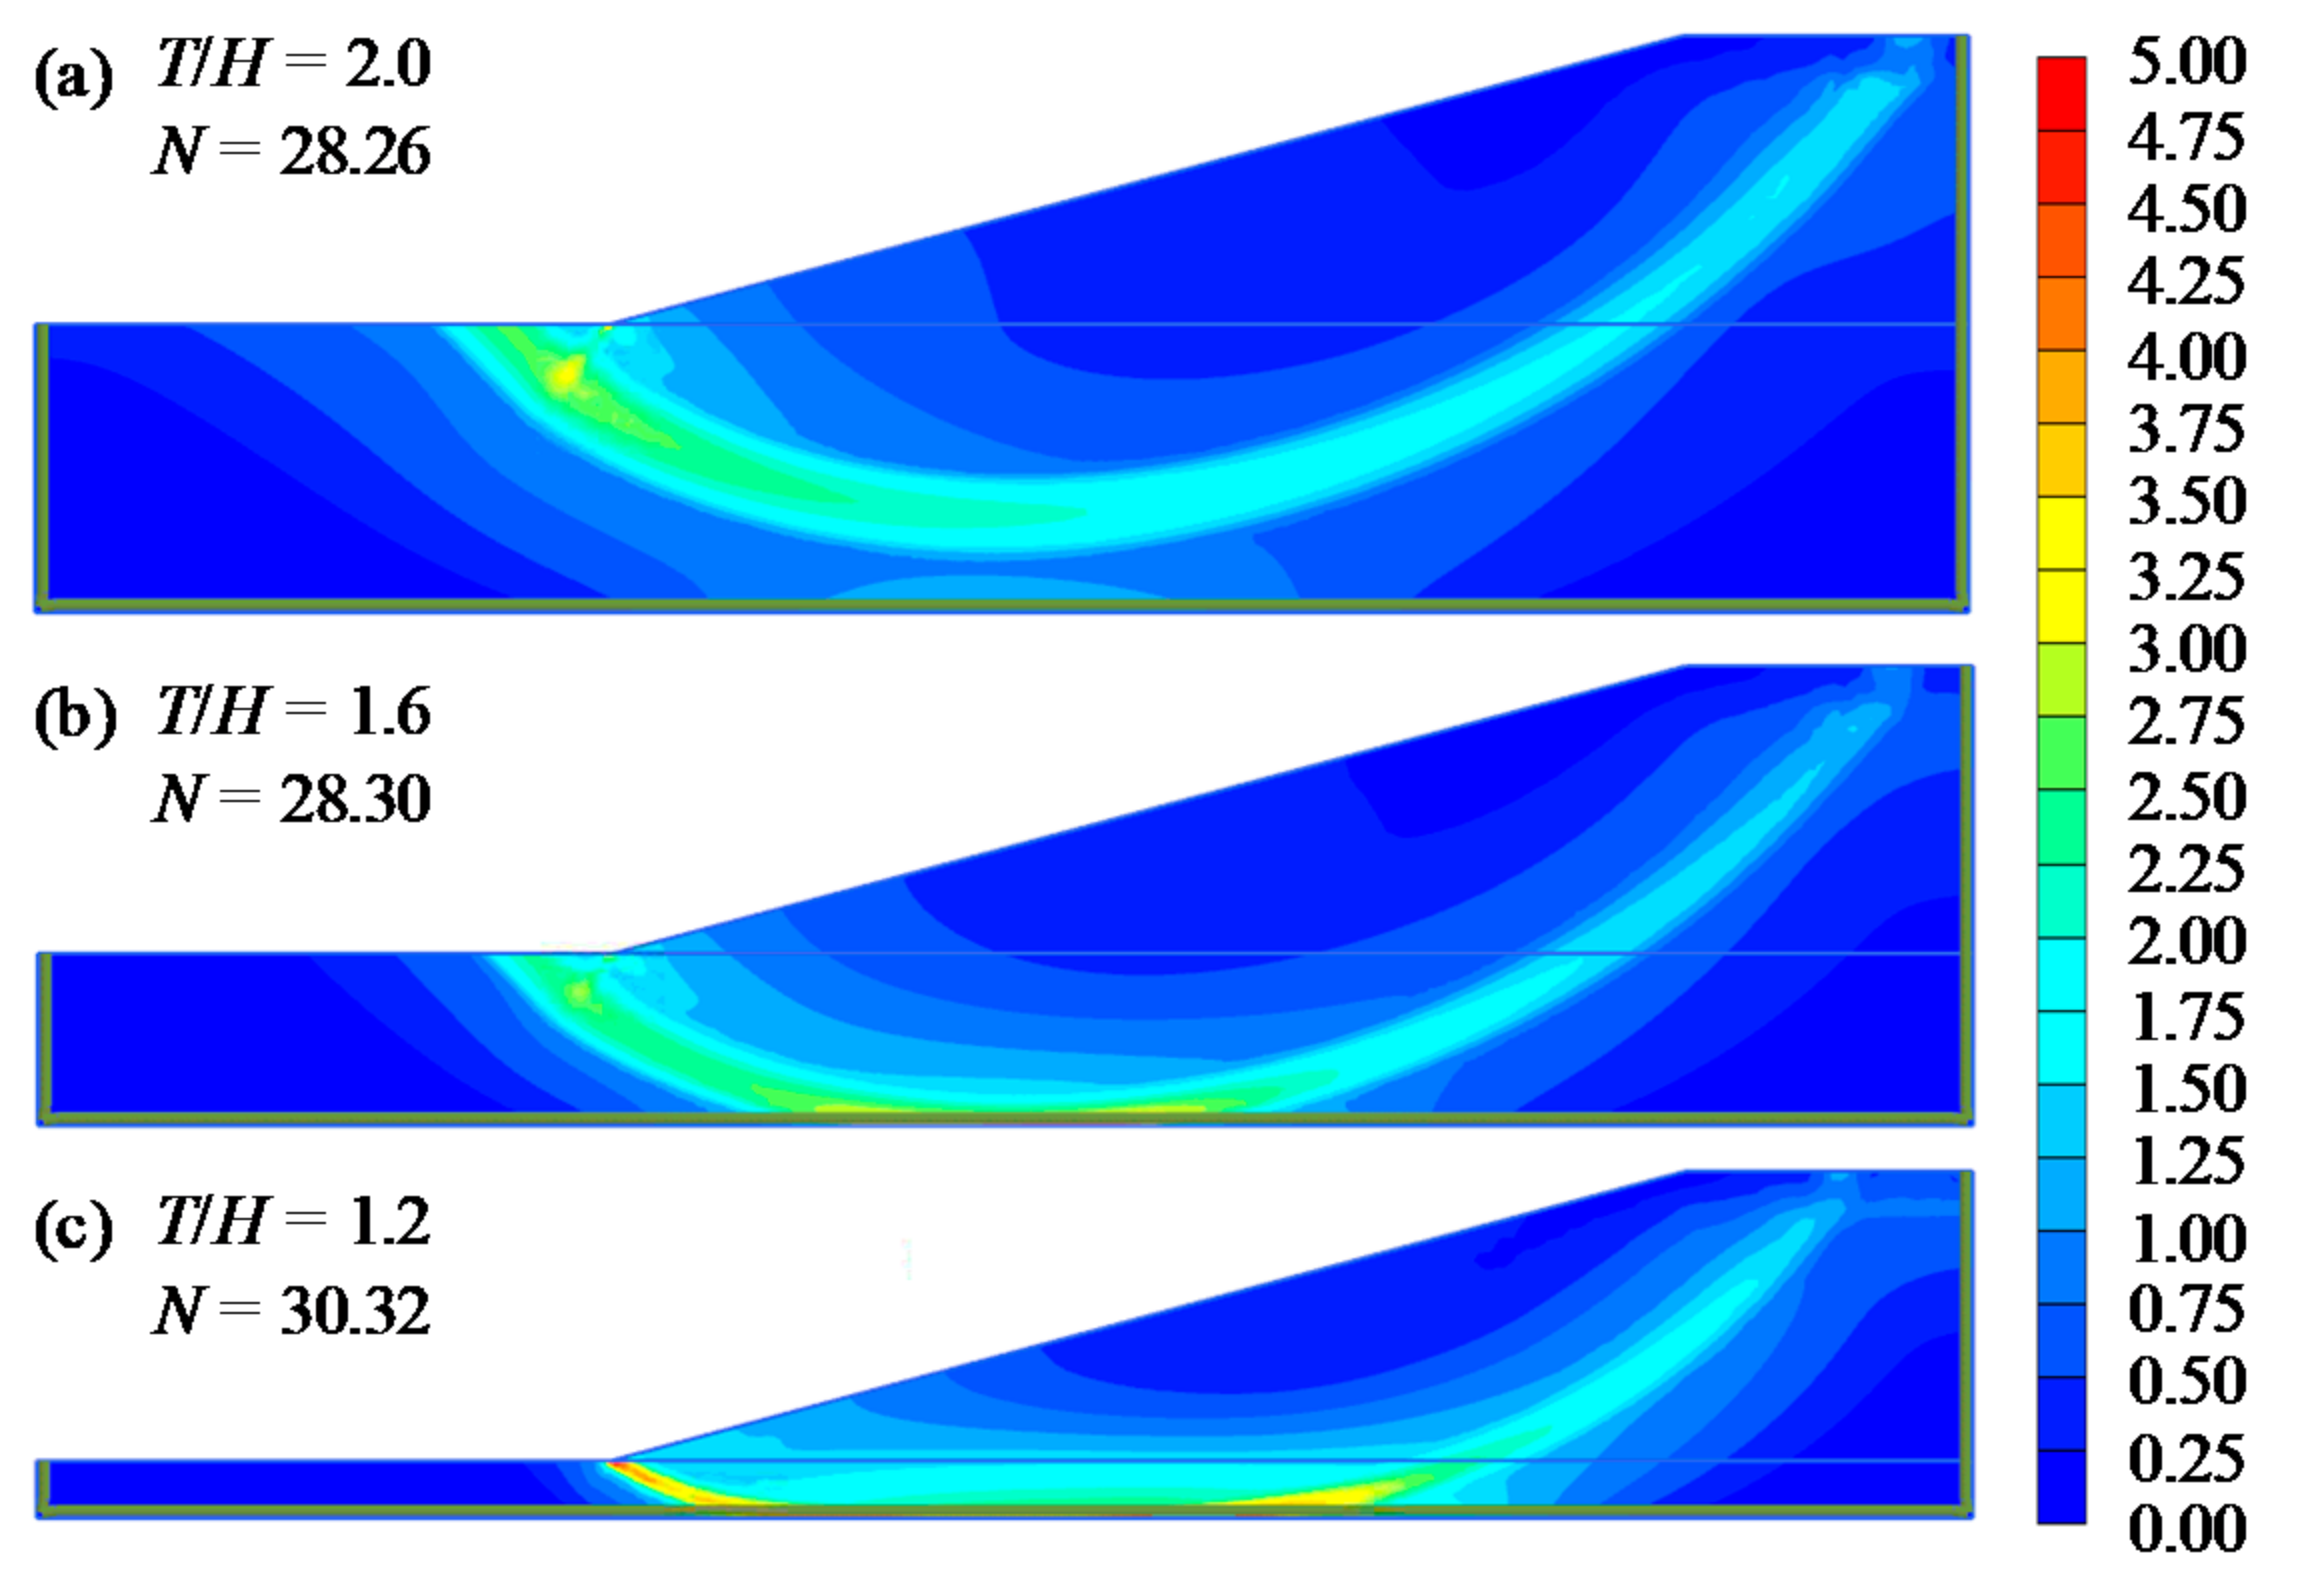
Figure 6 shows the total deviatoric strain according to the different ranges of the thickness ratio (
T/
H = 1.2, 1.6, 2.0). All results were performed with only one soil layer on the rigid base. When the excavation surface is closer to the rigid base, the stability number increased due to the slip surface through the rigid base. Griffith and Yu [
5] have represented the influence of the thickness ratio (
T/H), which is
T/H > 2.02 is the deep circle, 2.02 >
T/H ≥ 1.54 is the base circle, 1.54 >
T/H ≥ 1.37 is the toe circle, and 1.37 >
T/H are the slope circles.
As shown in
Figure 6, it was confirmed that the slip surface was changed from deep circle to toe circle and stability number (
N) was increased as decreasing the thickness ratio.
Figure 6a shows the deep circle, which is critical failure surface outcrops to the left of the toe, but is not reached to the strong layer below.
Figure 6b shows the base circle, which the slip surface tangent to tangent to the strong layer below. As an influence of the rigid layer, the stability number
N was raised.
Figure 6c shows the toe circle, which is the slip surface all passes through the toe and is tangent to the rigid layer below.
The effect of the width ratio (
H/
B) is studied by Lyamin and Sloan [
27], Keawsawasvong and Ukritchon [
6], and Chakraborty and Kumar [
28]. The magnitudes of the stability numbers reduce further with decreases in the width ratio (
H/
B). In order to confirm the effect of width ratio (
H/
B), which is the excavation height to radius at the bottom of excavation, three cases, which was one soil layer (c
u1/c
u2 = 1.0,
D/
H = ∞) on the rigid base, were shown in
Figure 7.
Figure 7a shows the case of the width ratio (
H/
B) being 0.5, which was a small value. It was represented that the slip surface was a deep circle, which included the entire slip surface due to wide radius of circular excavation. As the width ratio (
H/
B) increased, the slip surface was affected by the radius of circular excavation (
Figure 7b). It was leading to increasing the stability number (
Figure 7c).
The geometric parameters such as the width ratio (
H/
B), depth ratio (
D/
H) and thickness ratio (
T/
H) were constant to confirm the effect of angle of inclination (
β).
Figure 8 shows the effect of angle of inclination (
β) in two layers on the rigid base where the strength ratio is (c
u1/c
u2 = 0.25).
Figure 8a shows the shape of the slip surface by the total deviatoric strain in the angle of inclination (
β) was 15°. The slip surface was represented by the slope circle, which was the slip surface outcrop on the slope and was tangent to the strong layer due to the c
u1/c
u2 = 0.25, which is the lower layer was relatively strong. As shown in
Figure 8b, the shape of slip surface changed to toe circle in
β = 30°.
Figure 8c shows the shape of the slip surface in
β = 45° and
Figure 8d shows the shape of the slip surface in
β = 60°. It is confirmed that the shape of slip surface changed from the slope circle to the toe circle as the angle of inclination increased.
In order to investigate the effect of the depth ratio (
D/
H), the typical set (
D/
H = 0.5, 0.75, 1.00, and 1.25) of results for the case of an excavation with
H/
B = 0.5,
T/
H = 2, c
u1/c
u2 = 0.5, and
β = 15° was considered.
Figure 9 shows the effect of the depth ratio (
D/
H) in two layers. The slip surface by using the total deviatoric strain was represented according to the depth ratio (
D/
H) and changing the failure mechanism.
Figure 9a shows the shape of the slip surface by the total deviatoric strain in
D/
H = 0.5. The slip surface was the base circle.
Figure 9b shows the shape of the slip surface, which was both the base circle and deep circle in
D/
H = 0.75. As shown in
Figure 9c, the shape of slip surface was changed to the deep circle in
D/
H = 1.0.
Figure 9d shows the shape of the slip surface, which was the toe circle in
D/
H = 1.25. It is found that the types of slip surface were changed according to the depth ratio. When c
u1/c
u2 = 0.5, the stability number was decreased as depth ratio was increased.
To examine the effect of the strength difference between two layers, the typical geometry was chosen as
T/
H = 2,
H/
B = 0.5,
β = 30°, and
D/
H = 0.75.
Figure 10 shows the total deviatoric strain according to strength difference between two layers (c
u1/c
u2). It is revealed that the types of critical failure circles change according to the relative two layers strength.
Figure 10a shows the shape of the slip surface which is toe circle on top layer due to the lower layer was relatively strong. As strength ratio (cu1/cu2) increases, it is confirmed that slip surface moves to the lower layer (
Figure 10b–d).
The results obtained from the analysis have been presented to give the slope stability numbers.
Figure 11 shows the effect of the total thickness of the soil layer to the rigid body and strength difference between two layers on the slope stability number.
Increasing the thickness ratio (
T/
H) means increasing the thickness of the soil layer to the rigid body at the toe of the slope. Griffiths and Yu [
5] showed that as the thickness ratio (
T/
H) increases in homogeneous soil, the slope stability number gradually decreased and then converged. To confirm the effects of the thickness ratio (
T/
H), and strength difference between two layers (c
u1/c
u2), the width ratio (
H/
B) was fixed at 0.5 and depth ratio (
D/
H) was set to 1. In addition, c
u1 was fixed and c
u2 was changed to change c
u1/c
u2. When c
u1/c
u2 was less than 1, which is c
u2 was greater than c
u1, the stability number had a value similar to
T/
H = 1 regardless of thickness. When c
u1/c
u2 was greater than or equal to 1, the slope stability number decreased and converged as thickness ratio (
T/
H) increased, it is similar to the results of Griffiths and Yu [
5].
Figure 11a shows the result for
β = 15°. When the thickness ratio (
T/
H) > 1.6, stability number (
N) did not change.
Figure 11b shows the result for
β = 30°. The stability number was reduced and stability number did not change when the thickness ratio (
T/
H) > 1.4.
Figure 11c,d shows the result for
β = 45° and
β = 60°, respectively. The stability number (
N) did not change when the thickness ratio (
T/
H) > 1.2. Through this, it can be seen that the effect of the thickness ratio (
T/
H) was larger the lower the slope.
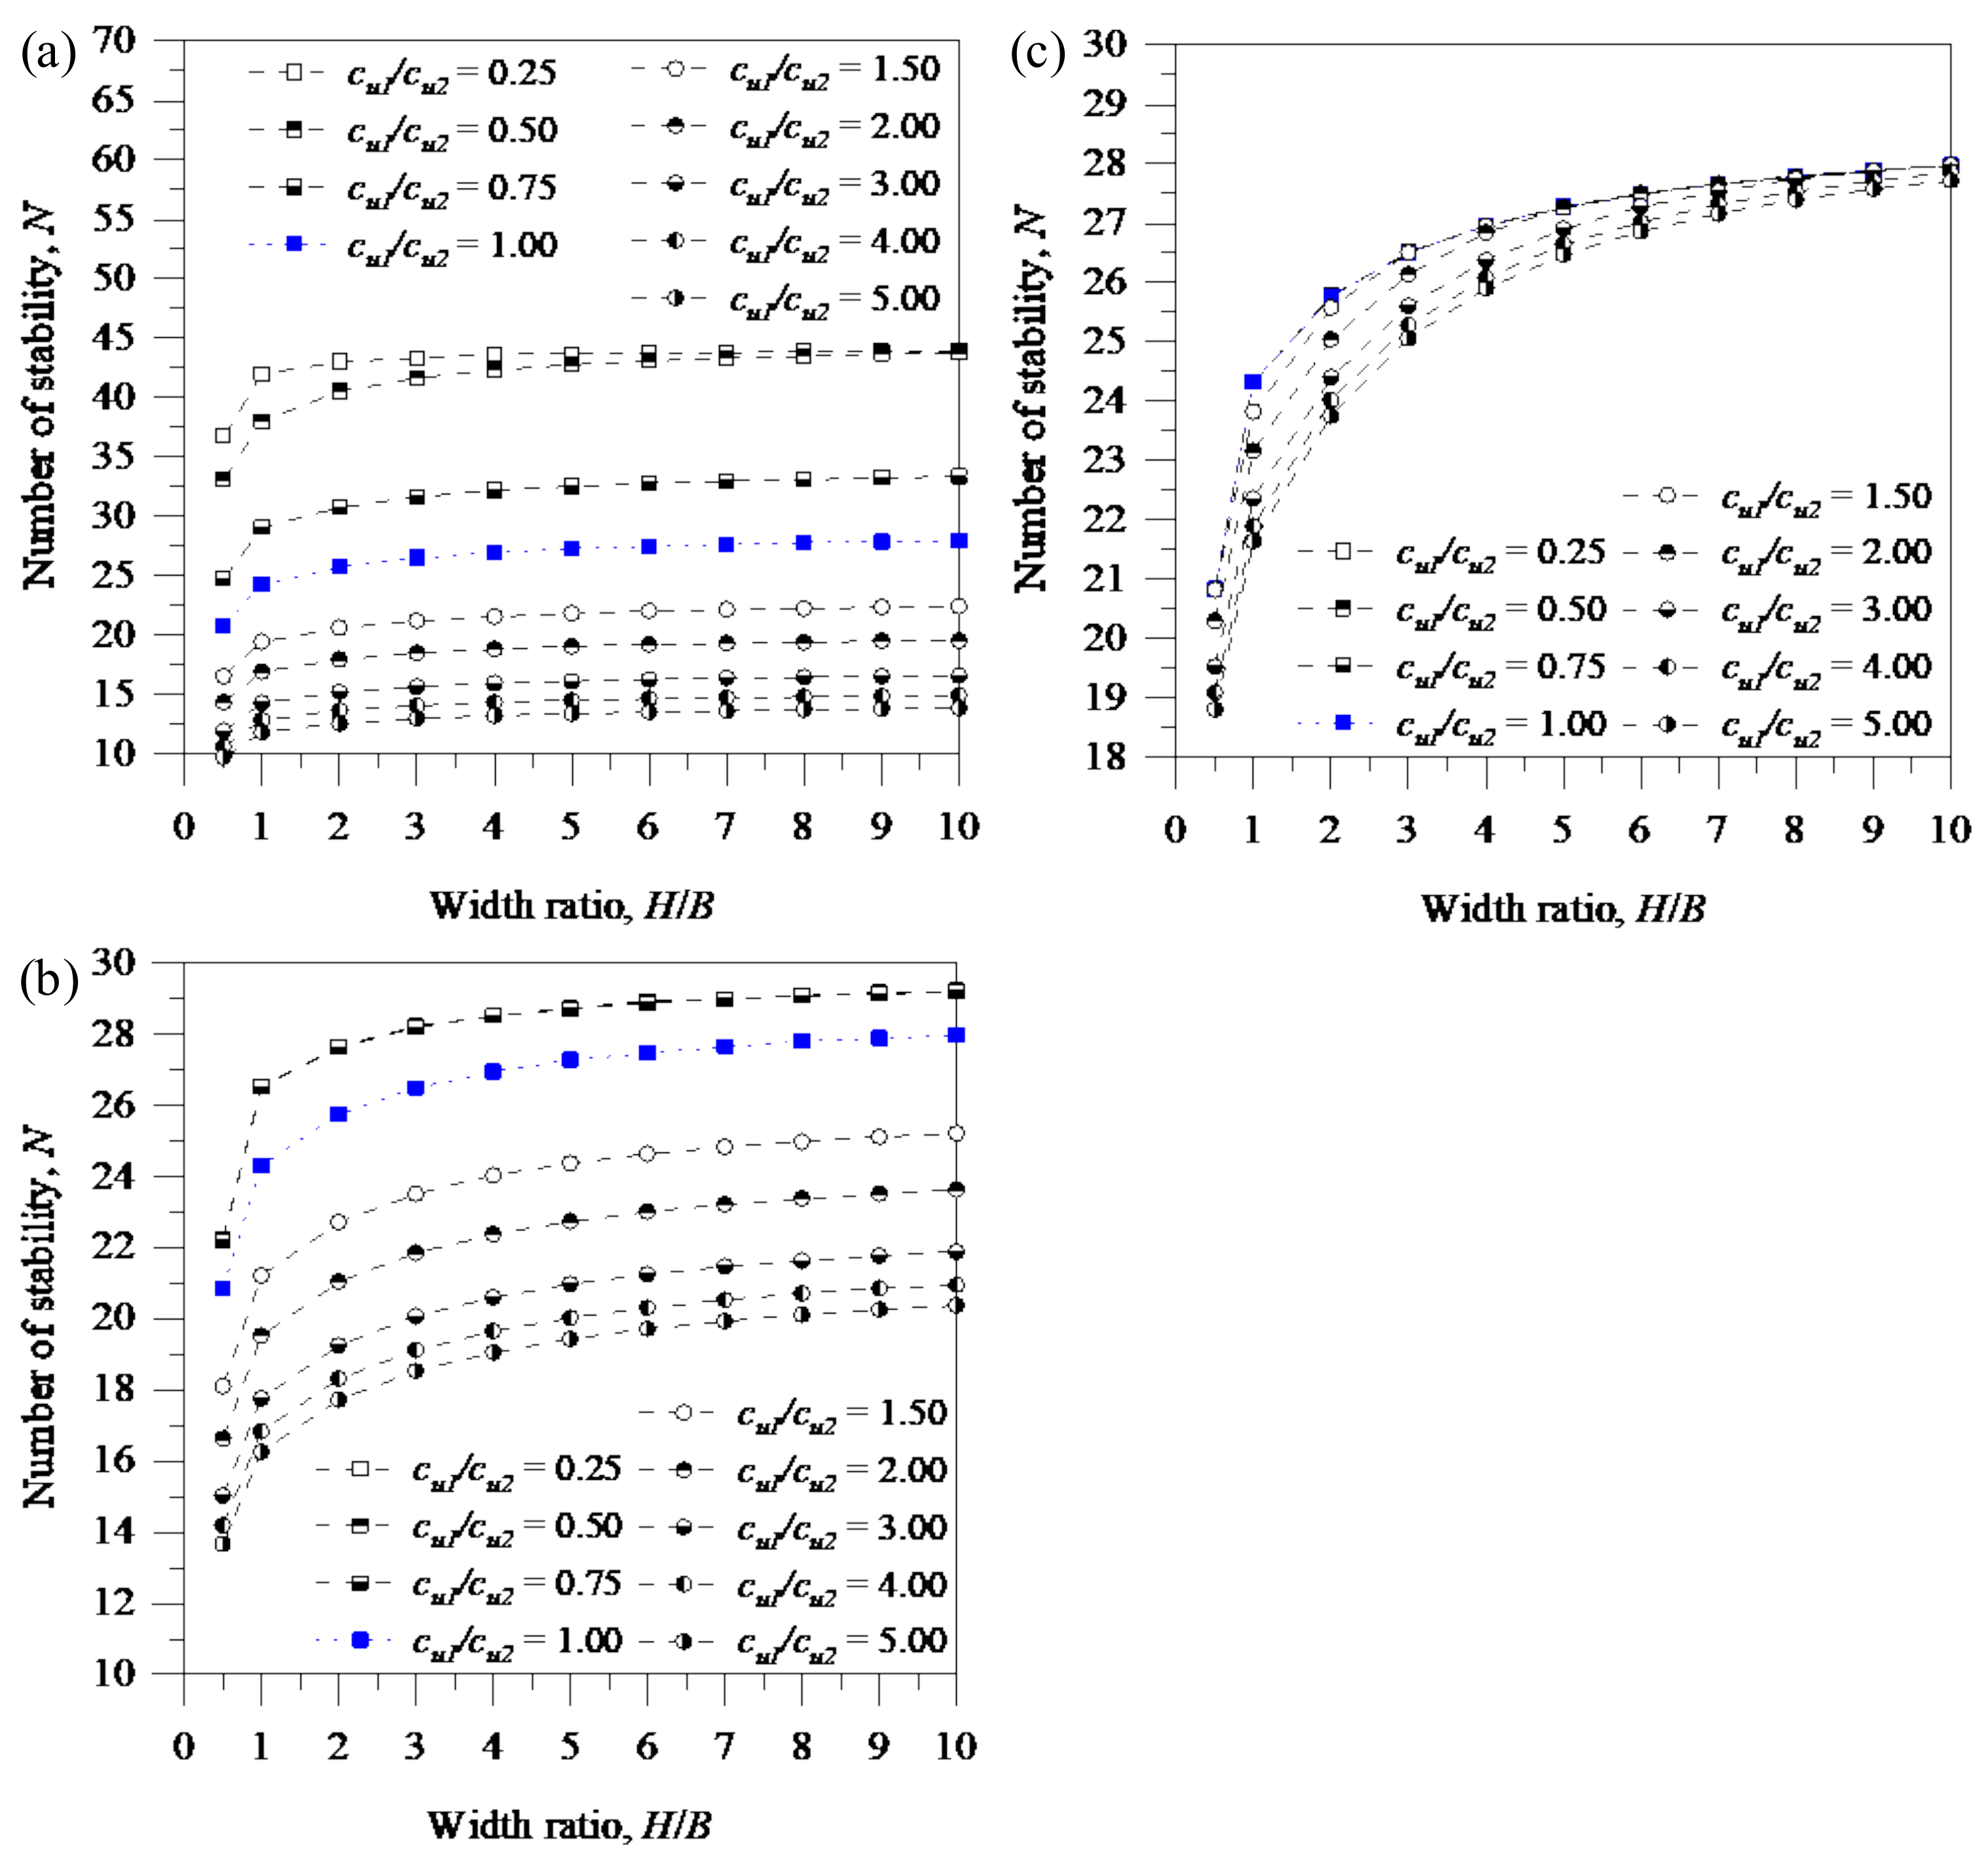
Figure 12 shows the effect of the ratio of excavation height to the radius of the circular excavation ratio (
H/
B), and strength difference between two layers (c
u1/c
u2) on the slope stability number for a purely two cohesive soil layers on the rigid base. The value of the thickness ratio and angle of inclination was fixed as the thickness ratio (
T/
H) was 2, and
β = 30° to confirm the effects of the width ratio (
H/
B).
Figure 12a shows the result for
D/
H = 0.5, which is the top layer thickness was smaller than the excavation depth. The stability number (
N) did not change when the width ratio (
H/
B) was > 5.
Figure 12b shows the result for
D/
H = 1.0, which is the top layer thickness was equal with excavation depth.
Figure 12c shows the result for
D/
H = 1.5, which is the top layer thickness was deeper than excavation depth. It was confirmed that the variation of the stability number was increased as the depth ratio (
D/
H) increased. However, the effect on the strength ratio (c
u1/c
u2) was reduced as the depth ratio (
D/
H) increased. As the width ratio (
H/
B) increased, which is the height of the slope increased or the radius of excavation decreased, the slope stability number increased. This finding can be seen that the sharp increase in
H/
B < 1. This is because the collapse type changes from deep seated failure to toe failure.
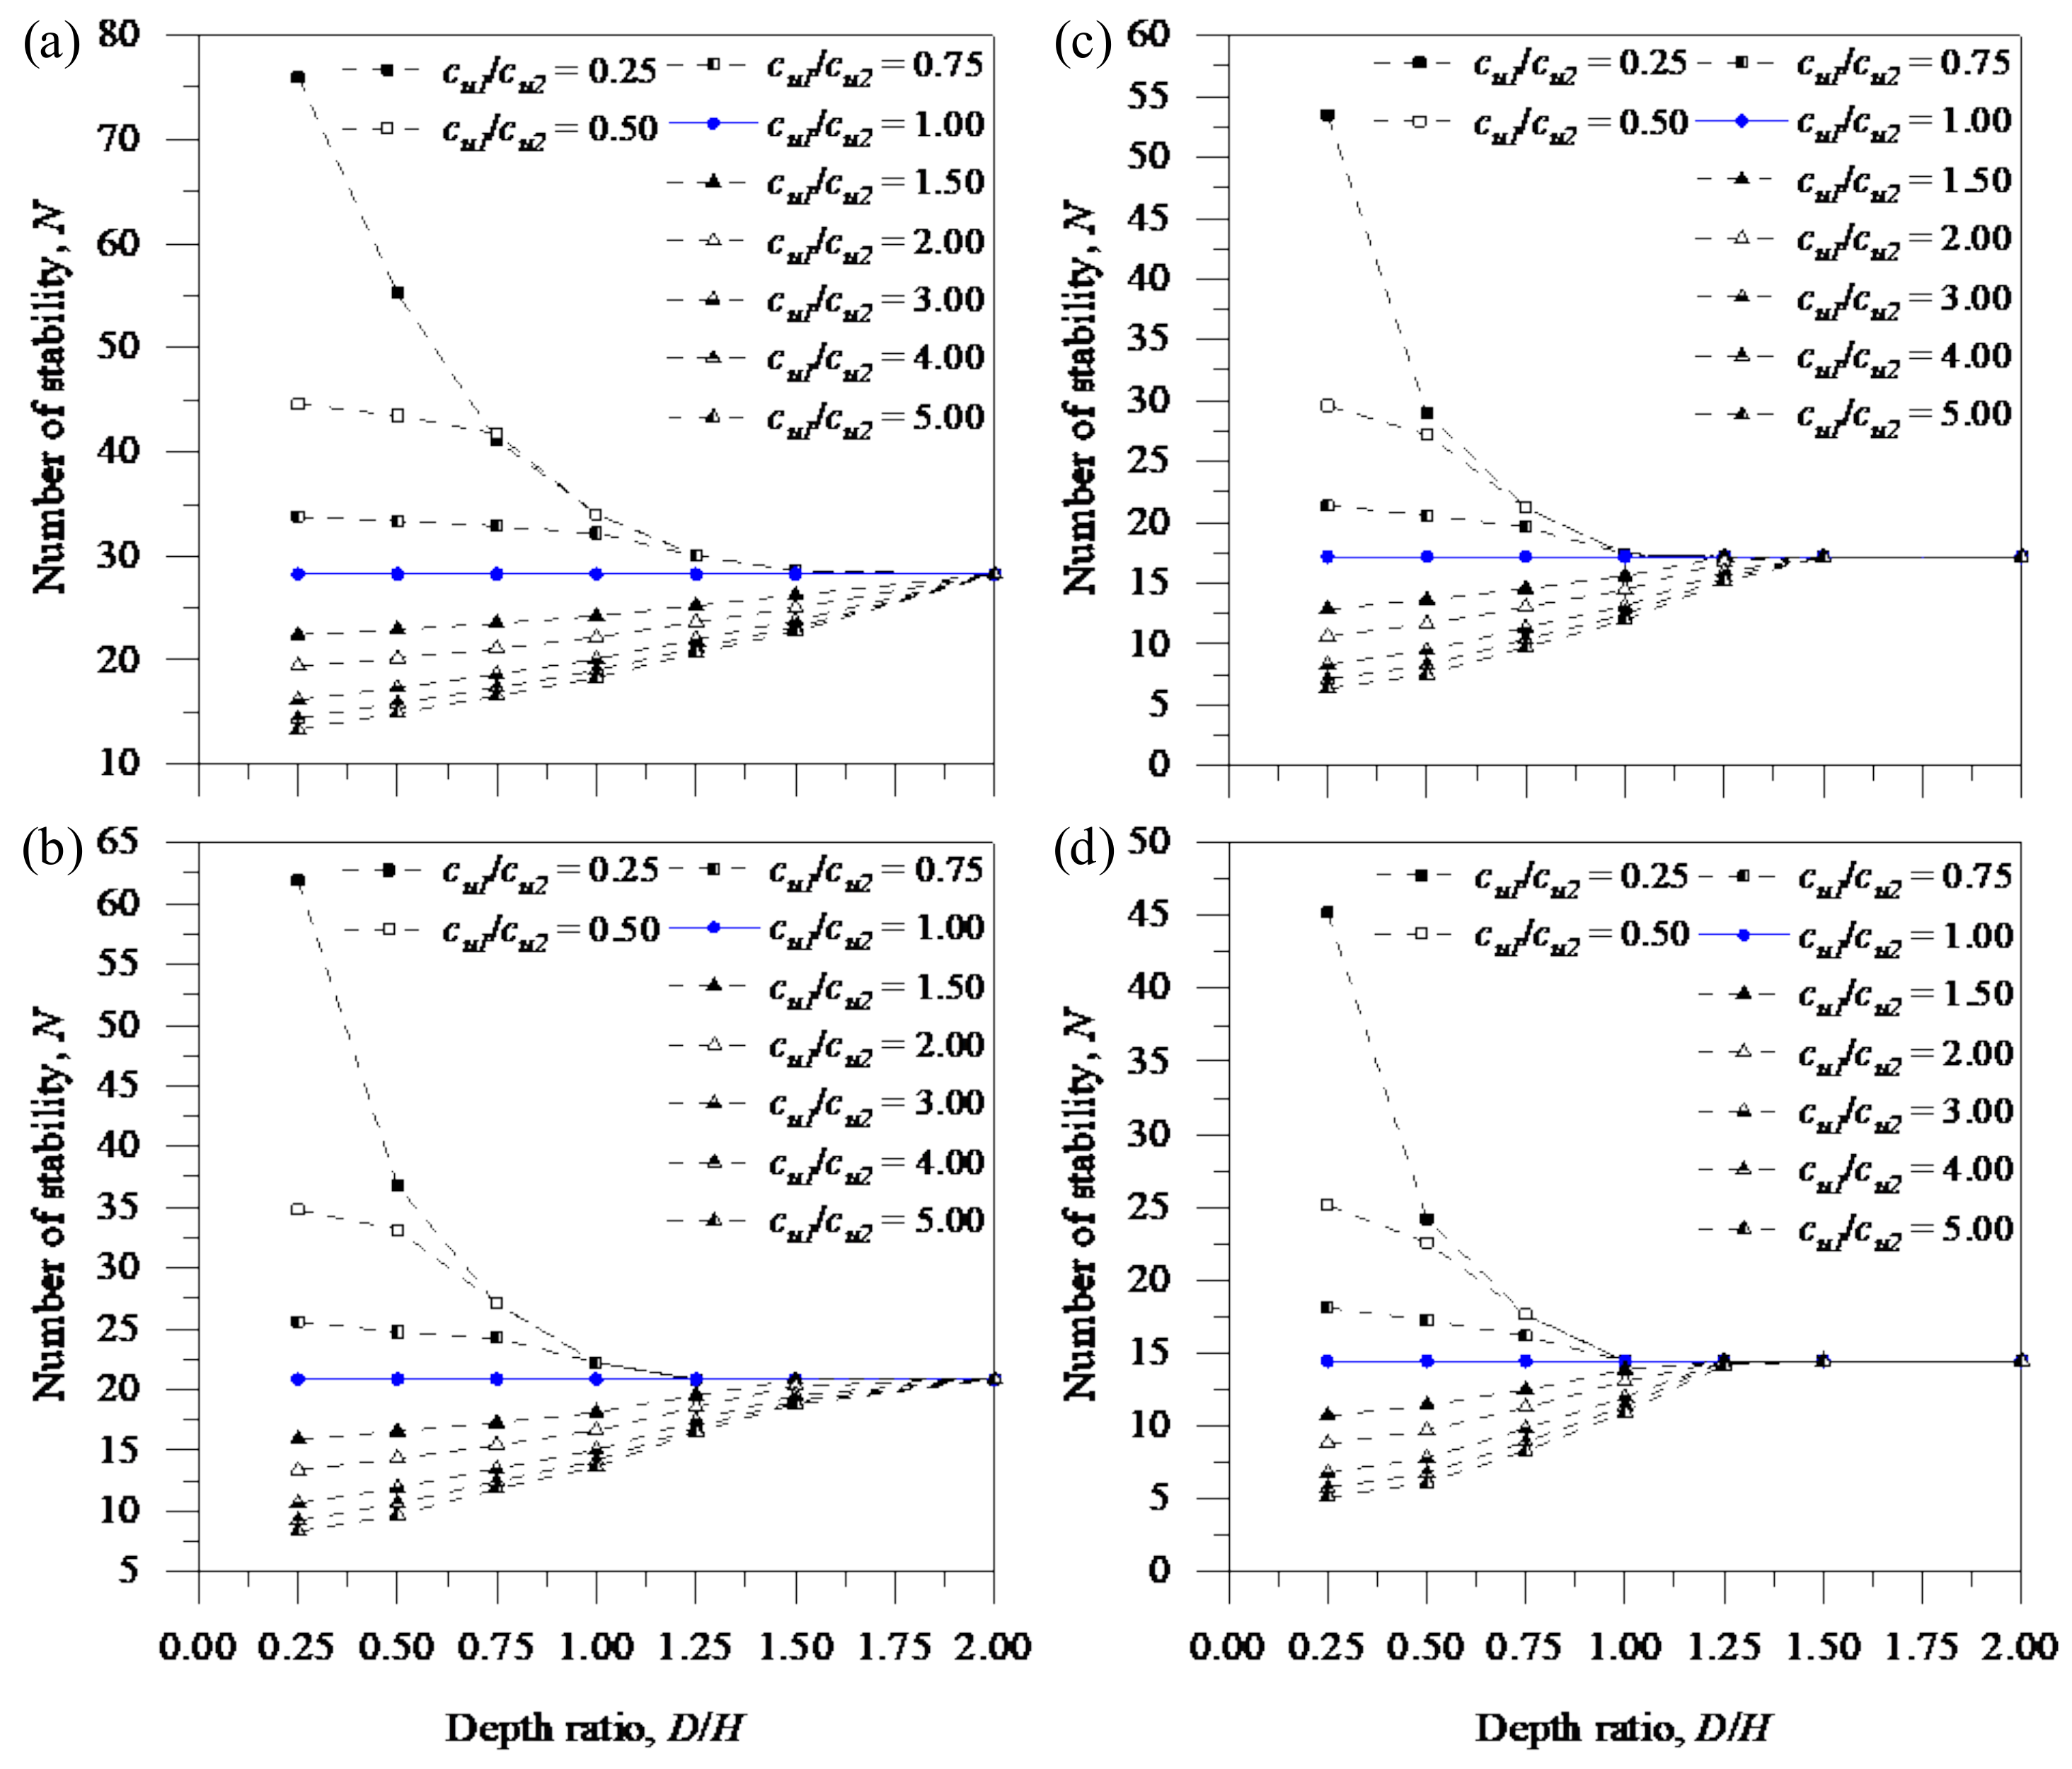
Figure 13 shows the effect of the depth ratio (
D/
H), which is the relative top layer thickness to excavation depth on the slope stability number. In the multi-layered soil, the relative top layer thickness and strength was a significant influence factor on stability.
Figure 13a shows the stability numbers in
β = 15°. The stability number when c
u1/c
u2 < 1 was larger than the stability number when c
u1/c
u2 = 1, which was a homogenous soil layer, but the stability number when c
u1/c
u2 > 1 was smaller than the stability number when c
u1/c
u2 = 1. The variation of stability number was larger as the depth ratio (
D/
H) was smaller.
Figure 13b shows the stability numbers at
β = 30°.
Figure 13c shows the stability numbers at
β = 45°. The stability number was the same with c
u1/c
u2 = 1 when the depth ratio (
D/
H) > 1.5.
Figure 13d shows the stability numbers at
β = 60°. The stability number was the same with c
u1/c
u2 = 1 when the depth ratio (
D/
H) > 1.25. As the angle of inclination increases, the variation of stability number gets small.
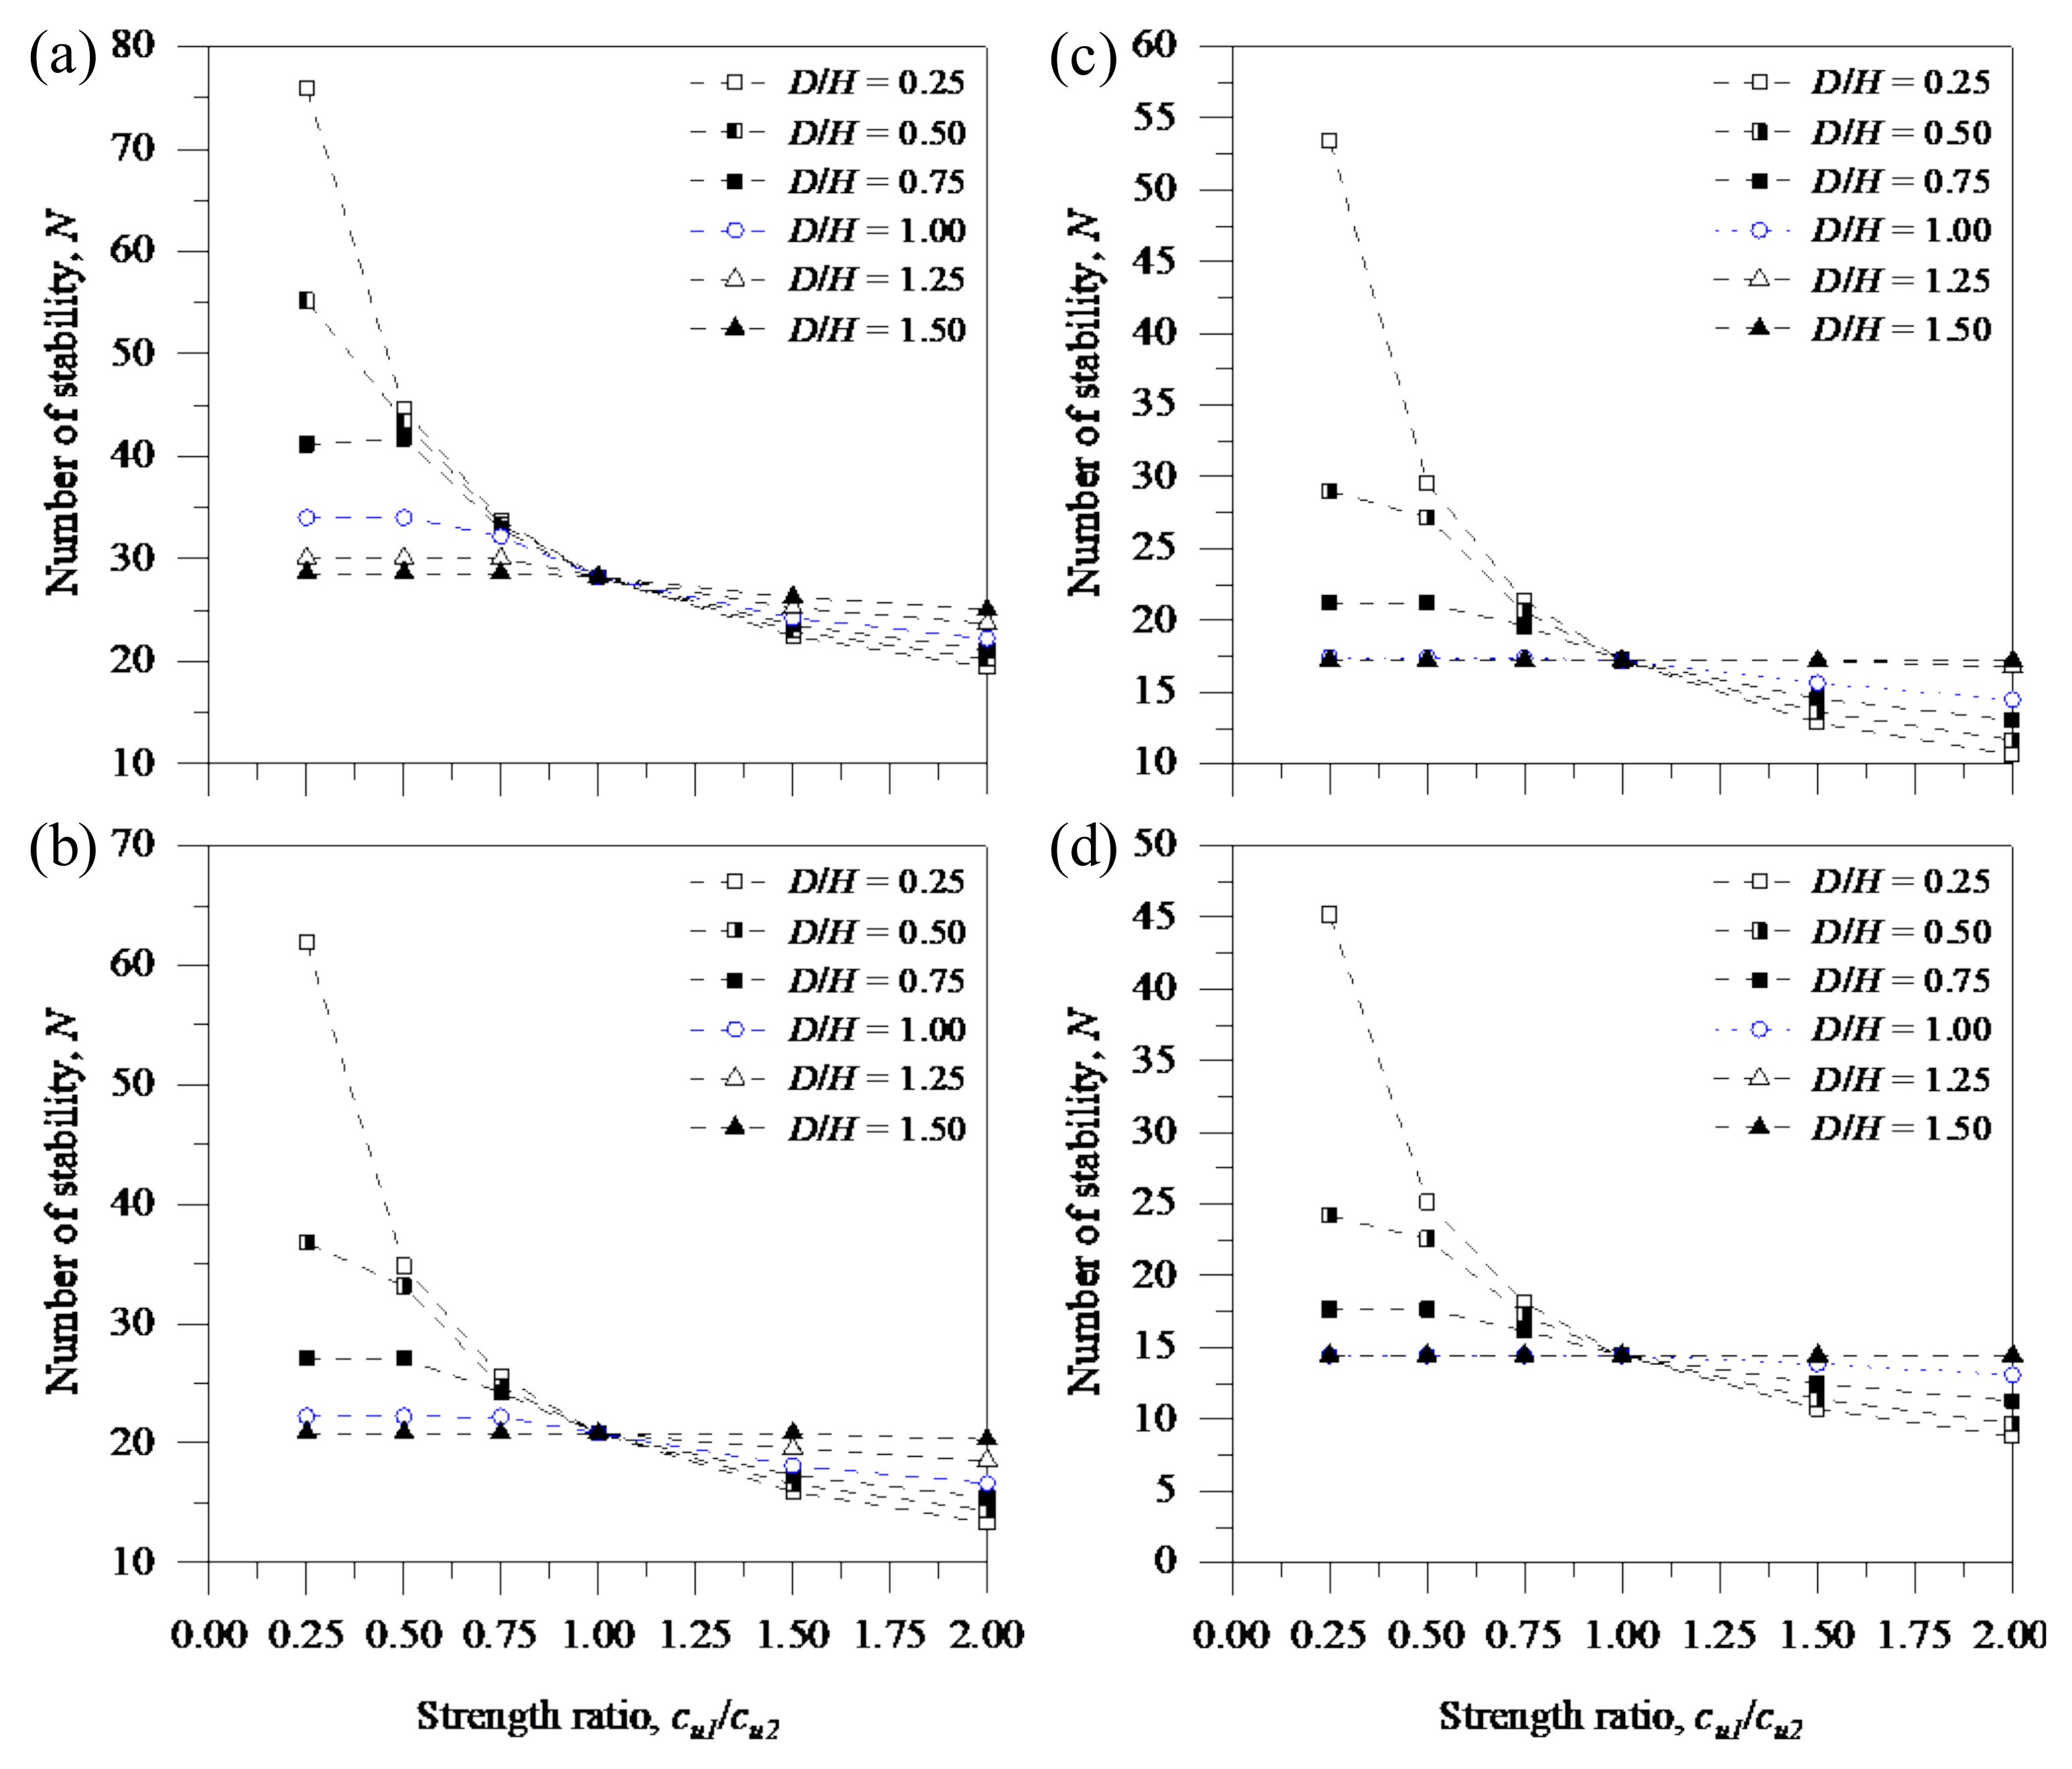
Figure 14 shows the effect of the strength ratio (c
u1/c
u2) which is strength difference between the two layers with the relative top layer thickness to excavation depth. Numerical analyzes were conducted for various slope angle which is
β = 15°,
β = 30°,
β = 45°, and
β = 60° with
T/
H = 2,
H/
B = 0.5. The strength ratio was defined as c
u1/c
u2 = 0.25, c
u1/c
u2 = 0.50, c
u1/c
u2 = 0.75, c
u1/c
u2 = 1.00, c
u1/c
u2 = 1.25, c
u1/c
u2 = 1.50, and c
u1/c
u2 = 2.0.
Figure 14a shows the stability numbers at
β = 15°. When c
u1/c
u2 < 1, the stability number when
D/
H < 1 was larger than the stability number when
D/
H = 1, but the stability number when
D/
H > 1 was smaller than the stability number when
D/
H = 1. When c
u1/c
u2 > 1, the stability number when
D/
H < 1 was smaller than the stability number when
D/
H = 1, but the stability number when
D/
H > 1 was larger than the stability number when
D/
H = 1, which is the top layer thickness is equal with excavation depth.
Figure 14b shows the stability numbers at
β = 30°.
Figure 14c shows the stability numbers at
β = 45°, and
Figure 14d shows the stability numbers at
β = 60°. As the angle of slope increases (
β = 15° to 60°), the influence of strength ratio (c
u1/c
u2) was decreased.


