Abstract
A method which utilizes a Kerr phase-interrogator to measure the group birefringence dispersion (GBD) of a polarization-maintaining fiber (PMF) is systematically studied in this paper. The differential group delay of two sinusoidally modulated optical signals (SMOSs) polarized along the principal axes of the PMF is measured by a Kerr phase-interrogator, which leads to the group birefringence of the PMF. As the laser wavelength of the SMOSs varies, the group birefringence as a function of the laser wavelength is obtained, and the GBD is calculated as the derivative of the group birefringence with respect to the laser wavelength. The proposed method is experimentally demonstrated by characterizations of a Panda PMF with high GBD and an elliptical core PMF with low GBD, and its performance is analyzed. The proposed method eliminates the impact of the laser coherent length and allows for characterizing the GBD of PMFs that are tens of kilometers long.
1. Introduction
Polarization-maintaining fibers (PMFs) with lengths of hundreds of meters have been applied in many fields, such as ultrafast all-optical switching and ultrashort pulse generation [1,2]. In these applications, the group birefringence dispersion (GBD) of a PMF governs the temporal profiles of amplitudes and spectra of optical pulses through nonlinear optical effects. The characterization of the GBD of the PMF helps to control the properties of the optical pulses. PMFs have also been employed in distributed stress sensors [3]. The sensor measures the stress by detecting the polarization model coupling induced by the external transverse forces. The usage of a long PMF ensures distributed stress sensing over a long distance. Because of the GBD of the PMF, the spatial resolution of stress measurements deteriorates with fiber distance. Characterization of the GBD of the long PMF mitigates the impact of birefringence dispersion on distributed stress measurements.
White-light-interferometry-based techniques, including spectrum-domain and time-domain techniques, are widely used to characterize the GBD of a PMF [4,5,6,7,8,9,10]. The interferogram of optical intensity as a function of wavelength or scanning length is detected in a spectrum-domain/time-domain technique. The phase of the interferogram is retrieved, which leads to the phase birefringence, group birefringence and the GBD of the PMF. The accuracy of these techniques is determined by the accuracy of the phase retrieval. For a long PMF, the interference contrast of the interferogram is low because of the short coherent length of the employed white light source. Low interference contrast results in the large error of the retrieved phase and, hence, has an impact on the accuracy of birefringence dispersion measurement. To implement precise measurements, the maximum measurable fiber length of the white-light-interferometry-based technique is severely shortened.
Kerr phase-interrogators have been reported for measuring the differential group delay (DGD) of two sinusoidally modulated optical signals (SMOSs) [11,12], and they have been employed to measure the GBD of a Panda PMF by directly measuring the wavelength-dependent DGD of two SMOSs polarized along the principal axes of the Panda PMF [13]. The reported approach utilizes the Kerr effect instead of the interference between two polarization modes to measure the GBD, and hence removes the limitation of laser coherence length on the maximum measurable fiber length. Unfortunately, the reported approach fails when the GBD of the PMF under test is so low that the detected optical power cannot oscillate over one sinusoidal circle as the laser wavelength of the SMOSs scans. In addition, the performance of this approach has not been rigorously discussed.
In the present study, the Kerr-phase-interrogator-based technique is systematically studied for measuring the GBD of a PMF. The GBD of a Panda PMF and an elliptical core PMF are measured by the proposed technique to demonstrate the high GBD measurement and the low GBD measurement. In addition, the performance of the proposed technique is rigorously analyzed. With the compensation for the intensity loss of the SMOSs, the proposed approach is capable of characterizing a PMF that is tens of kilometers long.
2. Experimental Setup
The schematic of the Kerr phase-interrogator for GBD measurements is presented in Figure 1. A continuous light-wave (CW) from a tunable laser (TL) operates at wavelength and is amplitude-modulated by an electro-optic modulator (EOM). The EOM is driven by a sinusoidal electrical signal oscillating at radio frequency and turns the CW into an SMOS oscillating at a radio frequency . The optical spectrum of the resulting SMOS is comprised of two distinct sidebands separated by and centered at . A polarization beam splitter (PBS) splits the SMOS into two orthogonal polarization components. The two orthogonal polarization components propagate through the fast axis and slow axis over equal fiber length, respectively. A polarization beam combiner (PBC) combines the two orthogonal polarization components and sends them into a fiber under test (FUT) through a polarization-maintaining circulator (PMC). Reflected at the far end of the FUT by a polarization-maintaining reflector R, the combined signals are amplified by an erbium-doped fiber amplifier (EFDA) and are injected into a Kerr medium comprised of a 2 km dispersion-shifted fiber (DSF, Fujikura) with waveguide nonlinearity of 2.28 W−1/km. The amplitudes of the amplified combined signals are identical, which is realized by finely adjusting the polarization state of the SMOS with a polarization controller (PC) placed before the PBS. In the DSF, the Kerr effect results in the distinct sidebands in the total optical spectrum of the combined signals, and the power of the first-order sideband is expressed as [11,12]:
where is a constant value, is the constant phase and is the DGD representing the round-trip time differential group delay between the slow axis and fast axis of the FUT.
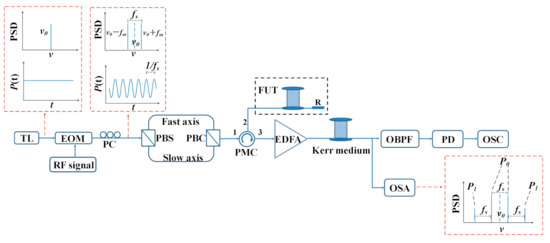
Figure 1.
Schematic of the Kerr phase-interrogator for group birefringence dispersion (GBD) measurements. TL: tunable laser; EOM: electro-optic modulator; RF: radio frequency; PC: polarization controller; PBS: polarization beam splitter; PBC: polarization beam combiner; PMC: polarization-maintaining circulator; FUT: fiber under test; R: reflector; EDFA: erbium-doped fiber amplifier; OSA: optical spectrum analyzer; OBPF: optical band-pass filter; PD: photodiode; OSC: oscilloscope; PSD: power spectral density.
Using the Hilbert transform and arctan function [12], the relative phase is demodulated from , where , and with being the absolute DGD at a reference wavelength . The relative DGD is obtained by
To measure , the setup in Figure 1 is modified. Specifically, a 3 GHz optical band-pass filter (OBPF), a photodetector (PD) and an oscilloscope (OSC) are cascaded to record as a function of . In the modified setup, the laser wavelength of the two SMOSs is set at a reference wavelength and is linearly scanned, which results in the sinusoidal variation of according to Equation (1). The relative phase is demodulated from , where and is the initial value of . is calculated from the slope of with
, another absolute DGD at a wavelength , needs to be measured and then compared with to specify the actual sign of . In other words, to verify whether increases or decreases with .
The absolute DGD is given by , resulting in
where , and are the group birefringence, speed of light in vacuum and the length of the FUT, respectively. Equation (4) leads to the GBD calculated by
where represents the GBD.
3. Experimental Results
The GBD of a 459.4 m Panda PMF (Fujikura) is experimentally investigated. The wavelength of the combined signals oscillating at = 20 GHz is scanned from = 1540 nm to = 1565 nm in steps of 0.1 nm, and the power spectral densities (PSDs) of the optical signal at the output of the Kerr medium are recorded for each by the optical spectrum analyzer (OSA). The recorded values of as a function of are presented in Figure 2a, showing a sinusoidal power variation as increases, which agrees with the theoretical analysis and the indication of Equation (1). The relative phase is calculated from with , and is presented in Figure 2b.
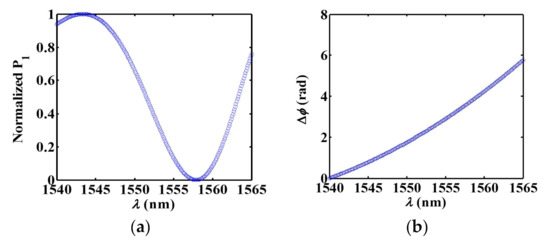
Figure 2.
Measurement results of (a) and (b) as a function of in the case of Panda polarization-maintaining fiber (PMF) characterization.
To measure the absolute DGD of , the reference wavelength is fixed at . is linearly scanned at a rate of = 80 GHz/s from = 16 GHz to = 24 GHz, and the sideband power as a function of time is acquired by an oscilloscope. To obtain as a function of , is replaced with . Figure 3a presents the showing a sinusoidal variation of as increases, in agreement with the indication of Equation (1). is demodulated from and is presented in Figure 3b. The linear fit is also presented in Figure 3b. Applying to Equation (3) gives an absolute DGD of = 1448 ps at . Similarly, a value of = 1493 ps is obtained at . Comparison of and reveals the increment of as increases.
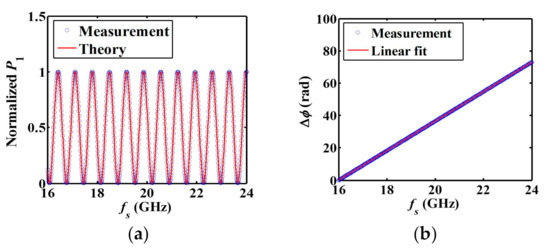
Figure 3.
Measurement results of (a) and (b) as a function of when the laser wavelength is = 1540 nm in the case of Panda PMF characterization.
The values of absolute DGD are calculated using and are presented in Figure 4a. is calculated from by using Equation (4) and = 459.4 m, and it is presented in Figure 4b showing a value of 4.784 × 10⁻⁴ at = 1550 nm. Figure 4c presents the values of GBD, , calculated from the wavelength dependence of by utilization of Equation (5), showing = 5.55 × 10⁻⁷/nm at = 1550 nm.
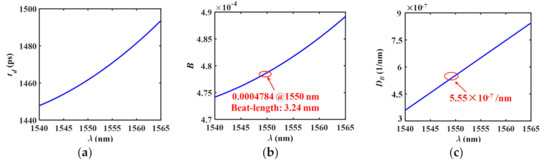
Figure 4.
(a) Experimental results of (a) , (b) B and (c) as a function of in the case of Panda PMF characterization.
Essentially, retrieval is the key for the measurements of and . Obtaining , one can easily calculate and directly from using Equations (2)–(5). is retrieved from the sinusoidal variation of [12]. Accurate phase retrieval of requires to undergo at least one sinusoidal variation cycle as varies over the wavelength range of interest. In other words, a maximum relative phase of larger than 2 is expected. For an FUT with the low value of over the wavelength range of interest, the difference of among different wavelengths is small, and is much smaller than 2. In this scenario, cannot be retrieved accurately, and the GBD measurement fails. To realize measurements in this scenario, the experimental setup in Figure 1 is modified. Rather than directly measuring the of two orthogonally polarized SMOSs, the modified setup first measures the wavelength-dependent group delays of fast axis and slow axis , respectively. Then, is calculated by . Application of to Equation (4) leads to . Accordingly, is obtained by utilization of Equation (5).
Figure 5 presents the modified measurement setup to interrogate and . In the experiment, a 509.5 m elliptical core PMF (Draka) is under test. To measure , port 1 and port 3 of the PMC with the FUT and the reflector R are connected to the fast axis ports of the PBS and the PBC, respectively. Using this setup, the difference of and is measured, where refers to the group delay of the SMOS propagating from the input of the PBS to the slow axis port of the PBC. The process of measurement is the same as that of measurement in the case of the Panda PMF. Similarly, is obtained by connecting port 1 and port 3 of the PMC to the slow axis ports of the PBS and the PBC, respectively, where refers to the group delay of the SMOS propagating through the fast axes of the PBS and the PBC. Then, is calculated by
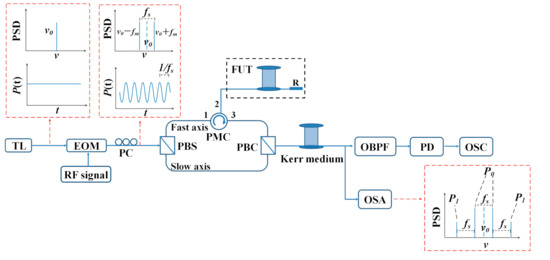
Figure 5.
Schematic of the modified measurement setup to interrogate and in the case of elliptical core PMF characterization.
Considering that the fiber length of the connection between the PBS and the PBC is much shorter than the length of the FUT, is much smaller than . As a result, the approximation of is valid. With Equations (4) and (5), and are calculated.
Figure 6a presents the measurement results of group delays , and calculated DGD . It is shown that and decline as increases. In contrast, declines in the beginning and then increases after a turning point at 1555 nm. Wavelength-dependent group birefringence of the elliptical core fiber is calculated from by usage of Equation (4) with = 509.5 m, and the values are presented in Figure 6b. The results show B = 4.553 × 10⁻⁴ at = 1550 nm. is calculated from by utilization of Equation (5), and the calculated values are presented in Figure 6c. The calculated results reveal that GBD is normal with < 0 for < 1555 nm and anomalous with > 0 for > 1555 nm.
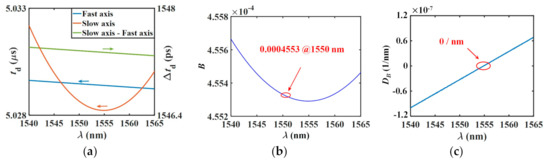
Figure 6.
Experimental results of (a) , and calculated , (b) group birefringence B and (c) group birefringence dispersion as a function of the laser wavelength in the case of elliptical core PMF characterization.
4. Discussion
The precision of the proposed approach is determined by the minimum detectable relative phase . Using = 0.02 rad [14] and = 20 GHz leads to the minimum detectable relative DGD of = 159 fs. The precision can be further improved by usage of commercially available 50 GHz electro-optic modulators allowing for = 100 GHz and = 32 fs. In the case of elliptical core PMF characterization, is doubled because relative DGD in this case is obtained by the measurement of group delays of two principal axes, rather than by one direct measurement of DGD. Two measurements make twofold.
For the measurement of GBD, the limits of the proposed approach are estimated from the DGD variation rate [12]. Applications of Equation (4), Equation (5) and lead to , where and respectively are the DGD difference and wavelength separation between two adjacent scanning wavelengths. In the case of Panda PMF characterization, the minimum measurable DGD variation rate is with being the maximum laser scanning range. In our experimental setup, the EDFA works in C band, and thus is limited by 30 nm. Applications of = 159 fs and = 30 nm lead to = 5.3 fs/nm. The maximum measurable DGD variation rate is with being the minimum laser scanning step. Accurate restoration of the sinusoidal power variation of requires N sampling points within a sinusoidal variation cycle. This requirement restricts , where is the maximum phase difference associated with two adjacent scanning wavelengths. Accordingly, and are obtained. Applications of N = 10, = 20 GHz and = 0.001 nm of our tunable laser lead to = 5 ns/nm. In the case of elliptical core PMF characterization, is identical to that of the Panda PMF measurement, while is double because the minimum detectable relative DGD is twice that in the case of Panda PMF characterization.
The maximum measurable fiber length is determined by the maximum measurable DGD variation rate and the intensity loss of the SMOSs traveling through the FUT. Applications of = 5 ns/nm and = 5.55 × 10⁻⁷/nm of the Panda PMF at = 1550 nm lead to ≈ 1.35 × 10⁶ m. Taking into account the intensity loss of SMOSs that travel through the FUT, one can place an EDFA after port 3 of the PMC in Figure 4 or Figure 5 to compensate the intensity loss and thus to extend the maximum measurable fiber length. Considering the loss of 0.2 dB/km, application of the EDFA offering 10 dB gain allows for a 50 km measurable fiber length.
The measurement sensitivity of the proposed approach in comparison with that of the white-light-interferometry-based technique is also discussed. Essentially, the proposed approach interrogates the GBD of a PMF by measuring the DGD of two SMOSs. Therefore, the measurement sensitivity is governed by that of the DGD measurement. As Equation (1) reveals, the DGD is demodulated from the sinusoidal power variation that oscillates at a frequency on the order of 1010 Hz. Consequently, the sensitivity of DGD measurement is determined by . Similarly, the white-light-interferometry-based technique interrogates the GBD of a PMF by measuring the phase delay of two optical signals. The phase delay is demodulated from the sinusoidal power variation that oscillates at an optical frequency , and the measurement sensitivity of the white-light-interferometry-based technique is determined by . For a light wave operating at C band, the optical frequency is on the order of 1014 Hz, which is 104 higher than . Therefore, the measurement sensitivity of the white-light-interferometry-based technique is 104 higher than that of the proposed approach.
5. Conclusions
In conclusion, the Kerr-phase-interrogator-based method is systematically studied to measure the GBD of a long PMF, and two commercial PMFs with high GBD and low GBD are experimentally investigated. Rather than utilizing the interference between two polarization modes, the proposed approach employs the Kerr effect between two polarization modes to interrogate the GBD of a PMF. Therefore, the proposed approach is free from the limitation of laser coherent length on the measurable fiber length. By using a commercial EDFA, the intensity loss of the SMOSs can be compensated, which allows for characterizing a PMF with a length of tens of kilometers.
Funding
This work was supported by the Natural National Science Foundation of China (NSFC) (61705262, 61775238, 61705263), and the National Basic Research Program of China (2017YFB0405503).
Conflicts of Interest
The author declares no conflict of interest.
References
- Jinno, M.; Matsumoto, T. Ultrafast, low power, and highly stable all-optical switching in an all polarization maintaining fiber Sagnac interferometer. IEEE Photon. Technol. Lett. 1990, 2, 349–351. [Google Scholar] [CrossRef]
- Nishizawa, N.; Goto, T. Widely wavelength-tunable ultrashort pulse generation using polarization maintaining optical fibers. IEEE J. Sel. Top. Quant. Electron. 2001, 7, 518–524. [Google Scholar] [CrossRef]
- Dixon, A.R.Z.; Yuan, L.; Dynes, J.F.; Sharpe, A.W.; Shields, A.J. Gigahertz decoy quantum key distribution with 1Mbit/s secure key rate. Opt. Express 2008, 16, 18790–18797. [Google Scholar] [CrossRef] [PubMed]
- Flavin, D.A. Dispersion of birefrinigence and differential group delay in polarization-maintaining fiber. Opt. Lett. 2002, 27, 1010–1012. [Google Scholar]
- Hlubina, P. Dispersion of group and phase modal birefringence in elliptical-core fiber measured by white-light spectral interferometry. Opt. Express 2003, 11, 2793–2798. [Google Scholar] [PubMed]
- Chen, X.; Zhang, H.; Jia, D.; Liu, T.; Zhang, Y. Spectral-domain measurement of chromatic dispersion difference of polarization modes in polarization-maintaining fibers. J. Mod. Optic. 2011, 58, 26–31. [Google Scholar] [CrossRef]
- Deng, D.; Sega, D.; Cheng, T.; Gao, W.; Xue, X.; Suzuki, T.; Ohishi, Y. Dispersion characterization of two orthogonal modes in a birefringence tellurite microstructured optical fiber. Opt. Express 2014, 22, 23920–23927. [Google Scholar] [CrossRef] [PubMed]
- Lee, J.Y.; Kim, D.Y. Versatile chromatic dispersion measurement of a single mode fiber using spectral white light interferometry. Opt. Express 2006, 14, 11608–11615. [Google Scholar] [CrossRef] [PubMed]
- Tang, F.; Wang, X.Z.; Zhang, Y.; Jing, W. Characterization of birefringence dispersion in polarization maintaining fibers by use of white-light interferometry. Appl. Opt. 2007, 46, 4073–4080. [Google Scholar] [CrossRef] [PubMed]
- Yu, Z.J.; Yang, J.; Yuan, Y.G.; Li, C.; Liang, S.; Hou, L.; Peng, F.; Wu, B.; Zhang, J.Z.; Liu, Z.H.; et al. Quasi-distributed birefringence dispersion measurement for polarization maintain device with high accuracy based on white light interferometry. Opt. Express 2016, 24, 1588–1597. [Google Scholar] [CrossRef] [PubMed]
- Baker, C.; Bao, X. Displacement sensor based on Kerr induced phase-modulation of orthogonally polarized sinusoidal optical signals. Opt. Express 2014, 22, 9095–9100. [Google Scholar] [CrossRef] [PubMed]
- Baker, C.; Lu, Y.; Bao, X. Chromatic-dispersion measurement by modulation phase-shift method using a Kerr phase-interrogator. Opt. Express 2014, 22, 22314–22319. [Google Scholar] [CrossRef] [PubMed]
- Lu, Y.; Baker, C.; Bao, X. Dispersion Characterization of Group Birefringence in Polarization-Maintaining Fiber using a Kerr Phase-Interrogator. In Proceedings of the 5th Asia Pacific Optical Sensors Conference (APOS 2015), Jeju, Korea, 20–22 May 2015. [Google Scholar]
- Lu, Y.; Baker, C.; Chen, L.; Bao, X. Chromatic-dispersion monitor based on a differential phase-shift method using a Kerr phase-interrogator. IEEE Photonics J. 2015, 7, 7101406. [Google Scholar] [CrossRef]


Publisher’s Note: MDPI stays neutral with regard to jurisdictional claims in published maps and institutional affiliations. |
© 2020 by the author. Licensee MDPI, Basel, Switzerland. This article is an open access article distributed under the terms and conditions of the Creative Commons Attribution (CC BY) license (http://creativecommons.org/licenses/by/4.0/).