Elucidating the Role of Matrix Porosity and Rigidity in Glioblastoma Type IV Progression

 , , ,
, , ,
Abstract
:1. Introduction
2. Materials and Methods
2.1. Materials
2.2. Cell Culture and Spheroid Formation
2.3. Preparation of Hydrogels and Cell Encapsulation
2.4. Mechanical Characterization of Hydrogels
2.5. Scanning Electron Microscopy (SEM)
2.6. Optical Microscopy Analyses
2.7. Time Lapse Acquisition and Cell Trajectory Analyses
2.8. MTT Assay
2.9. Cellular Metrics: Single Cell Mobility and Spheroid Progression Kinetics
2.10. Statistics
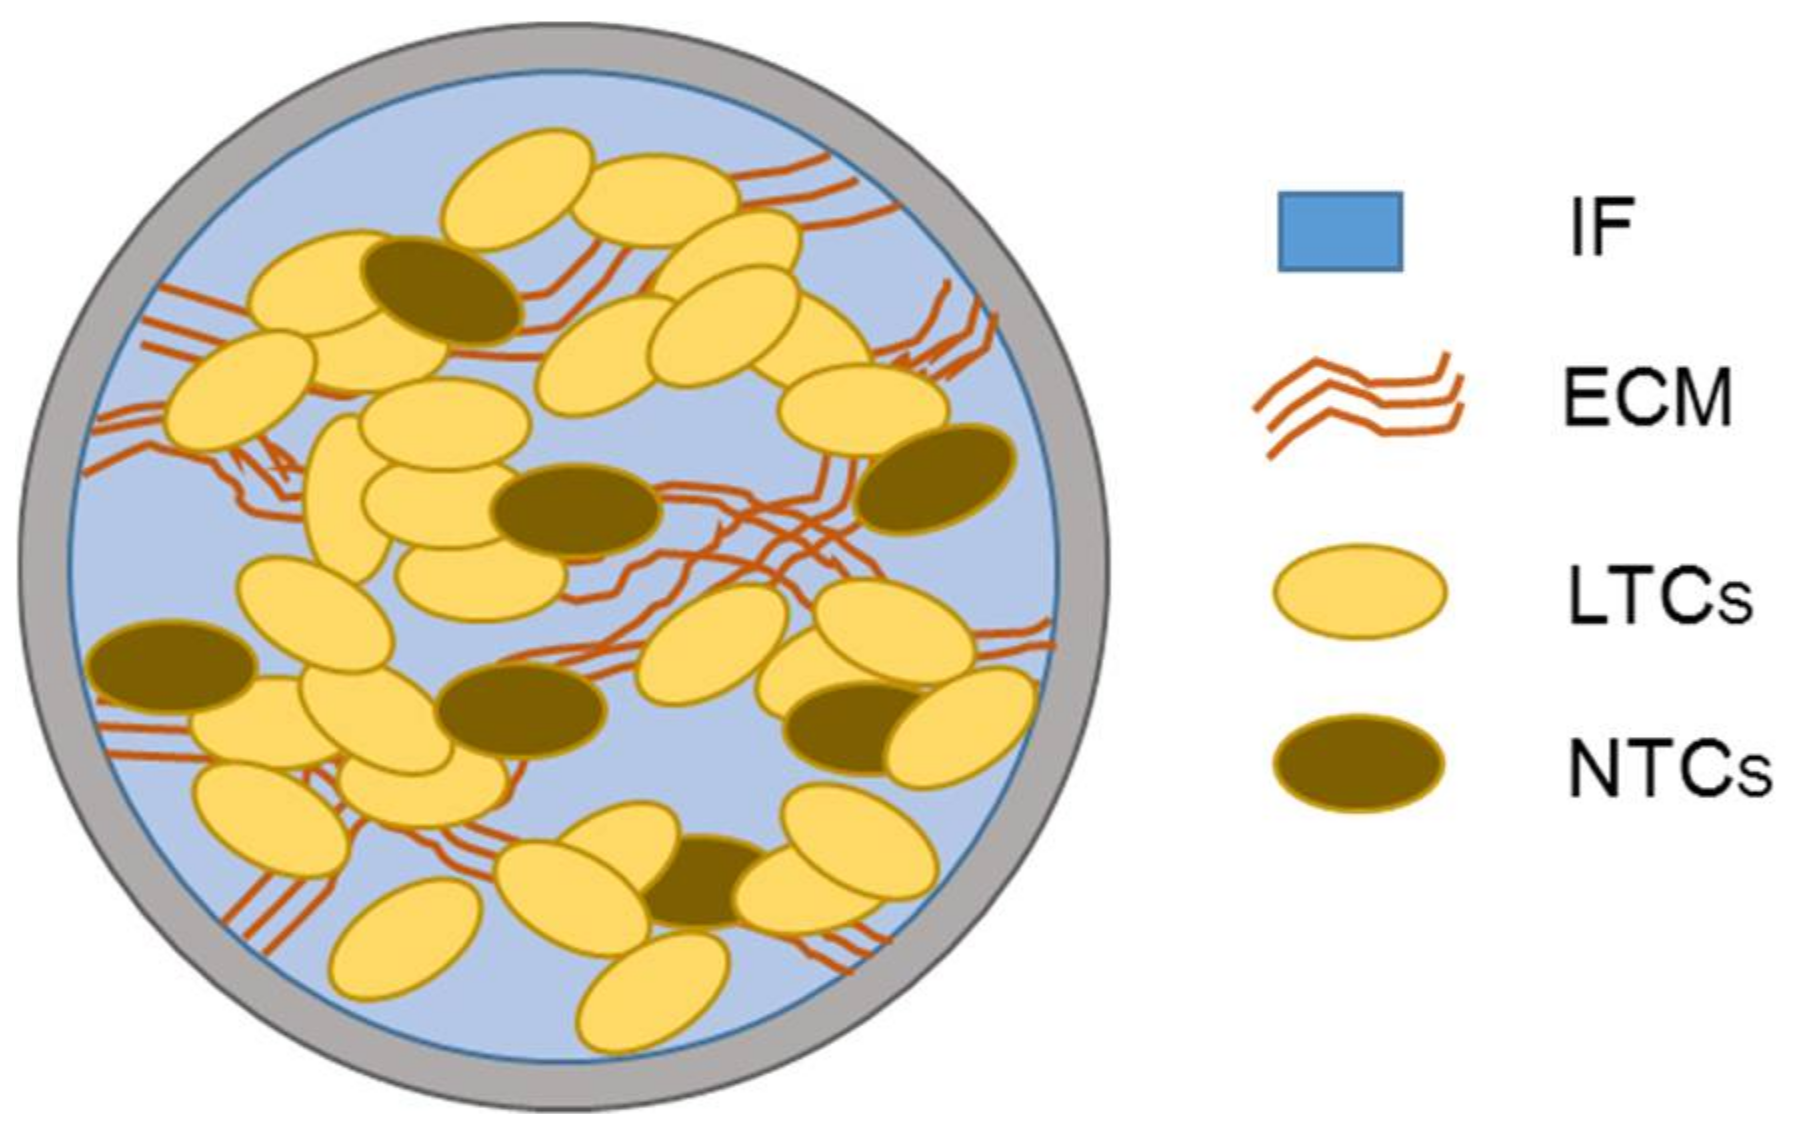
3. Computational Model
3.1. Governing Equations
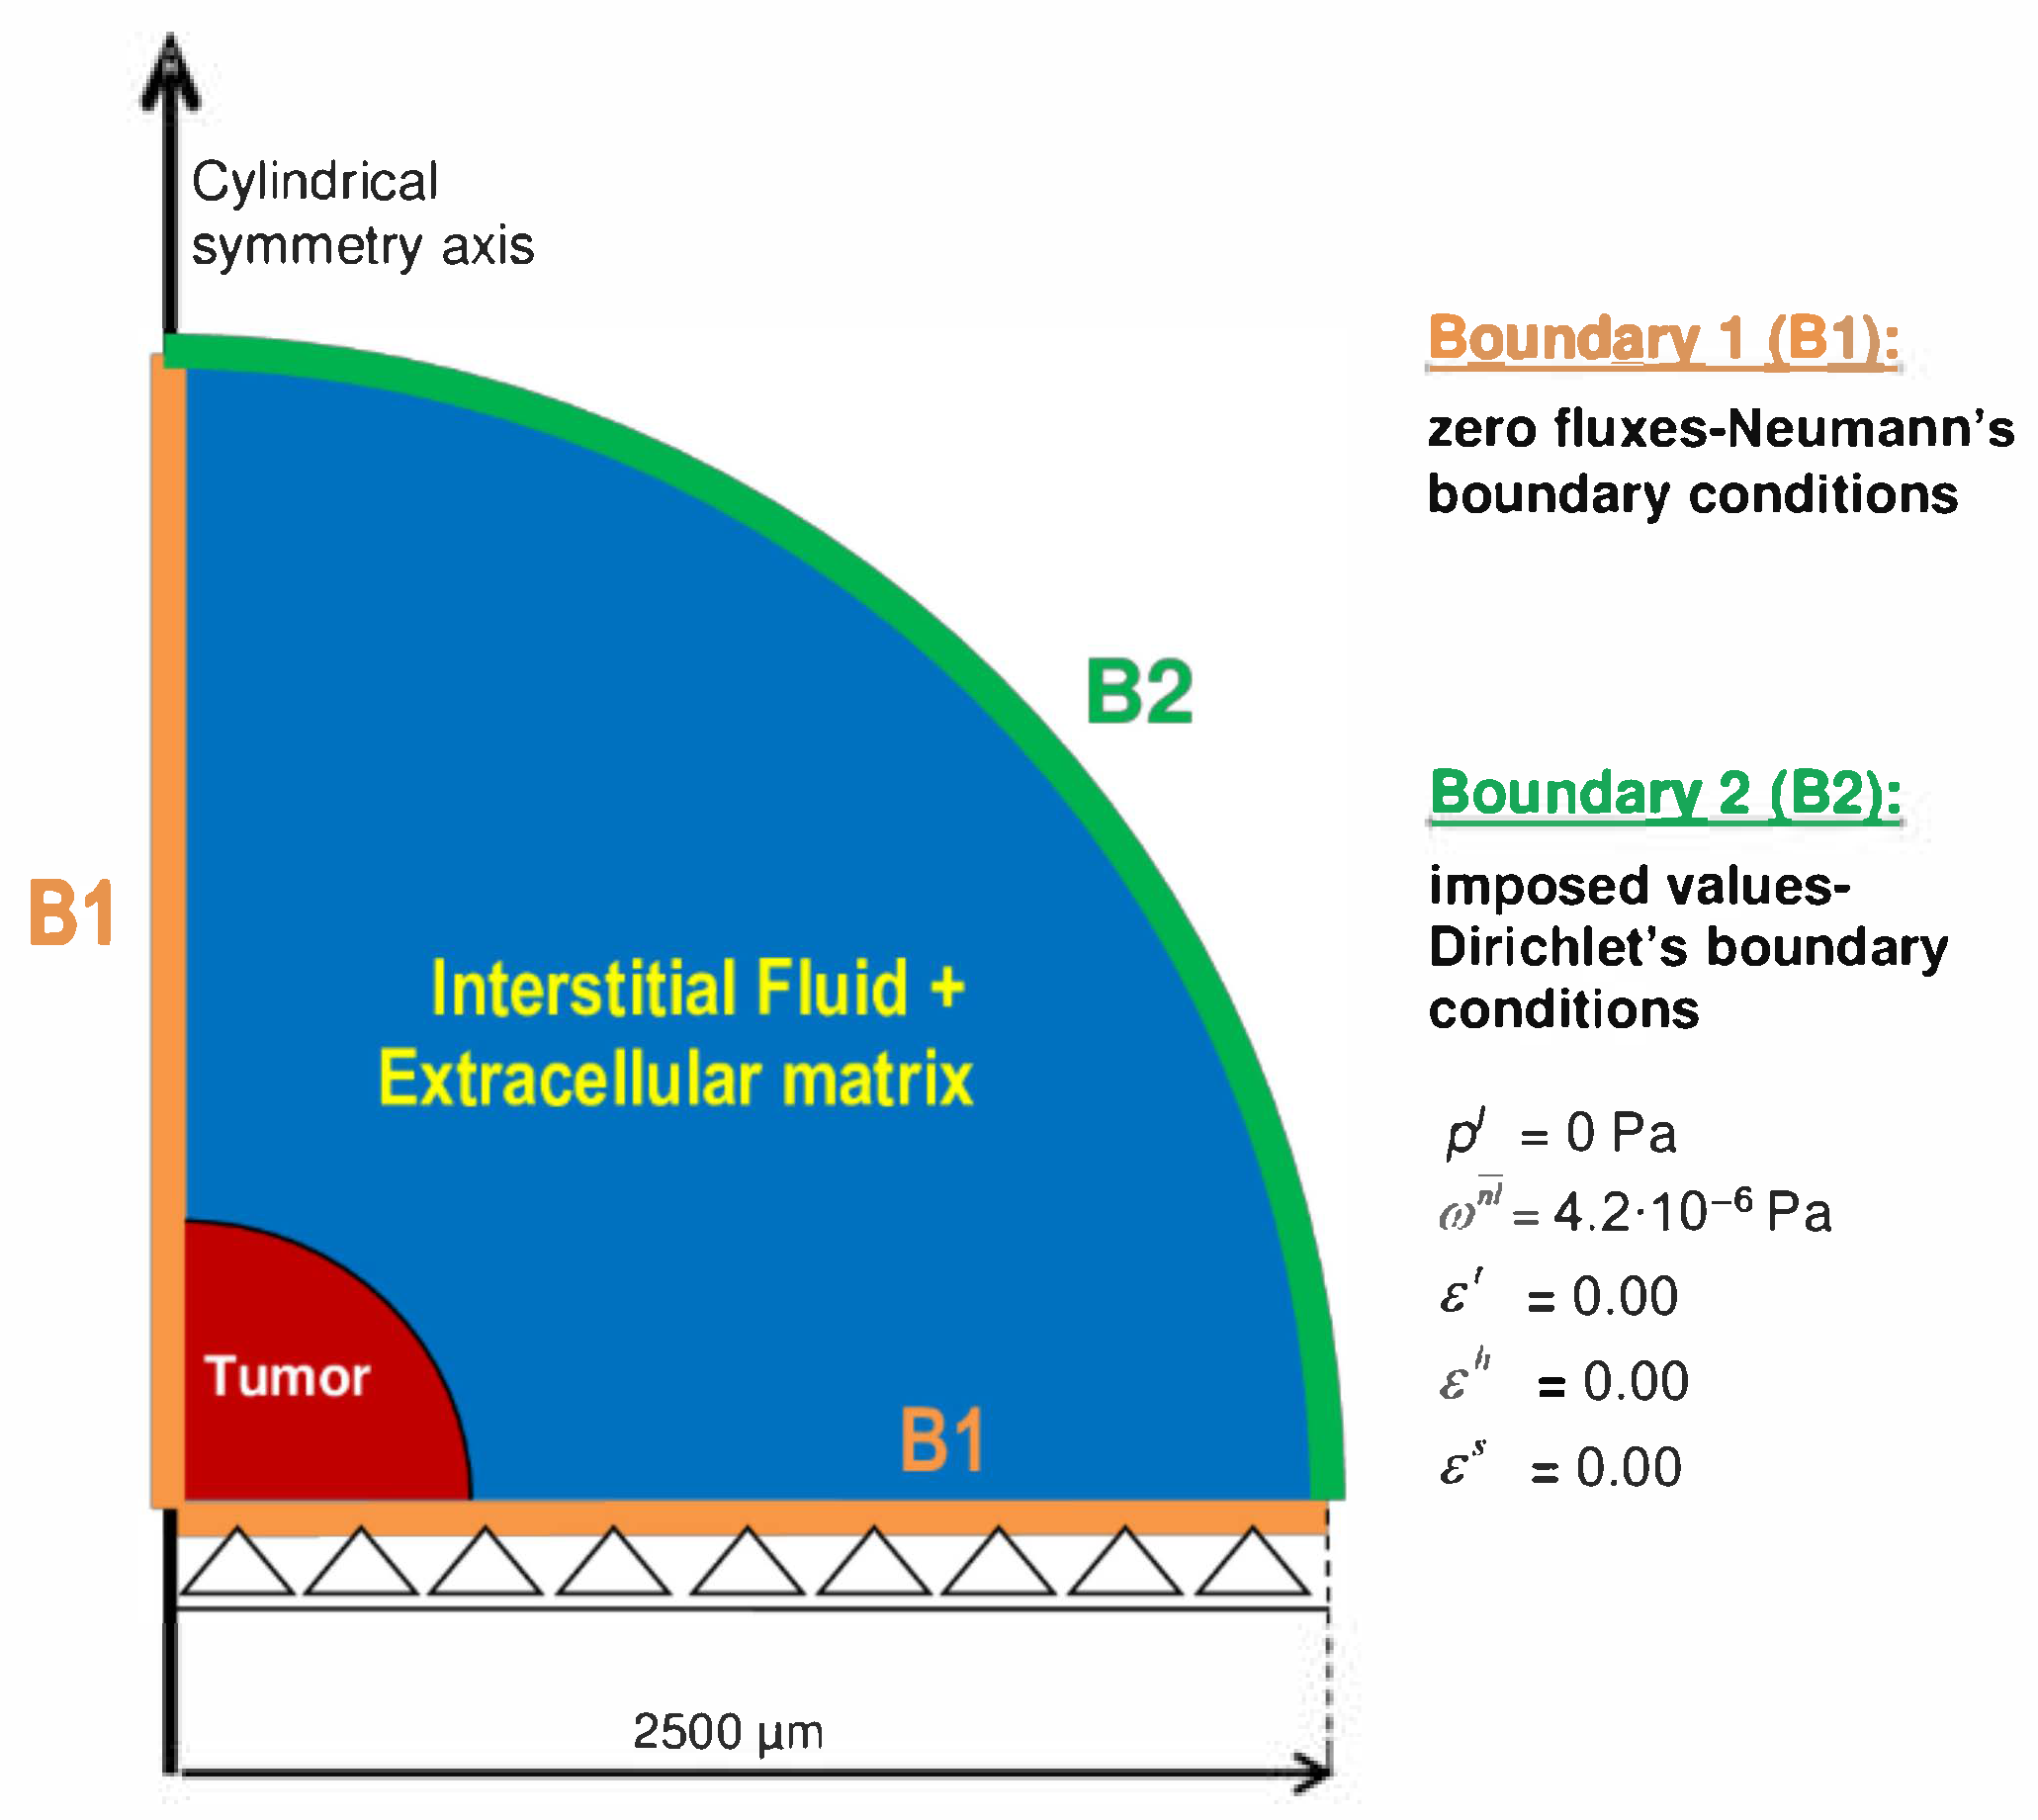
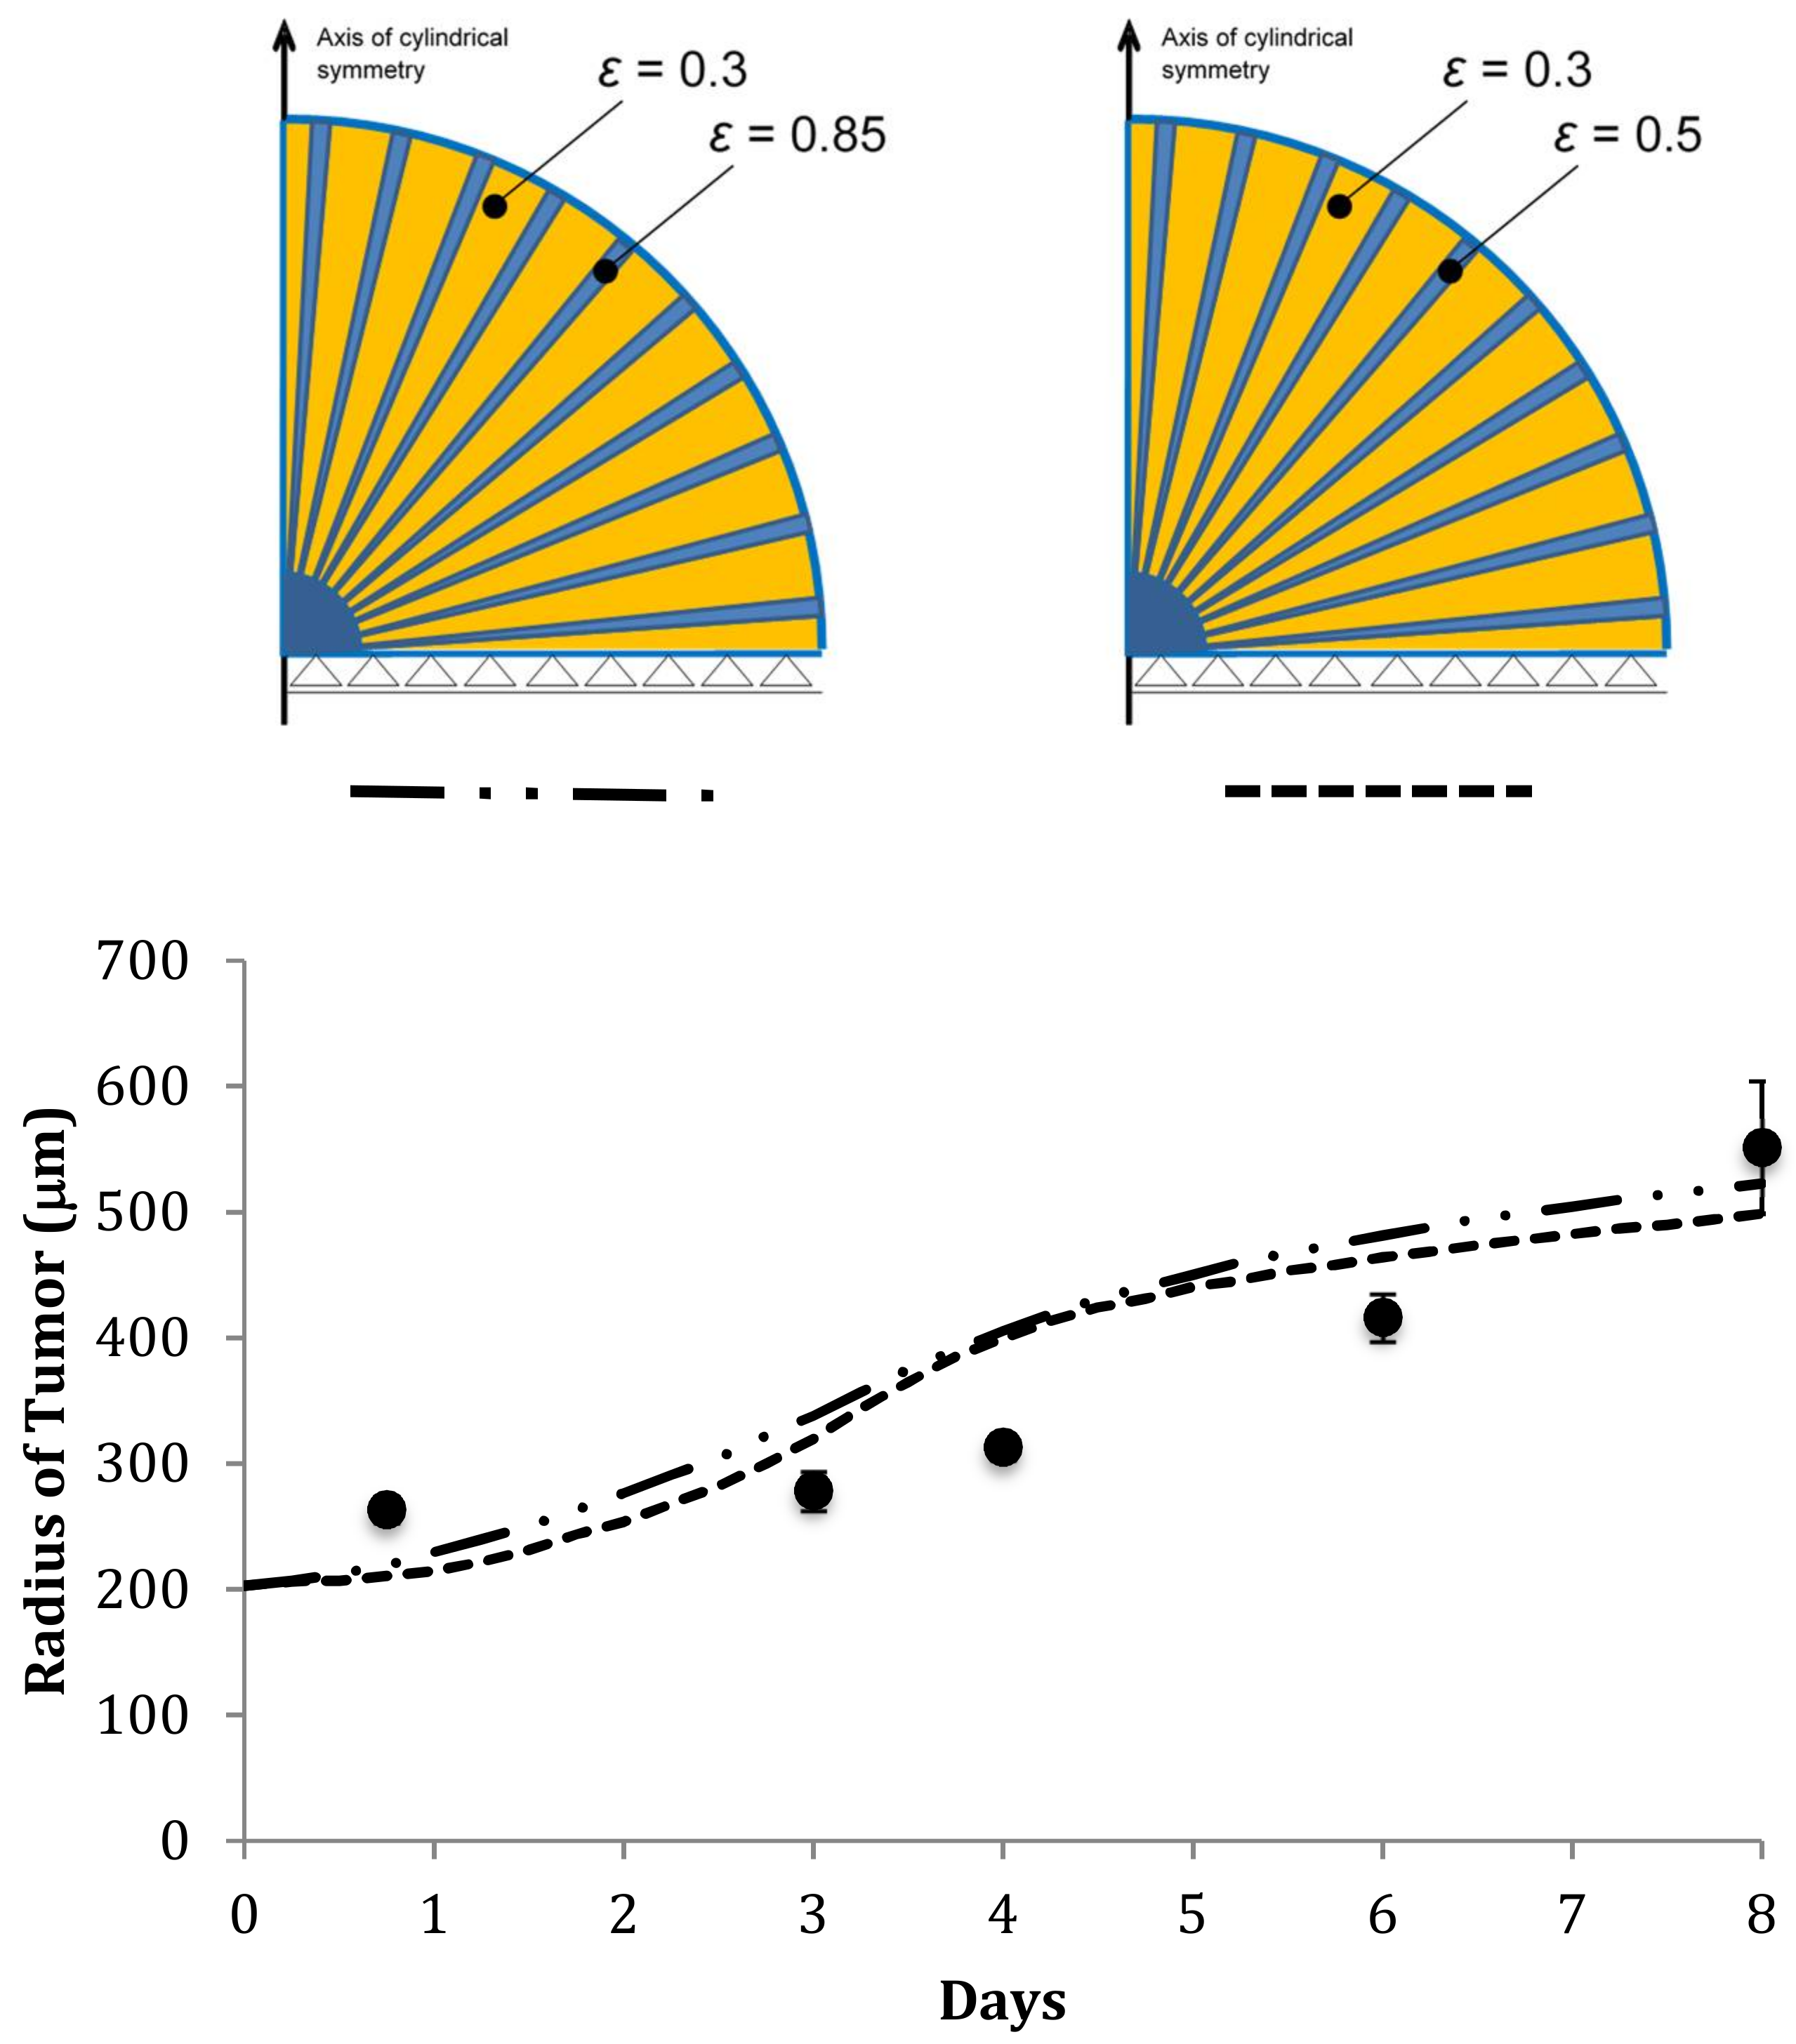
3.2. Description of Geometry, Boundary, and Initial Conditions of the Simulations
4. Results
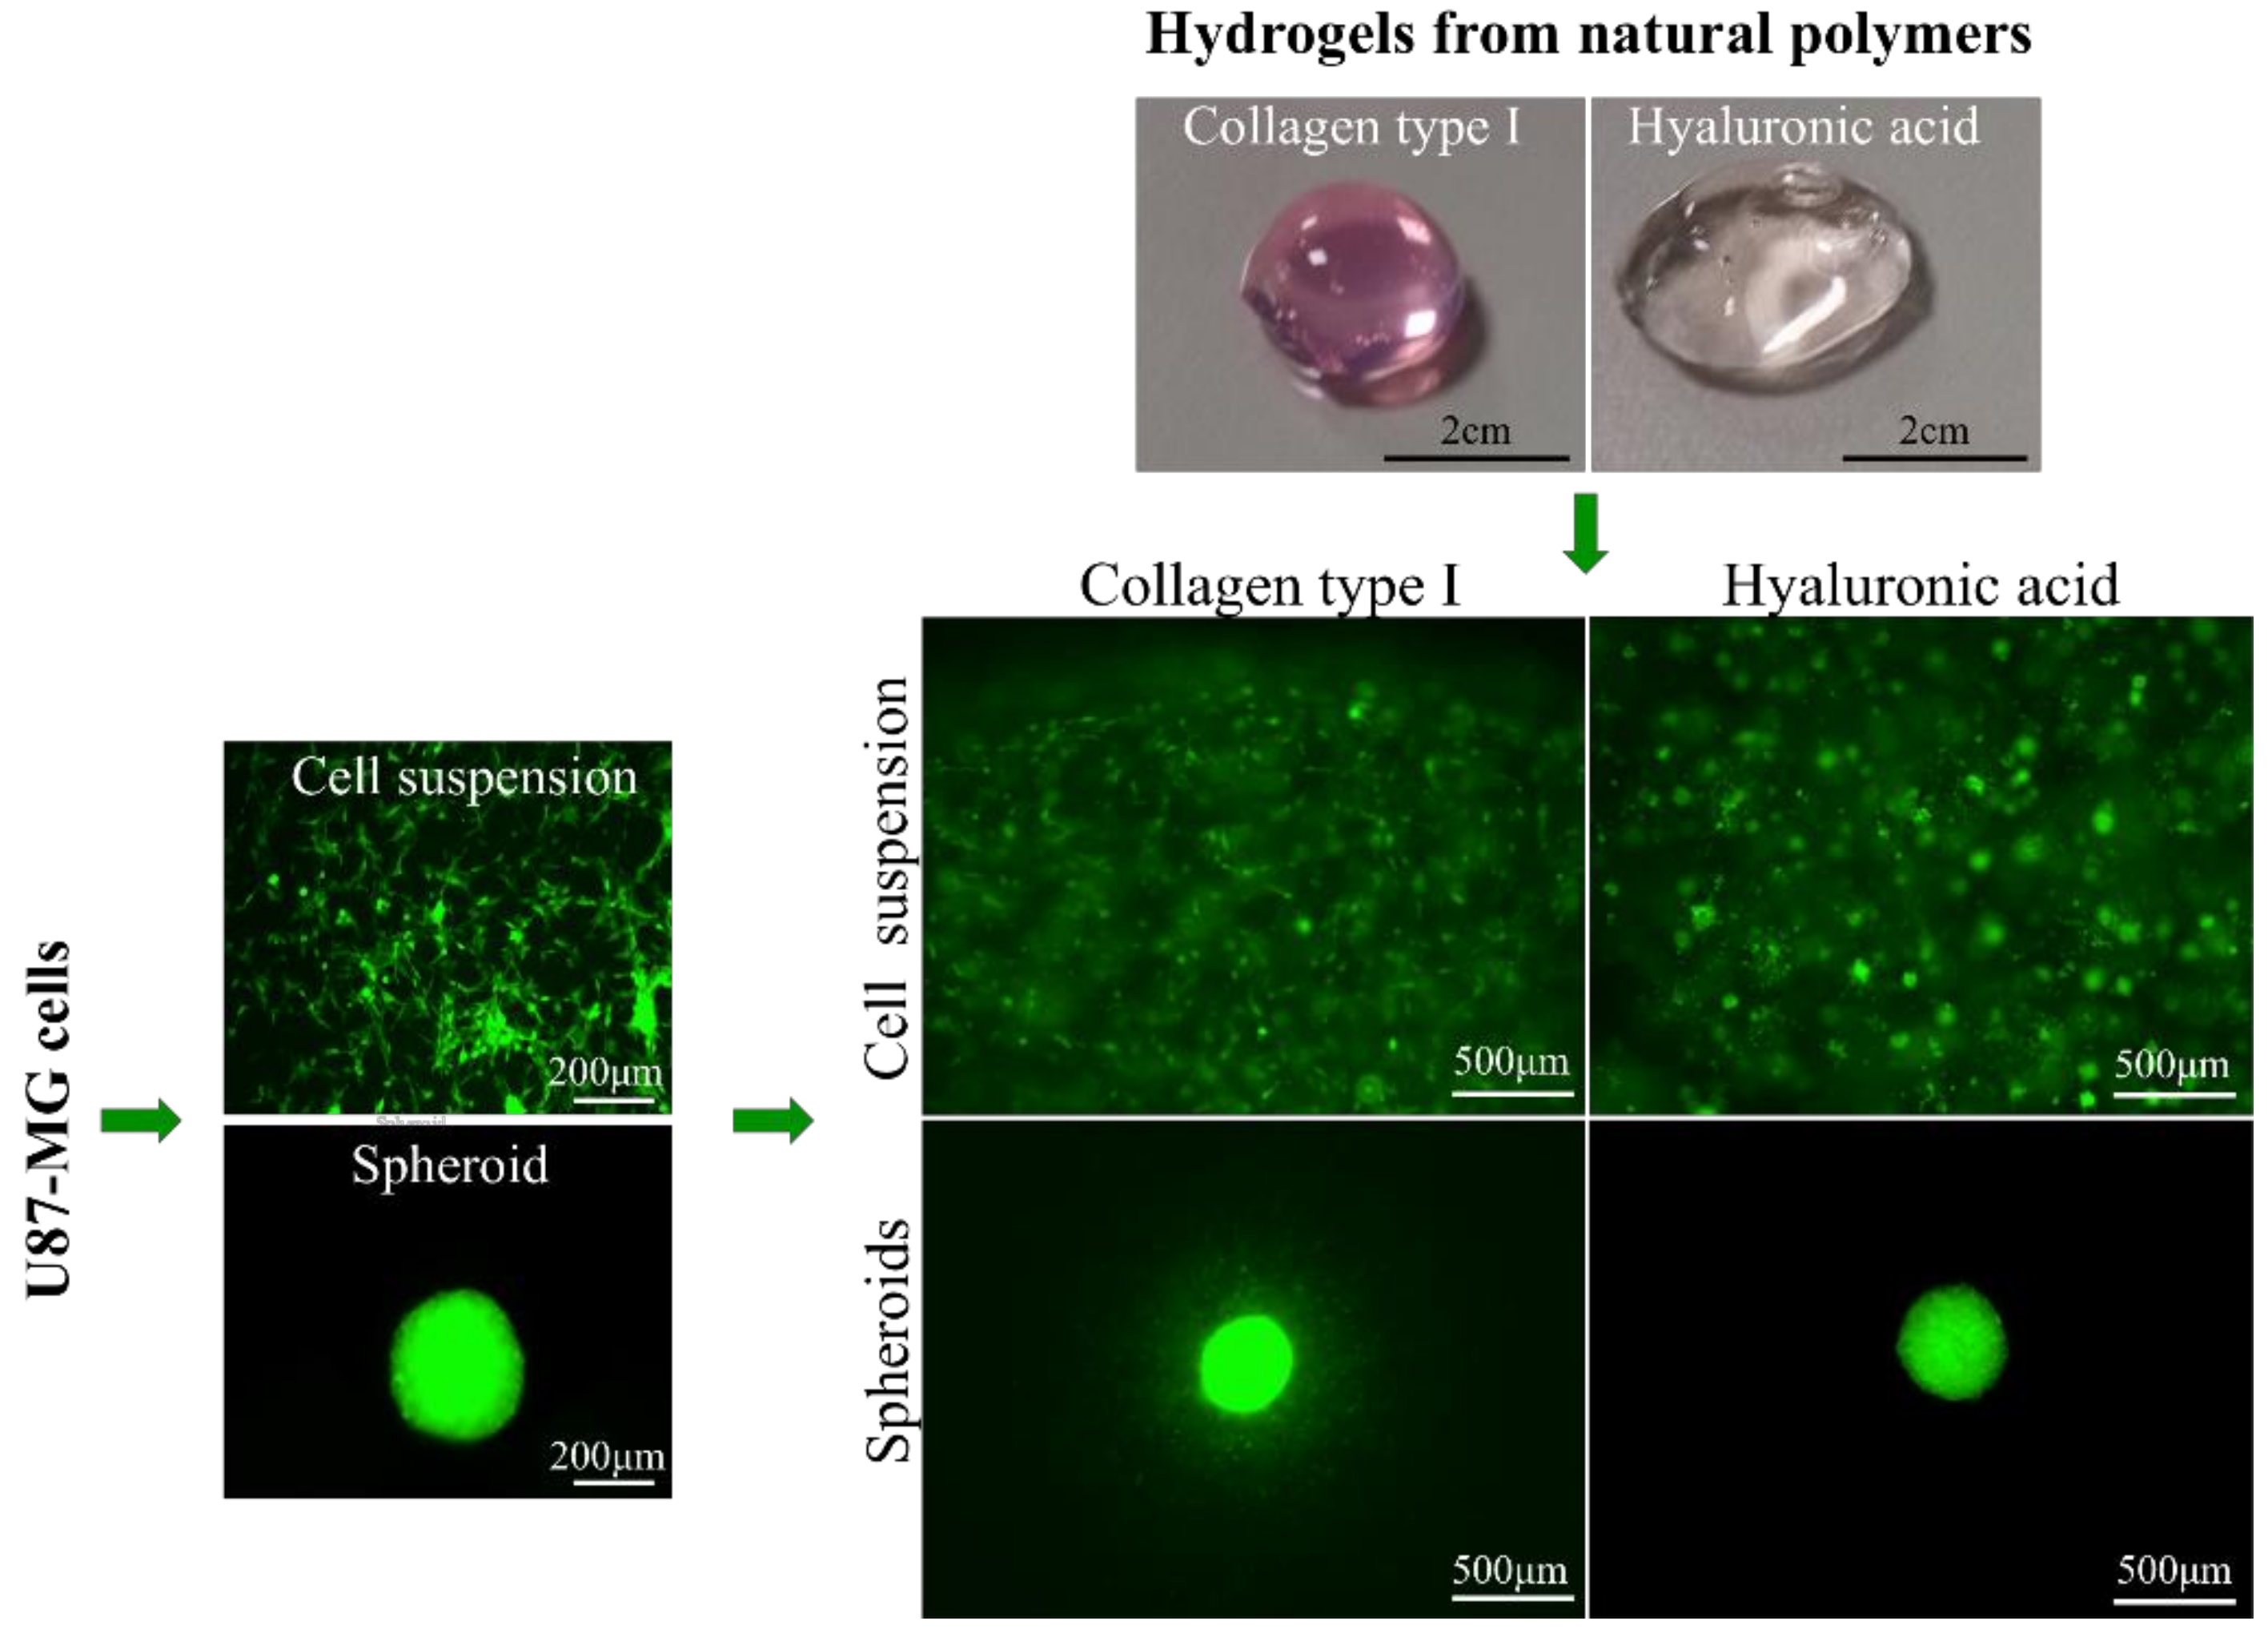
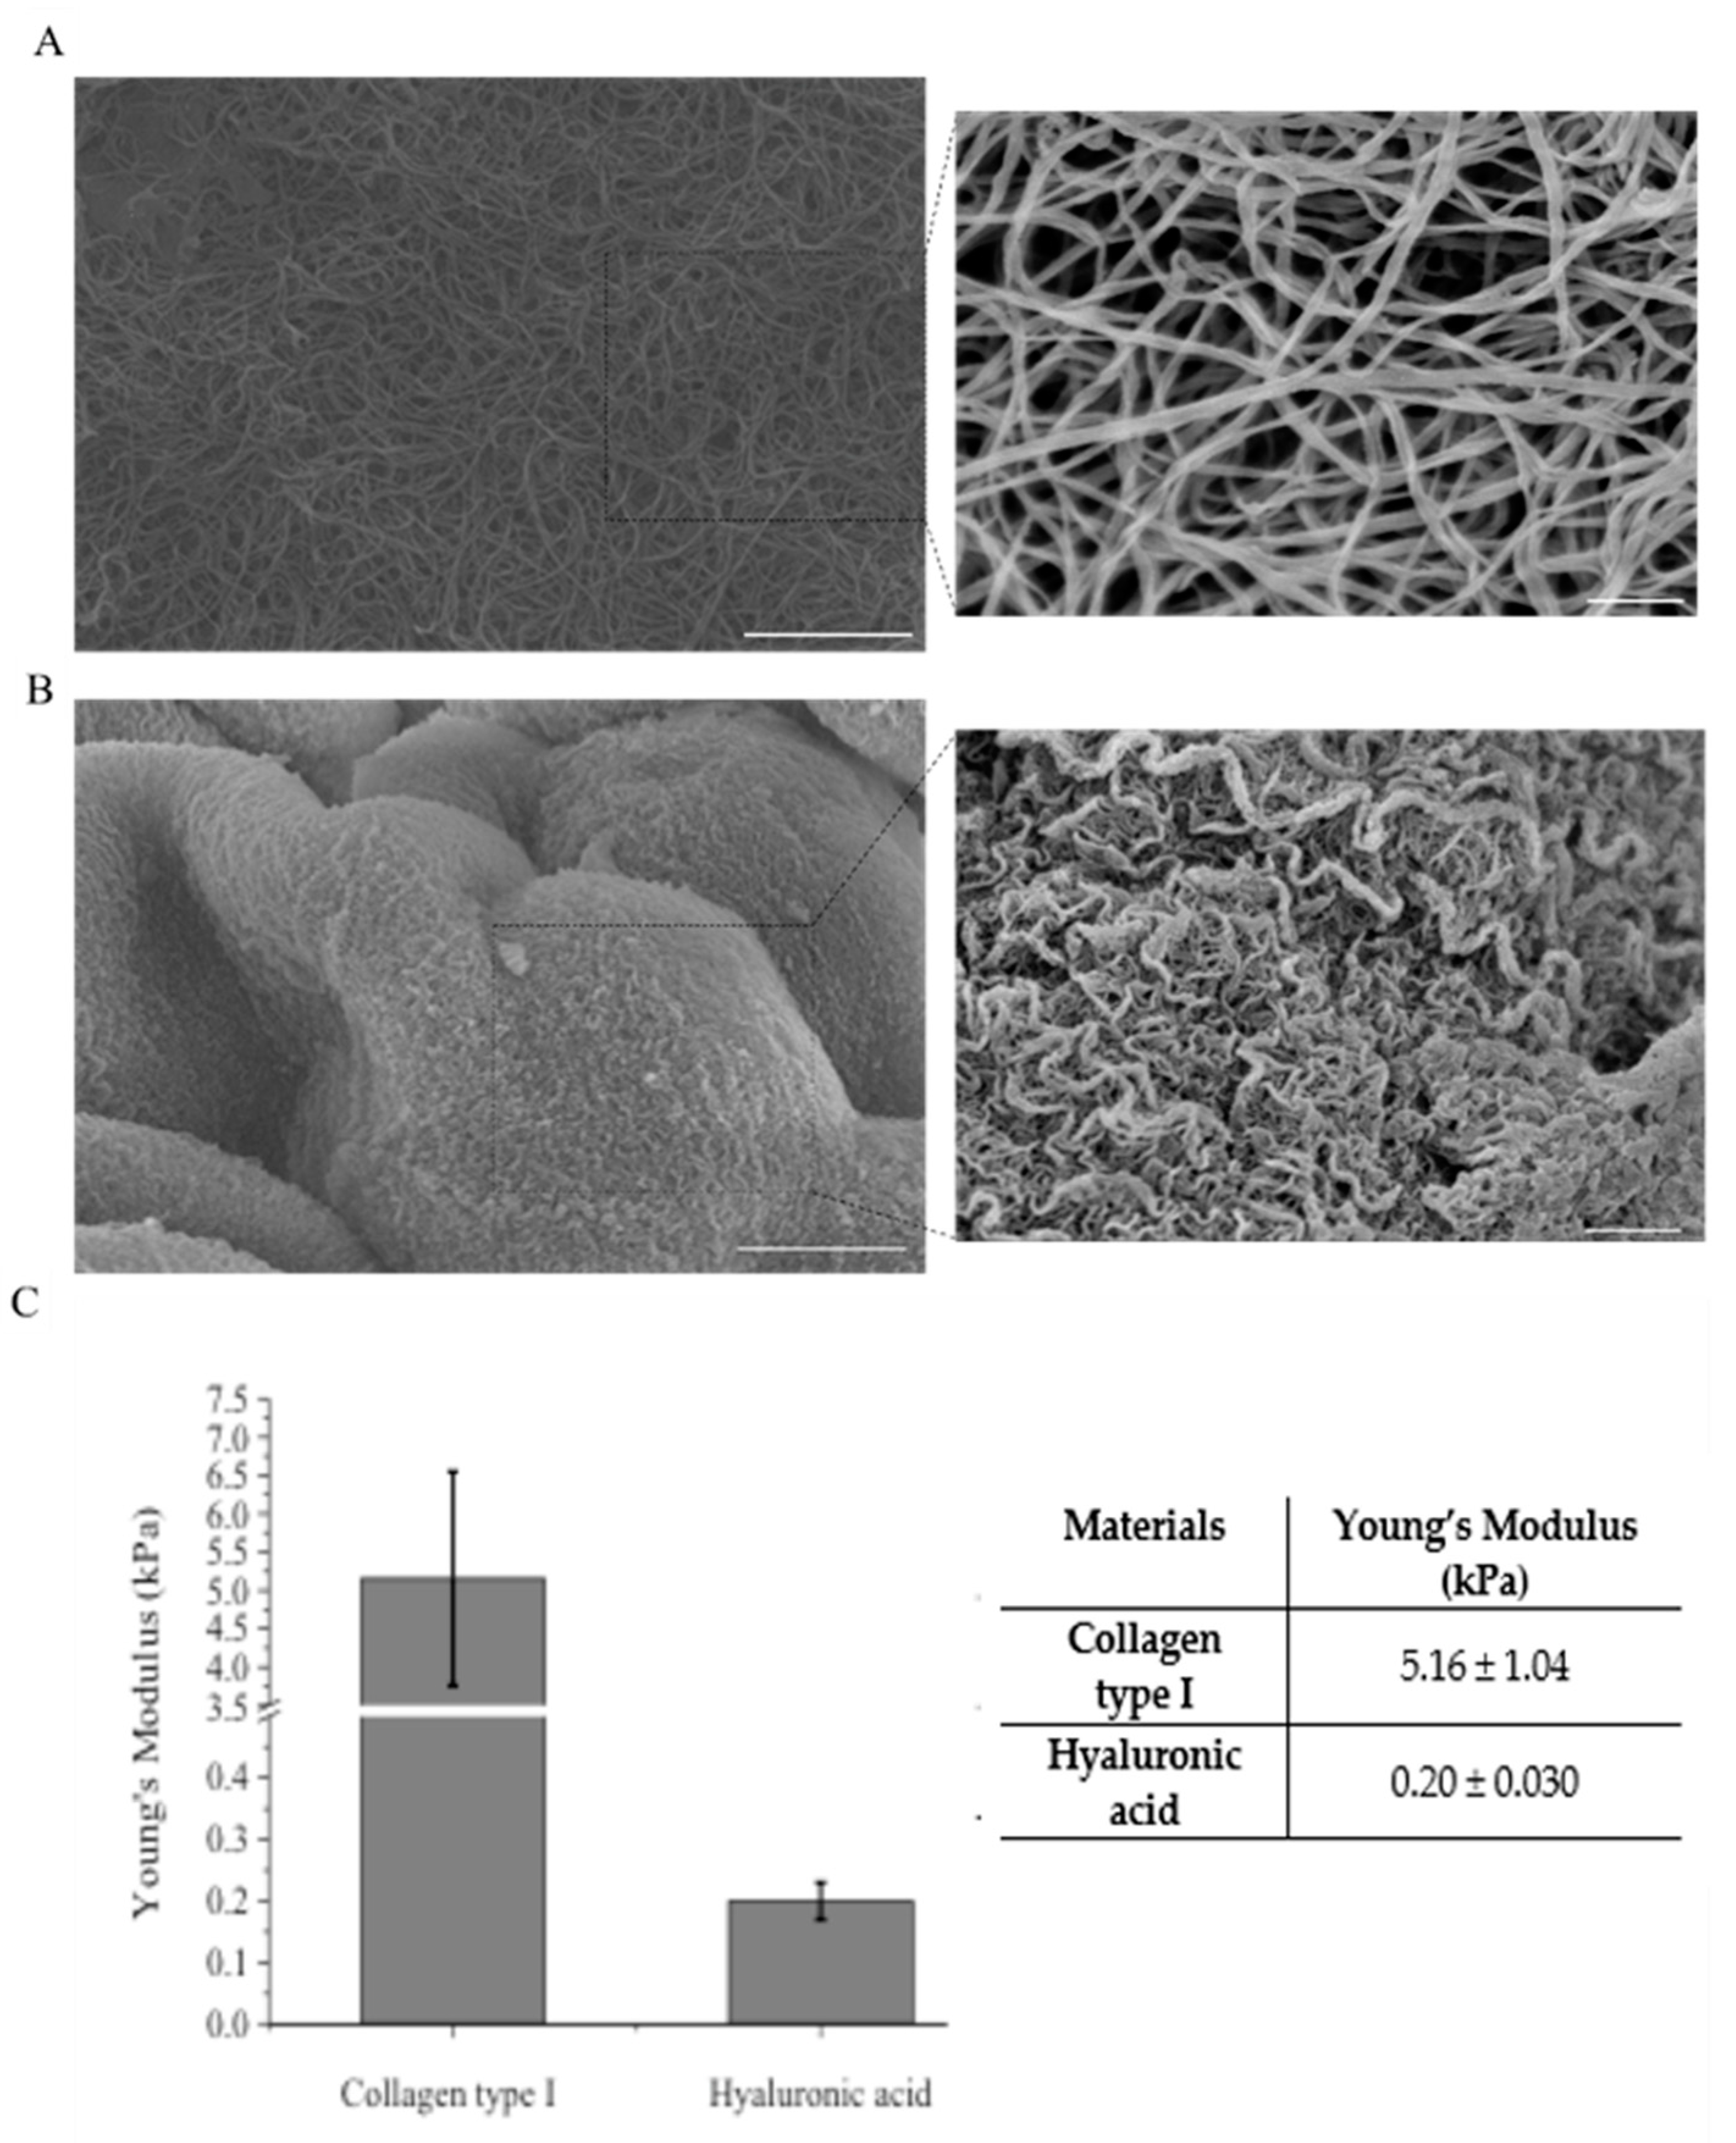
4.1. Morphological and Mechanical Characterization of Hydrogels for the Inclusion of U87-MG Tumor Cells
4.2. Growth of Individual U87-MG Cells in Different Hydrogels
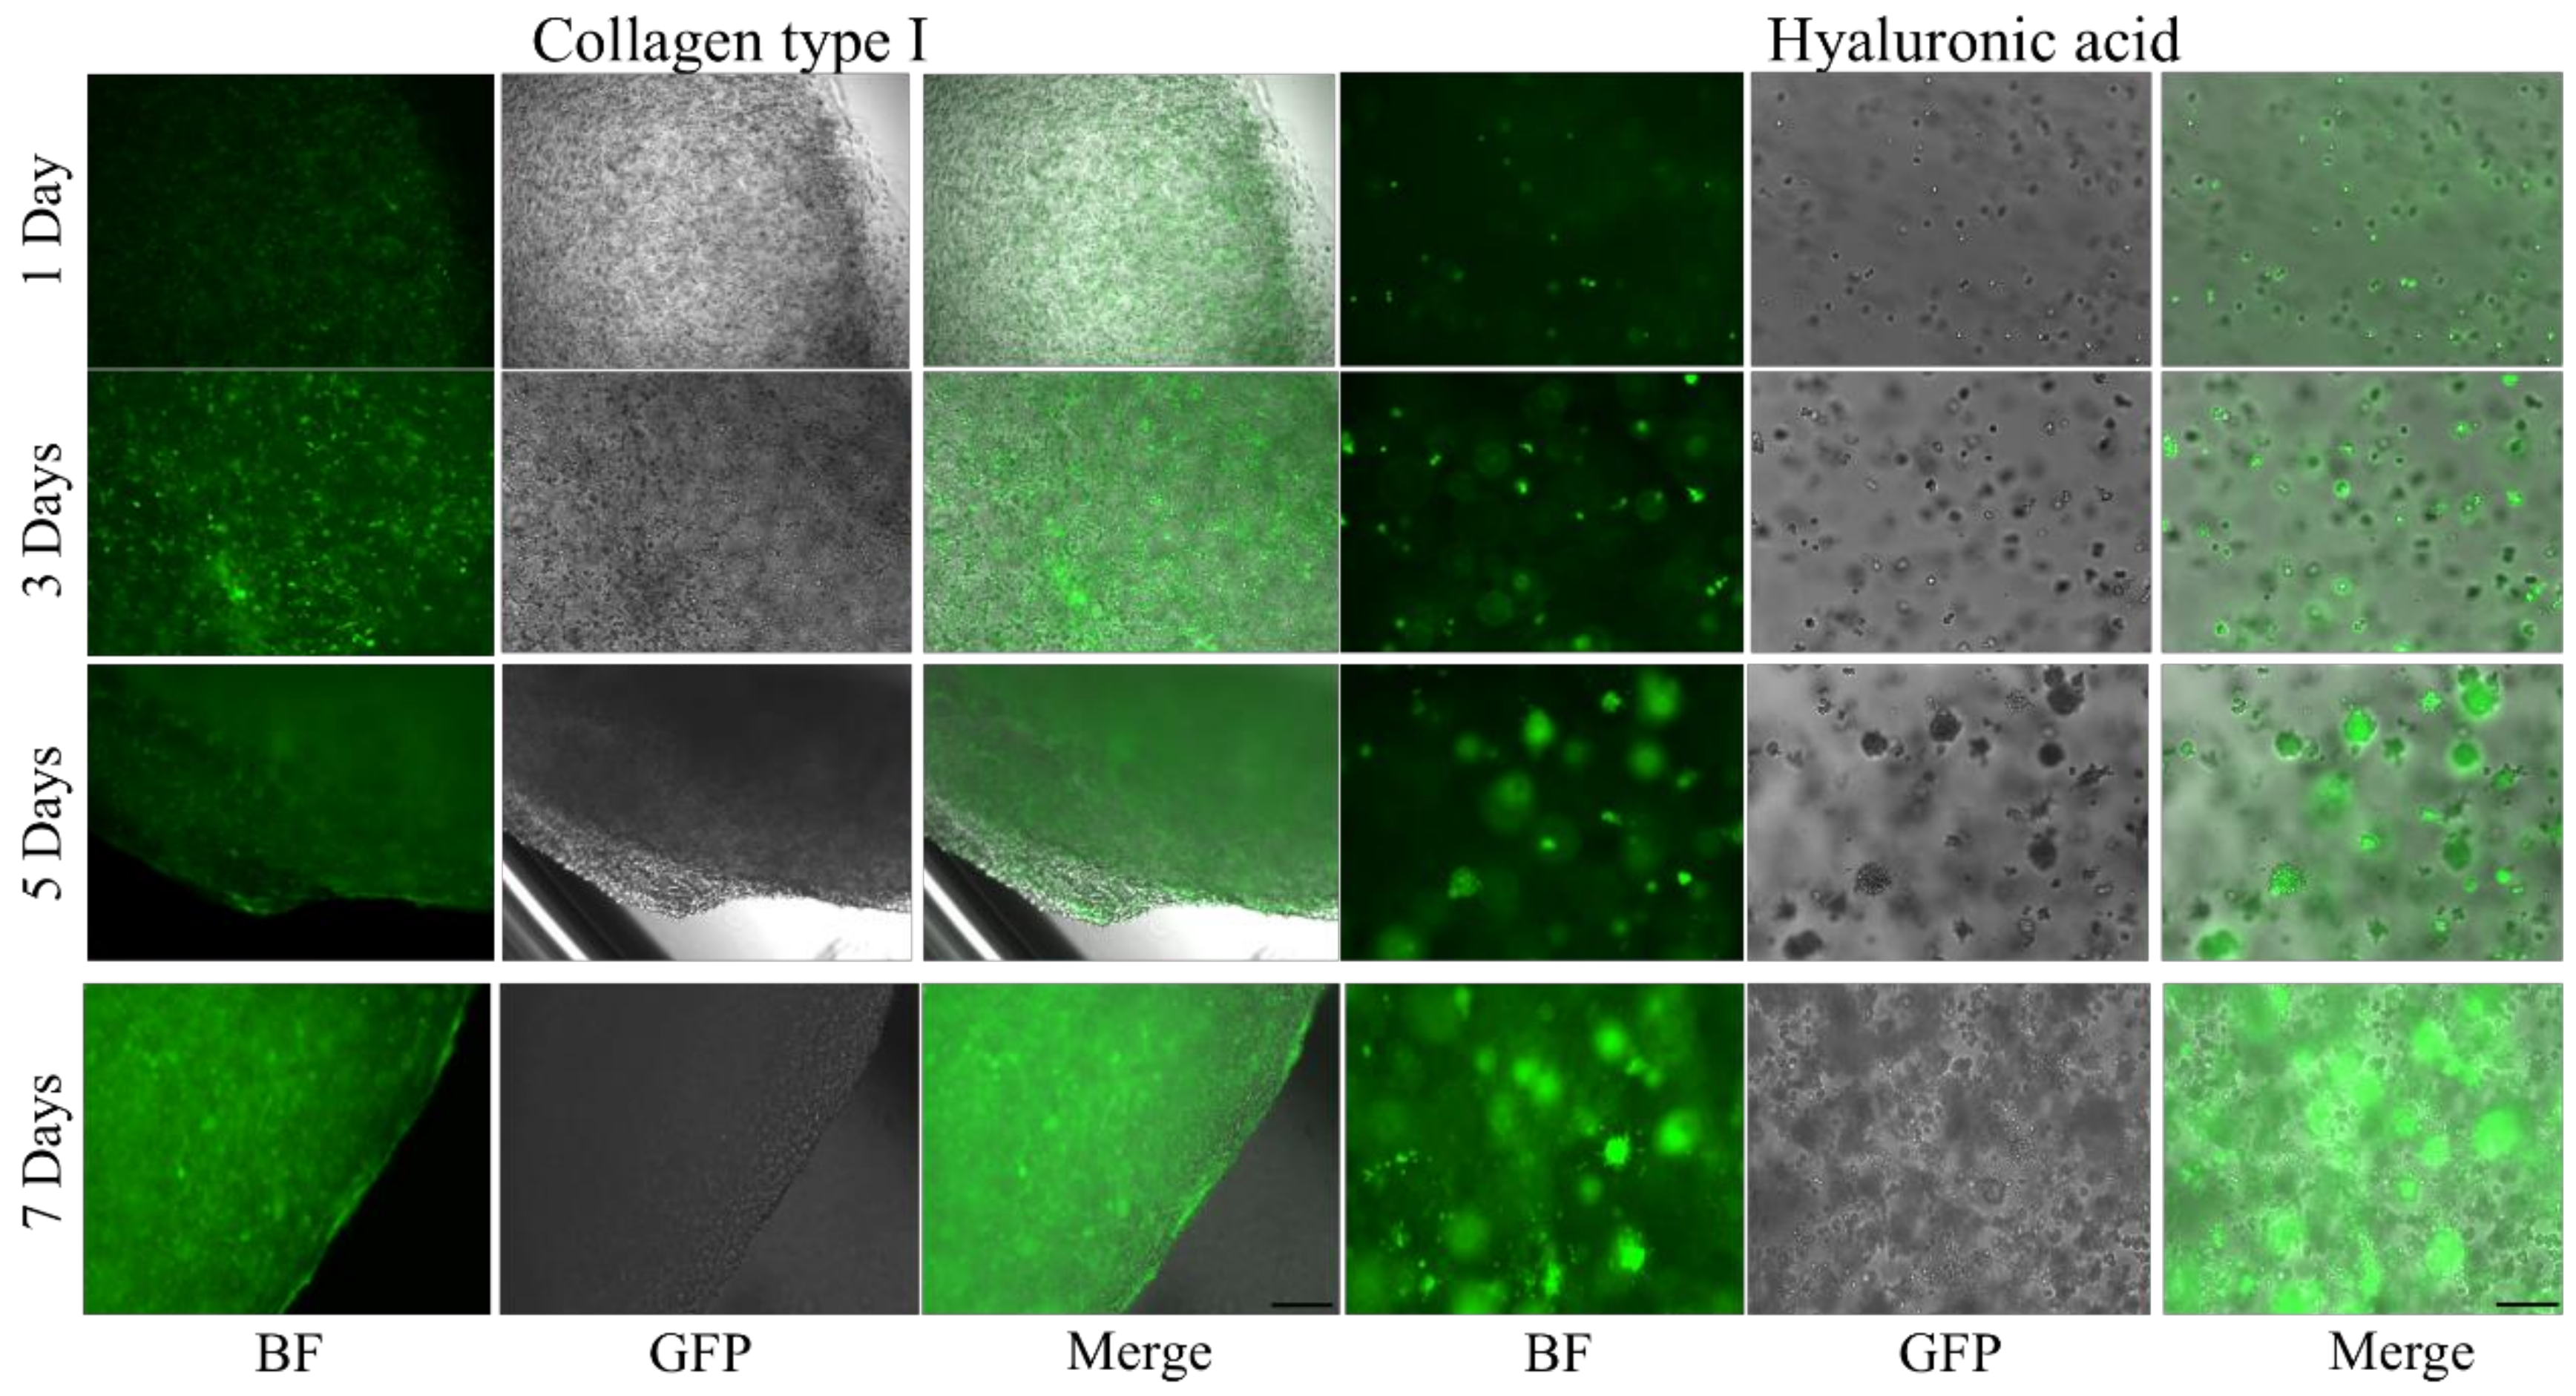
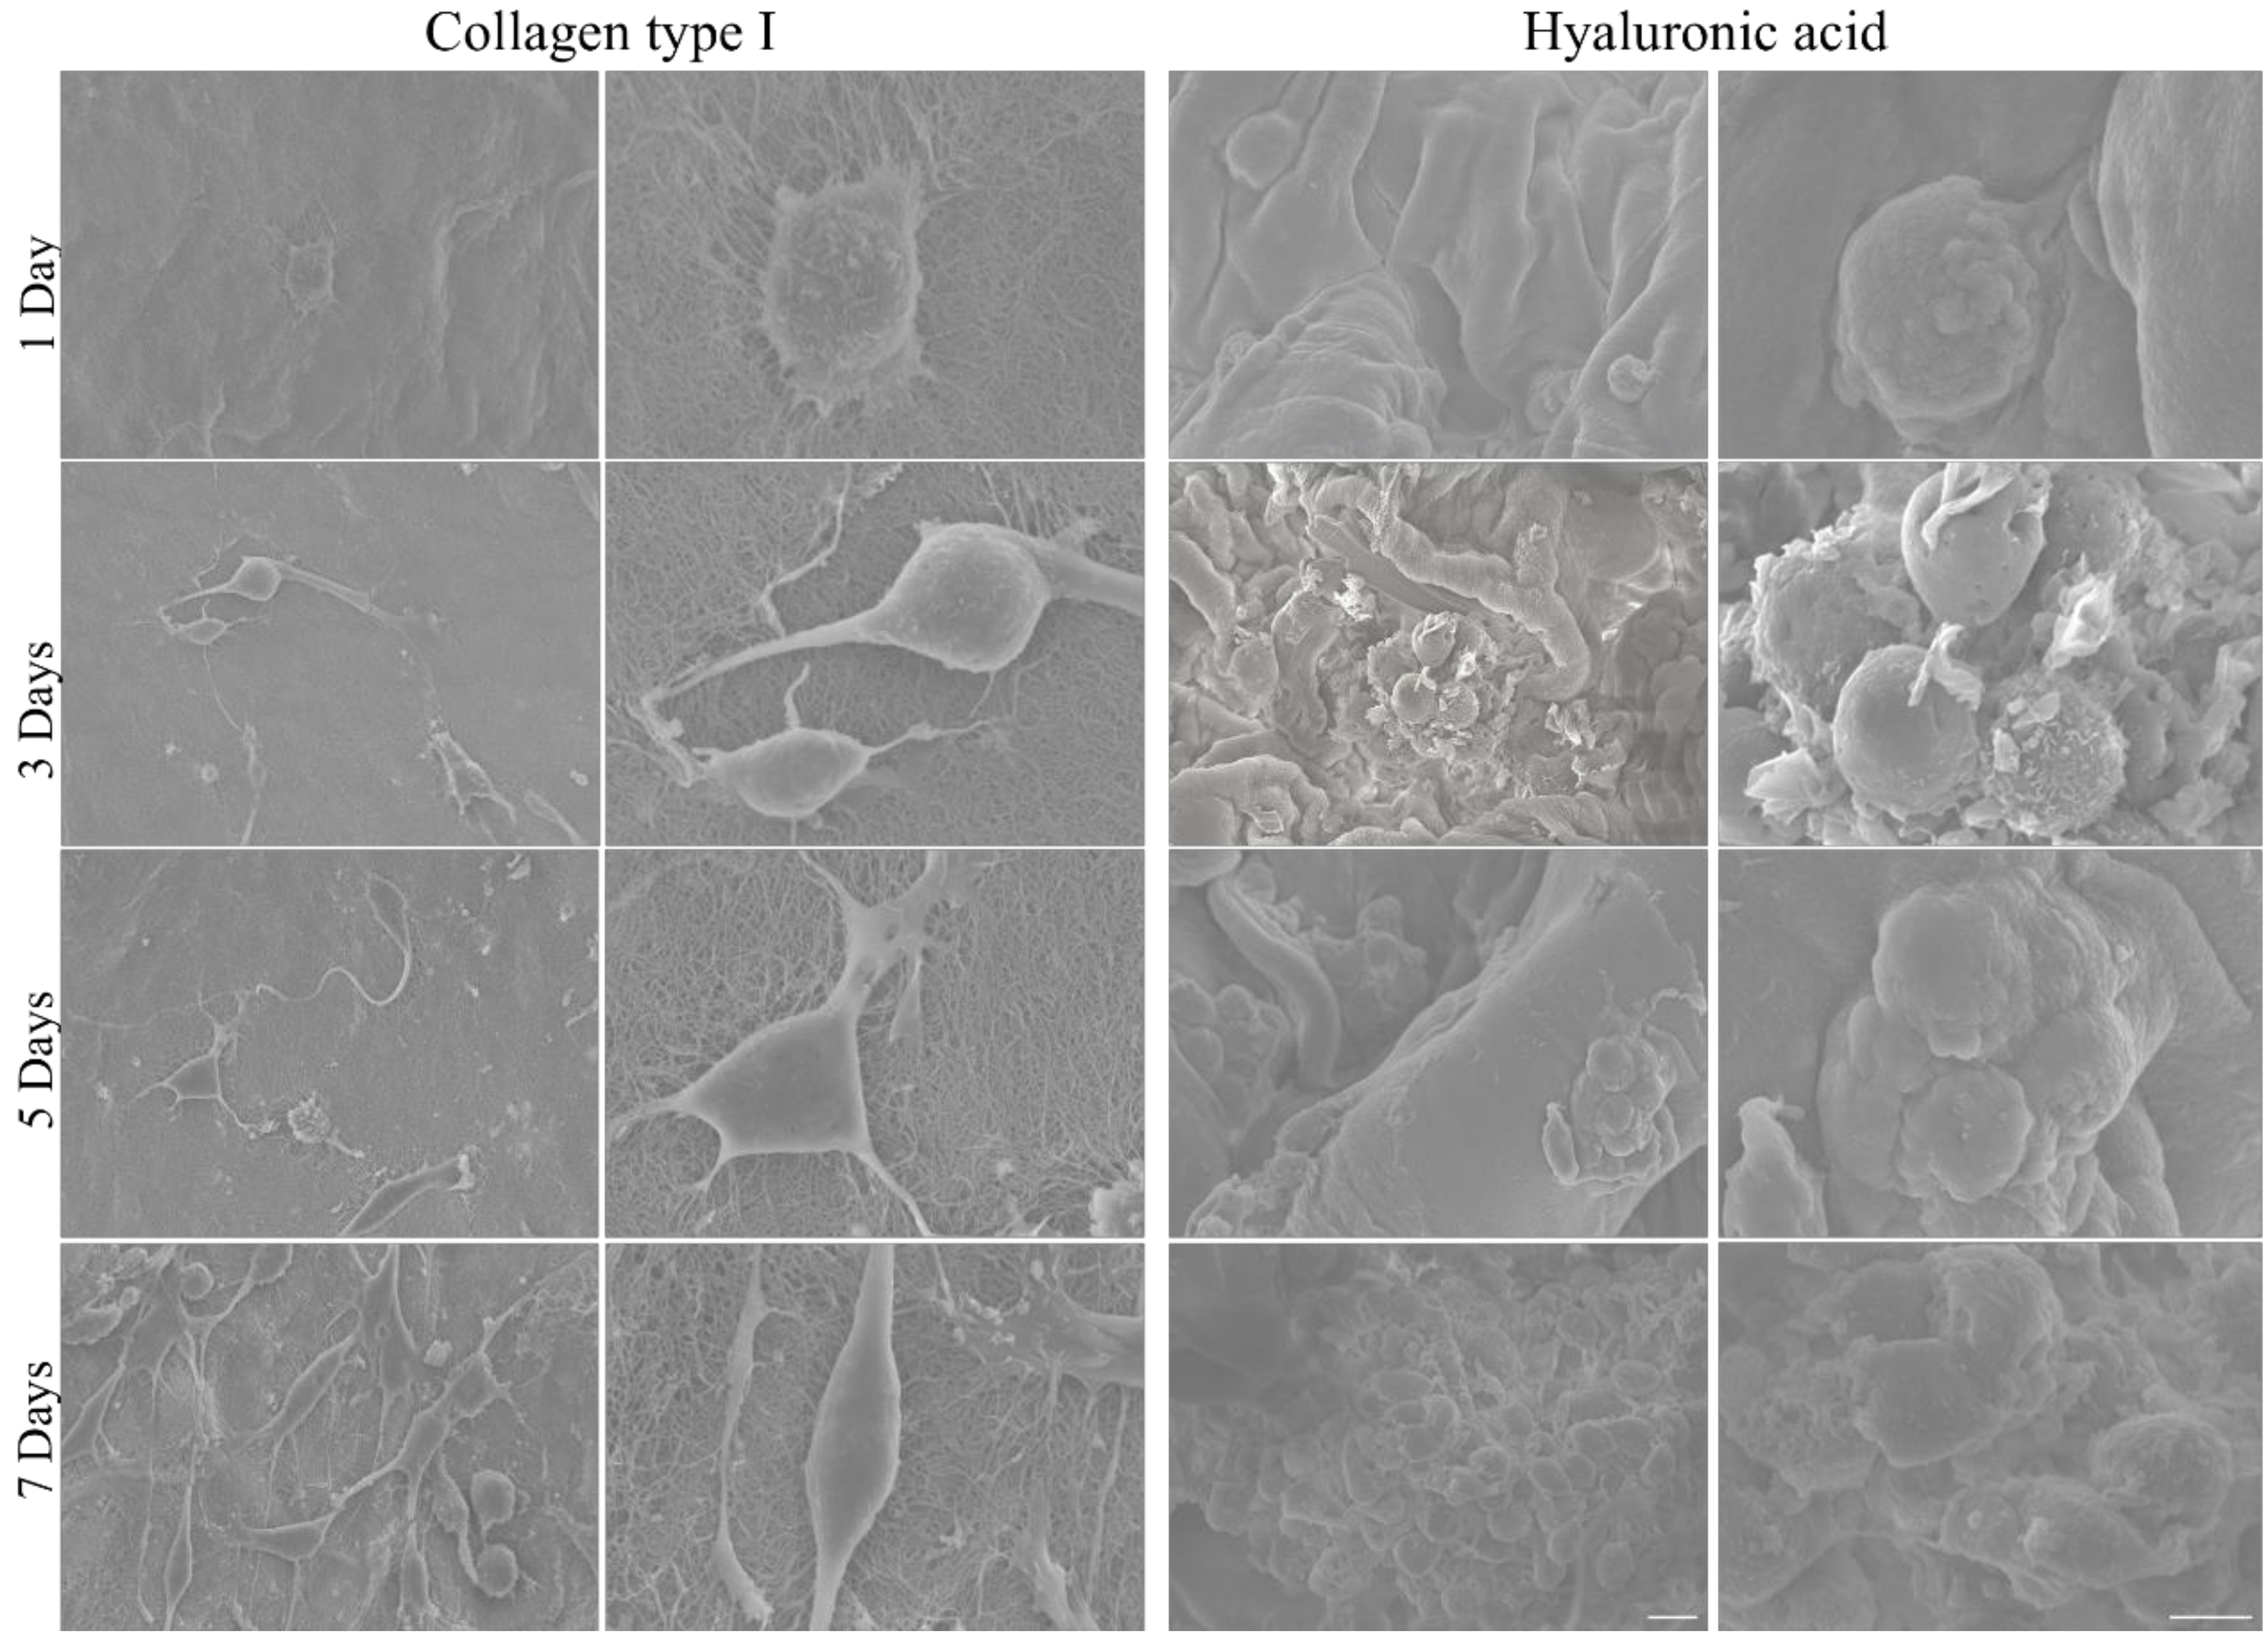
4.3. Cell Imaging
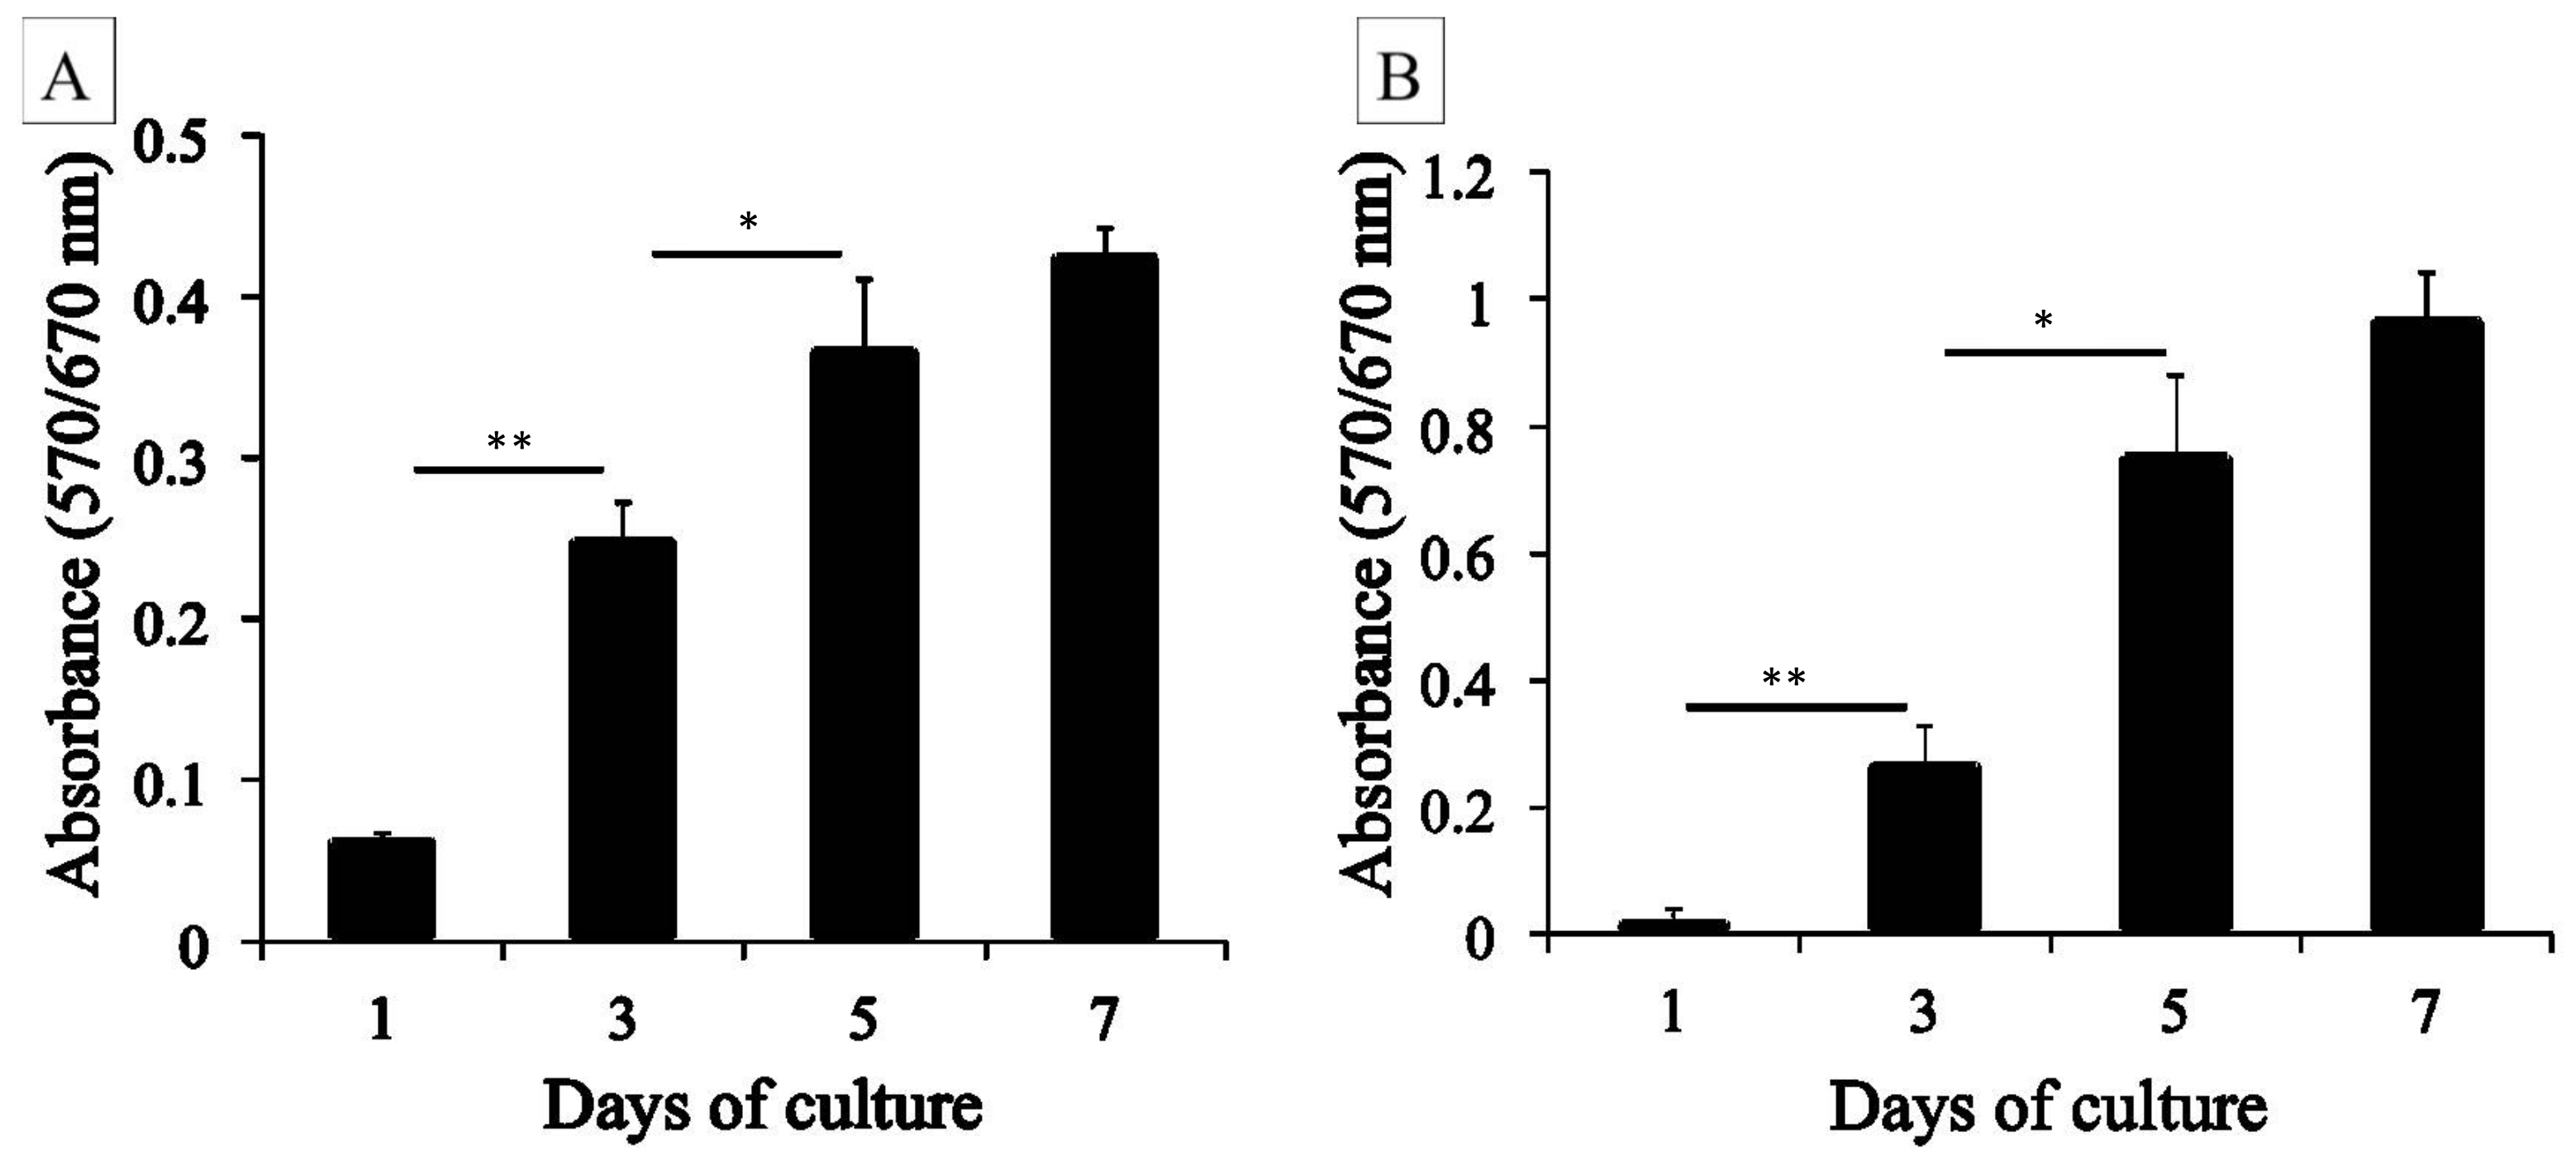
4.4. MTT Assay
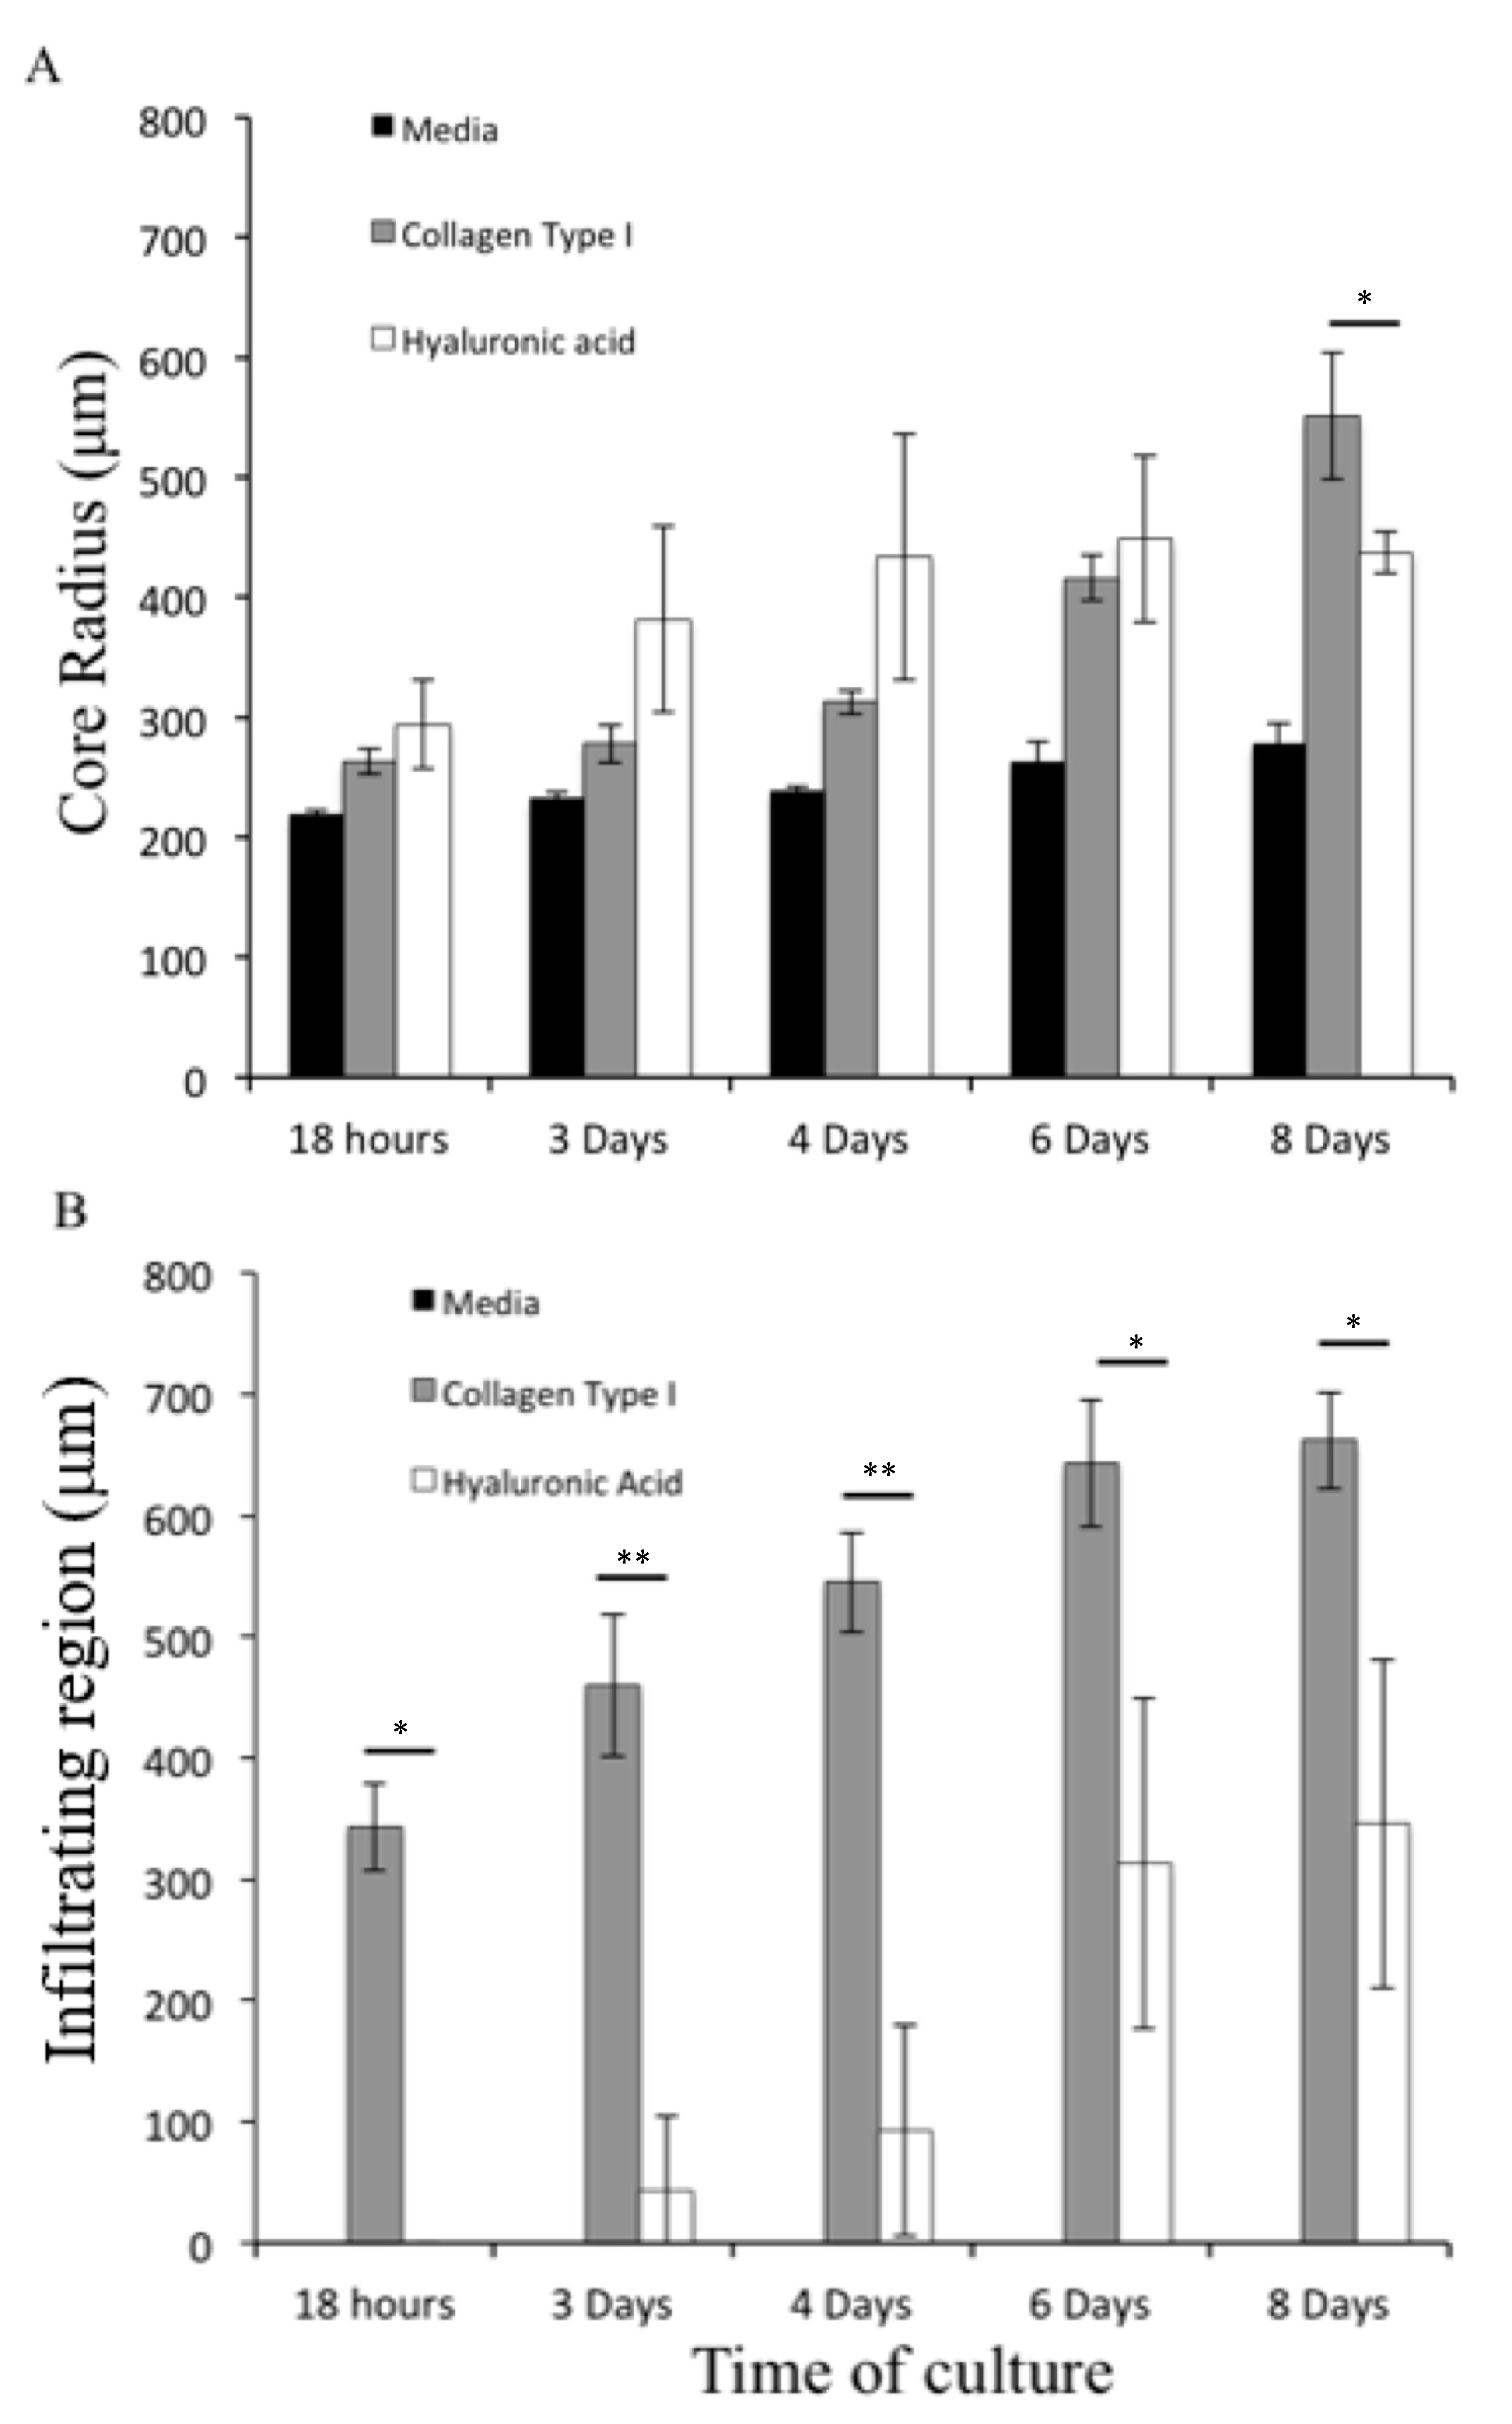
4.5. Growth of U87-MG Spheroids in Different Hydrogels
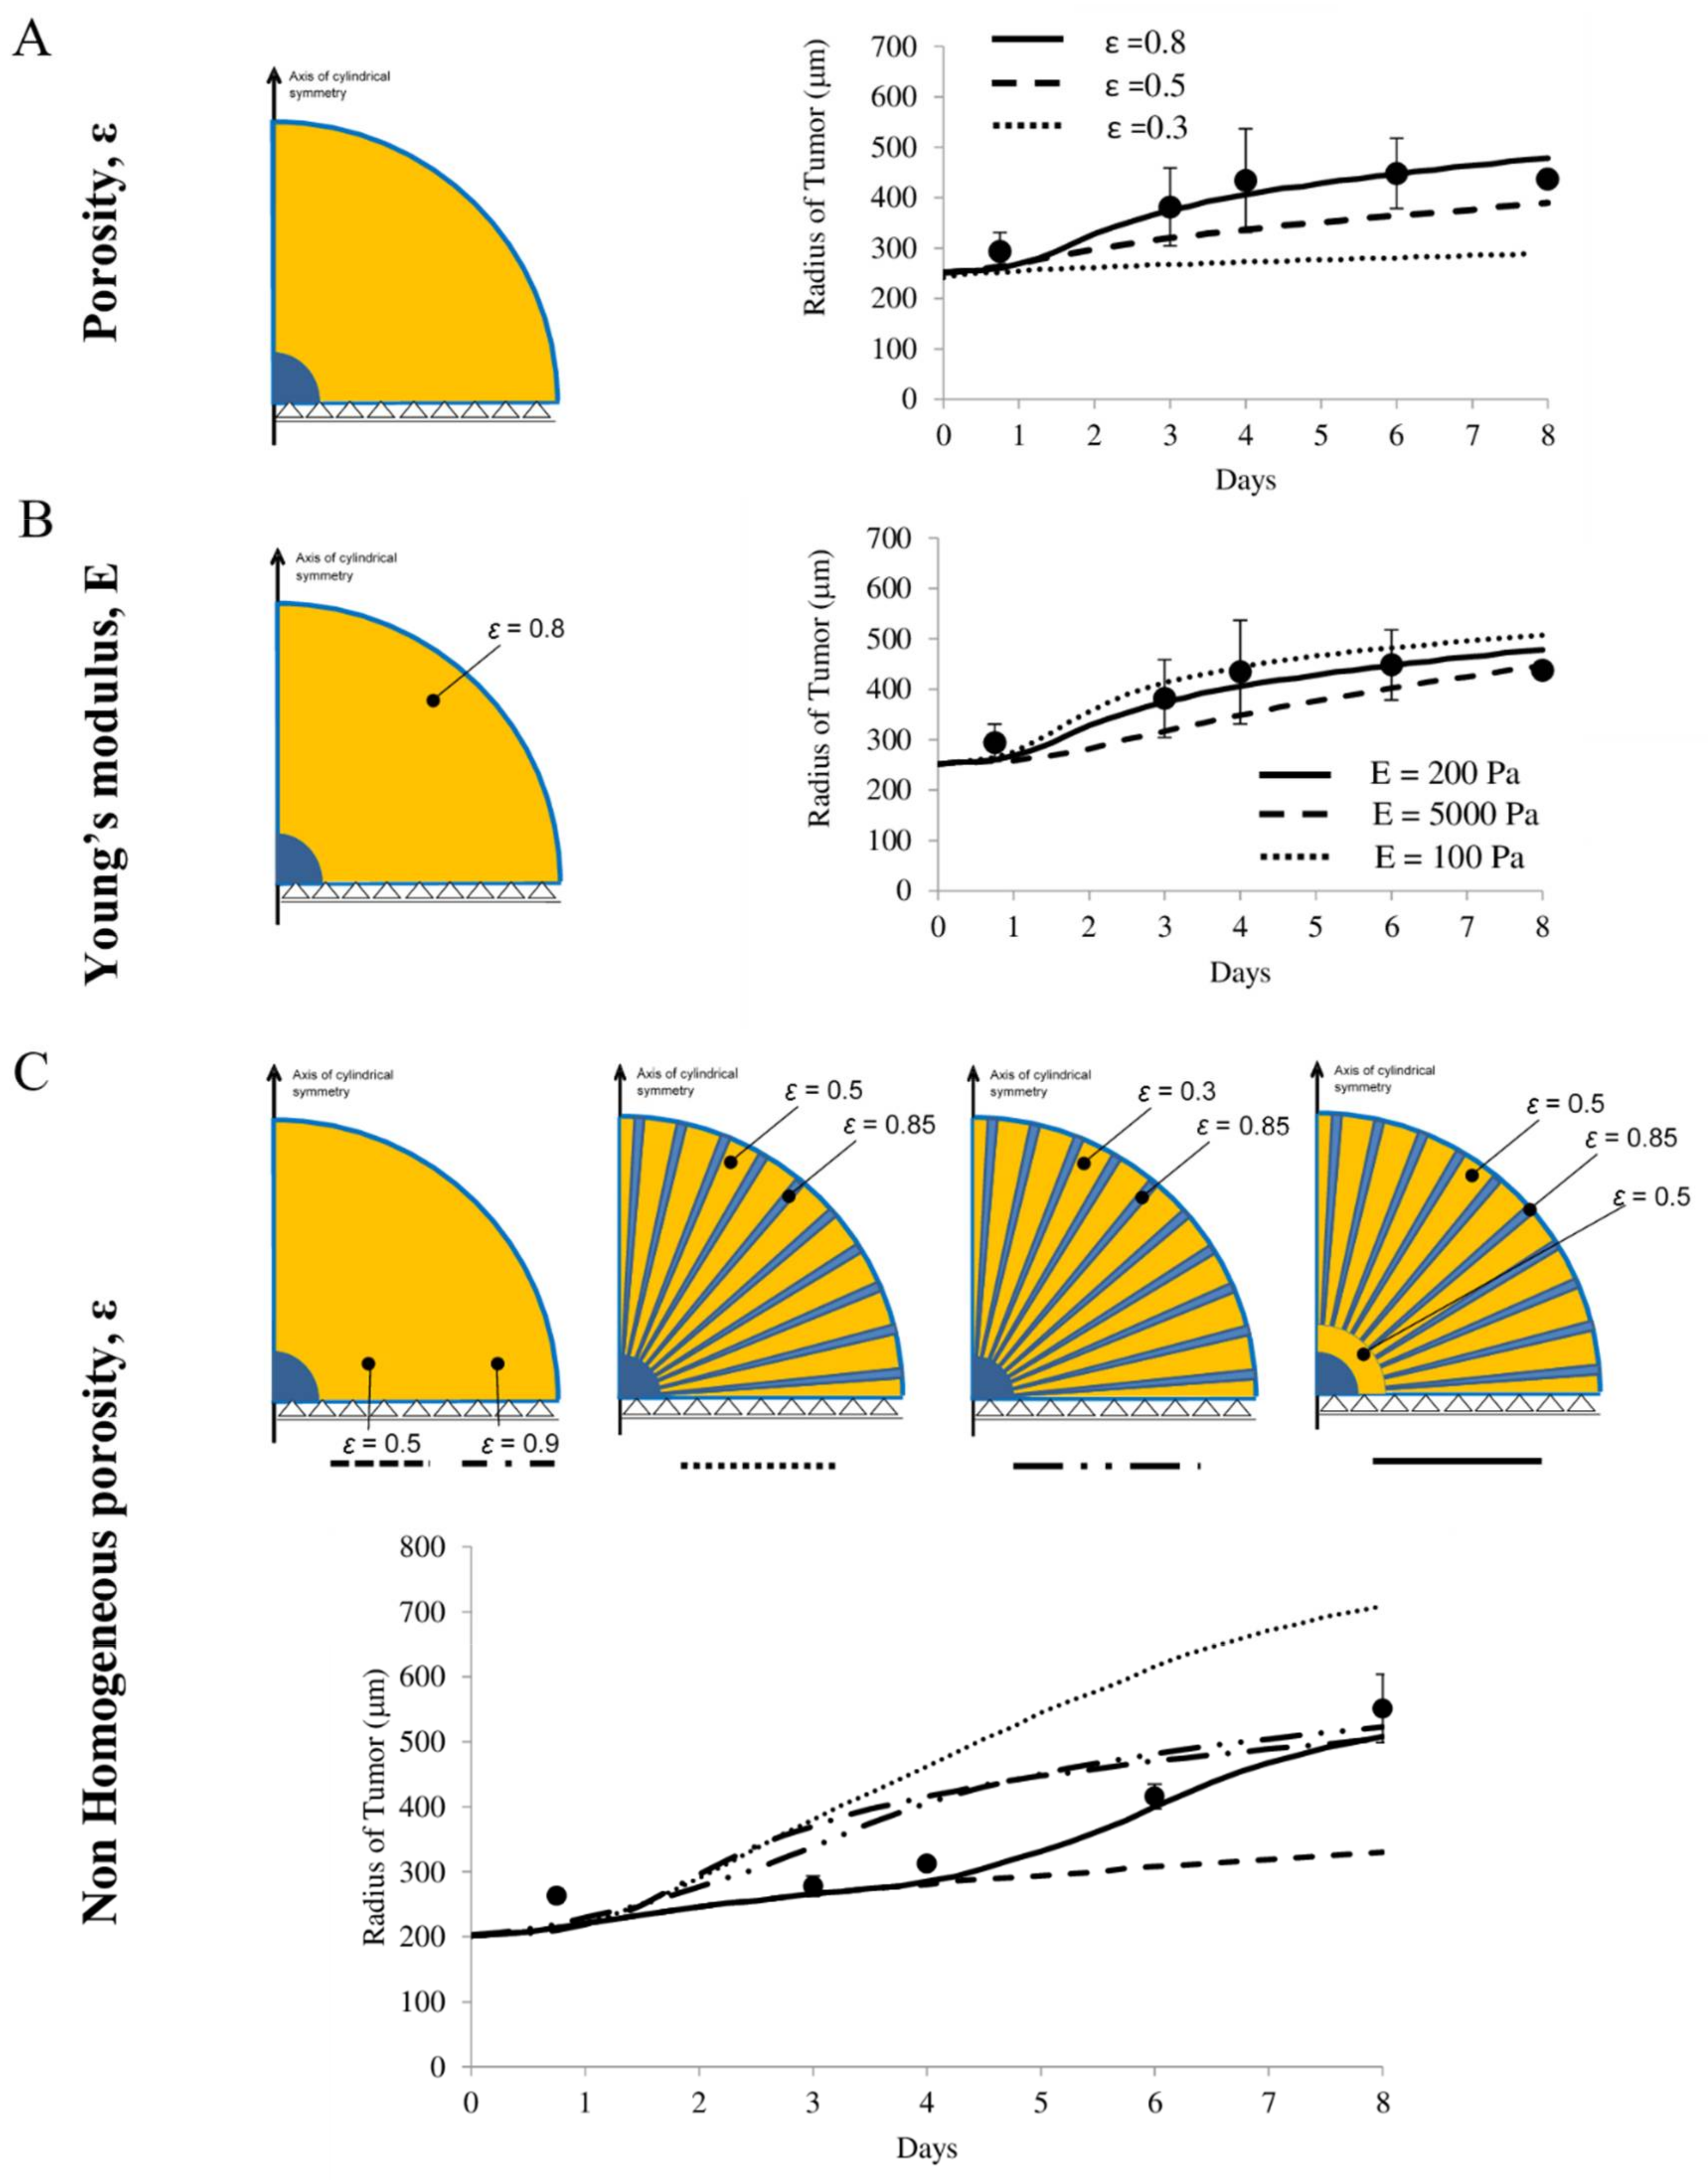
4.6. Predicting the Growth of U87-MG Spheroids in Different Scaffolds
5. Discussion
6. Conclusions
Supplementary Materials
Author Contributions
Funding
Acknowledgments
Conflicts of Interest
Appendix A. Numerical Solution and Computational Procedure
References
- Louis, D.N.; Perry, A.; Reifenberger, G.; Von Deimling, A.; Figarella-Branger, D.; Cavenee, W.K.; Ohgaki, H.; Wiestler, O.D.; Kleihues, P.; Ellison, D.W. The 2016 World Health Organization classification of tumors of the central nervous system: A summary. Acta Neuropathol. 2016, 131, 803–820. [Google Scholar] [CrossRef] [PubMed] [Green Version]
- Stupp, R.; Mason, W.P.; van den Bent, M.J.; Weller, M.; Fisher, B.; Taphoorn, M.J.B.; Belanger, K.; Brandes, A.A.; Marosi, C.; Bogdahn, U.; et al. Radiotherapy plus concomitant and adjuvant temozolomide for glioblastoma. N. Engl. J. Med. 2005, 352, 987–996. [Google Scholar] [CrossRef] [PubMed]
- Cuddapah, V.A.; Robel, S.; Watkins, S.; Sontheimer, H. A neurocentric perspective on glioma invasion. Nat. Rev. Neurosci. 2014, 15, 455–465. [Google Scholar] [CrossRef] [PubMed] [Green Version]
- Chen, H.-C. Boyden chamber assay. Cell Migr. 2005, 294, 15–22. [Google Scholar] [CrossRef]
- Pampaloni, F.; Reynaud, E.G.; Stelzer, E.H.K. The third dimension bridges the gap between cell culture and live tissue. Nat. Rev. Mol. Cell Biol. 2007, 8, 839–845. [Google Scholar] [CrossRef]
- Fraley, S.I.; Feng, Y.; Krishnamurthy, R.; Kim, D.-H.; Celedon, A.; Longmore, G.D.; Wirtz, D. A distinctive role for focal adhesion proteins in three-dimensional cell motility. Nat. Cell Biol. 2010, 12, 598–604. [Google Scholar] [CrossRef] [Green Version]
- Taddei, M.L.; Giannoni, E.; Comito, G.; Chiarugi, P. Microenvironment and tumor cell plasticity: An easy way out. Cancer Lett. 2013, 341, 80–96. [Google Scholar] [CrossRef]
- Venning, F.A.; Wullkopf, L.; Erler, J.T. Targeting ECM disrupts cancer progression. Front. Oncol. 2015, 5, 224. [Google Scholar] [CrossRef] [Green Version]
- Murphy, A.R.; Laslett, A.; O’Brien, C.M.; Cameron, N.R. Scaffolds for 3D in vitro culture of neural lineage cells. Acta Biomater. 2017, 54, 1–20. [Google Scholar] [CrossRef] [Green Version]
- Eccles, S.A.; Box, C.; Court, W. Cell migration/invasion assays and their application in cancer drug discovery. Biotechnol. Annu. Rev. 2005, 11, 391–421. [Google Scholar] [CrossRef]
- Valster, A.; Tran, N.L.; Nakada, M.; Berens, M.E.; Chan, A.Y.; Symons, M.H. Cell migration and invasion assays. Methods 2005, 37, 208–215. [Google Scholar] [CrossRef] [PubMed]
- Rahman, A.; Carey, S.P.; Kraning-Rush, C.M.; Goldblatt, Z.E.; Bordeleau, F.; Lampi, M.C.; Lin, D.Y.; Garcia, A.J.; Reinhart-King, C.A. Vinculin regulates directionality and cell polarity in 2D, 3D matrix and 3D microtrack migration. Mol. Biol. Cell. 2016, 27, 1431–1441. [Google Scholar] [CrossRef] [PubMed]
- Nikkhah, M.; Edalat, F.; Manoucheri, S.; Khademhosseini, A. Engineering microscale topographies to control the cell–substrate interface. Biomaterials 2012, 33, 5230–5246. [Google Scholar] [CrossRef] [PubMed] [Green Version]
- Rao, S.S.; DeJesus, J.; Short, A.R.; Otero, J.J.; Sarkar, A.; Winter, J.O. Glioblastoma behaviors in three-dimensional collagen-hyaluronan composite hydrogels. ACS Appl. Mater. Interfaces 2013, 5, 9276–9284. [Google Scholar] [CrossRef]
- Pedron, S.; Becka, E.; Harley, B.A. Regulation of glioma cell phenotype in 3D matrices by hyaluronic acid. Biomaterials 2013, 34, 7408–7417. [Google Scholar] [CrossRef]
- Wang, C.; Tong, X.; Yang, F. Bioengineered 3D brain tumor model to elucidate the effects of matrix stiffness on glioblastoma cell behavior using PEG-based hydrogels. Mol. Pharm. 2014, 11, 2115–2125. [Google Scholar] [CrossRef]
- Yang, Y.-L.; Motte, S.; Kaufman, L.J. Pore size variable type I collagen gels and their interaction with glioma cells. Biomaterials 2010, 31, 5678–5688. [Google Scholar] [CrossRef]
- Wang, C.; Tong, X.; Jiang, X.; Yang, F. Effect of matrix metalloproteinase-mediated matrix degradation on glioblastoma cell behavior in 3D PEG-based hydrogels. J. Biomed. Mater. Res. Part A 2017, 105, 770–778. [Google Scholar] [CrossRef] [Green Version]
- Florczyk, S.J.; Wang, K.; Jana, S.; Wood, D.L.; Sytsma, S.K.; Sham, J.G.; Kievit, F.M.; Zhang, M. Porous chitosan-hyaluronic acid scaffolds as a mimic of glioblastoma microenvironment ECM. Biomaterials 2013, 34, 10143–10150. [Google Scholar] [CrossRef] [Green Version]
- Koike, C.; McKee, T.D.; Pluen, A.; Ramanujan, S.; Burton, K.; Munn, L.L.; Boucher, Y.; Jain, R.K. Solid stress facilitates spheroid formation: Potential involvement of hyaluronan. Br. J. Cancer 2002, 86, 947–953. [Google Scholar] [CrossRef] [Green Version]
- Santagiuliana, R.; Pereira, R.C.; Schrefler, B.A.; Decuzzi, P. Predicting the role of microstructural and biomechanical cues in tumor growth and spreading. Int. J. Numer. Methods Biomed. Eng. 2017, 34, e2935. [Google Scholar] [CrossRef] [PubMed]
- Mascheroni, P.; Boso, D.; Preziosi, L.; Schrefler, B.A. Evaluating the influence of mechanical stress on anticancer treatments through a multiphase porous media model. J. Theor. Biol. 2017, 421, 179–188. [Google Scholar] [CrossRef] [PubMed] [Green Version]
- Mascheroni, P.; Stigliano, C.; Carfagna, M.; Boso, D.P.; Preziosi, L.; Decuzzi, P.; Schrefler, B.A. Predicting the growth of glioblastoma multiforme spheroids using a multiphase porous media model. Biomech. Model. Mechanobiol. 2016, 15, 1215–1228. [Google Scholar] [CrossRef] [PubMed]
- Hatzikirou, H.; Basanta, D.; Simon, M.; Schaller, K.; Deutsch, A. ‘Go or grow’: The key to the emergence of invasion in tumour progression? Math. Med. Biol. 2010, 29, 49–65. [Google Scholar] [CrossRef]
- Giese, A.; Loo, M.A.; Tran, D.; Haskett, S.W. Coons BME Dichotomy of astrocytoma migration and proliferation. Int. J. Cancer 1996, 67, 275–282. [Google Scholar] [CrossRef]
- Michor, F.; Liphardt, J.; Ferrari, M.; Widom, J. What does physics have to do with cancer? Nat. Rev. Cancer 2011, 11, 657–670. [Google Scholar] [CrossRef] [PubMed]
- Moore, N.M.; Kuhn, N.Z.; Hanlon, S.E.; Lee, J.S.; Nagahara, L.A. De-convoluting cancer’s complexity: Using a ‘physical sciences lens’ to provide a different (clearer) perspective of cancer. Phys. Biol. 2011, 8, 010302. [Google Scholar] [CrossRef]
- Manneschi, C.; Pereira, R.C.; Marinaro, G.; Bosca, A.; Francardi, M.; Decuzzi, P. A microfluidic platform with permeable walls for the analysis of vascular and extravascular mass transport. Microfluid. Nanofluidics 2016, 20. [Google Scholar] [CrossRef]
- Pereira, R.C.; Scaranari, M.; Castagnola, P.; Grandizio, M.; Azevedo, H.S.; Reis, R.L.; Cancedda, R.; Gentili, C. Novel injectable gel (system) as a vehicle for human articular chondrocytes in cartilage tissue regeneration. J. Tissue Eng. Regen. Med. 2009, 3, 97–106. [Google Scholar] [CrossRef] [Green Version]
- Sciumè, G.; Shelton, S.; Gray, W.G.; Miller, C.T.; Hussain, F.; Ferrari, M.; Decuzzi, P.; Schrefler, B.A. A multiphase model for three-dimensional tumor growth. N. J. Phys. 2013, 15, 015005. [Google Scholar] [CrossRef]
- Sciumè, G.; Santagiuliana, R.; Ferrari, M.; Decuzzi, P.; Schrefler, B.A. A tumor growth model with deformable ECM. Phys. Biol. 2014, 11, 065004. [Google Scholar] [CrossRef] [PubMed] [Green Version]
- Gray, W.G.; Miller, C.T. Introduction to the Thermodynamically Constrained Averaging Theory for Porous Medium Systems, 1st ed.; Springer International Publishing: Berlin/Heidelberg, Germany, 2014; ISBN 978-3-319-04010-3. [Google Scholar]
- Hawkins-Daarud, A.; Prudhomme, S.; Van Der Zee, K.G.; Oden, J.T. Bayesian calibration, validation, and uncertainty quantification of diffuse interface models of tumor growth. J. Math. Biol. 2012, 67, 1457–1485. [Google Scholar] [CrossRef] [PubMed]
- Rocha, H.L.; Almeida, R.C.; Lima, E.A.B.F.; Resende, A.C.M.; Oden, J.T.; Yankeelov, T.E. A hybrid three-scale model of tumor growth. Math. Model. Methods Appl. Sci. 2017, 28, 61–93. [Google Scholar] [CrossRef] [PubMed]
- Lima, E.; Oden, J.T.; Hormuth, D.A., 2nd; Yankeelov, T.E.; Almeida, R.C. Selection, calibration, and validation of models of tumor growth. Math Models Methods Appl. Sci. 2016, 26, 2341–2368. [Google Scholar] [CrossRef]
- Karageorgiou, V.; Kaplan, D.L. Porosity of 3D biomaterial scaffolds and osteogenesis. Biomaterials 2005, 26, 5474–5491. [Google Scholar] [CrossRef]
- Tang, L.; Van De Ven, A.L.; Guo, D.; Andasari, V.; Cristini, V.; Li, K.C.; Zhou, X. Computational modeling of 3D tumor growth and angiogenesis for chemotherapy evaluation. PLoS ONE 2014, 9, e83962. [Google Scholar] [CrossRef] [Green Version]
- Grinnell, F. Fibroblast biology in three-dimensional collagen matrices. Trends Cell Biol. 2003, 13, 264–269. [Google Scholar] [CrossRef]
- Christiansen, D.L.; Huang, E.K.; Silver, F.H. Assembly of type I collagen: Fusion of fibril subunits and the influence of fibril diameter on mechanical properties. Matrix Biol. 2000, 19, 409–420. [Google Scholar] [CrossRef]
- Giese, A.; Kuwe, L.; Laube, B.; Berens, M.E. Migration of human glioma cells on myelin. Neurosurgery 1996, 38, 755–764. [Google Scholar] [CrossRef]
- Toole, B.P. Hyaluronan: From extracellular glue to pericellular cue. Nat. Rev. Cancer 2004, 4, 528–539. [Google Scholar] [CrossRef]
- Ananthanarayanan, B.; Kim, Y.; Kumar, S. Elucidating the mechanobiology of malignant brain tumors using a brain matrix-mimetic hyaluronic acid hydrogel platform. Biomaterials 2011, 32, 7913–7923. [Google Scholar] [CrossRef] [PubMed] [Green Version]
- Soza, G.; Grosso, R.; Nimsky, C.; Hastreiter, P.; Fahlbusch, R.; Greiner, G. Determination of the elasticity parameters of brain tissue with combined simulation and registration. Int. J. Med. Robot 2005, 1, 87–95. [Google Scholar] [CrossRef] [PubMed]
- Chatelin, S.; Constantinesco, A.; Willinger, R. Fifty years of brain tissue mechanical testing: From in vitro to in vivo investigations. Biorheology 2010, 47, 255–276. [Google Scholar] [CrossRef] [PubMed]
- Cheng, S.; Clarke, E.C.; Bilston, L.E. Rheological properties of the tissues of the central nervous system: A review. Med. Eng. Phys. 2008, 30, 1318–1337. [Google Scholar] [CrossRef]
- Kaufman, L.J.; Brangwynne, C.P.; Kasza, K.E.; Filippidi, E.; Gordon, V.D.; Deisboeck, T.S.; Weitz, D.A. Glioma expansion in collagen I matrices: Analyzing collagen concentration-dependent growth and motility patterns. Biophys. J. 2005, 89, 635–650. [Google Scholar] [CrossRef] [Green Version]
- Ulrich, T.A.; Pardo, E.M.D.J.; Kumar, S. The mechanical rigidity of the extracellular matrix regulates the structure, motility, and proliferation of glioma cells. Cancer Res. 2009, 69, 4167–4174. [Google Scholar] [CrossRef] [Green Version]
- Polyak, K.; Weinberg, R.A. Transitions between epithelial and mesenchymal states: Acquisition of malignant and stem cell traits. Nat. Rev. Cancer 2009, 9, 265–273. [Google Scholar] [CrossRef]
- Guillamo, J.; Lisovoski, F.; Christov, C.; Le Guérinel, C.; Defer, G.; Peschanski, M.; Lefrançois, T. Migration pathways of human glioblastoma cells xenografted into the immunosuppressed rat brain. J. Neuro-Oncol. 2001, 52, 205–215. [Google Scholar] [CrossRef]
- Kallenberg, K.; Goldmann, T.; Menke, J.; Strik, H.; Bock, H.C.; Stockhammer, F.; Buhk, J.H.; Frahm, J.; Dechent, P.; Knauth, M. Glioma infiltration of the corpus callosum: Early signs detected by DTI. J. Neuro-Oncol. 2013, 112, 217–222. [Google Scholar] [CrossRef] [Green Version]
- Gritsenko, P.G.; Ilina, O.; Friedl, P. Interstitial guidance of cancer invasion. J. Pathol. 2012, 226, 185–199. [Google Scholar] [CrossRef]
- Marusyk, A.; Almendro, V.; Polyak, K. Intra-tumor heterogeneity: A looking glass for cancer? Nat. Rev. Cancer 2012, 12, 323–334. [Google Scholar] [CrossRef] [PubMed]
- Brock, A.; Chang, H.; Huang, S. Non-genetic heterogeneity—A mutation-independent driving force for the somatic evolution of tumors. Nat. Rev. Genet. 2009, 10, 336–342. [Google Scholar] [CrossRef] [PubMed]


| Parameter | Symbol | Value | Unit |
|---|---|---|---|
| Density of the fluid phases (α = t and l) | ρα | 1000 | kg/m3 |
| Dynamic viscosity of IF | μl | 1 × 10⁻² | Pa·s |
| Dynamic viscosity of TCs | 20 | Pa·s | |
| Adhesion of TCs | ψt | 0 | Pa/m |
| Critical mass fraction of oxygen | 1.0 × 10⁻⁶ | — | |
| Growth coefficient of tumor cells [31] | 2.0 × 10⁻² | kg/(m3·s) | |
| Necrosis coefficient [31] | 1.0 × 10⁻² | kg/(m3·s) | |
| Consumption related to growth [31] | 1 × 10⁻⁴ | kg/(m3·s) | |
| Consumption related to metabolism | 7 × 10⁻⁵ | kg/(m3·s) | |
| HCs-IF interfacial tension | σhl | 72 | mN/m |
| TCs-HCs interfacial tension | σth | 36 | mN/m |
| TCs-IF interfacial tension | σtl | 108 | mN/m |
| Lysis parameter | λ | 0.0 | — |
| Parameter | Symbol | Value | Unit |
|---|---|---|---|
| Diffusion coefficient of oxygen in interstitial fluid | 3.2 × 10⁻⁹ | m2/s | |
| Coefficient δ | δ | 2 | — |
| Normal mass fraction of oxygen in tissue | 4.2 × 10⁻⁶ | — |
| Parameter | Symbol | Value | Unit |
|---|---|---|---|
| Density of the solid phase | ρs | 1 × 10³ | kg/m3 |
| Poisson’s ratio of the ECM | ν | 0.4 | — |
| Yield effective stress limit | 5 × 101 | Pa | |
| Viscosity | 5 | Pa·s | |
| Hardening modulus | H | 1.0 × 10² | Pa |
Publisher’s Note: MDPI stays neutral with regard to jurisdictional claims in published maps and institutional affiliations. |
© 2020 by the authors. Licensee MDPI, Basel, Switzerland. This article is an open access article distributed under the terms and conditions of the Creative Commons Attribution (CC BY) license (http://creativecommons.org/licenses/by/4.0/).
Share and Cite
Pereira, R.C.; Santagiuliana, R.; Ceseracciu, L.; Boso, D.P.; Schrefler, B.A.; Decuzzi, P. Elucidating the Role of Matrix Porosity and Rigidity in Glioblastoma Type IV Progression. Appl. Sci. 2020, 10, 9076. https://doi.org/10.3390/app10249076
Pereira RC, Santagiuliana R, Ceseracciu L, Boso DP, Schrefler BA, Decuzzi P. Elucidating the Role of Matrix Porosity and Rigidity in Glioblastoma Type IV Progression. Applied Sciences. 2020; 10(24):9076. https://doi.org/10.3390/app10249076
Chicago/Turabian StylePereira, Rui C., Raffaella Santagiuliana, Luca Ceseracciu, Daniela P. Boso, Bernhard A. Schrefler, and Paolo Decuzzi. 2020. "Elucidating the Role of Matrix Porosity and Rigidity in Glioblastoma Type IV Progression" Applied Sciences 10, no. 24: 9076. https://doi.org/10.3390/app10249076