Article

Spatial–Temporal Variation Characteristics of Multiple Meteorological Variables and Vegetation over the Loess Plateau Region

1
College of Geomatics, Xi’an University of Science and Technology, Xi’an 710054, China
2
Department of Geography, University of Kentucky, Lexington, KY 40506, USA
*
Author to whom correspondence should be addressed.
Appl. Sci. 2020, 10(3), 1000; https://doi.org/10.3390/app10031000
Submission received: 29 December 2019 / Revised: 29 January 2020 / Accepted: 29 January 2020 / Published: 3 February 2020

Abstract

:
Ecological restoration and climate change in the Loess Plateau region have become research hotspots. Climate change and anthropogenic activities have led to spatial–temporal pattern variations in vegetation and extreme climatic indices and meteorological factors. Therefore, obtaining a better understanding is necessary of the internal relations between vegetation and meteorological factors. In this paper, the interplay between vegetation index and various factors, including extreme climatic indices and meteorological factors, during a long-term time series is investigated using Mann–Kendall trend analysis, and Pearson correlation coefficient analysis. The mechanisms of interaction between vegetation growth and various factors in the Loess Plateau are then analyzed. Results reveal that (i) the rapid growth of vegetation during 2000–2015 has made a major contribution to the growth trend of the Loess Plateau in the past 33 years (1982–2015). During 2000–2015, the increase of vegetation may inhibit the increase of extreme warm index and the decrease of extreme cold index; (ii) a warm and dry climate developed with decreasing relative humidity and increasing temperature; (iii) the normalized vegetation index (NDVI) is strongly correlated with extreme climatic indices and meteorological factors, especially precipitable water vapor (PWV), with a correlation coefficient of 0.94; and (iv) the daily temperature range, diurnal temperature range and sunshine duration (SSD) exerted different time-delay effects on vegetation growth in the Loess Plateau. The above findings provide an essential theoretical basis for ecological policy formulation in the Loess Plateau.

1. Introduction

The fifth assessment of the Intergovernmental Panel on Climate Change (IPCC) reported that the global average surface temperature increased by 0.78 °C over the past 10 years (2003–2012). Anthropogenic activities are the main cause of global warming [1]. Climate change has also been closely linked to extreme weather events, such as extremely high or low temperatures, heavy precipitation, hurricanes, and persistent droughts [2]. In recent years, these extreme events have occurred with increasing frequencies, ranges, and intensities and thus exert a profound impact on the ecological environment and social production of various countries.
The continued increase in the frequency and intensity of extreme temperatures and precipitation events have become a research focus. For example, the summer heat wave in 2003 caused severe drought in the European continent [3]. Omondi et al. [4] found that the number of cold nights decreased in the African triangle region from 1961 to 2010. Pepler et al. [5] revealed severe flooding after heavy rains in the eastern coast of Australia during the summer of 2012. Yilmaz et al. [6] predicted that the intensity of precipitation would increase by 23% relative to the current condition from 2080 to 2099. Extreme disastrous events, such as extreme precipitation, high temperature and floods, are mainly caused by changes in the global climate [7,8,9]. Such conditions have caused severe damages to the global ecosystem and are a threat to human survival.
The Normalized Difference Vegetation Index (NDVI) can accurately reflect surface vegetation coverage. It can be monitored using satellite-derived NDVI to track the impact of global climate change on the ecological environment [10,11]. Zhou and Zhang [12] found that different climate conditions correspond to different distributions of vegetation types. Some studies have also investigated the relationship between extreme weather and vegetation using NDVI. For example, Rao et al. [9] and Gornall et al. [13] found that the frequent occurrence of extreme events exerts a negative effect on vegetation growth and leads to a decrease in vegetation coverage over the coastal areas of China. Bokhorst et al. [14] revealed that frequent extreme temperature events during winter seriously affect vegetation growth over the arctic subregion. The impact of extreme rainfall on vegetation coverage over the Qinghai–Tibet Plateau is less severe than the influence of average rainfall [15]. Over central Asia, the annual maximum and minimum air temperatures significantly increased between 1958 and 2012, and increased winter temperatures contributed the most to the annual warming, thereby increasing the growing season length (GSL) and productivity [16]. However, only a few extreme climate factors are considered during the analysis of their correlations with the NDVI [17] and the relationships between NDVI and extreme climatic indices are rarely discussed. Therefore, carefully investigating the mechanisms of extreme weather events in response to climate change is necessary. However, whether a time lag effect on vegetation growth caused by meteorological factors (temperature, rainfall, etc.) exists remains unclear. In addition, the influence of time delay on vegetation growth caused by extreme climatic indices is not considered when analyzing the correlations between NDVI and these meteorological factors [17].
The Loess Plateau, which is located in Northwestern China, is a typical ecologically vulnerable region. [18]. Only a few studies have addressed the relationship between extreme weather and vegetation conditions. Sun et al. [19] studied the interannual change trends of extreme climatic factors in the Loess Plateau. Zhao et al. [17] analyzed the variation of 12 extreme climatic indices and NDVI in the Loess Plateau and found that extreme rainfall and temperature occurrences are significantly correlated with different vegetation cover types. Most previous studies use the average NDVI of the entire Loess Plateau to reflect the overall change [4,6,17,20], discounting spatial variations within the region, or temporal variation over time. Moreover, climate change is not only a simple vegetation state change caused by temperature change. As an important component of the lower atmosphere, precipitable water vapor (PWV) changes dramatically with variations in temperature. PWV is among the conditions necessary for precipitation weather evolution and an important indicator influencing the occurrence of extreme weather [21,22,23,24]. Several studies have shown that the true rate of nowcasting precipitation forecasting with PWV can reach 85% [24], which reveals the strong correlation between precipitation and PWV. According to the Clausius–Clapeyron equation, a high temperature corresponds to a strong atmospheric storage capacity [25], which reveals the close relationship between temperature and atmospheric water vapor. Manandhar et al. [26] also proved that the relative humidity (RHU) and SSD are two primary factors influencing precipitation.
In this work, we investigated the potential relationship of vegetation growth with extreme weather events and meteorological parameters (PWV, T, RHU, and SSD). Variations in the relationship at different periods were considered to better understand the time-varying characteristics of the multiple meteorological factors and extreme climatic indices and vegetation over Loess Plateau. In addition, we evaluated the time-lag effect of extreme weather changes and meteorological factors on vegetation growth in detail. We aim to further understand the extreme weather change impact on the ecological environment in the Loess Plateau.

2. Experiment Description

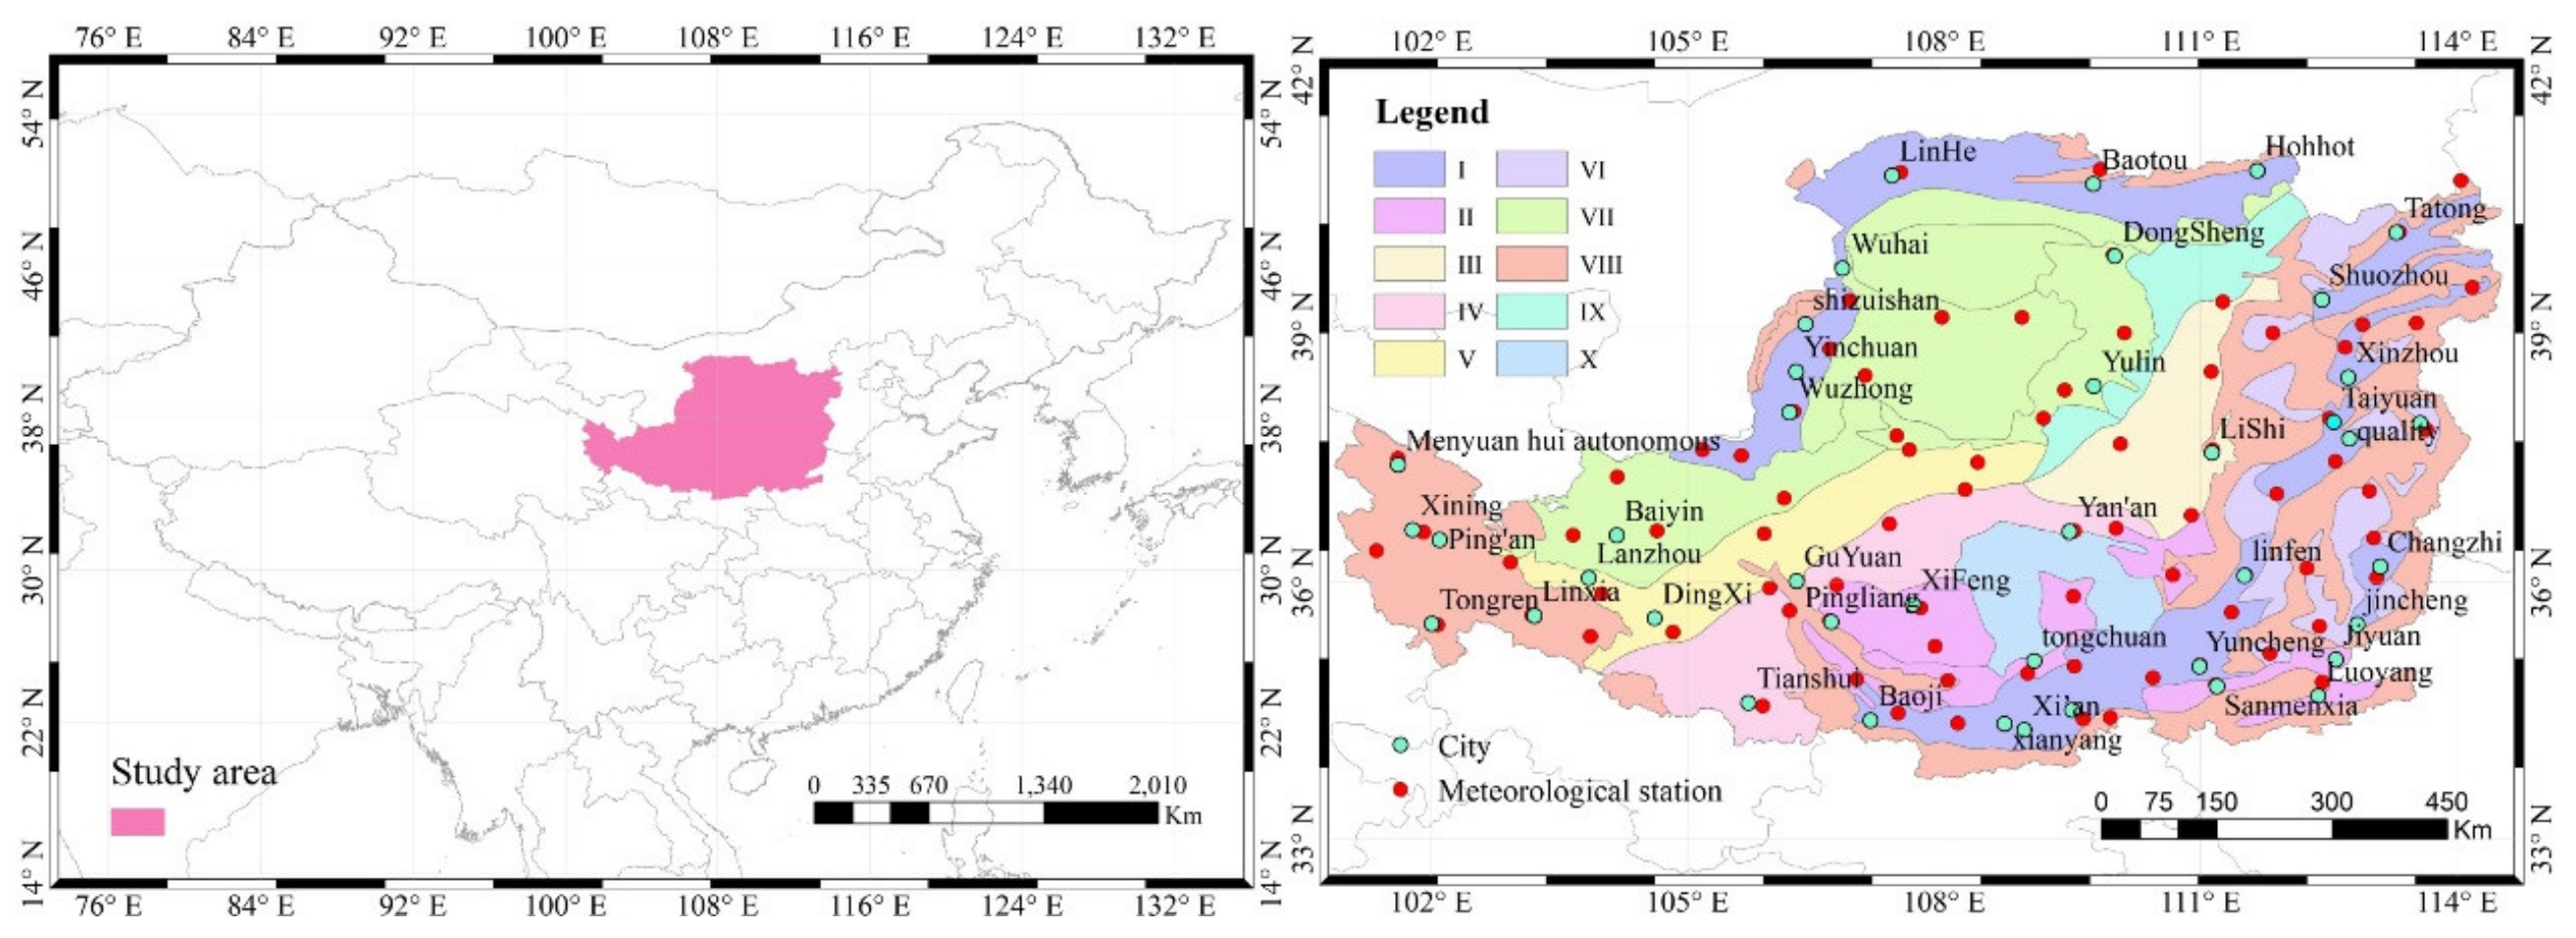
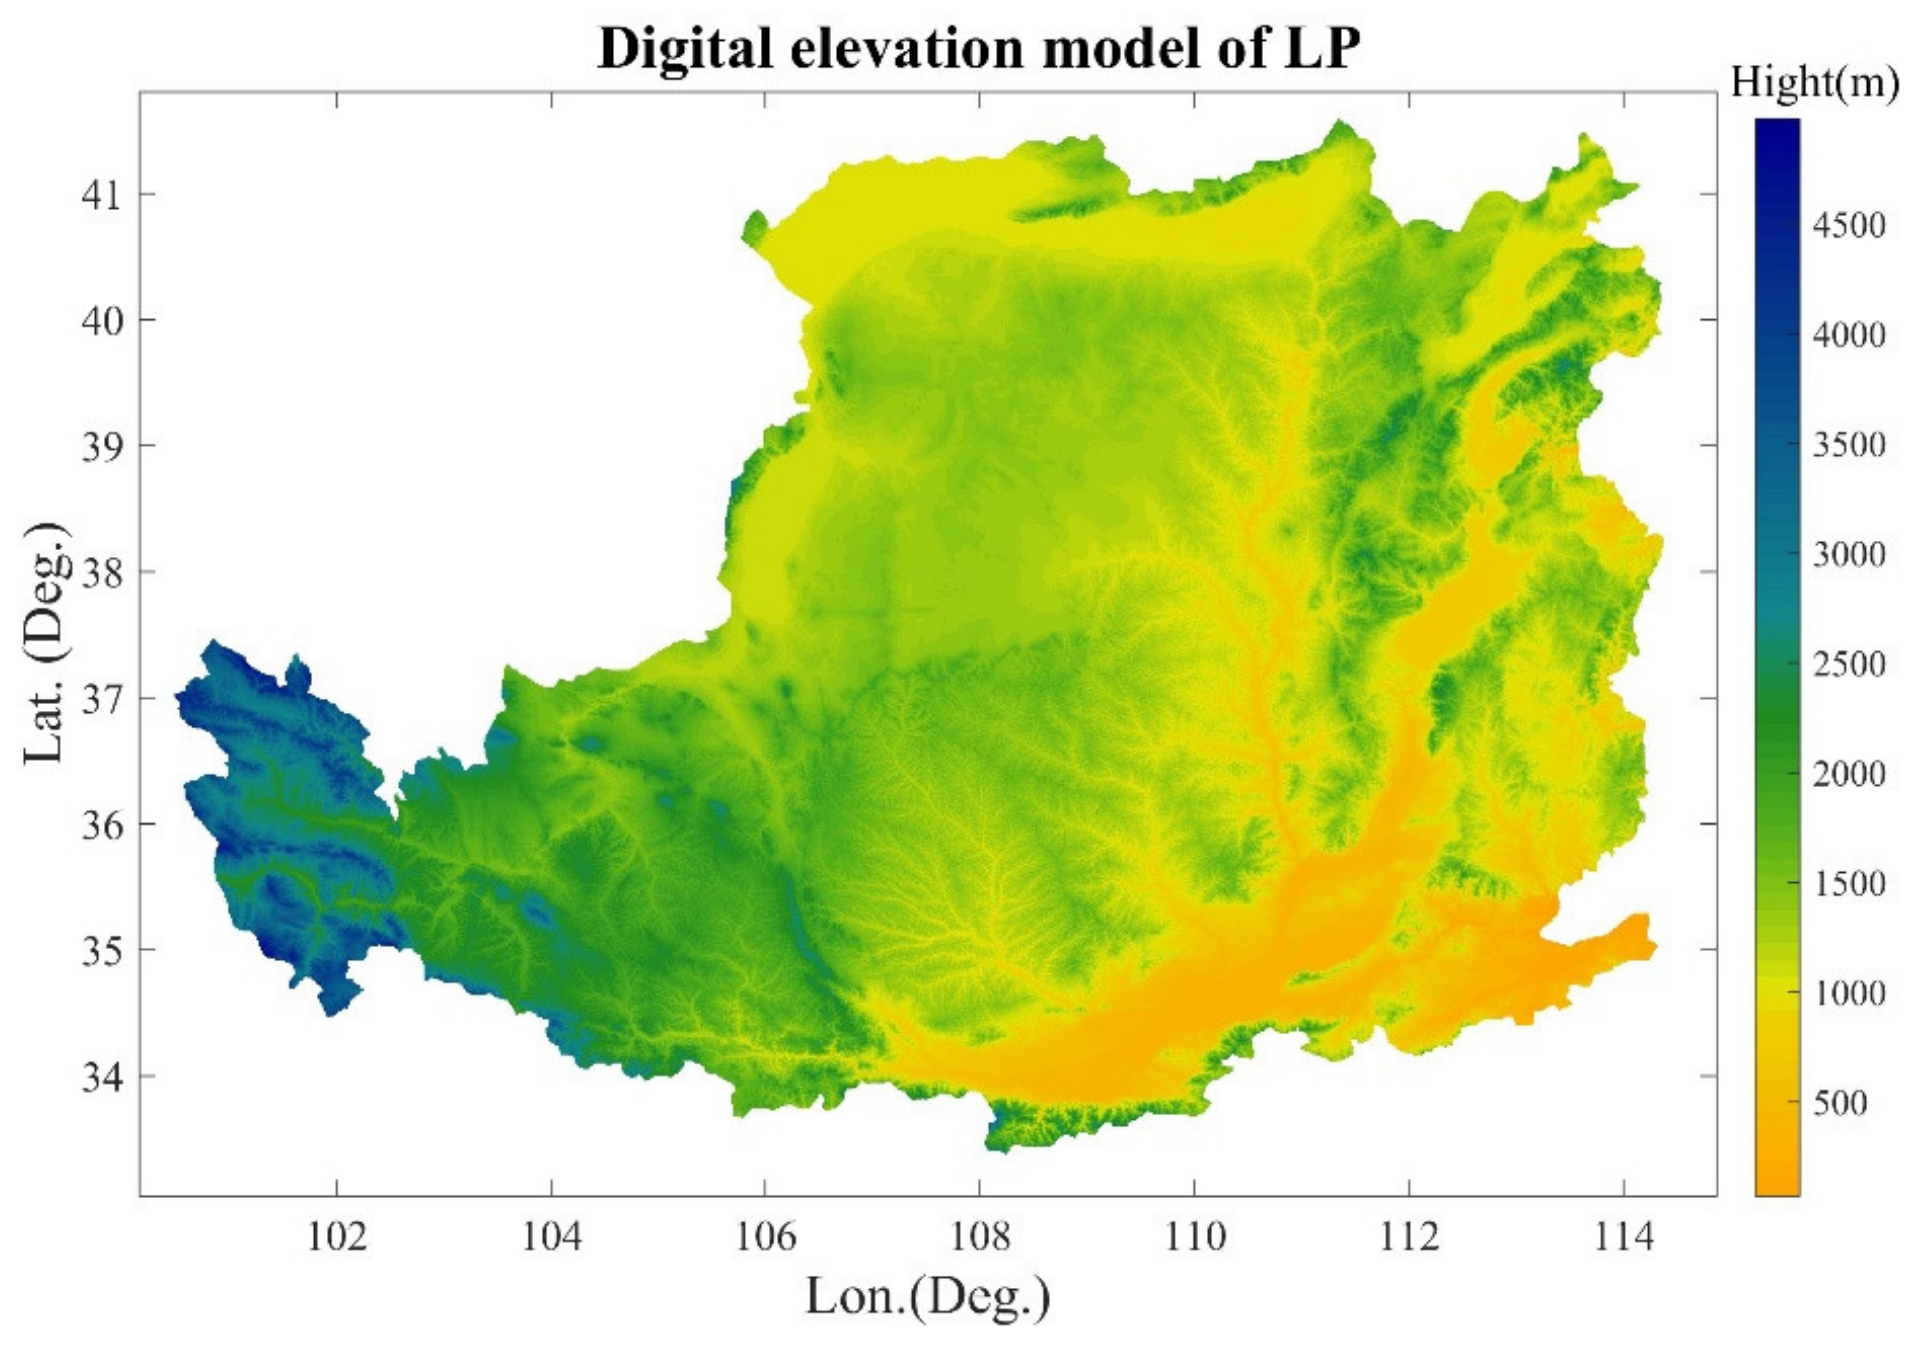
2.1. Study Area and Data Used

The Loess Plateau extends from 33° 41′ N to 41° 16′ N in latitude and from 100° 52′ E to 114° 33′ E in longitude. Given its low vegetation coverage, the ecology of Loess Plateau is very fragile, and the soil erosion is severe [27]. The Loess Plateau features a temperate continental monsoon climate, wherein rainfall is concentrated in July–September. In this paper, the Loess Plateau is divided into 10 subregions (Figure 1) based on differences in soil type and topography (Table 1). This geographical zoning map of the Loess Plateau was acquired from the Loess Plateau Scientific Data Center (http://loess.data.ac.cn). Considering that areas IX and X do not include the selected meteorological stations (right panel of Figure 1), only the eight remaining areas are discussed in this paper.
Extreme climatic indices can be calculated using the Climate Dex package developed by R Language (RClimDex) model, which was developed by the Climate Research Department, Meteorology Office, Canada, and can be downloaded from http://etccdi.pacificclimate.org/software.shtml. The RClimDex model is driven by daily precipitation and minimum and maximum temperatures, producing 27 indices that can be used to measure extreme weather conditions. A total of 16 extreme temperatures and 11 extreme precipitation indices are available (see Table 2). The input meteorological parameters of 83 stations were obtained from the China Meteorological Administration (http://data.cma.cn/). PWV can be derived through many techniques, such as sounding measurement, very long baseline interferometry, microwave radiation, global navigation satellite system, and reanalysis data [28]. In this study, we used PWV data from the European Centre for Medium-Range Weather Forecasts (ECMWF) reanalysis (https://www.ecmwf.int/). This product assimilates multi-source data, such as radiosonde data, satellite radiation data, and satellite altimetry data [29]. The temporal and spatial resolutions of the PWV product used were four times a day and 0.125° × 0.125°, respectively. The PWV values of the meteorological stations were interpolated using the values of the four surrounding grid points derived from ECMWF data.
A long-term NDVI time series for the study region was obtained from the Global Inventory Modeling and Mapping Studies (GIMMS). We downloaded the 15-day composite NDVI3g dataset with a spatial resolution of 8 km over the 35 years of 1981–2015 (https://ecocast.arc.nasa.gov/data/pub/gimms/3g.v1). This dataset has been processed such that radiation and geometric correction were applied to the World Geodetic System 1984(WGS84) coordinate system [30]. The maximum value composite method was adopted to obtain the monthly NDVI time series over Loess Plateau. Then, meteorological parameters could be obtained through interpolation, including PWV, temperature, RHU, and SSD, at the location of the weather stations.

2.2. Methodology

To better understand changes in extreme weather and vegetation growth in the Loess Plateau from 1982 to 2015 (period S), we divided the long-time series into two segments using the year 2000 as the cut-off point. This year was selected because China’s national policy of “returning farmland to the forest” began in 2000 in the Loess Plateau. Therefore, two sub-periods of 1982–1999 (S1) and 2001–2015 (S2) were separately considered to ensure that specific change patterns in vegetation growth under extreme weather and human intervention in these corresponding periods would not be overridden by long-term trends.
To understand the change trends of the NDVI during the experimental period, the average value, linear trend, and F-test of the NDVI were calculated over the three selected periods. Here, the annual change rate in NDVI was calculated; a positive value was considered to represent an increasing trend of vegetation, whereas a negative value represents a decreasing trend. Three levels of significance were evaluated for the F-test, i.e.; P = 0.1, P = 0.05, and P = 0.01. In addition, the percentages of pixels with decreasing and increasing trends for different significance levels were counted.
To analyze the spatiotemporal distribution of PWV, RHU, and SSD in the Loess Plateau over the experimental period, several processes were performed. The 5-year sliding averages of PWV, RHU, and SSD were introduced to directly reflect the change trends of the corresponding time series, and the spatial distribution of the average PWV, RHU, and SSD was calculated over the period of 1982–2015.
To better understand changes in extreme climate indices in the Loess Plateau, the first derivatives of 7 extreme precipitation indices and 13 extreme temperature indices were calculated over the three periods of S, S1, and S2. In addition, the year in which an abrupt change in trend occurred was also calculated using the Mann–Kendall trend and abrupt analysis method. The Mann–Kendall test is a nonparametric method that does not require a certain distribution and is minimally affected by outliers [31].
The Pearson correlation coefficient was introduced to calculate correlations between NDVI and the meteorological factors (i.e.; PWV, RHU, and SSD) observed through the weather stations. The formula of calculating Pearson correlation coefficient is give as follows:
r = i = 1 n ( X i X ¯ ) ( Y i Y ¯ ) i = 1 n ( X i X ¯ ) 2 i = 1 n ( Y i Y ¯ ) 2
where r is the correlation coefficient, and r > 0 is a positive correlation, r < 0 is a negative correlation, the greater the absolute value of r, the stronger the correlation. X and Y are variables, n is the number of samples, X ¯ and Y ¯ are the average values of X and Y , respectively. Considering that the relationship between precipitation and NDVI has been widely investigated, we do not discuss precipitation in this paper. A comprehensive analysis between extreme climatic indices and NDVI was performed to explain the response of vegetation growth to climate change. The F-test was also performed to determine the significance level of vegetation change in the different subregions of the Loess Plateau during the three specified periods.
To better understand the time delay impacts of extreme climatic indices on vegetation growth, the monthly time series of the factors TXn, TNn, TXx, TNx, mean of max temperature (TMAXmean) mean of min temperature (TMINmean), RX1day, RX5day, and diurnal temperature range (DTR) were calculated using the RClimDex model. Their Pearson correlation coefficients were also analyzed along with the corresponding NDVIs for the current month and after 1–3 months during the growing season (April–October) in the Loess Plateau. In this paper, the correlation degree was defined based on previous studies on the relationship between climatic indices and ecological factors [32,33,34]. Table 3 shows the level of correlation.

3. Results

3.1. Vegetation Distribution over the Loess Plateau

The distributions of the average values, linear trends, and F-test results of NDVI over the three selected periods are presented in Figure 2. Figure 2a,c shows that the vegetation coverage generally decreases from southeast to northwest with a relatively low NDVI of 0–0.4 in the northwestern region. The overall vegetation coverage rate improved during S compared with that during S2, which suggests that the major contributor to the vegetation growth in S is the vegetation growth of S1 (Figure 2d,f). The statistical results reveal that the average trends over Loess Plateau during S, S1, and S2 were 0.022/10a, 0.013/10a, and 0.059/10a, respectively. After 2000, the growth rate of vegetation over Loess Plateau was 4.5 times that before 2000, In addition, [35] shows that the vegetation change rate of the whole China during 1982-2012 is 0.002/10a, and the vegetation growth rate of Loess Plateau during S and S2 is 11 and 29.5 times than that of the whole China. From the spatial distribution of NDVI, vegetation decreased in the southern and northern portions of Loess Plateau, especially in area I. Figure 2g–i shows the F-test distributions vegetation change in the three periods of S, S1, and S2 in the Loess Plateau; Table 4 provides the statistical results of the F-test showing decreasing and increasing trends for different significance levels. Approximately 56.76% of the pixels revealed an increasing trend during S2, while 72.23% of the pixels showed an increasing trend during S (P < 0.01).
According to the spatial distribution of vegetation in the Loess Plateau (Figure 1), in the north and south (area I), the vegetation decreased significantly. The main reason is that there are cities of Zhong, Yinchuan, Shizuishan, Wuhai, Linhai, Baotou, Hohhot and others in the north of area I. These cities have sufficient sunshine, strong evaporation, short summer, and late spring, and are prone to extreme days such as cold waves and sandstorms. In recent years, with the acceleration of urbanization, the area of construction land has increased, and the change of land use has led to the obvious degradation of vegetation in this area in the past 30 years. For the south of zone I, there are 12 cities, such as Shuozhou, Linfen and Yuncheng. The open-pit coal mining in these areas all year-round has caused serious damage to the surface vegetation in this area and is not easy to repair. These reasons directly lead to the significant degradation of vegetation in zone I of the Loess Plateau.

3.2. Analysis of Meteorological Factors

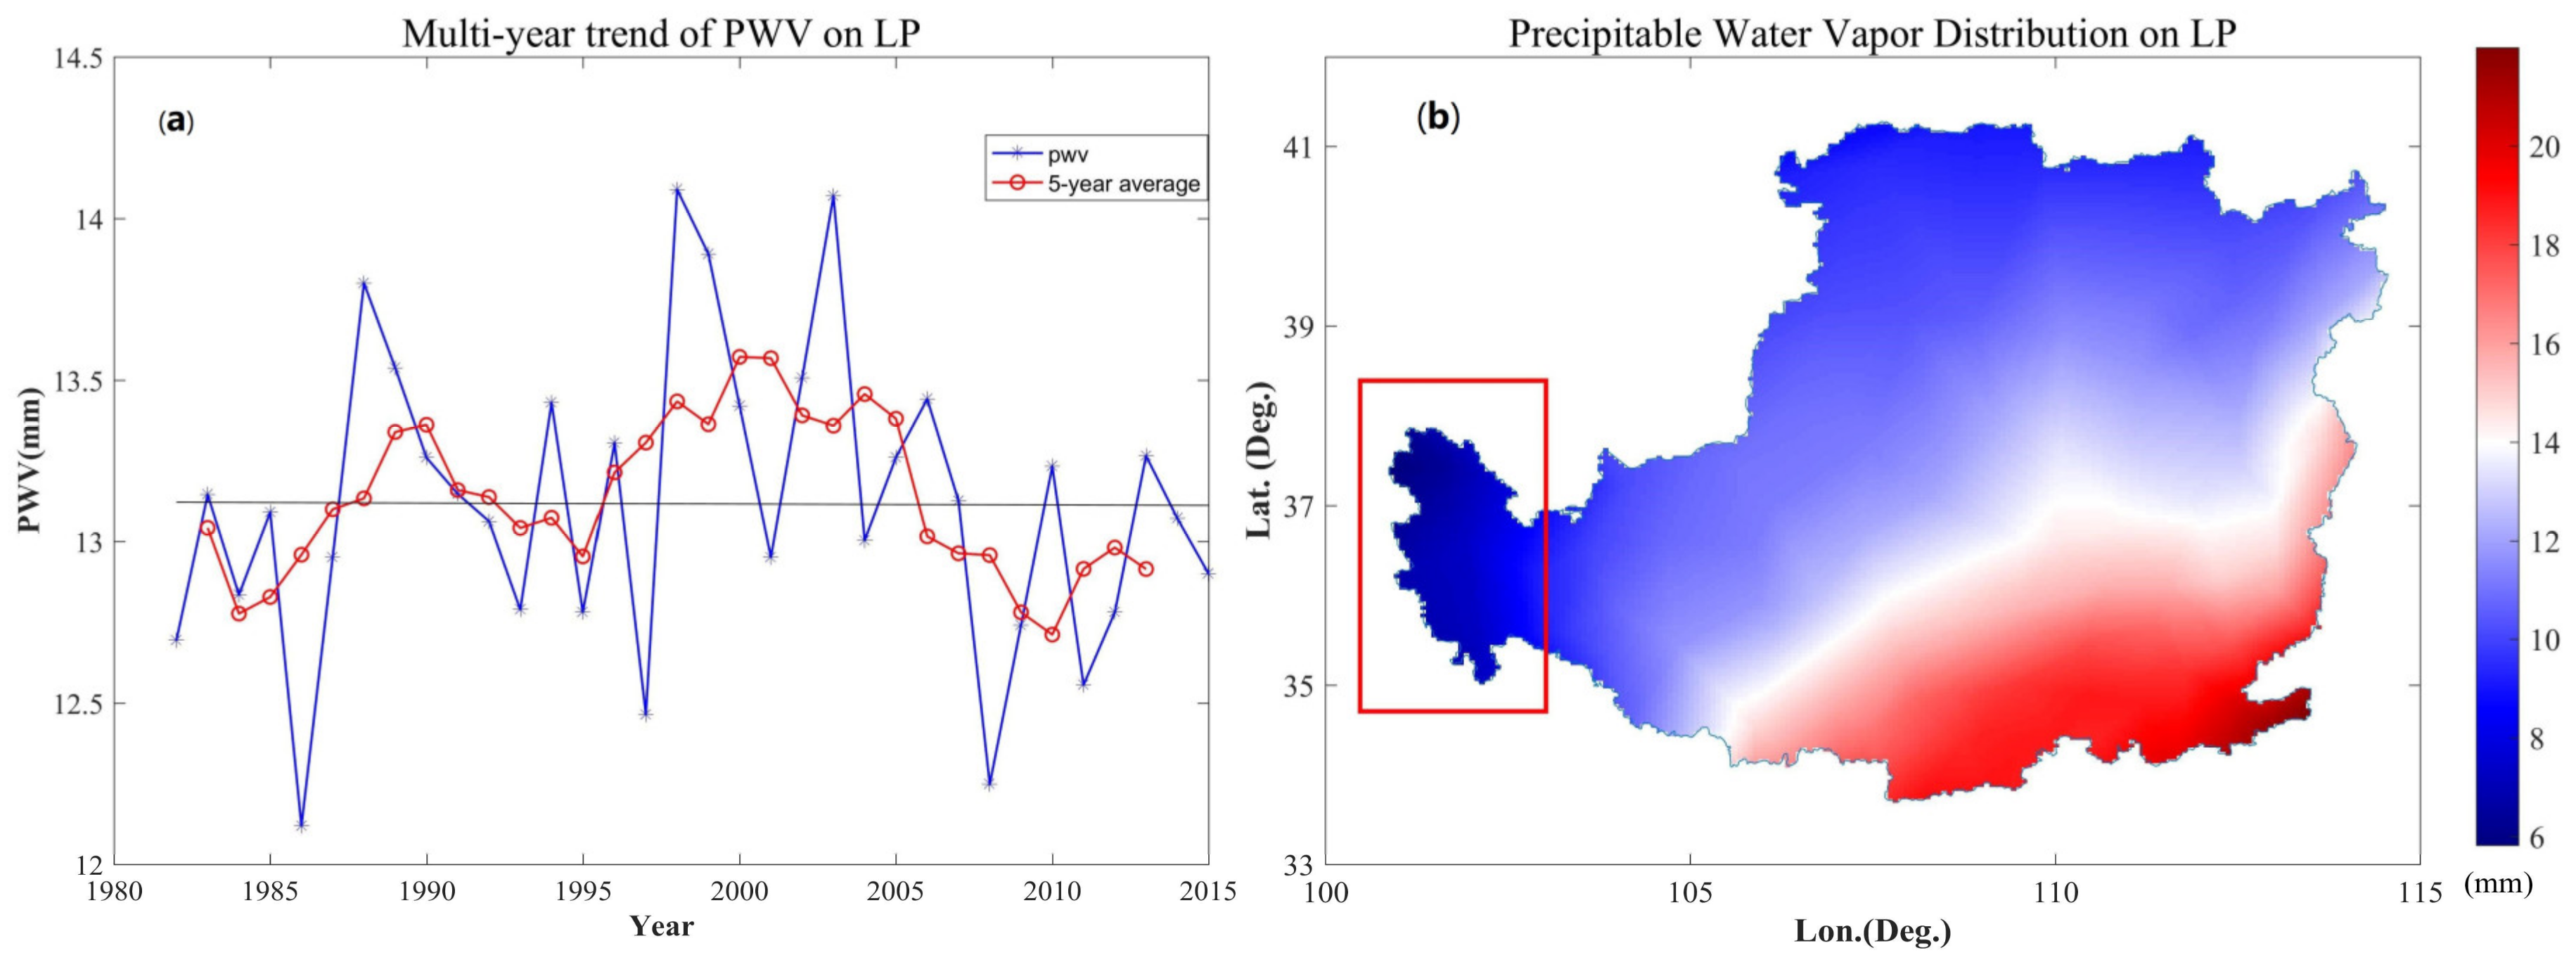
3.2.1. Spatial Distribution of Precipitable Water Vapour over the Loess Plateau
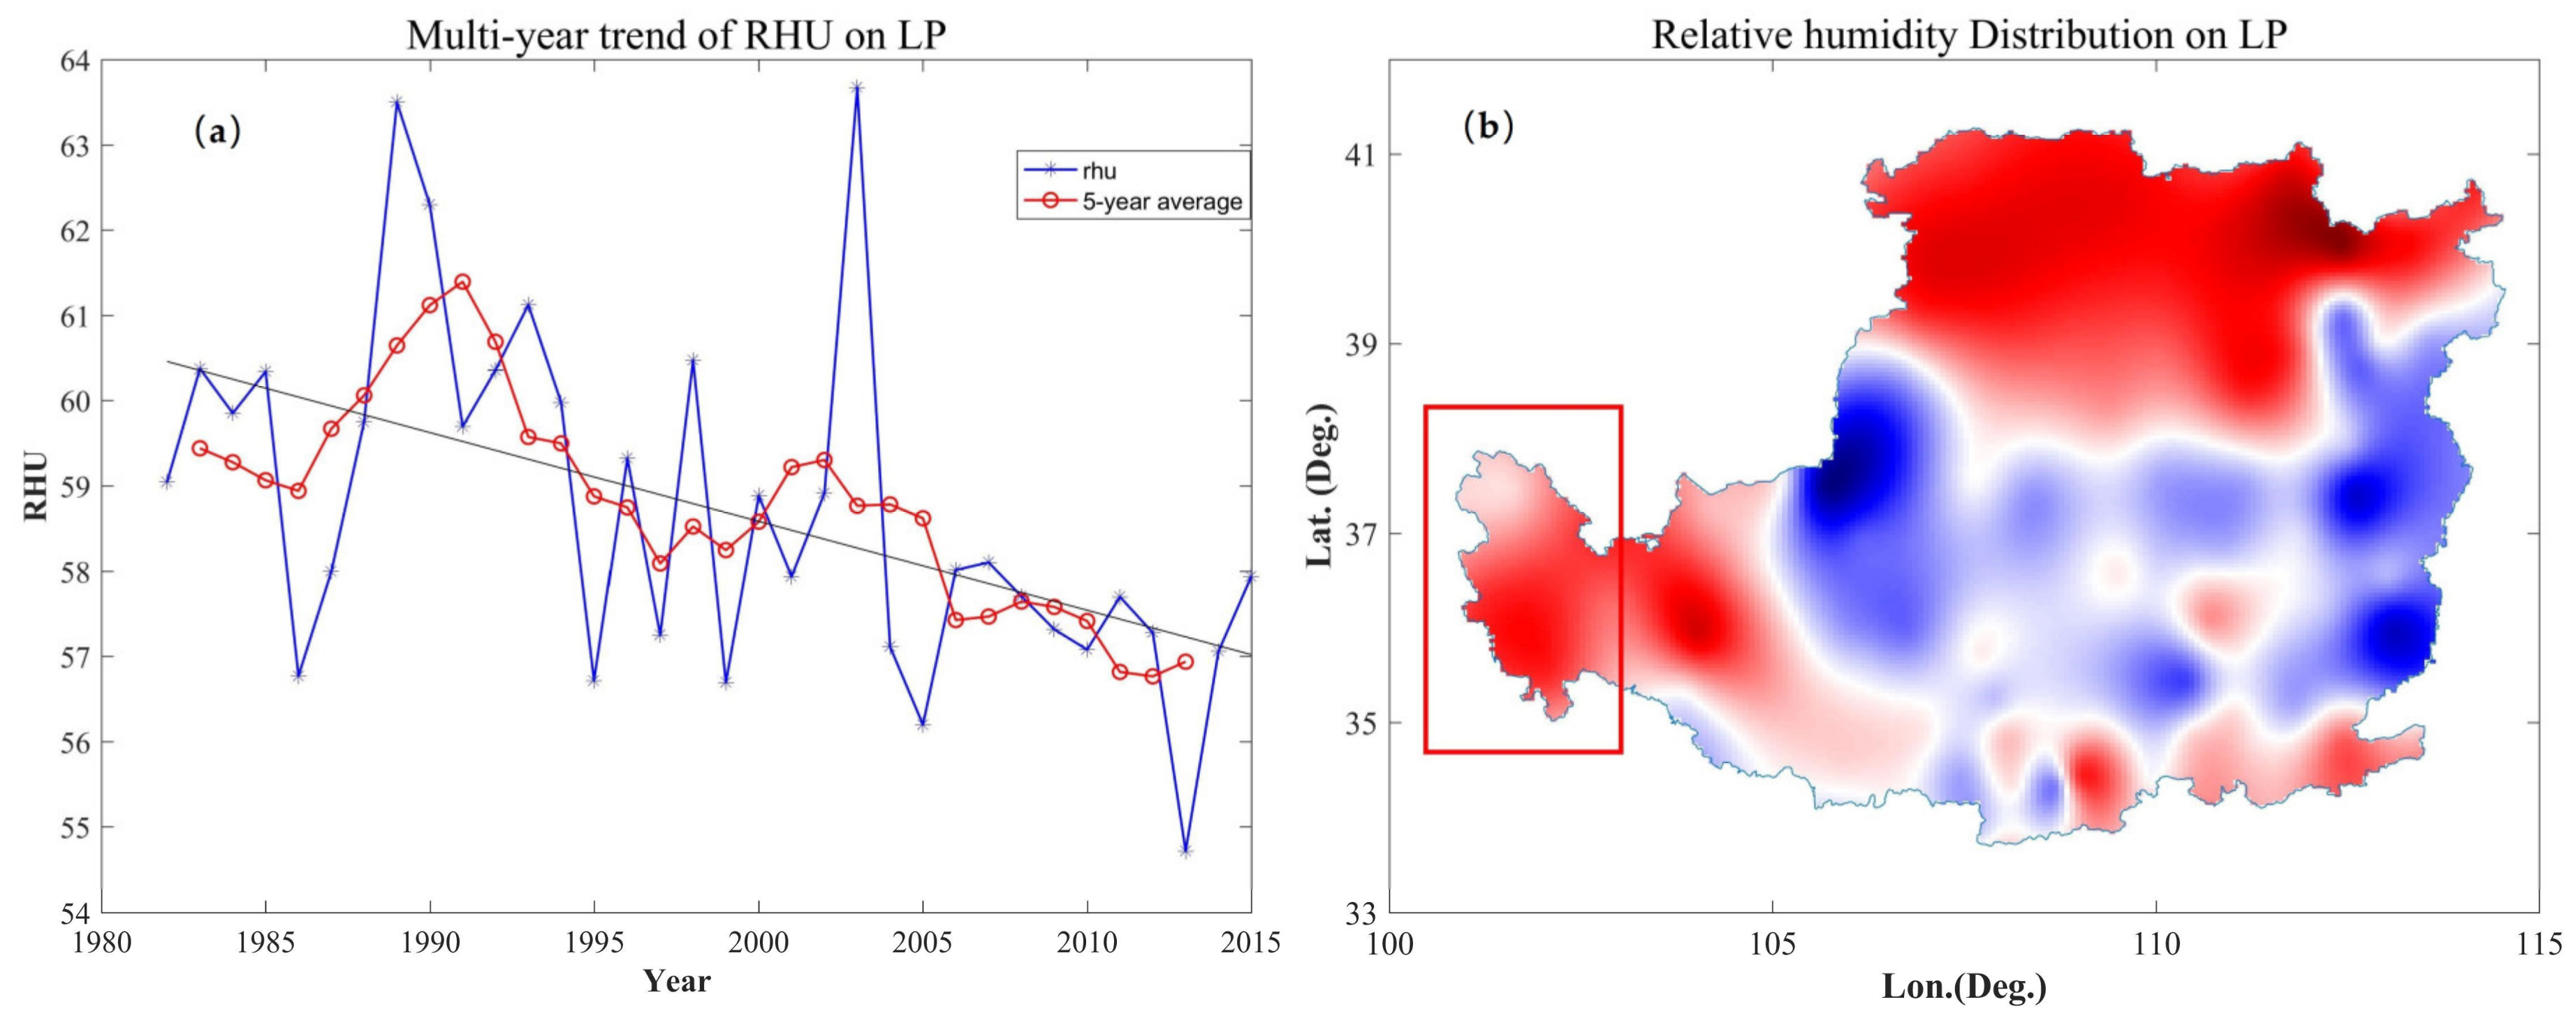
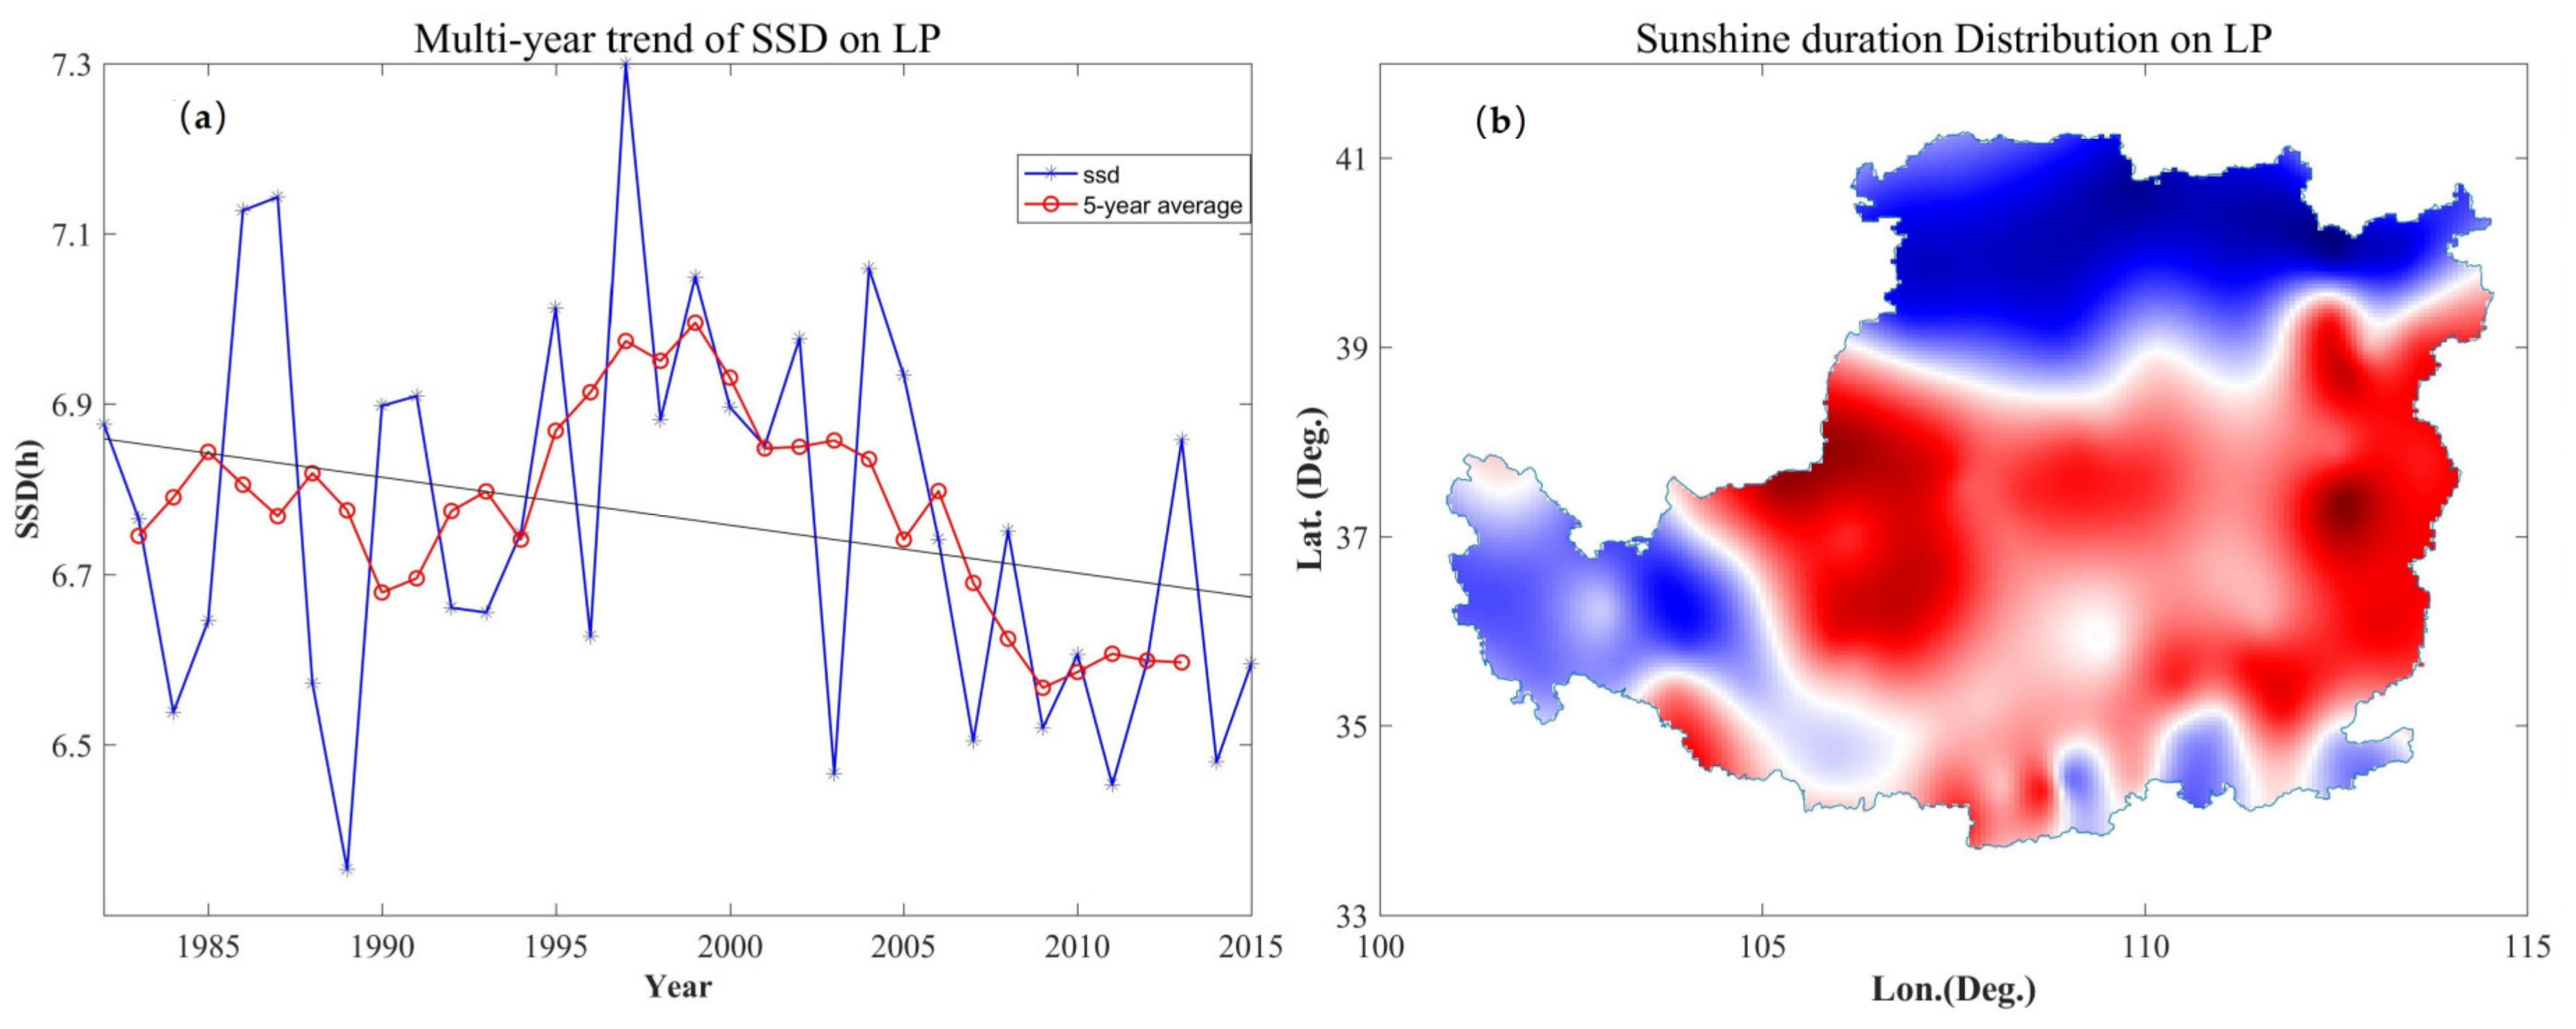
Figure 3 presents the average PWV time series with a 5-year sliding average and its spatial distribution from 1982 to 2015. Figure 3a shows that the PWV did not undergo evident variations in the Loess Plateau over the past 33 years, and values ranged from 12 mm to 14 mm. However, the spatial distribution of PWV in Figure 3b reveals that the atmospheric water decreased from southeast to northwest with values varying from 6 mm to 23 mm, which is partially caused by the topography of Loess Plateau (Figure 4). In addition, an increase in the continental effect toward the northwest increased the dryness of the climate. Figure 4 shows that the variation of elevation is consistent with that of PWV, especially for the eastern portion of Qinghai Province (marked by a red rectangle in Figure 3), which features an elevation of approximately 2250 m above sea level. However, the average PWV was only approximately 6 mm.

3.2.2. RHU and SSD

The time series of the annual average RHU and SSD with the corresponding 5-year sliding averages and spatial distributions are presented in Figure 5 and Figure 6, respectively. Figure 5a and Figure 6a show that RHU and SSD presented a slight downward trend in the Loess Plateau over the past 34 years. RHU varied from 54% to 64%, whereas SSD fluctuated from 6.3 h to 7.3 h. RHU was relatively high north and west of Loess Plateau, but low in the cities of Wuzhong, Taiyuan, and Changzhi (Figure 1). SSD was only approximately 4–5 h in the north of Loess Plateau but increased to 7–9 h in the middle of this region. This phenomenon may be associated with the latitudes and topography. RHU and SSD further showed a significant negative correlation in Figure 5b and Figure 6b in the Loess Plateau. For areas with a long SSD, the corresponding RHU was low, whereas areas with a short SSD had a high RHU.

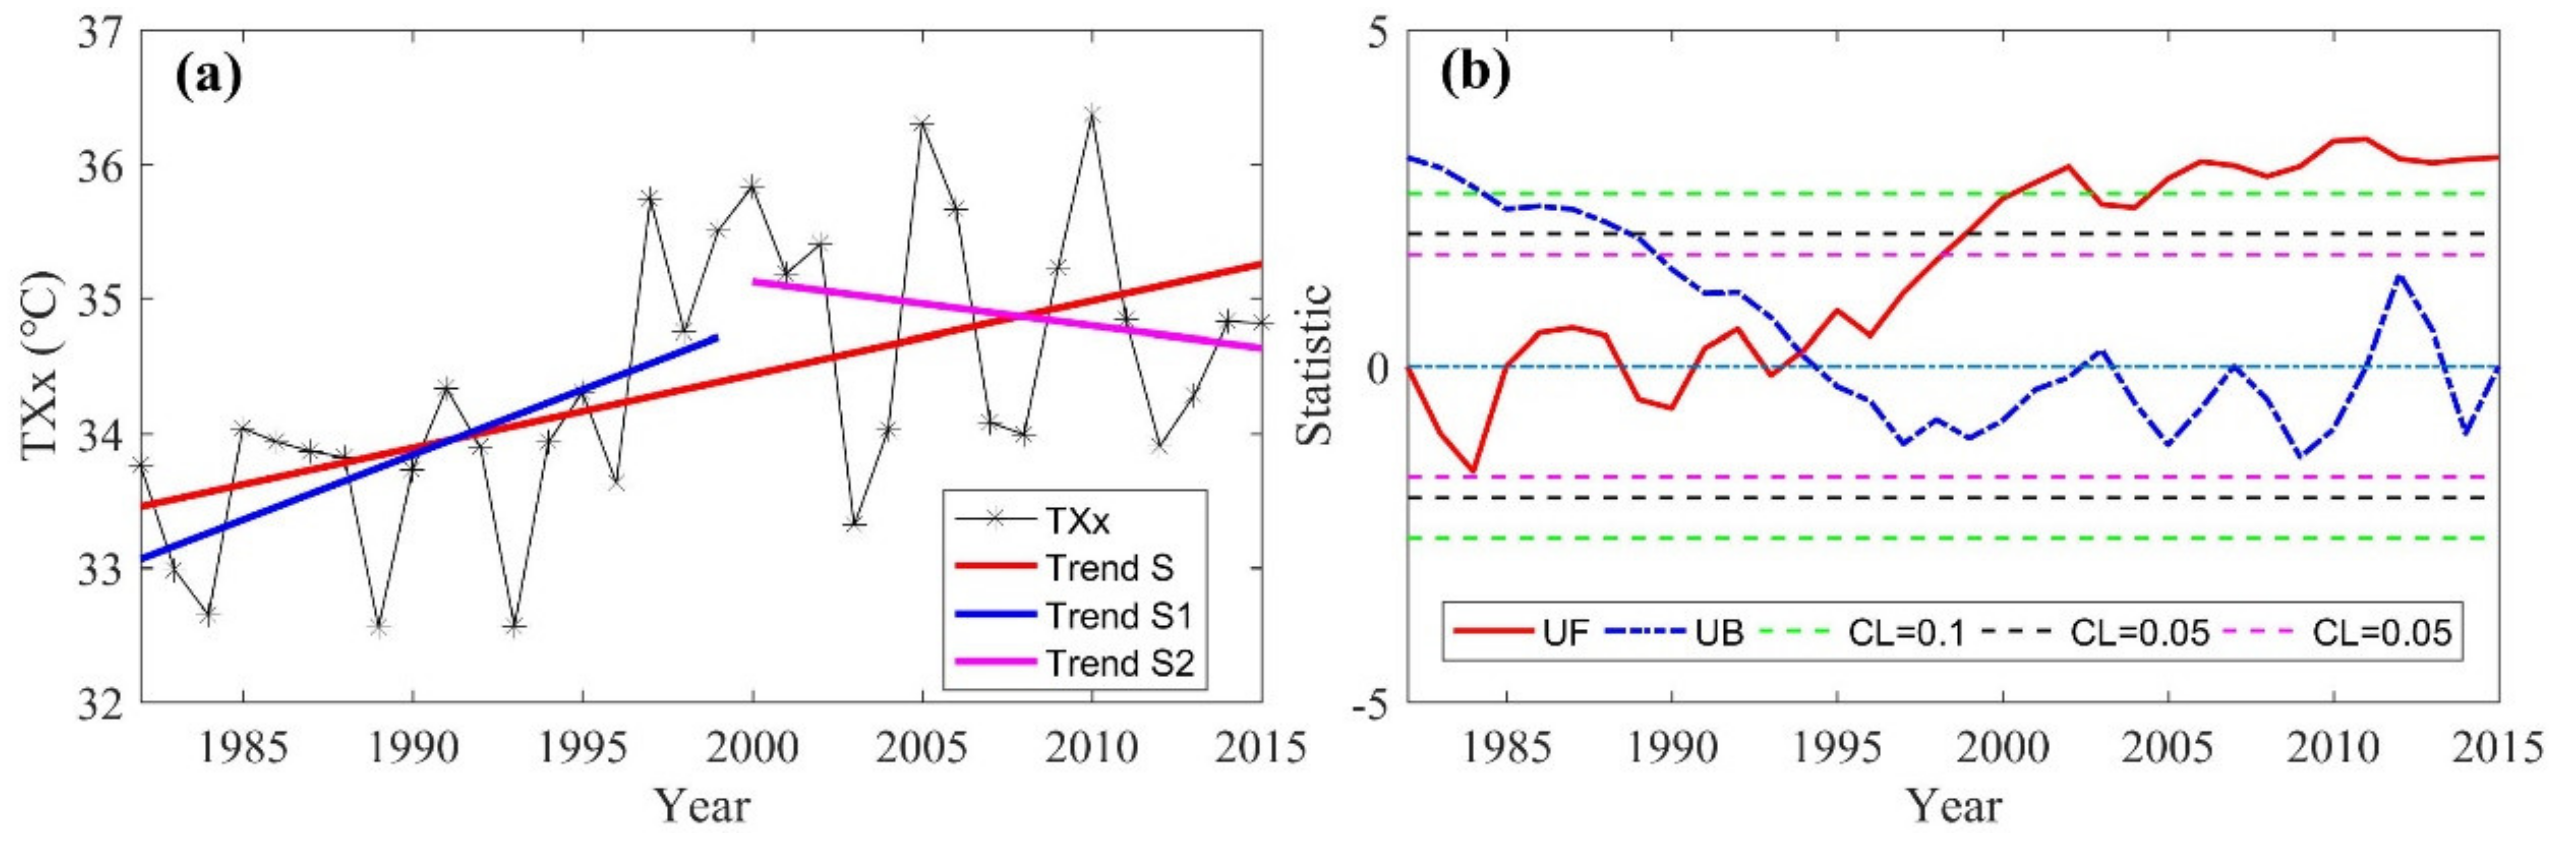
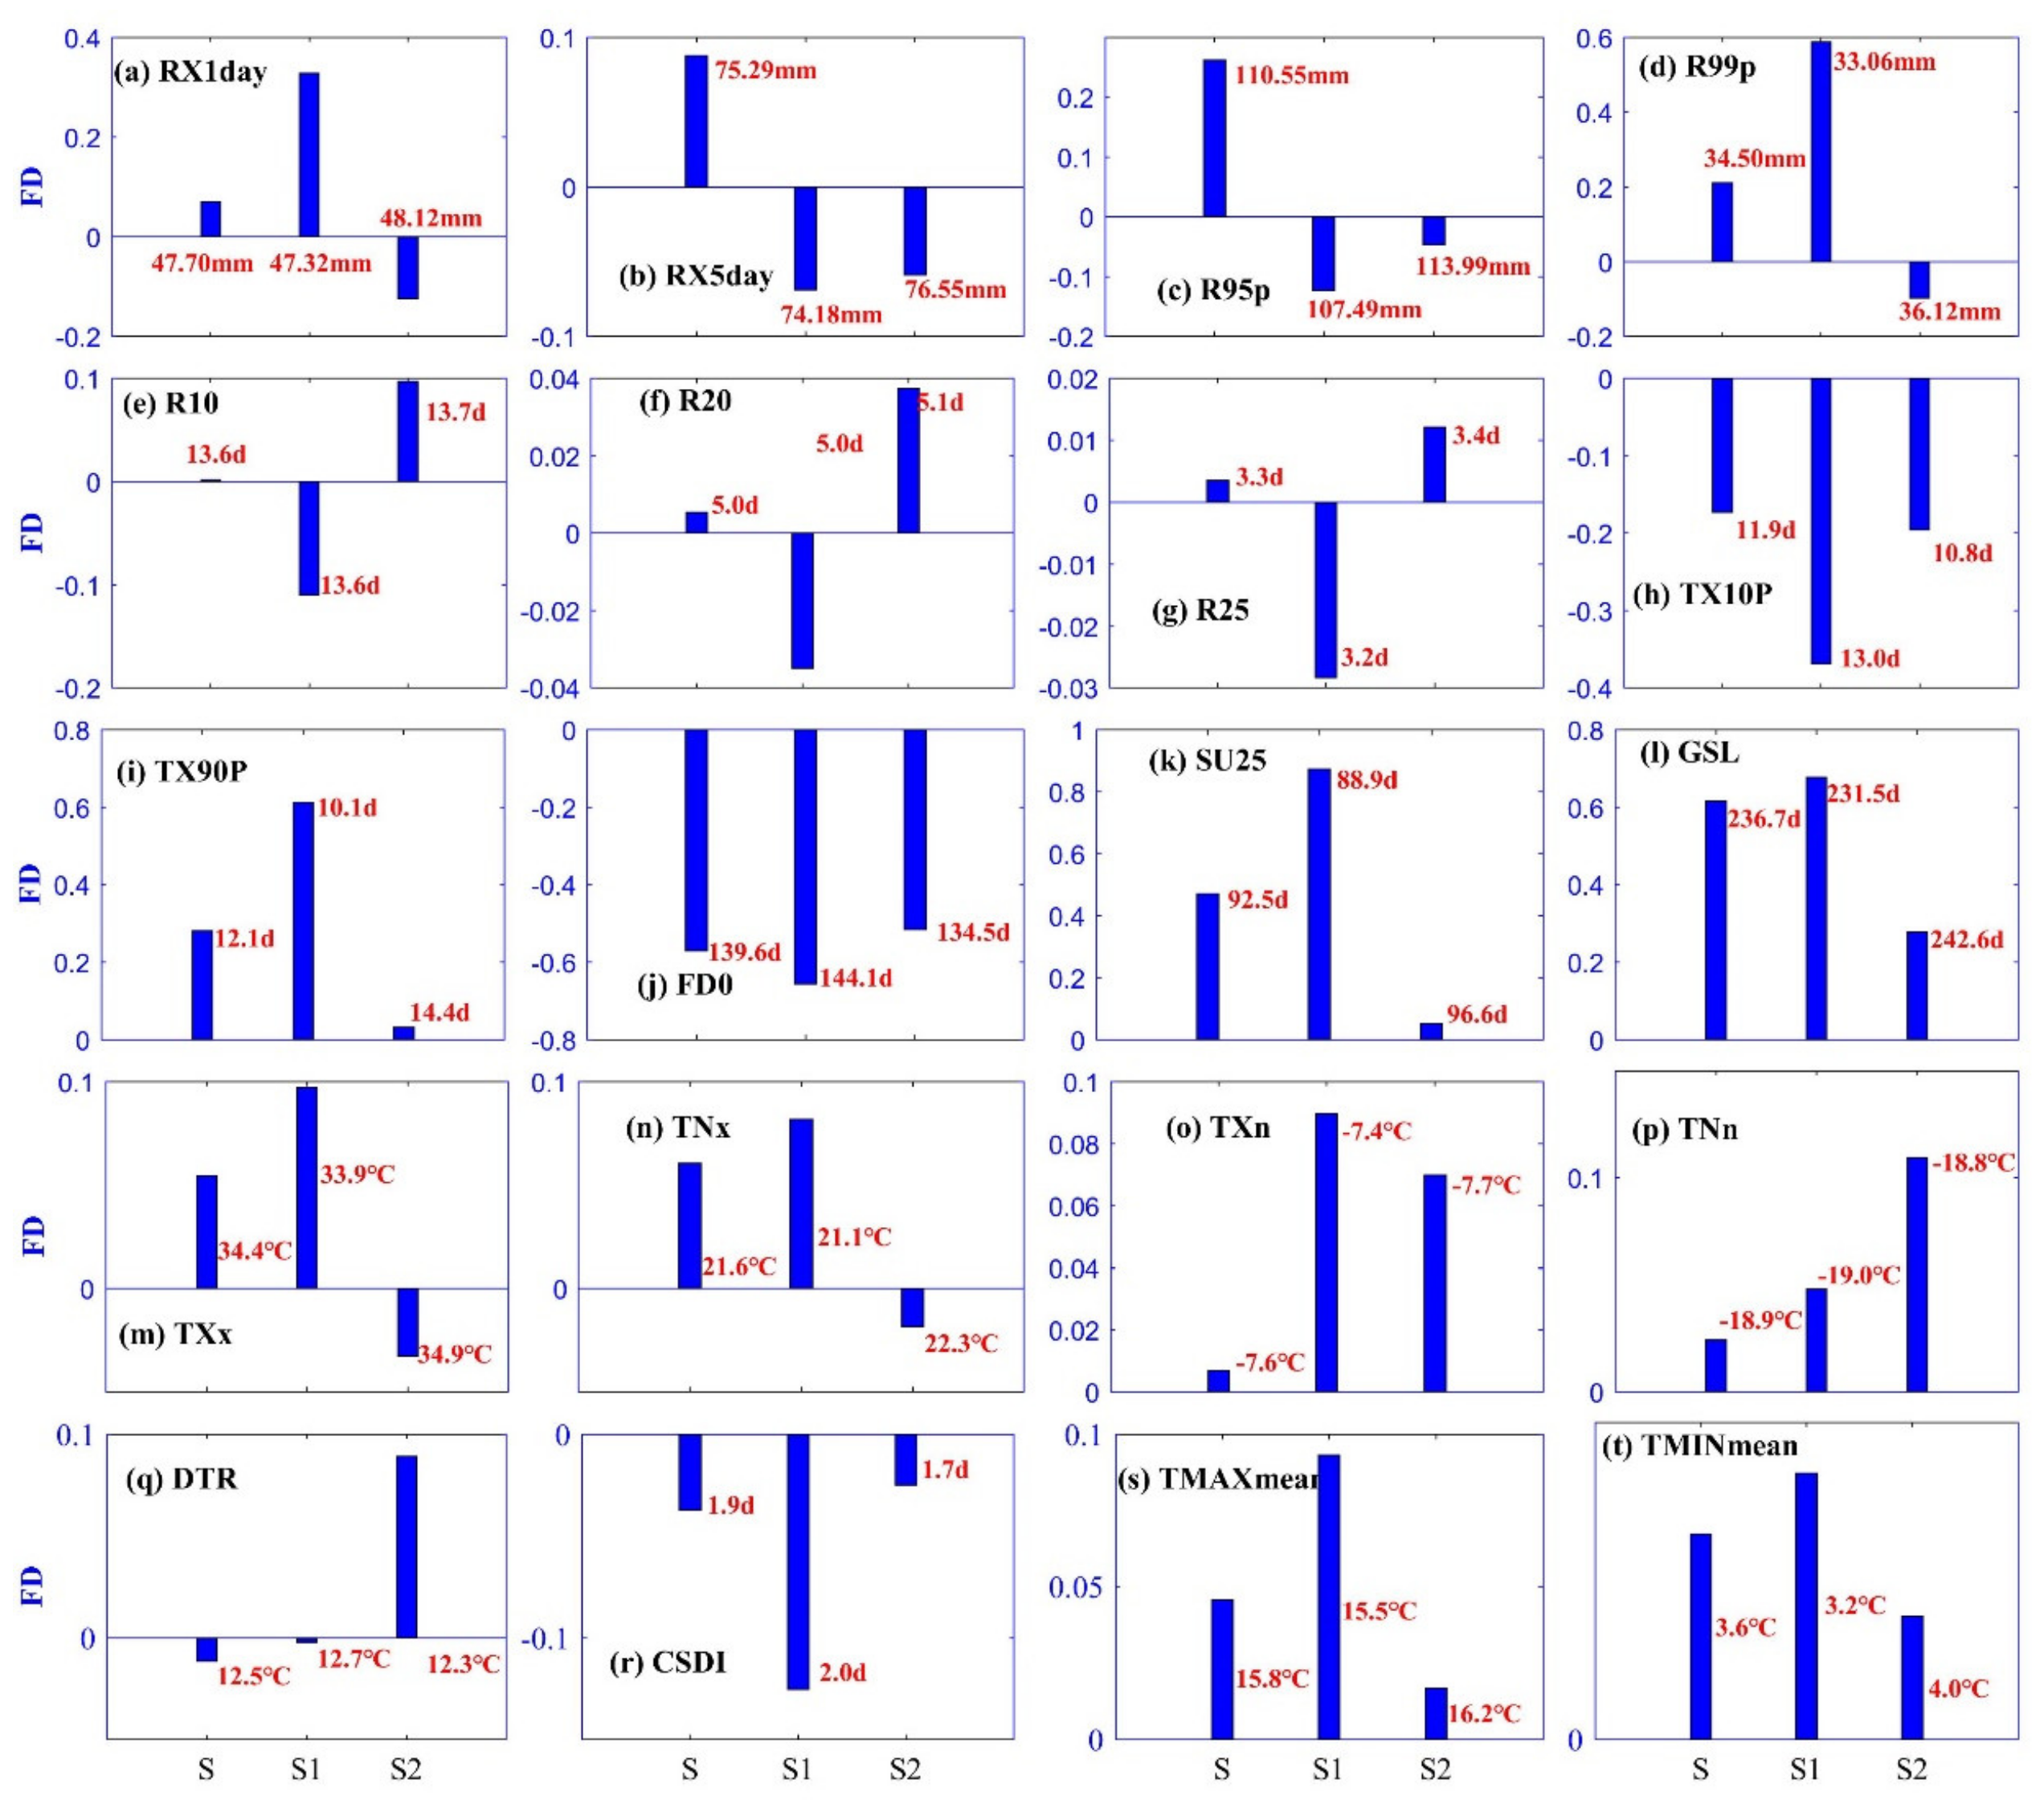
3.3. Change in Extreme Climatic Indices over the Loess Plateau Region

The time series of the highest temperature of the daily maximum per month (TXx) is presented in Figure 7, where TXx showed an overall upward trend with increasing global temperature during S. However, while the slope of TXx during the period S1 was positive, the slope in period S2 was negative. This finding suggests that the increase in TXx during S is mainly contributed by that during S1. Compared with the vegetation variation in Figure 2, the vegetation coverage is obviously poor during S1. The statistical results revealed that an increase in NDVI by 0.0015 is associated with a decrease the TXx by 0.0327 °C during S2 period in the Loess Plateau.
The trends of extreme climate indices during S, S1, and S2 in the Loess Plateau are presented in Figure 8. All first derivatives of the 7 extreme precipitation indices were higher than 0 and showed an upward trend over the past 34 years (period S). However, the first derivatives of RX1day, RX5day, R95p, and R99p were less than 0 and demonstrated a downward trend over the past 15 years (period S2). The first derivatives of R10, R20, and R25 showed trends completely contrasting those during S1 (less than 0) and S2 (larger than 0). Therefore, the upward trends of these three indices during S2 greatly affected the trends during S, and explain the frequent occurrence of extreme precipitation events during S2.
In terms of extreme temperature cold indices, the first derivatives of TX10P, FD0, and CSDI were consistently less than 0 during the three periods under study, but more so in S1 than in S2. The extreme temperature cold indices show a downward trend during the S, S1 and S2 periods, and the decreased rates are S1 > S > S2, which suggests that the downward trend during S is mainly affected by the discredited trend of period S1. In terms of extreme temperature warm indices, the variation characteristics of TNx were similar to those of TXx. The first derivatives of TX90P, SU25, GSL, TMAXmean, and TMINmean were higher than 0 during S. However, the values derived from S1 were higher than those from S, whereas the values obtained from S2 were less than those from S, which suggests that the upward trend during S is mainly affected by the increased trend of period S1.
TXx revealed an abrupt increase at around 1994 (P < 0.01) (Figure 7b). The statistical results of Figure 7 reveal that the multi-year average value of TXx over the entire Loess Plateau was 34.36 °C. An extremely high value of 36.37 °C occurred in 2010, while an extremely low value of 32.56 °C was observed in 1989. The change rate of TXx was 0.48 °C/10a, and the statistical result of other extreme climate indices are provided in Table 5.

3.4. Correlation Analysis

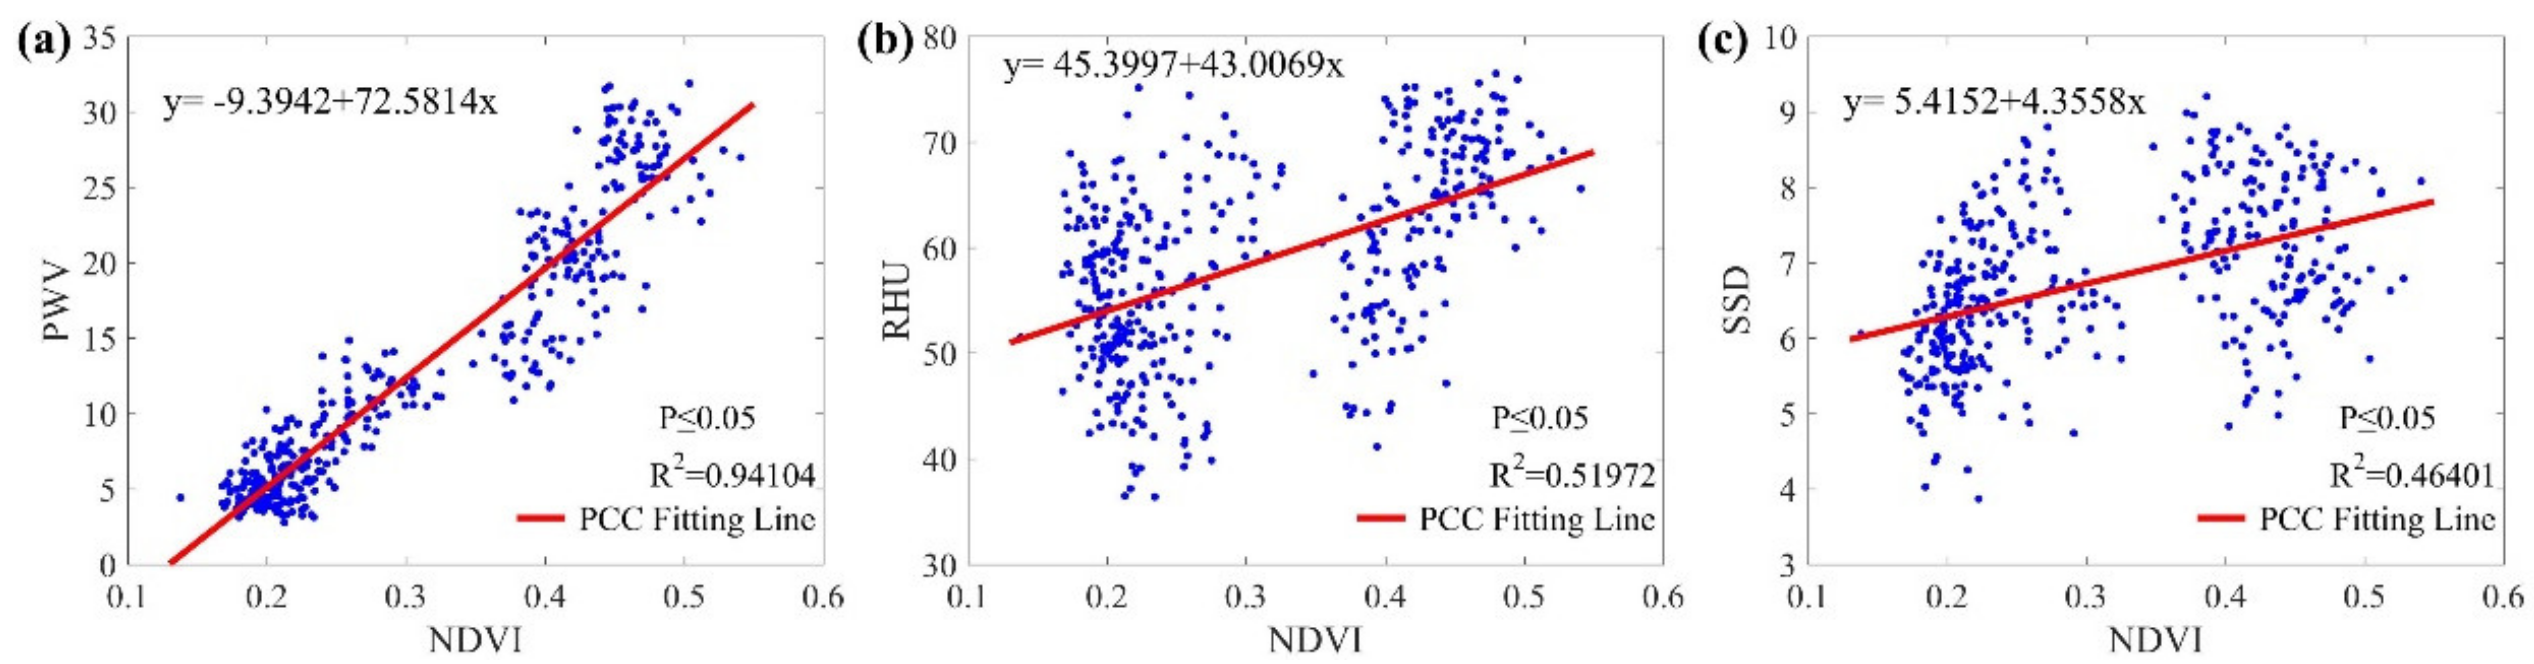
3.4.1. NDVI and Meteorological Factors

Considering that the PWV is highly related to temperature and precipitation, its variation with NDVI was also analyzed. The Pearson correlation coefficients of NDVI with PWV, RHU, and SSD were calculated (Figure 9). Strong correlations existed between NDVI and PWV with a correlation value of 0.94. Many studies have shown that vegetation growth is highly influenced by precipitation [36,37,38,39], and precipitation mainly originates from atmospheric water vapor [24]; thus, a strong correlation exists between NDVI and PWV. Most parts of Loess Plateau are semi-arid regions, and a large part of the moisture in the near-surface air comes from the evapotranspiration of the vegetated land surface. Thus, a moderate correlation of 0.52 between NDVI and RHU was observed. SSD is among the most influential factors contributing to the vegetation photosynthetic active radiation [40], and a good correlation of 0.464 was found between NDVI and SSD.

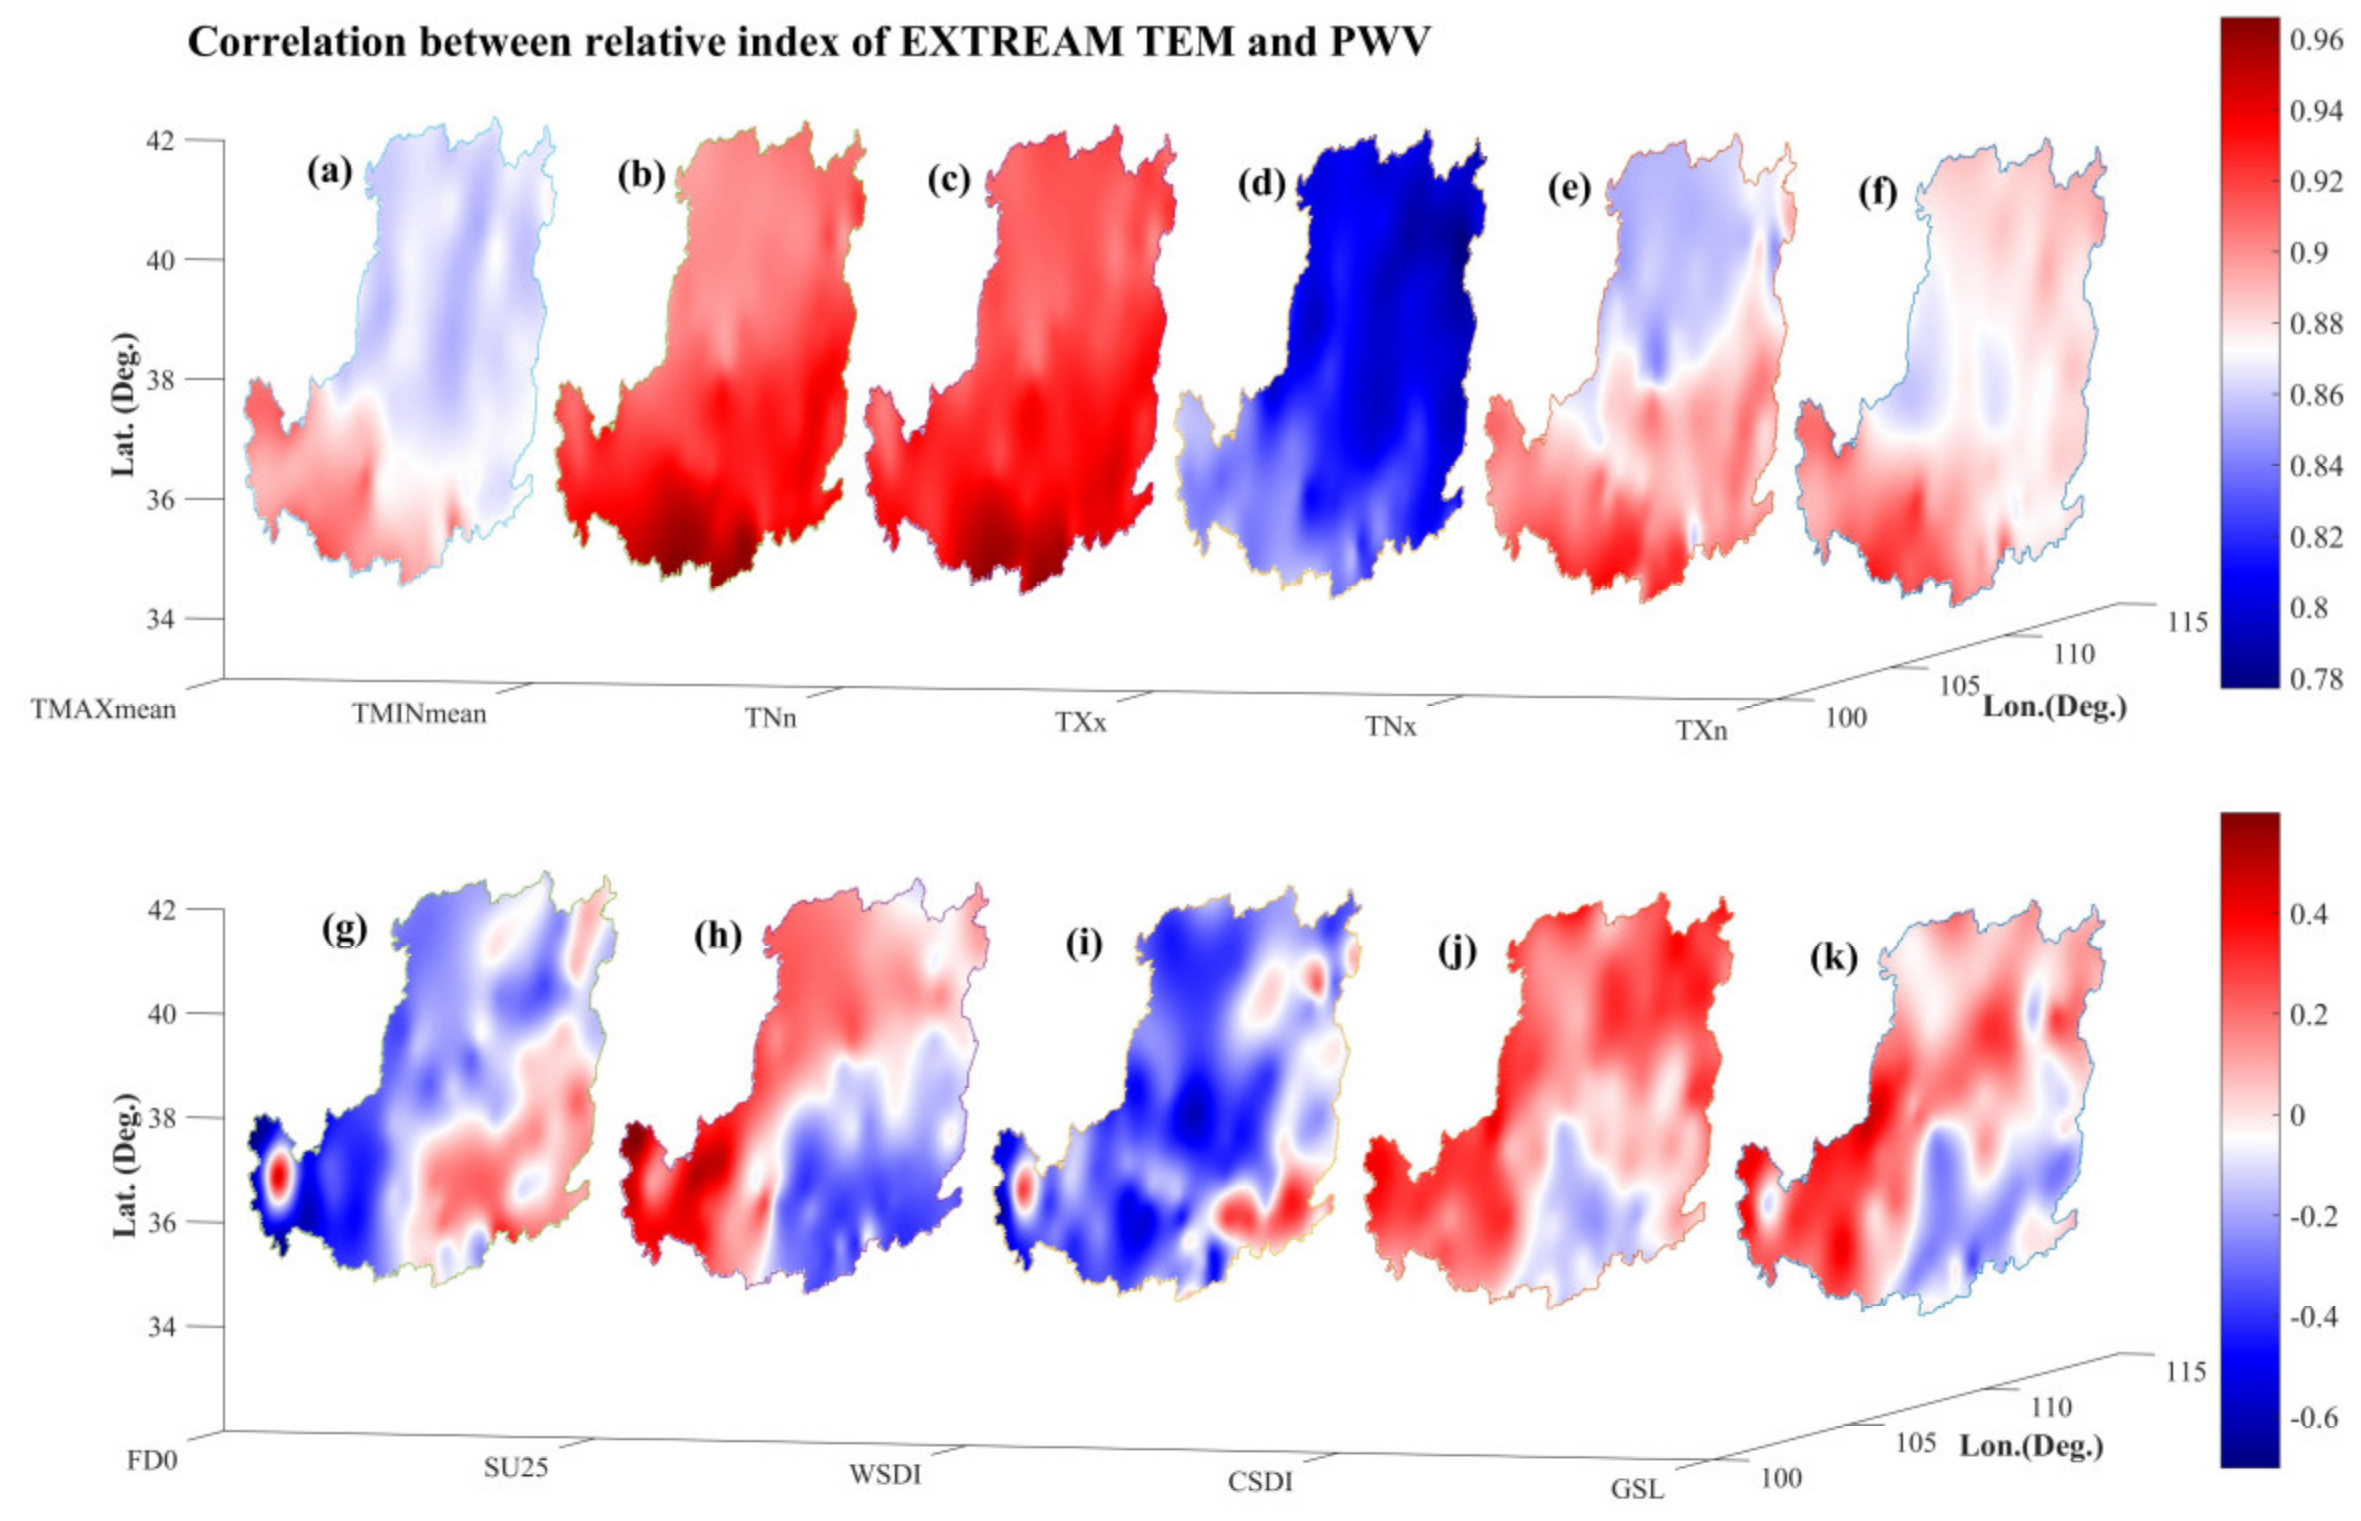
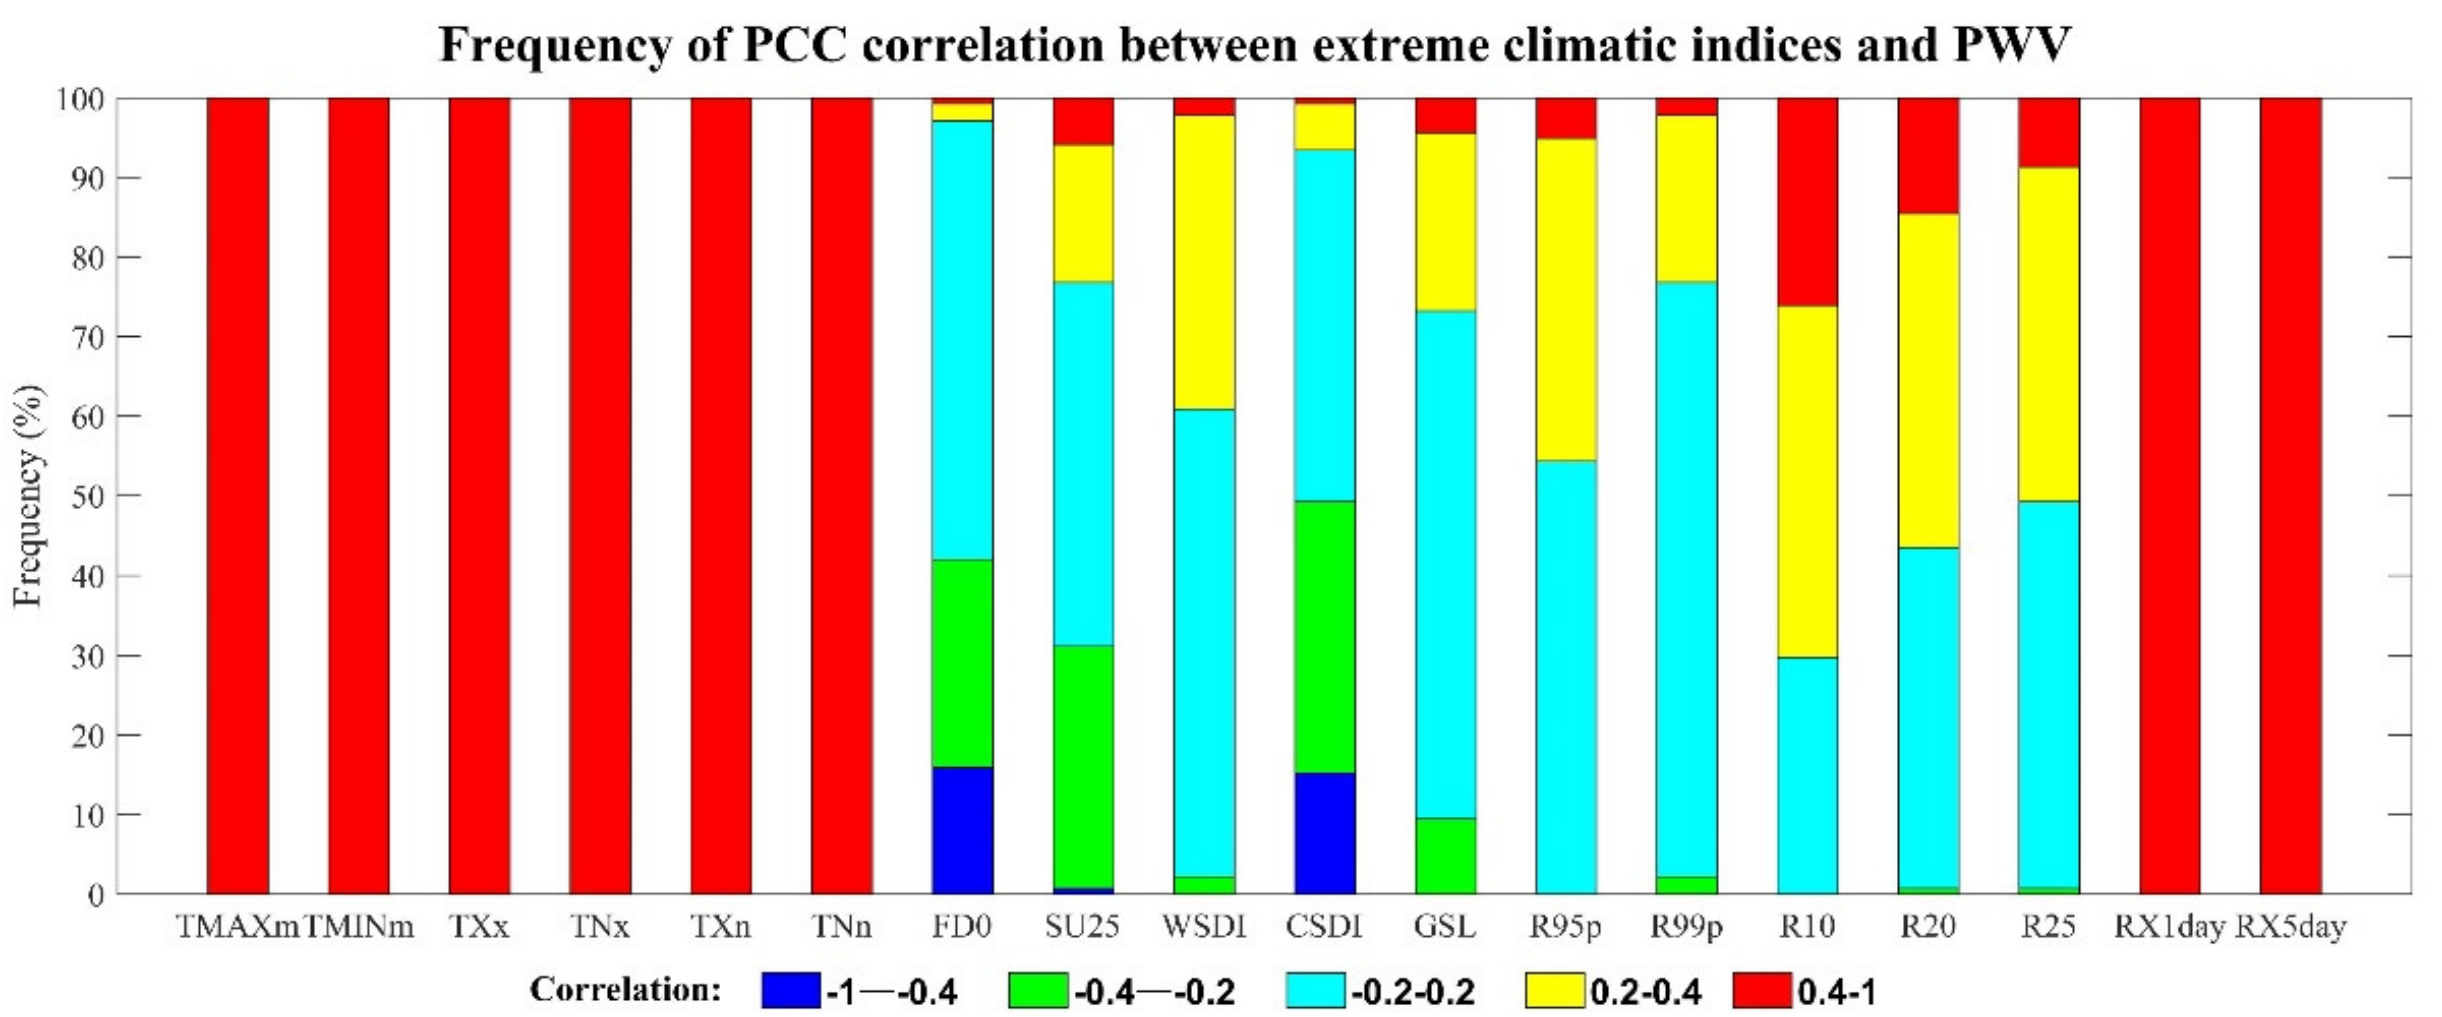
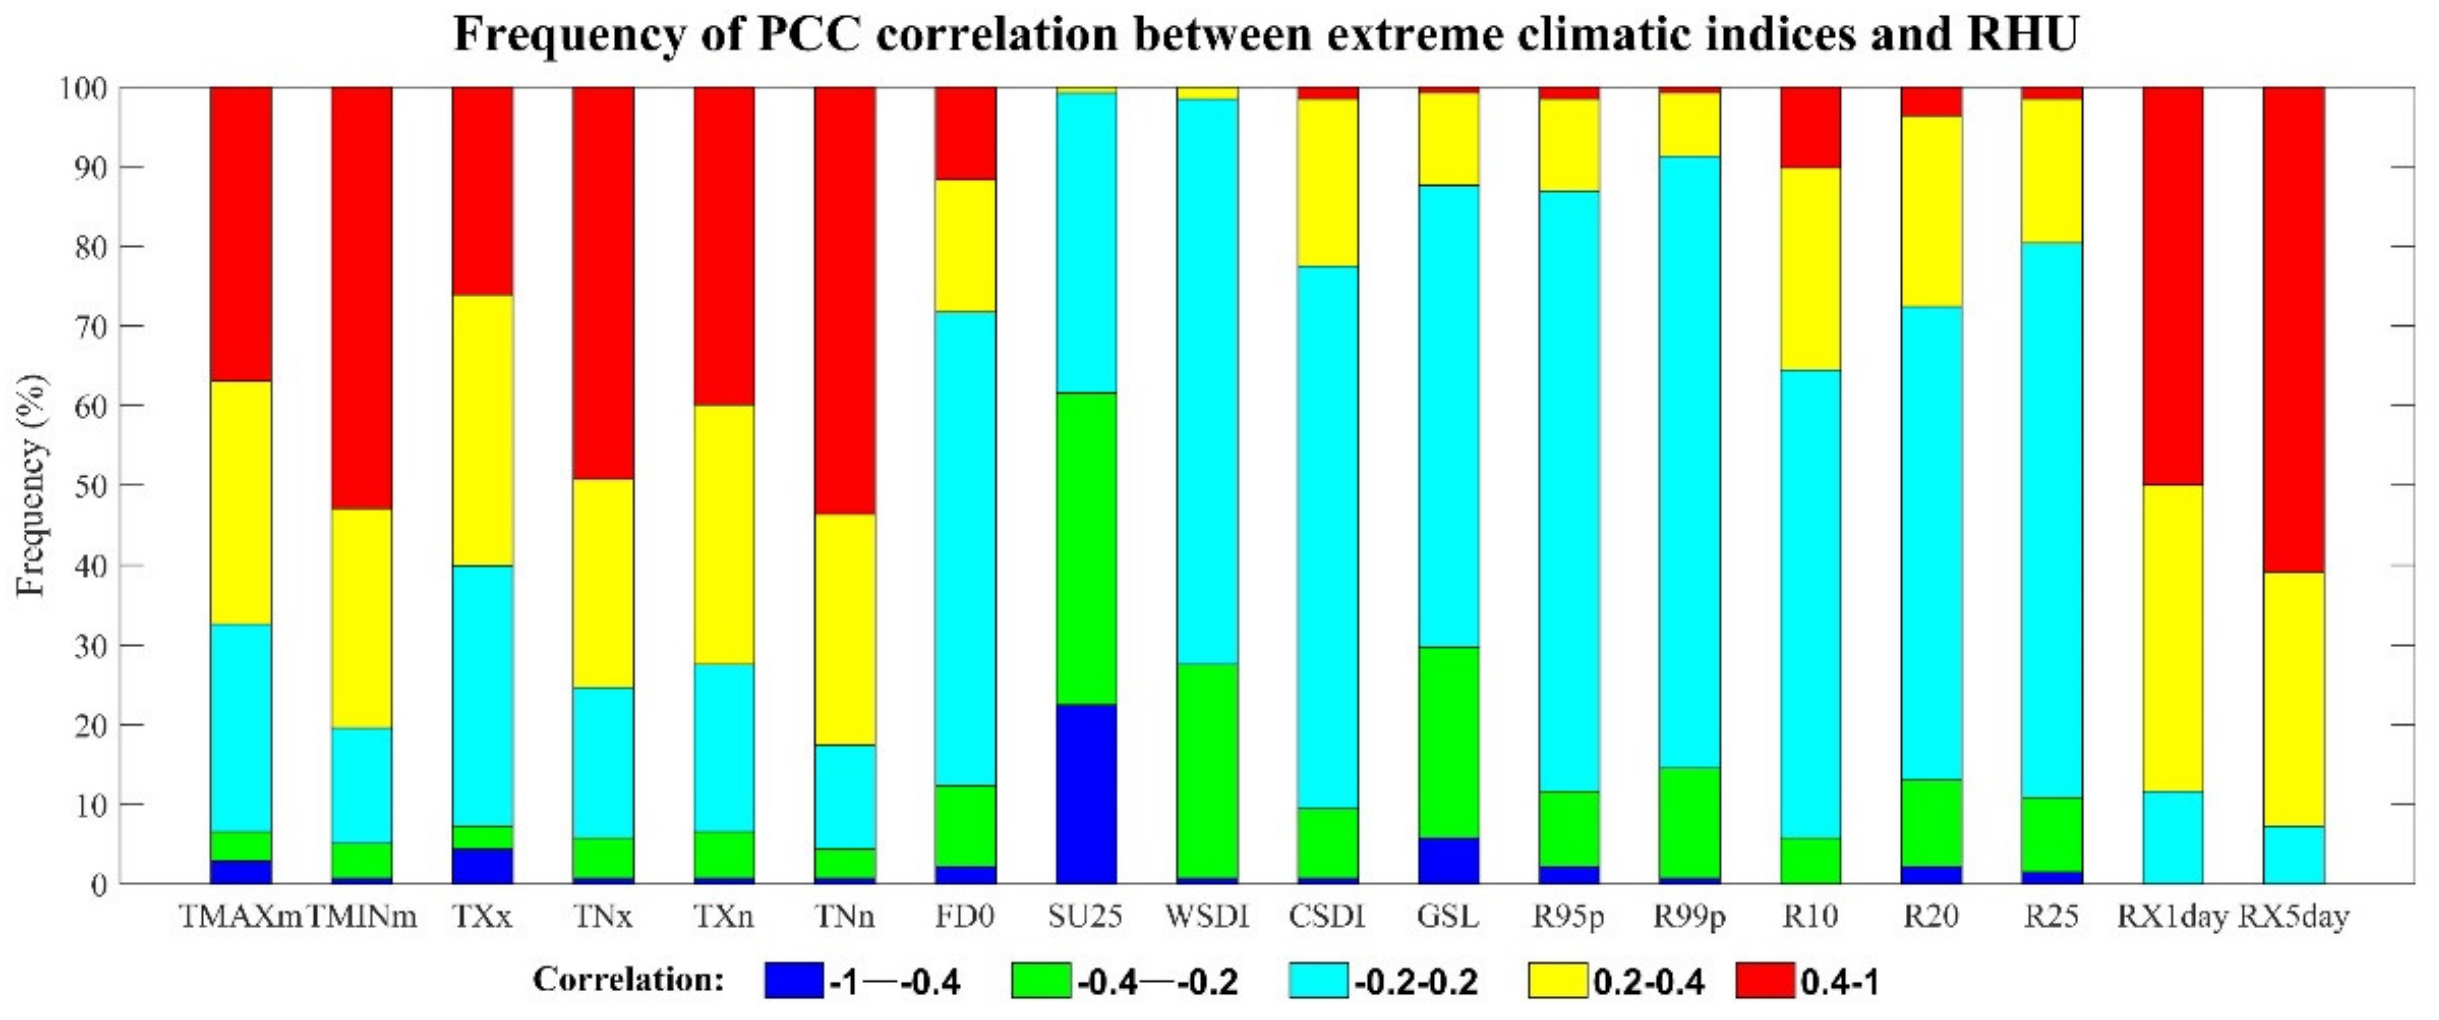
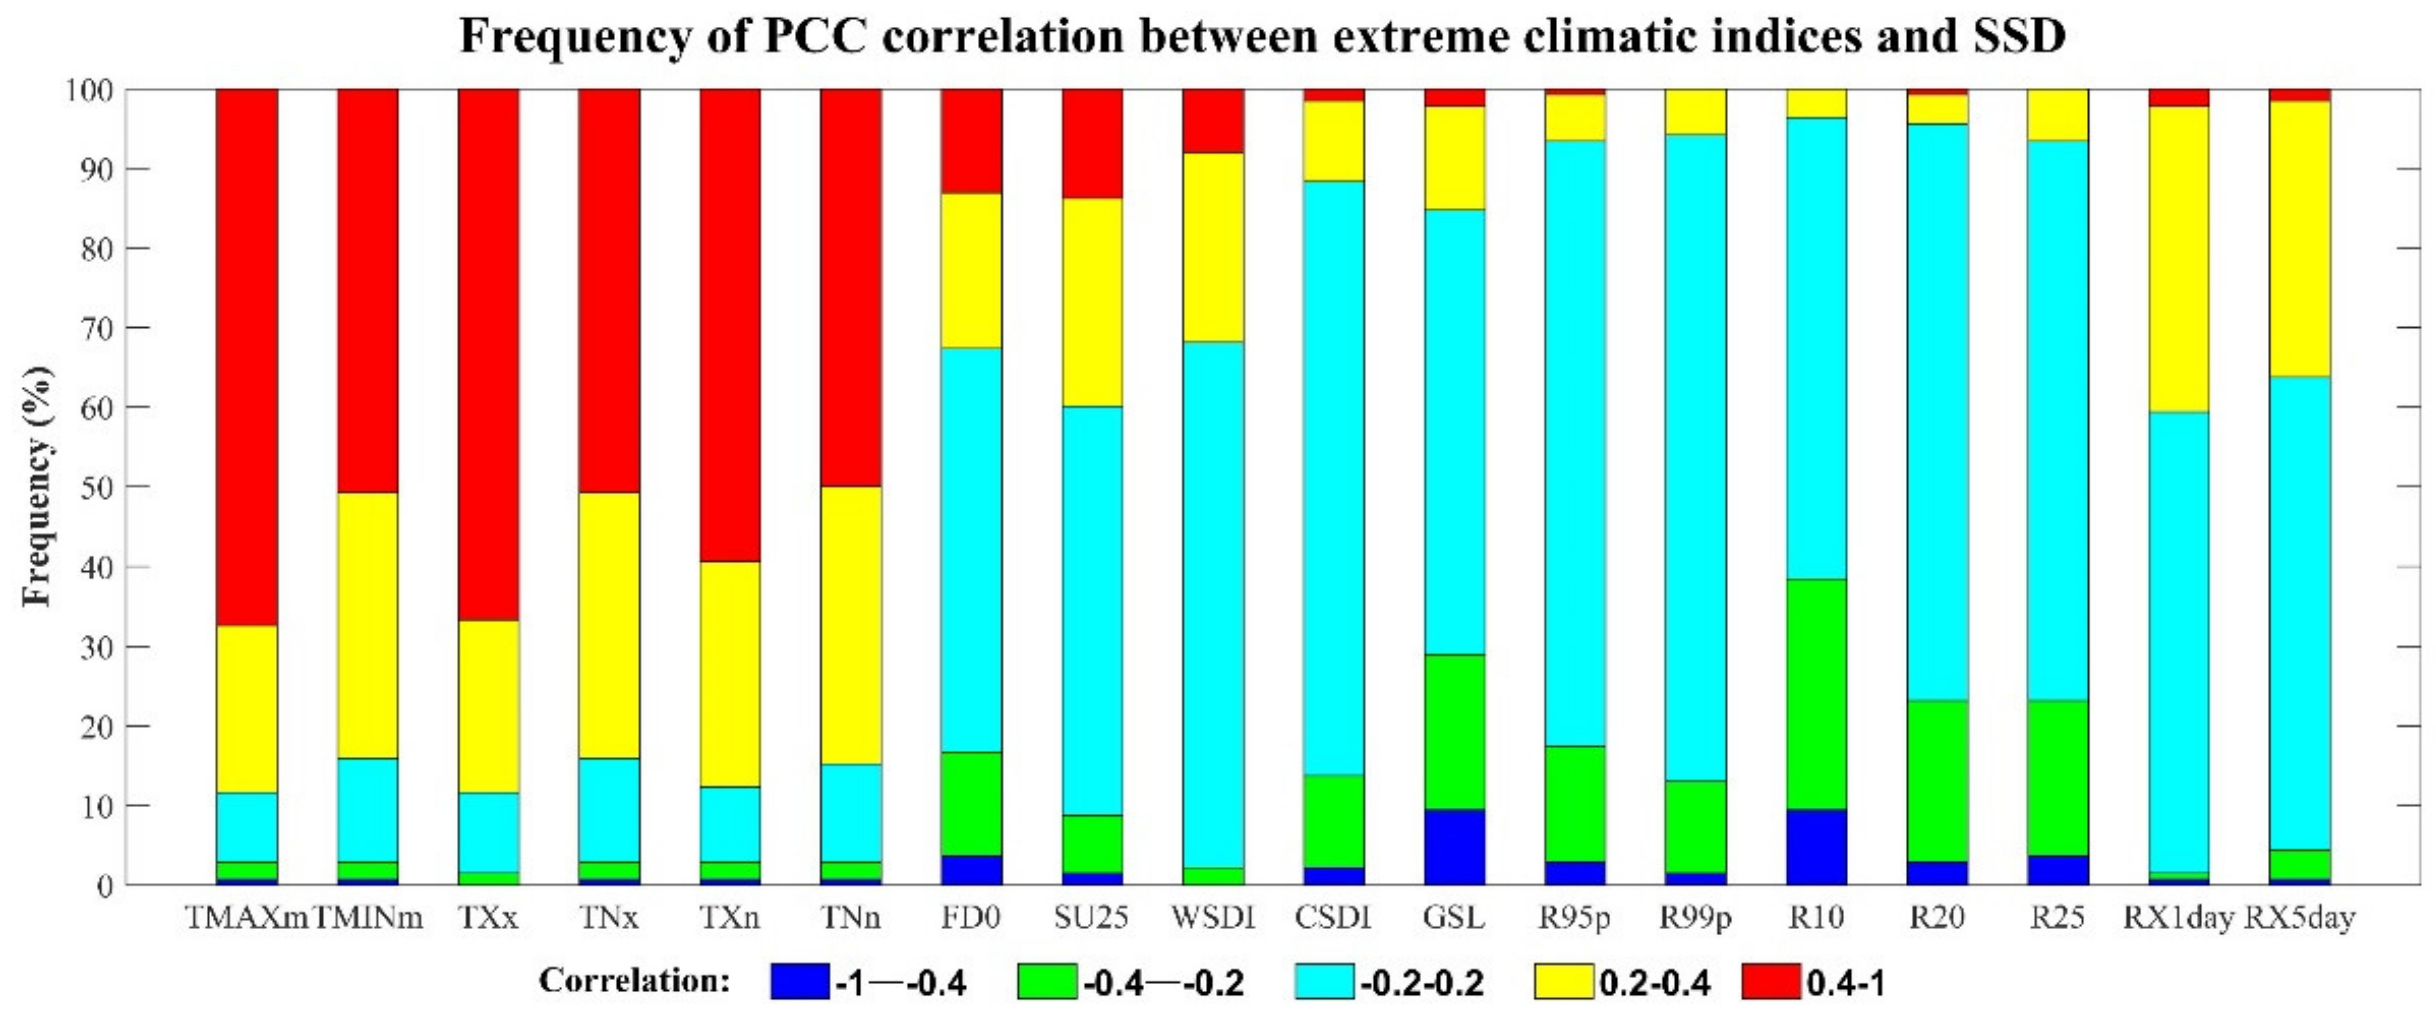
3.4.2. Correlations between Meteorological Factors and Extreme Climatic Indices

The Pearson correlation coefficients of PWV with extreme temperature indices are provided in Figure 10a. A strong correlation of above 0.78 was found between PWV and extreme temperature indices, such as TMAXmean, TMINmean, TNn, TXx, TNx, and TXn. The Pearson correlation coefficients of the extreme temperature indices showed a decreasing trend from southwest to northeast, which is possibly associated with the PWV distribution. Xu et al. [25] found that a high temperature corresponds to high atmospheric moisture content. Figure 11 shows the correlation coefficient distribution statistics of extreme temperature index, extreme rainfall index and PWV in the Loess Plateau; five different colors in the figure represent different statistical intervals of correlation coefficient. It can be found that the coefficients of the correlations of PWV with TMAXmean, TMINmean, TXx, TNx, TXn, and TNn were higher than 0.4. Weak correlations existed between PWV and other extreme temperature indices, such as FD0, SU25, WSDI, CSDI, and GSL, accounting for 55.07%, 45.65%, 58.70%, 44.20%, and 63.77% of Loess Plateau, respectively. The increase in extreme cold indices could accelerate the transformation of atmospheric water vapor into the rain, further causing a decrease in atmospheric PWV. Therefore, the extreme cold indices FD0 and CSDI showed negative relationships with PWV, accounting for 42% and 59.4% of Loess Plateau, respectively.
The statistical results of the Pearson correlation coefficients of extreme climate indices with RHU and SSD are also presented in Figure 12 and Figure 13, respectively. Figure 12 shows that the Pearson correlation coefficients of the relationships of RHU with TMAXmean, TMINmean, TXx, TNx, TXn, and TNn are higher than 0.2, accounting for 67.39%, 80.43%, 60.15%, 68.37%, 72.74%, and 82.6% of Loess Plateau, respectively. Extreme temperature cold indices did not show evident correlations with RHU, whereas negative correlations existed between RHU and extreme temperature warm indices (SU25, WSDI, and GSL). Some extreme precipitation indices, such as RX1day and RX5day, showed good correlations with RHU (0.2–1), accounting for 88.40% and 92.75% of Loess Plateau, respectively. Extreme temperature indices, such as TMAXmean, TMINmean, TXx, TNx, TXn, and TNn, also showed positive relationships with SSD with Pearson correlation coefficients ranging from 0.2–1, accounting for 88.5%, 84.05%, 88.41%, 84.05%, 87.68%, and 84.78% of Loess Plateau, respectively.

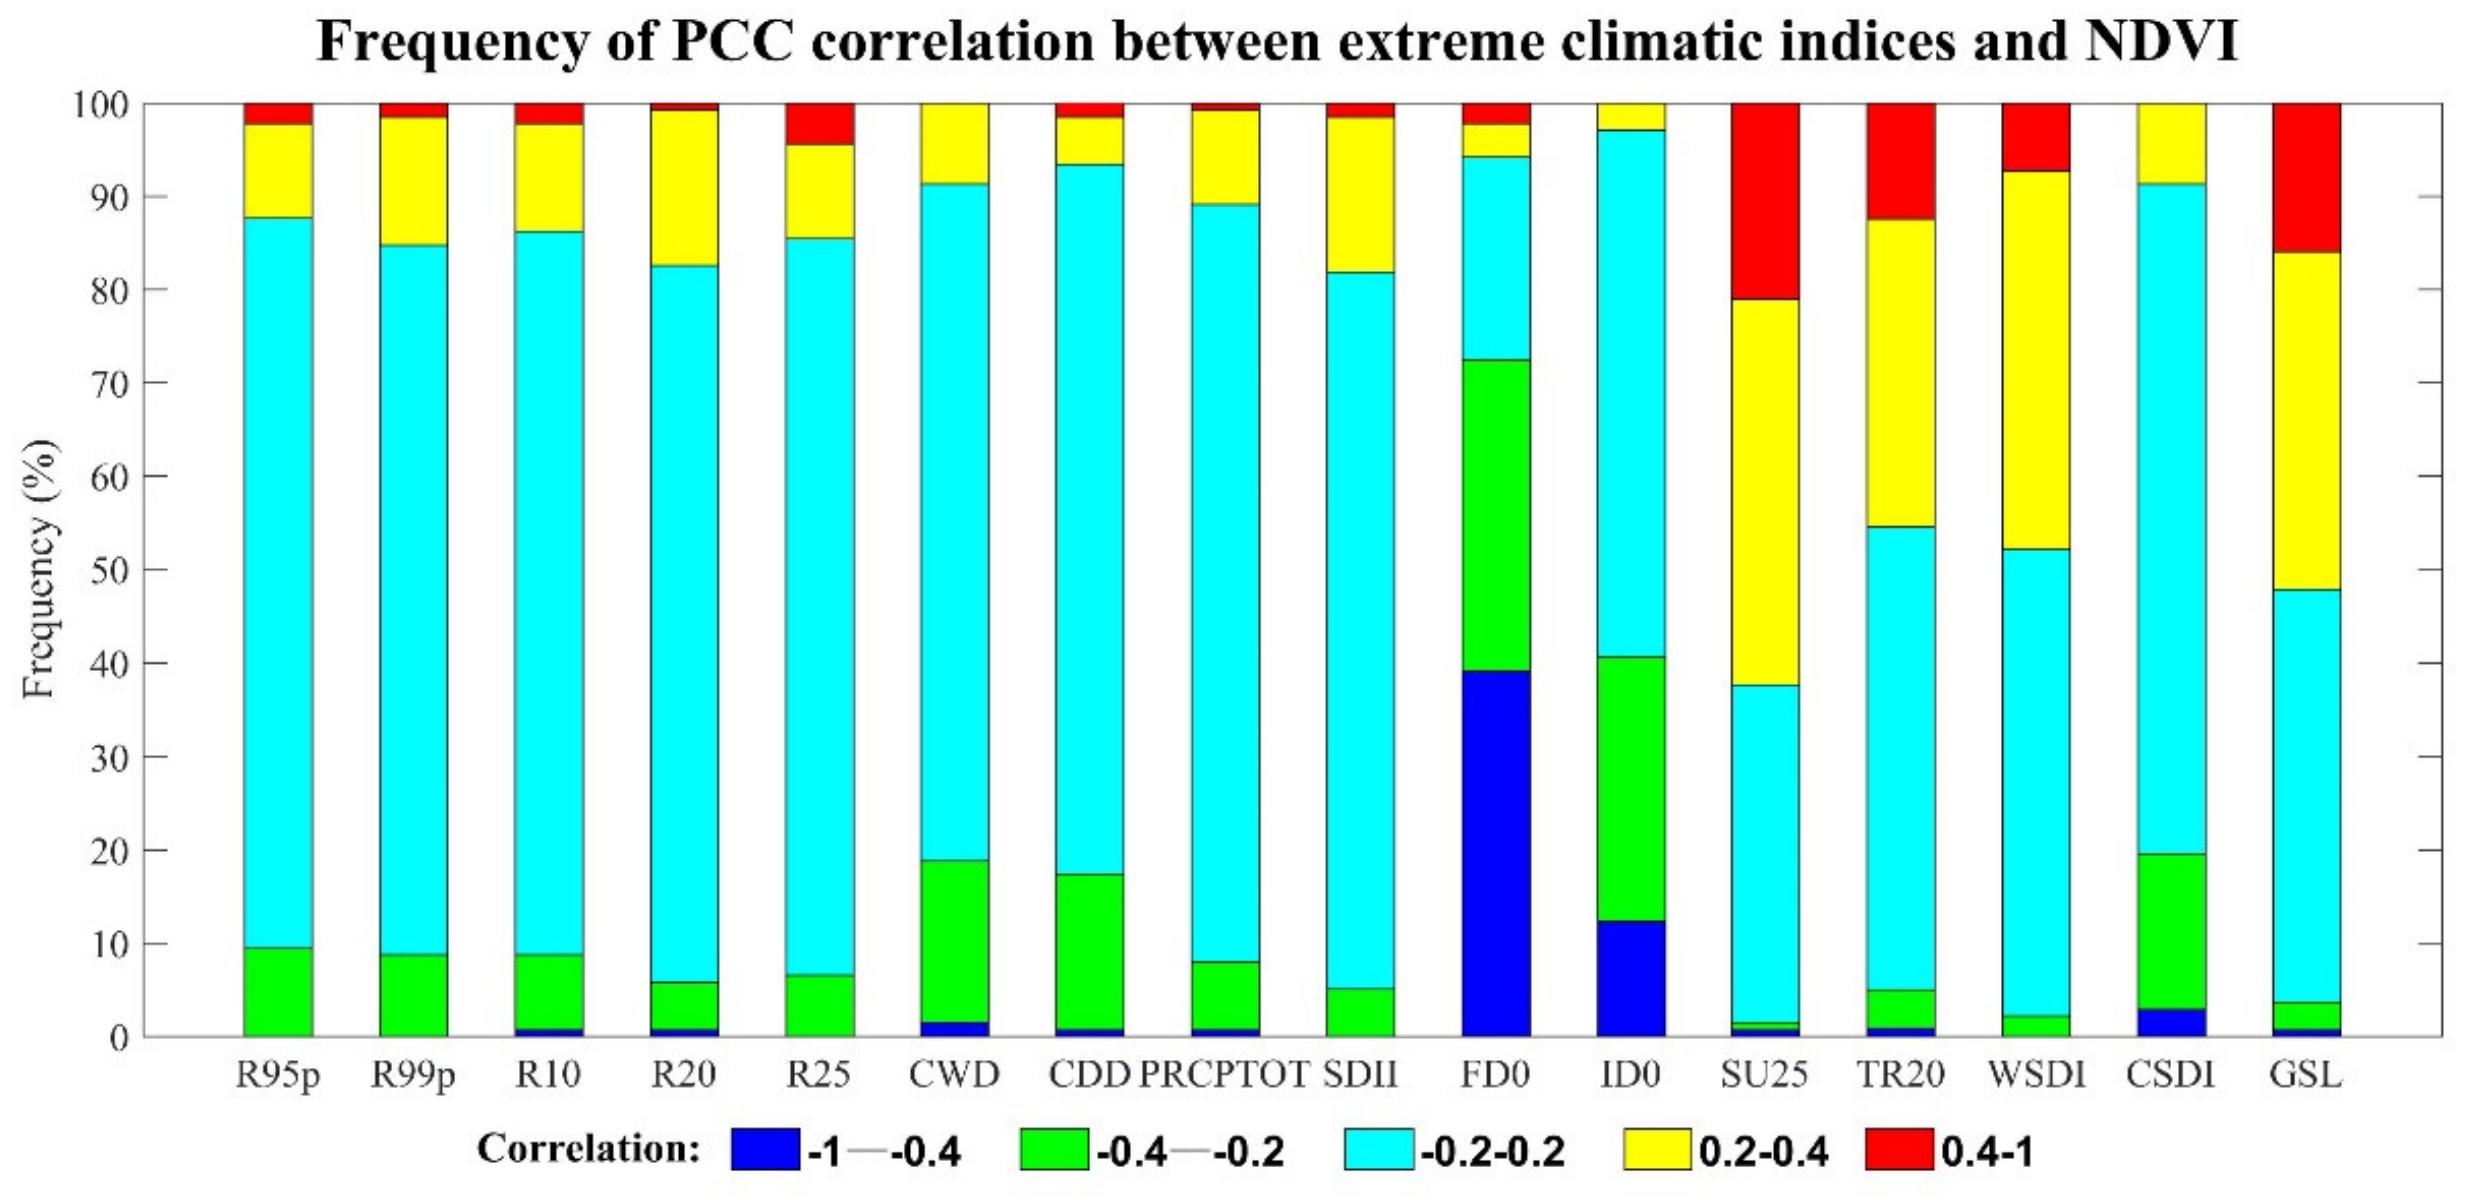
3.4.3. NDVI and Extreme Climate Indices

Comparisons revealed that extreme temperature indices, such as TX10P, TN10P, TX90P, TN90P, R95p, R99p, R10, R20, R25, CWD, CDD, PRCPTOT, and SDII, were not correlated with NDVI in the Loess Plateau. Figure 14 and Figure 15 respectively present the distribution of Pearson correlation coefficients between NDVI and extreme temperature indices and their percentages. The percentages of the Pearson correlation coefficients of NDVI with cold indices FD0 and ID0 ranged from −1 to −0.2 and accounted for 56.33% and 40.58% of Loess Plateau, respectively, while that of NDVI with warm indices SU25 and TR20 ranged from 0.2 to 1 and accounted for 62.31% and 45.46% of Loess Plateau, respectively. This finding is indirectly supported by analyzing the Pearson correlation coefficients of NDVI with DTR. The percentages of the Pearson correlation coefficients of NDVI with WSDI and GSL ranged from 0.2 to 1 and accounted for 47.58% and 52.17% of the variation in the Loess Plateau, respectively. Statistical results reveal that the Pearson correlation coefficients between NDVI and TXn, TNn, TXx, TNx, TMAXmean, TMINmean, RX1day, and RX5day are very high, with values ranging from 0.4–1 and accounting for 95% of Loess Plateau; by contrast, the percentages of Pearson correlation coefficients between NDVI and DTR ranged from −1 to 0.2 and accounted for 34.78% of Loess Plateau.

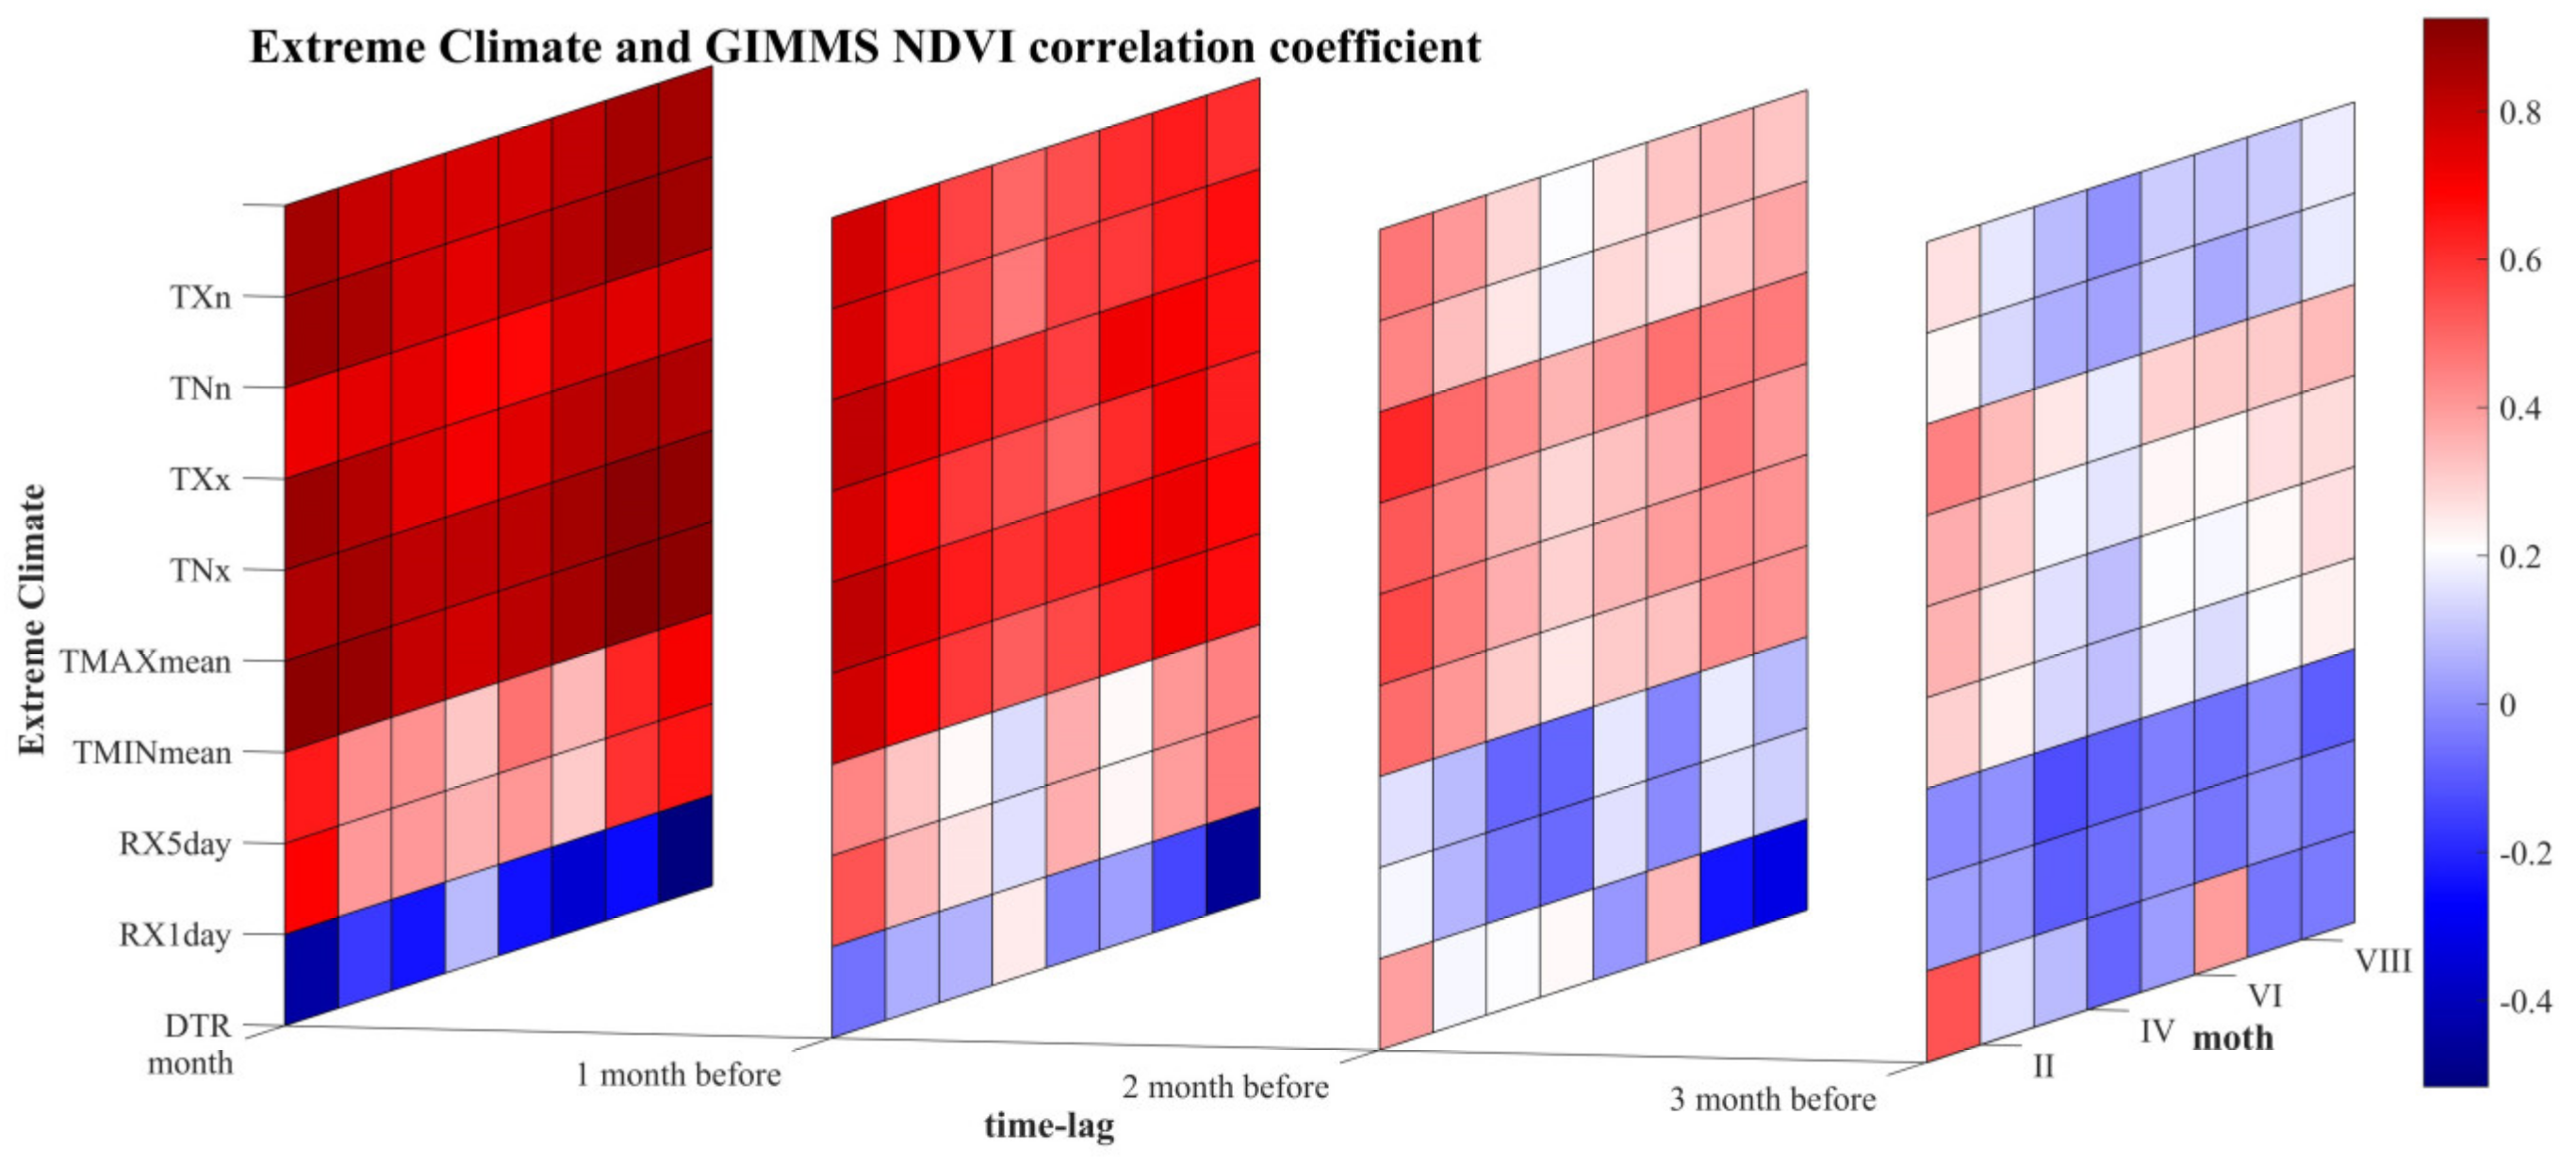
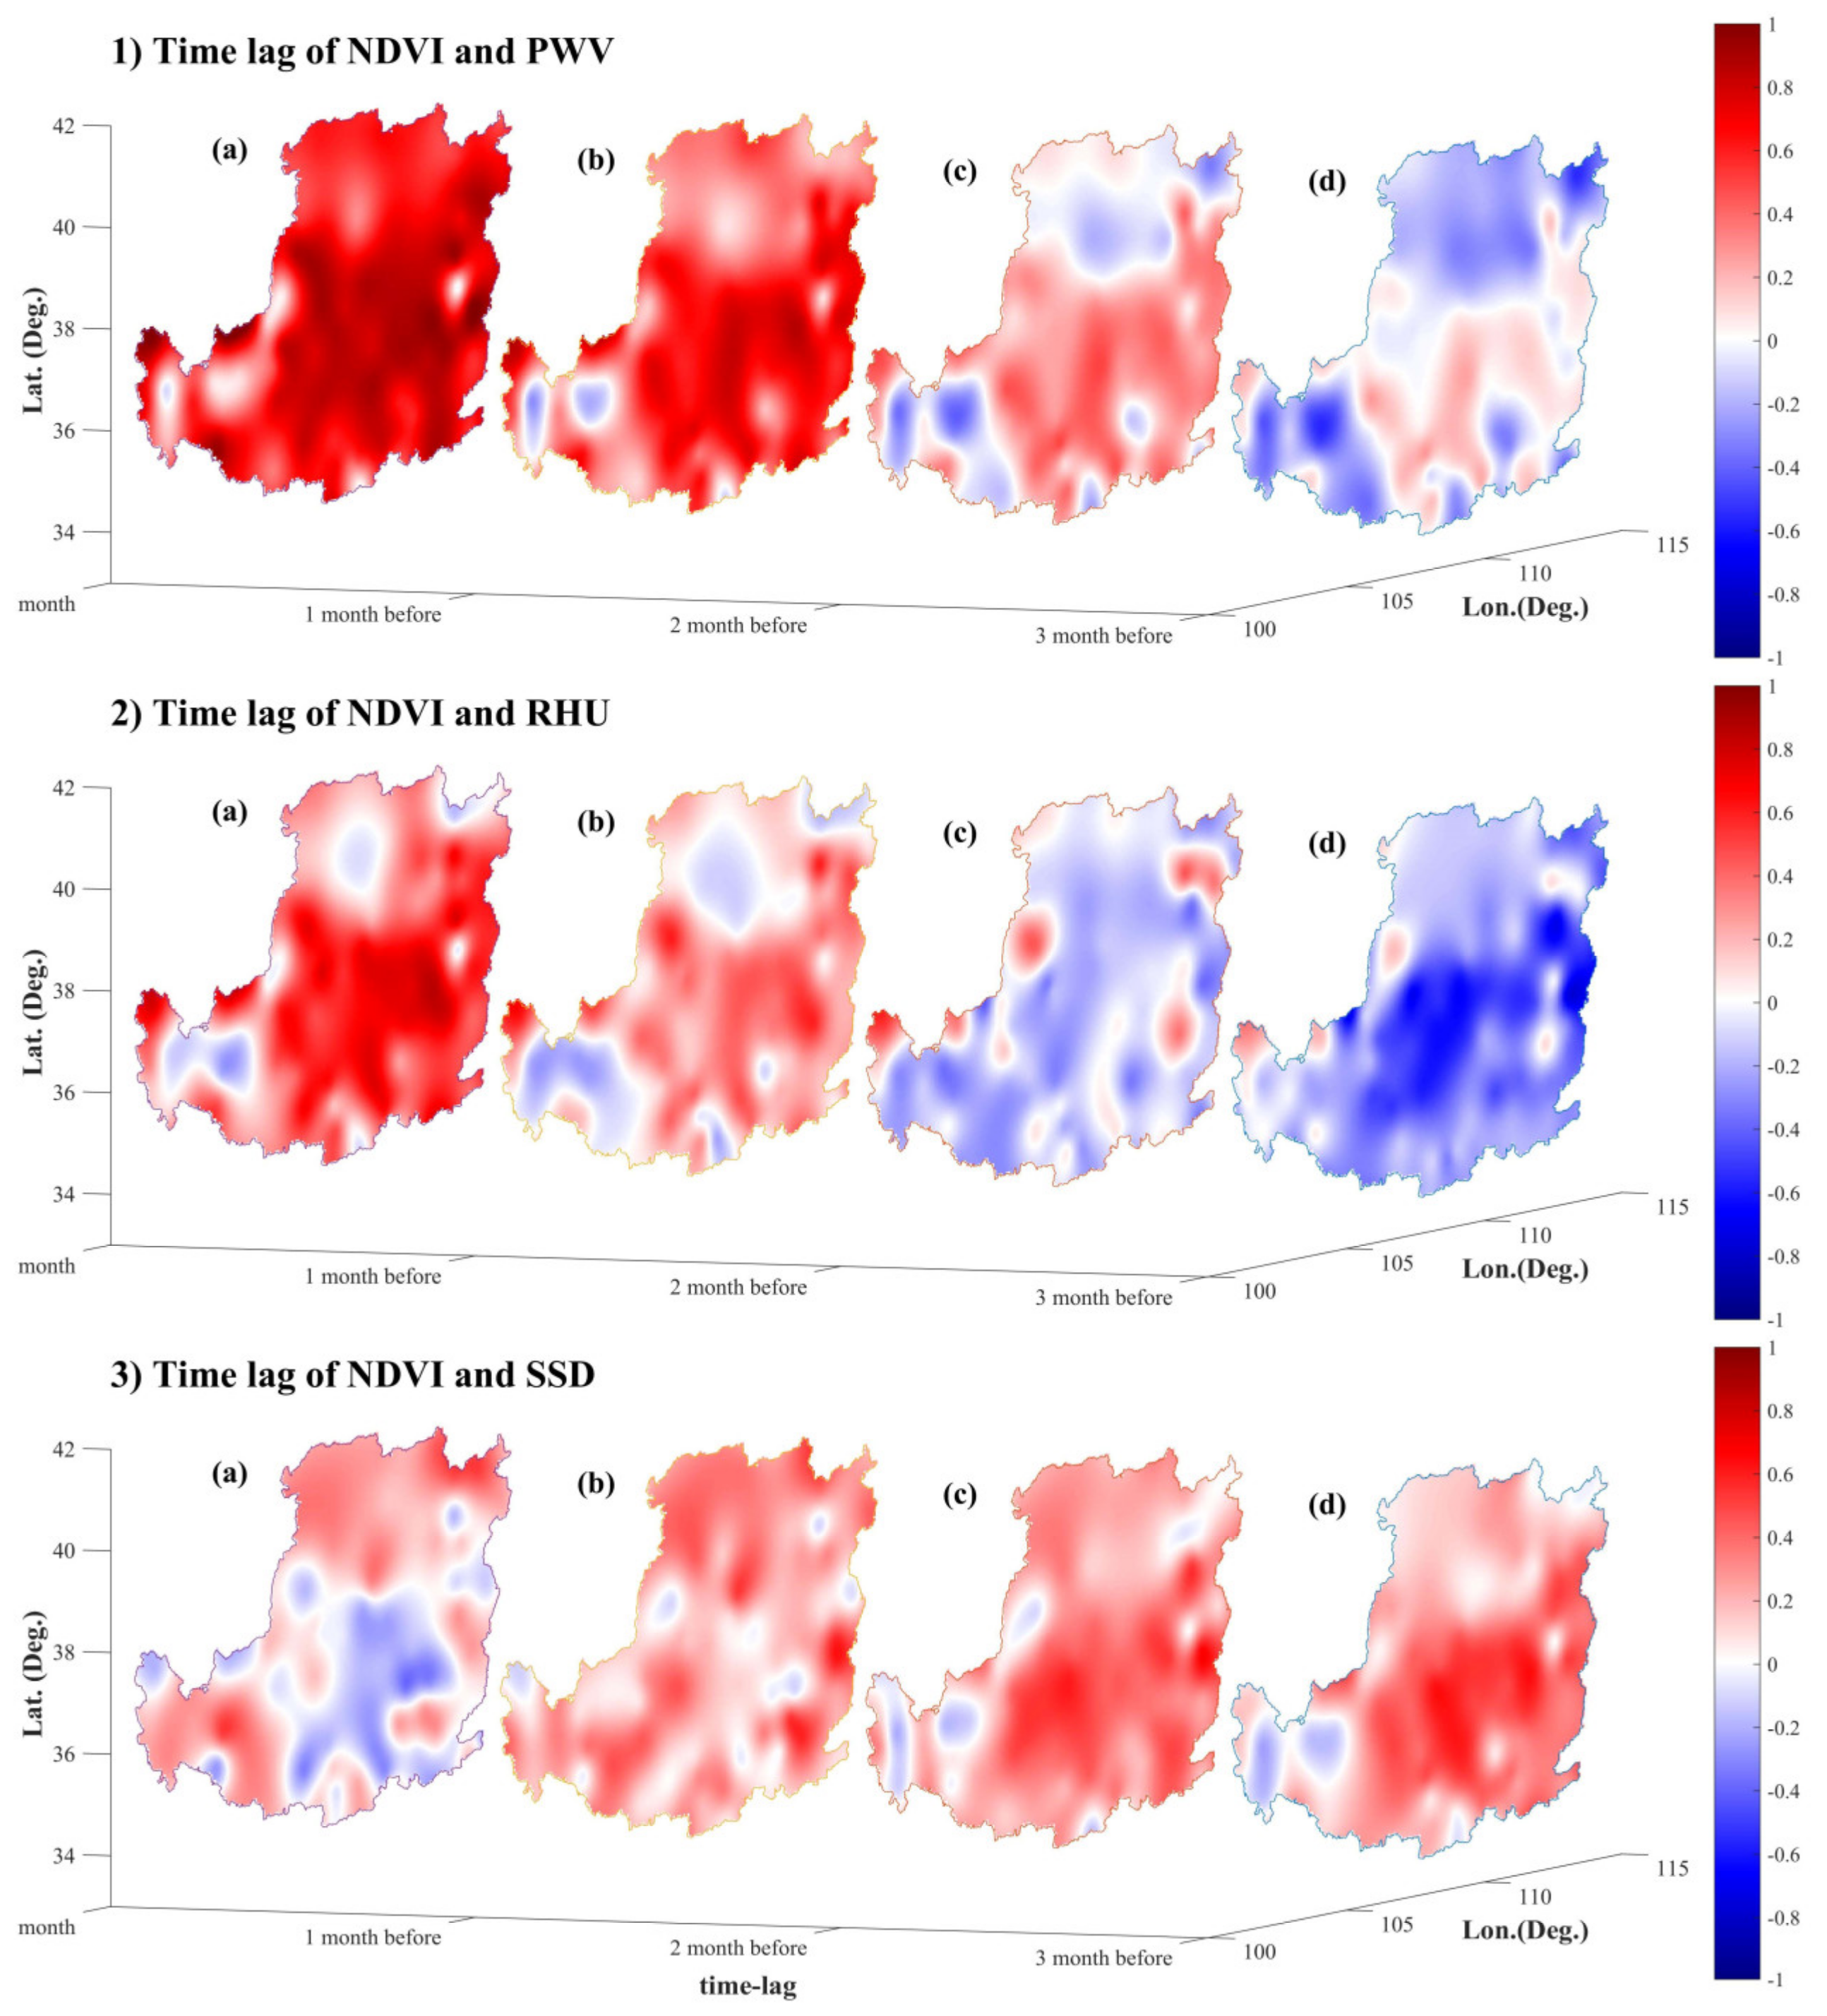
3.5. Time Lag Effect

The Pearson correlation coefficients between the extreme climatic indices factors (TXn, TNn, TXx, TNx, TMAXmean, TMINmean, RX1day, RX5day, and DTR) and the corresponding NDVI in the current month and after 1−3 months are provided in Figure 16 for the growing season (April−October) in the Loess Plateau. While the effect of the time delay of some factors, such as TXn, TNn, TXx, TNx, TMAXmean, and TMINmean, on vegetation growth was 0 month, that of DTR showed various time lengths in different areas of Loess Plateau (Table 6). The time lengths of time lag effects of DTR on vegetation growth differed for various vegetation types in the Loess Plateau.
The distribution of time delay impacts on vegetation growth caused by meteorological factors in the Loess Plateau (PWV, RHU, and SSD) is presented in Figure 17. Among other factors, the correlation between PWV and NDVI was the highest when the time delay was 0, accounting for 98.55% of Loess Plateau. The time delay impacts on vegetation growth associated with RHU and SSD differed. Statistical results reveal that only 66.67% of Loess Plateau shows maximum Pearson correlation coefficients between NDVI and RHU when the time delay is 0. The time lag effect of SSD on vegetation growth was distributed from 0 to 3 months, and the response of vegetation to SSD in the northern part of the Loess Plateau was mainly two months, accounting for 30.43% of Loess Plateau. In the middle and south of Loess Plateau, the lag response was mainly 3 months, accounting for 34.78% of the total Loess Plateau area. SSD has no lag effect on 15.22% of the regional vegetation growth in the western region of the Loess Plateau and 19.57% of the vegetation growth in the northeast region.

4. Discussion

The period 1982–2015 was divided into two shorter sub-periods in this paper to highlight the variation features of various factors within each sub-period. For example, Figure 2 suggests that the major contribution to the vegetation growth in period S comes from period S2 and that implementation of the “returning farmland to the forest” policy effectively promoted vegetation growth and ecological construction in the Loess Plateau. In addition, reductions in vegetation in area I of Loess Plateau are mainly associated with some cities located in the northern portion of Loess Plateau (Figure 1), where urbanization is accelerated, and the construction land has increased. Therefore, changes in land use caused an obvious decrease in vegetation in this region over the past 34 years. In the southern portion of Loess Plateau in area I, a perennial open-pit coal mining has caused serious damage to the surface vegetation. Zhao et al. [17] showed that the average growth rate of vegetation in the whole Loess Plateau during the period of 1982–2013 is 0.025/10a. In this paper, the vegetation change rate of the Loess Plateau from 1982 to 2015 is 0.022/10a, which is similar to Zhao et al. [17]. In addition, the vegetation growth of the Loess Plateau in S2 period is far greater than that of S1 and the vegetation growth of the whole region of China is mainly related to human activities, such as the implementation of the policy of “returning farmland to forest”.
Several studies have been carried out to analyze extreme climate indices during the period of 1982–2013 [10,19]. Figure 7 shows that extreme temperature indices (TXx) increased rapidly during S and S1, and the values are larger in S1 period than that in S period, but TXx revealed a downward trend during S2. In addition, the order of vegeration increased rate in the Loess Plateau in three periods are S2>S>S1. Such a phenomenon may suggests that the increase in TXx is may hindered by improved vegetation conditions. Comparison of the correlations between extreme climatic indices and vegetation index during S, S1, and S2 showed that the decrease rate of extreme temperature cold indices and increase rate of extreme temperature warm indices slowed due to the continuous increase in vegetation cover in the Loess Plateau. We found that the slopes of TX10P, FD0, and CSDI are downward during S2 period but with a slowing rate; these values were lower than those from S and S1. By comparing the Figure 2c,f,j, we found that the vegetation cover in the Loess Plateau increased significantly during S2, and the decrease rate of cold index in the Loess Plateau during S2 period may be associated with the increase of vegetation. These findings also revealed that the upward slower trends of the warm indices of extreme temperature (such as TX90P, SU25, GSL, TMAXmean, and TMINmean) and the increase in vegetation coverage during S2 over the Loess Plateau. This finding may suggest that vegetation exerts a negative impact on extreme event occurrences, which is rarely reported.
Additionally, spatial–temporal analysis of PWV is presented in this paper, which has not been previously investigated, in contrast to precipitation, which has been widely analyzed in the Loess Plateau [32,41,42,43]. PWV revealed good consistency with the elevation distribution of Loess Plateau, agreeing with the results of Gui et al. [28] and Zhao et al. [44]. Our study suggests that the increase in temperature in the Loess Plateau over the past 34 years has caused the climate to become drier, as indicated by the reduced RHU observed.
Zhao et al. [17] showed good correlations between NDVI with extreme climate indices (P < 0.01), such as TXn, TNn, TXx, TNx, TMAXmean, TMINmean, RX1day, and RX5day, a similar conclusion is obtained in this paper. In addition, more extreme climate factors, and time-lag effects are discussed. Among the 9 indices of extreme climate factors, DTR has a lag effect on vegetation growth from 0 to 3 months, and the other 8 extreme climate indexes have an impact on NDVI in the same month. Analysis of the delay effect of meteorological factors and NDVI, it is found that SSD had 0-3 months of lag response to vegetation while the lag effect of PWV and RHU on vegetation is mainly 1 month in the Loess Plateau. The main reasons for this phenomenon may be the characteristics of topography and rapid growth of vegetation in this area; in addition, the level of urbanization may also be another important reason for the change of climate and meteorological factors. Changes in the growing season can affect the exchange and transfer of energy through the biosphere and atmosphere, as well as the global carbon and energy cycles [45]. Therefore, variations in GSL were investigated, and GSL was found to be extended over the past 34 years, which agrees with the conclusions of Liu et al. [4] and Piao et al. [45] that the GSL in Northern China is prolonged. The extreme climatic and meteorological factors change, and their responses to vegetation growth in the recent 33 years may be associated with the vegetation growth rapidly and topography in the Loess Plateau. The surface vegetation cover change and urbanization recent 33 years may be one of the important reasons for climate change in the Loess Plateau during the S2 period [46,47,48]. Additionally, only 53 and 68 meteorological stations in the Loess Plateau were used by Zhao et al. [17] and Sun et al. [19], whereas 83 meteorological stations were selected in this paper. More evenly distributed meteorological stations can better reflect the actual situation of the entire Loess Plateau. Hence, the results obtained in this paper may slightly differ from those of previous studies.

5. Conclusions

This paper analyzed the relationships of the spatial–temporal variation characteristics of multiple factors with NDVI in the Loess Plateau during S1, S2, and S. Some interesting results were obtained: (i) the growth rate of vegetation coverage increased in the Loess Plateau over the past 15 years due to reforestation, which is approximately 4.5 times higher than that from 1982 to 2000 and 29.5 times than that in the whole of China over the past 34 years; (ii) anthropogenic activities, such as accelerated urbanization and excessive mining easily caused vegetation degradation, especially in area I of Loess Plateau; (iii) The increase of vegetation in the Loess Plateau is associated with the change of extreme weather events and was embodied by a slowing of the decrease rate of extreme temperature cold indices as well as the slowing of increase rate of extreme temperature warm indices; (iv) the regional climate change shifted toward warm and dry over Loess Plateau; and (v) atmospheric water vapor or PWV was strongly correlated with NDVI over Loess Plateau, as confirmed by Pearson correlation coefficients reaching 0.94.
Although some novel findings were discovered in this paper, some results involve qualitative data, and quantitative results could not be obtained because of some limitations. For example, vegetation growth revealed an inhibitory effect on the change in extreme climatic indices, but the specific contribution rate of vegetation growth to the inhibitory effects of extreme climatic indices was not determined. In future research, such problems may be resolved by establishing the corresponding quantitative models.

Author Contributions

Q.Z.; X.M. participated in the design of this study, and they both performed the statistical analysis. Q.Z., L.L., and W.Y. carried out the study and collected important background information. Q.Z.; X.M. processed the corresponding data. All authors have read and agreed to the published version of the manuscript.

Funding

This research was supported by the National Natural Science Foundation of China (41904036).

Acknowledgments

We thank C.J. Tucker and J. Pinzon of NASA GSFC for making available to the GIMMS NDVI3g dataset. China Meteorological Administration (CMA) and ECMWF are also thanked for providing the corresponding meteorological and PWV data.

Conflicts of Interest

The authors declare no conflicts of interest.

References

  1. Stocker, T.; Plattner, G.K.; Dahe, Q. IPCC climate change 2013: The physical science basis—Findings and lessons learned. In Proceedings of the EGU General Assembly Conference, Vienna, Austria, 27 April–2 May 2014. [Google Scholar]
  2. Solomon, S. IPCC climate change: The physical science basis. Clim. Chang. Phys. Sci. Basis 2007, 9, 123–124. [Google Scholar] [CrossRef]
  3. Planton, S.; Déqué, M.; Chauvin, F.; Terray, L. Expected impacts of climate change on extreme climate events. Comptes Rendus Géosci. 2008, 340, 564–574. [Google Scholar] [CrossRef]
  4. Omondi, P.A.O.; Awange, J.L.; Forootan, E.; Ogallo, L.A.; Barakiza, R.; Girmaw, G.B.; Fesseha, I.; Kululetera, V.; Kilembe, C.; Mbati, M.M.; et al. Changes in temperature and precipitation extremes over the greater horn of Africa region from 1961 to 2010. Int. J. Climatol. 2014, 34, 1262–1277. [Google Scholar] [CrossRef]
  5. Pepler, A.; Coutts-Smith, A.; Timbal, B. The role of East Coast Lows on rainfall patterns and inter-annual variability across the East Coast of Australia. Int. J. Climatol. 2014, 34, 1011–1021. [Google Scholar] [CrossRef]
  6. Yilmaz, A.G. The effects of climate change on historical and future extreme rainfall in Antalya, Turkey. Hydrol. Sci. J. 2015, 60, 2148–2162. [Google Scholar] [CrossRef] [Green Version]
  7. Teufel, B.; Diro, G.T.; Whan, K.; Milrad, S.M.; Jeong, D.I.; Ganji, A.; Huziy, O.; Winger, K.; Gyakum, J.R.; de Elia, R.; et al. Investigation of the 2013 Alberta flood from weather and climate perspectives. Clim. Dyn. 2017, 48, 2881–2899. [Google Scholar] [CrossRef] [Green Version]
  8. Deng, H.; Chen, Y.; Shi, X.; Li, W.; Wang, H.; Zhang, S.; Fang, G. Dynamics of temperature and precipitation extremes and their spatial variation in the arid region of northwest China. Atmos. Res. 2014, 138, 346–355. [Google Scholar] [CrossRef]
  9. Rao, B.B.; Chowdary, P.S.; Sandeep, V.M.; Rao, V.U.M.; Venkateswarlu, B. Rising minimum temperature trends over India in recent decades: Implications for agricultural production. Glob. Planet. Chang. 2014, 117, 1–8. [Google Scholar]
  10. Xiao, X.; Boles, S.; Liu, J.; Zhuang, D.; Liu, M. Characterization of forest types in Northeastern China, using multi-temporal SPOT-4 VEGETATION sensor data. Remote Sens. Environ. 2002, 82, 335–348. [Google Scholar] [CrossRef]
  11. Pettorelli, N.; Vik, J.O.; Mysterud, A.; Gaillard, J.M.; Tucker, C.J.; Stenseth, N.C. Using the satellite-derived NDVI to assess ecological responses to environmental change. Trends Ecol. Evol. 2005, 20, 503–510. [Google Scholar] [CrossRef]
  12. Zhou, G.; Zhang, X. Study on Chinese climate-vegetation relationship. Acta Phytoecol. Sin. 1996, 20, 113–119. [Google Scholar]
  13. Gornall, J.; Betts, R.; Burke, E.; Clark, R.; Camp, J.; Willett, K.; Wiltshire, A. Implications of climate change for agricultural productivity in the early twenty-first century. Philos. Trans. R. Soc. Lond. 2010, 365, 2973–2989. [Google Scholar] [CrossRef] [PubMed]
  14. Bokhorst, S.; Tømmervik, H.; Callaghan, T.V.; Phoenix, G.K.; Bjerke, J.W. Vegetation recovery following extreme winter warming events in the sub-Arctic estimated using NDVI from remote sensing and handheld passive proximal sensors. Environ. Exp. Bot. 2012, 81, 18–25. [Google Scholar] [CrossRef]
  15. Sun, J.; Cheng, G.; Li, W.; Sha, Y.; Yang, Y. On the variation of NDVI with the principal climatic elements in the Tibetan Plateau. Remote Sens. 2013, 5, 1894–1911. [Google Scholar] [CrossRef] [Green Version]
  16. Hu, Z.; Li, Q.; Chen, X.; Teng, Z.; Chen, C.; Yin, G.; Zhang, Y. Climate changes in temperature and precipitation extremes in an alpine grassland of Central Asia. Theor. Appl. Climatol. 2015, 126, 519–531. [Google Scholar] [CrossRef]
  17. Zhao, A.; Zhang, A.; Liu, X.; Cao, S. Spatiotemporal changes of normalized difference vegetation index (NDVI) and response to climate extremes and ecological restoration in the Loess Plateau, China. Theor. Appl. Climatol. 2018, 132, 555–567. [Google Scholar] [CrossRef]
  18. Guo, W.Q.; Yang, T.B.; Dai, J.G.; Shi, L.; Lu, Z.Y. Vegetation cover changes and their relationship to climate variation in the source region of the Yellow River, China, 1990–2000. Int. J. Remote Sens. 2008, 29, 2085–2103. [Google Scholar] [CrossRef]
  19. Sun, W.; Mu, X.; Song, X.; Wu, D.; Cheng, A.; Qiu, B. Changes in extreme temperature and precipitation events in the Loess Plateau (China) during 1960–2013 under global warming. Atmos. Res. 2016, 168, 33–48. [Google Scholar] [CrossRef]
  20. Liu, W.; Zhang, M.; Wang, S.; Wang, B.; Li, F.; Che, Y. Changes in precipitation extremes over Shaanxi Province, northwestern China, during 1960–2011. Quat. Int. 2013, 313-314, 118–129. [Google Scholar] [CrossRef]
  21. Rangwala, I.; Miller, J.R.; Ming, X. Warming in the Tibetan Plateau: Possible influences of the changes in surface water vapor. Geophys. Res. Lett. 2009, 36, 295–311. [Google Scholar] [CrossRef] [Green Version]
  22. Immerzeel, W.W.; Van Beek, L.P.; Bierkens, M.F. Climate change will affect the Asian water towers. Science 2010, 328, 1382–1385. [Google Scholar] [CrossRef] [PubMed]
  23. Yang, K.; Ye, B.; Zhou, D.; Wu, B.; Foken, T.; Qin, J.; Zhou, Z. Response of hydrological cycle to recent climate changes in the Tibetan Plateau. Clim. Chang. 2011, 109, 517–534. [Google Scholar] [CrossRef]
  24. Yao, Y.; Shan, L.; Zhao, Q. Establishing a method of short-term rainfall forecasting based on GNSS-derived PWV and its application. Sci. Rep. 2017, 8, 12465. [Google Scholar] [CrossRef] [PubMed]
  25. Xu, X.; Lu, C.; Shi, X.; Gao, S. World water tower: An atmospheric perspective. Geophys. Res. Lett. 2008, 35, 525–530. [Google Scholar] [CrossRef]
  26. Manandhar, S.; Dev, S.; Lee, Y.H.; Meng, Y.S.; Winkler, S. A Data-driven approach to detecting precipitation from meteorological sensor data. In Proceedings of the IEEE International Geoscience and Remote Sensing Symposium (IGARSS), Valencia, Spain, 22–27 July 2018; pp. 3872–3875. [Google Scholar]
  27. Wang, F.; Mu, X.; Li, R.; Fleskens, L.; Stringer, L.C.; Ritsema, C.J. Co-evolution of soil and water conservation policy and human-environment linkages in the Yellow River Basin since 1949. Sci. Total. Environ. 2015, 508, 166–177. [Google Scholar] [CrossRef] [PubMed] [Green Version]
  28. Gui, K.; Che, H.Z.; Chen, Q.L.; Zeng, Z.L.; Liu, H.Z.; Wang, Y.Q.; Zheng, Y.; Sun, T.Z.; Liao, T.T.; Wang, H.; et al. Evaluation of radiosonde, MODIS-NIR-Clear, and AERONET precipitable water vapor using IGS ground-based GPS measurements over China. Atmos. Res. 2017, 197, 461–473. [Google Scholar] [CrossRef]
  29. Palmer, T.N.; Barkmeijer, J.; Buizza, R.; Petroliagis, T. The ECMWF ensemble prediction system. Meteorol. Appl. 2010, 4, 301–304. [Google Scholar] [CrossRef] [Green Version]
  30. Tucker, C.J.; Newcomb, W.W.; Dregne, H.E. AVHRR data sets for determination of desert spatial extent. Int. J. Remote Sens. 1994, 15, 3547–3565. [Google Scholar] [CrossRef]
  31. Wei, F.Y. Modern Climatic Statistical Diagnosis and Prediction Technology; China Meteorological Press: Beijing, China, 2007; Volume 63, p. 117. [Google Scholar]
  32. Guo, R.; Li, F.; He, W.; Yang, S.; Sun, G. Spatial and temporal variability of annual precipitation during 1958–2007 in Loess Plateau, China. In Proceedings of the Computer and Computing Technologies in Agriculture IV—IFIP Tc 12 Conference, Ccta 2010 Selected Papers, Nanchang, China, 22–25 October 2010; pp. 551–560. [Google Scholar]
  33. Lee, J.J.; Kim, C.H. Roles of surface wind, NDVI and snow cover in the recent changes in Asian dust storm occurrence frequency. Atmos. Environ. 2012, 59, 366–375. [Google Scholar] [CrossRef]
  34. Gong, T.T.; Lei, H.M.; Yang, D.W.; Jiao, Y.; Yang, H.B. Effects of vegetation change on evapotranspiration in a semiarid shrubland of the Loess Plateau, China. Hydrol. Earth Syst. Sci. Discuss. 2014, 11, 13571–13605. [Google Scholar] [CrossRef] [Green Version]
  35. Liu, Y.; Liu, X.; Li, S.; Peng, J.; Wang, Y. Analyzing nonlinear variations in terrestrial vegetation in China during 1982–2012. Environ. Monit. Assess. 2015, 187, 722. [Google Scholar] [CrossRef] [PubMed]
  36. Nicholson, S.E.; Davenport, M.L.; Malo, A.R. A comparison of the vegetation response to rainfall in the Sahel and East Africa, using normalized difference vegetation index from NOAA AVHRR. Clim. Chang. 1990, 17, 209–241. [Google Scholar] [CrossRef]
  37. Li, Z.; Yan, F.; Fan, X. The variability of NDVI over northwest China and its relation to temperature and precipitation. J. Remote Sens. 2005, 4, 2275–2277. [Google Scholar]
  38. Camberlin, P.; Martiny, N.; Philippon, N.; Richard, Y. Determinants of the interannual relationships between remote sensed photosynthetic activity and rainfall in tropical Africa. Remote Sens. Environ. 2008, 106, 199–216. [Google Scholar] [CrossRef] [Green Version]
  39. Herrmann, S.M.; Anyamba, A.; Tucker, C.J. Recent trends in vegetation dynamics in the African Sahel and their relationship to climate. Glob. Environ. Chang. 2017, 15, 394–404. [Google Scholar] [CrossRef]
  40. Li, R.; Zhao, L.; Ding, Y.G.; Wang, S.; Ji, G.L.; Xiao, Y.; Liu, G.G.; Sun, L.C. Monthly ratios of PAR to global solar radiation measured at northern Tibetan Plateau, China. Solar Energy 2010, 84, 964–973. [Google Scholar] [CrossRef]
  41. Liu, B.; Henderson, M.; Zhang, Y.; Xu, M. Spatiotemporal change in China’s climatic growing season: 1955–2000. Clim. Chang. 2010, 99, 93–118. [Google Scholar] [CrossRef]
  42. Tang, X.; Miao, C.; Xi, Y.; Duan, Q.; Lei, X.; Li, H. Analysis of precipitation characteristics on the loess plateau between 1965 and 2014, based on high-density gauge observations. Atmos. Res. 2018, 213, 264–274. [Google Scholar] [CrossRef]
  43. Bei, X.; Buli, C.; Dongsheng, L.I.; Xueli, C. Temporal and spatial variations of precipitation in different climatic regions of the Loess Plateau. Sci. Soil Water Conserv. 2017. [Google Scholar] [CrossRef]
  44. Zhao, Q.; Yao, Y.; Yao, W. Studies of precipitable water vapour characteristics on a global scale. Int. J. Remote Sens. 2019, 40, 72–88. [Google Scholar] [CrossRef]
  45. Piao, S.; Friedlingstein, P.; Ciais, P.; Viovy, N.; Demarty, J. Growing season extension and its impact on terrestrial carbon cycle in the Northern Hemisphere over the past 2 decades. Glob. Biogeochem. Cycles 2007, 21. [Google Scholar] [CrossRef]
  46. Zhao, M.; Pitman, A.J. The impact of land cover change and increasing carbon dioxide on the extreme and frequency of maximum temperature and convective precipitation. Geophys. Res. Lett. 2002, 29, 2-1–2-4. [Google Scholar] [CrossRef]
  47. Suh, M.S.; Lee, D.K. Impacts of land use/cover changes on surface climate over east Asia for extreme climate cases using RegCM2. J. Geophys. Res. Atmos. 2004, 109. [Google Scholar] [CrossRef] [Green Version]
  48. YIN, S.Y.; HUANG, C.C.; QIU, L.H.; JIA, Y.F. Study on the Historical Drought and Flood Disasters in the Guanzhong Plain and the Urban Development. Arid Zone Res. 2007, 24, 77–82. [Google Scholar]
Figure 1. Geographical zoning (Cf. Table 1) map of the Loess Plateau and the distribution of meteorological stations.
Applsci 10 01000 g001
Figure 2. The (ac) are average values, (df) are linear trends (unit: year-1), and (hj) ars F-tests of the GIMMS NDVI for three periods, where S, S1, and S2 represent the periods of 1982–2015, 1982–1999, and 2000–2015, respectively.
Applsci 10 01000 g002
Figure 3. Annual average time series (a) and the spatial distribution of the average precipitable water vapour of multiple years (1982–2015) over the Loess Plateau region (b).
Applsci 10 01000 g003
Figure 4. Elevation distribution of the Loess Plateau region.
Applsci 10 01000 g004
Figure 5. Time series of the average RHU (a) and spatial distribution over the Loess Plateau region (b).
Applsci 10 01000 g005
Figure 6. Time series of the average SSD (a) and spatial distribution over the Loess Plateau region (b).
Applsci 10 01000 g006
Figure 7. Trend change and abrupt trend analyses of the Loess Plateau region, (a) refers to the trend of TXx during S, S1 and S2 periods, respectively, while (b) is the Mann–Kendall trend analysis and confidence level test of TXx during S period, UF and UB refer to the forward and backward statistics of standardized variables, respectively.
Applsci 10 01000 g007
Figure 8. Variation trend of extreme climatic indices during S, S1, and S2 over the Loess Plateau region. The red values represent the average during the corresponding periods (1982–2015), and the blue columns refer to the first derivatives.
Applsci 10 01000 g008
Figure 9. Correlations of NDVI with (a) PWV, (b) RHU, and (c) SSD.
Applsci 10 01000 g009
Figure 10. Pearson correlation coefficients of PWV with extreme climatic indices in the Loess Plateau region, the extreme climatic indices are (a) TMAXmean, (b) TMINmean, (C) TNn, (d) TXx. (e)TNx, (f) TXn. (g)FD0, (h) SU25. (i)WSDI, (j) CSDI and (k) GSL.
Applsci 10 01000 g010
Figure 11. Statistical results of the Pearson correlation coefficients of PWV with extreme temperature indices, where TMAXm and TMINm represent TMAXmean and TMINmean, respectively.
Applsci 10 01000 g011
Figure 12. Statistical results of the Pearson correlation coefficients of RHU with extreme climatic indices in the Loess Plateau region, where TMAXm and TMINm represent the TMAXmean and TMINmean, respectively.
Applsci 10 01000 g012
Figure 13. Statistical results of the Pearson correlation coefficients of SSD with extreme climatic indices in the Loess Plateau region, where TMAXm and TMINm represent TMAXmean and TMINmean, respectively.
Applsci 10 01000 g013
Figure 14. Distribution of Pearson correlation coefficients of NDVI with extreme climatic indices in the Loess Plateau region, the extreme climatic indices are (a) FD0, (b) ID0, (c) SU25, (d) TR20. (e) WSDI, (f) CSDI. (g) GSL.
Applsci 10 01000 g014
Figure 15. Percentages of Pearson correlation coefficients of NDVI with extreme climate indices over the Loess Plateau region.
Applsci 10 01000 g015
Figure 16. Time delay effects of extreme climate factors on NDVI over the Loess Plateau region.
Applsci 10 01000 g016
Figure 17. Spatial distribution of time delay impacts on vegetation growth associated with PWV, RHU, and SSD, where (a)–(d) refer to 0 month, 1 month before, 2 monthe before and 3 month before, respectively in the thee subfigures.
Applsci 10 01000 g017
Table 1. Loess Plateau subdivisions.
No.Geographical Area.No.Geographical Area.
River Impact PlainLoess Hills in the Intermountain Basin
Loess TablelandWind Dunes
Loessian Rolling HillsStone Mountain
Loess Beam HillsThe Sandy Loess Hills
Loess Wide ValleyRocky Hills
Table 2. Definition and classification of extreme climatic indices from the RClimDex model.
CategoryIndex NameDefinitionIndex CodeUnit
Extreme precipitation indexPrecipitation indexMaximum 1-d PrecipitationHighest precipitation amount in 1-d periodRX1daymm
Maximum 5-d PrecipitationHighest precipitation amount in the 5-d periodRX5daymm
Strong rainfallPrecipitation due to very wet days
(> 95th percentile)
R95pmm
Super strong rainfallPrecipitation due to extremely wet days (> 99th percentile)R99pmm
Simple daily intensity indexMean precipitation amount on a wet daySDIImm*d−1
Total precipitation in wet days (>1 mm)PRCPTOTmm
Precipitation day
index
Consecutive dry daysMaximum length of dry spell (RR < 1 mm)CDDd
Consecutive wet daysMaximum length of wet spell (RR ≥ 1 mm)CWDd
Heavy precipitation daysCount of days where RR (daily precipitation amount) ≥ 10mmR10d
Very heavy precipitation daysCount of days where RR ≥ 20mmR20d
Count of days where RR ≥ 25mm threshold in mmR25d
Extreme temperature indexRelative
index
Cold nightsCount of days where TN < 10th percentileTX10P%
Cold day-timesCount of days where TX < 10th percentileTN10P%
Warm nightsCount of days where TN > 90th percentileTX90P%
Warm day-timesCount of days where TX > 90th percentileTN90P *%
Adiabatic
index
Frost daysCount of days where TN (daily minimum temperature) < 0 °CFD0d
Icing daysCount of days where TX < 0 °CID0d
Summer daysCount of days where TX (daily maximum temperature) > 25 °CSU25d
Tropical nightsCount of days where TN > 20 °CTR20d
Extreme Value
Index
Monthly maximum value of daily maximum temperatureTXx°C
Monthly maximum value of daily minimum temperatureTNx°C
Monthly minimum value of daily maximum temperatureTXn°C
Monthly minimum value of daily minimum temperatureTNn°C
Other indicatorsWarm spell duration indexCount of days in a span of least six days where TX > 90th percentileWSDI *%
Cold spell duration indexCount of days in a span of at least six days where TN > 10th percentileCSDId
Growing season lengthAnnual count of days between first span of at least six days where TG (daily mean temperature) > 5 °C and first span in second half of the year of at least six days where TG < 5 °CGSLd
Diurnal temperature rangeMean difference between TX and TN (°C)DTR°C
* TX and TN refer to the maximum and minimum temperature, respectively.
Table 3. Range of Pearson correlation coefficients and correlation degrees.
Range−1~−0.4−0.4~−0.2−0.2~0.20.2~0.40.4~1
Correlation degreeStrong negative correlationModerate
negative correlation
Weak correlationModerate
positive
correlation
Strong positive
correlation
Table 4. The proportion of pixels that showed increases and decreases in vegetation growth for S, S1, and S2, for each significance level according to the F-test (Unit: %).
PeriodIncreaseDecrease
SS1S2SS1S2
Significance Level
P < 0.0172.2312.2856.761.960.140.90
0.01 < P < 0.056.389.6413.681.050.530.72
0.05 < P < 0.12.676.7816.660.750.750.44
0.1 < P9.4250.55.425.5419.630.44
Table 5. Statistical results of abrupt trend analysis of extreme climate indices.
IDmeanMax-YearMaxMin-YearMinRate (/10a)Jump Year
FD0139.81986151.752015125.680.591996
ID032.00198450.91201522.17−2.11990
TX90p11.97200221.2919835.13119.72002
TX10p11.92198420.0120167.32119.21984
TXx34.36201036.37198932.560.481995
TNx21.67201023.65199320.250.551995
TXn7.91198410.9420155.21−0.8——
TNn19.02199122.15201512.73−0.25——
GSL236.82016250.701986220.905.822000
DTR12.49201414.4020089.85−0.11——
TMAXmean15.82201317.09198414.180.461994
TMINmean3.5820164.6419842.290.521996
RX1day48.09201662.71201538.741.2——
RX5day75.71201390.48198658.081.3——
R95p112.32003147.43201566.592.1——
R99p35.81201670.47201515.552.7——
R1074.361999126.27198050.20−0.98——
R204.7519856.2220123.75−0.32——
R2513.65200318.4619869.640.89——
Table 6. Time delay effects of DTR with different time lengths on vegetation growth in various subregions of the Loess Plateau region.
SubregionIIIIIIIVVVIVIIVIII
Time delay/(month)32010300

